- 1Department of Biological and Agricultural Engineering, University of California, Davis, Davis, CA, United States
- 2Department of Horticulture and Product Physiology, Plant Science Group, Wageningen University and Research, Wageningen, Netherlands
- 3Next-Generation Horticultural Systems, Leibniz-Institute of Vegetable and Ornamental Crops (IGZ), Grossbeeren, Germany
- 4Department of Plant Sciences, University of California, Davis, Davis, CA, United States
- 5Dean of Life Sciences, University College of London, London, United Kingdom
- 6Department of Agriculture, Veterinary and Rangeland Sciences, College of Agriculture, Biotechnology and Natural Resources, University of Nevada, Reno, NV, United States
Advanced indoor farming systems utilizing artificial lighting to produce high-quality crops are rapidly gaining research interest. Specific light spectra from artificial lights can create optimal conditions for indoor plant cultivation. Cilantro, an herb widely used in the culinary industry for its distinct fresh flavor and high nutritional content, has been the subject of numerous studies examining the effects of different ratios of blue (B, 400–500 nm) and red (R, 600–700 nm) light on its growth. However, the impact of adding far-red (FR, 700–780 nm) light has not been fully explored. This study aimed to determine the optimal light spectral combinations for enhancing the morphology, yield, phytochemical content, and shelf life of indoor-grown cilantro. Three light spectral treatments [R:B:FR = 4:1:0 (R4B1), R:B:FR = 4:0.5:0.5 (R4B0.5FR0.5), and R:B:FR = 3:1:1 (R3B1FR1)] were evaluated at a consistent Photon Flux Density of 160 ± 10 μmol m−2 s−1 using broad-spectrum LED lamps. The growth chamber conditions during light treatments were maintained at an average temperature of 23°C, relative humidity of 49%, and CO2 concentration of 575 ppm, with a 16/8 h (light/dark) photoperiod. Growth, yield, and various quality parameters of cilantro were measured. Results indicated that the R3B1FR1 and R4B0.5FR0.5 treatments increased plant height, leaf area, and yield by 88 and 29%, respectively, compared to the R4B1 treatment. Conversely, R4B1 positively influenced quality parameters and shelf life. The study concluded that R3B1FR1 had a more substantial positive effect on cilantro yield than R4B0.5FR0.5 and R4B1, although the light treatments statistically unaffected quality parameters and shelf-life.
1 Introduction
Cilantro (Coriandrum sativum L.), known as coriander in Asia and Europe, and cilantro in the United States, is an annual plant in the Apiaceae family (Mahendra and Bisht, 2011). This crop is primarily grown in Bangladesh, China, Central Europe, India, Mexico, Morocco, and Russia (Bhuiyan et al., 2009). The rising demand to produce this crop is due to its unique fresh flavor, high nutritional value, and functional benefits (Nguyen et al., 2020). Cilantro leaves are rich in dietary fiber, vitamin C, carotenoids, and other nutritional compounds (Bhat et al., 2014). The commonly identified phytochemicals that characterize cilantro leaves include β-carotene, flavonoids, and phenolic compounds (Divya et al., 2014; El-Zaeddi et al., 2017). Cilantro holds economic significance due to its utilization as a flavoring agent in food products and as an ingredient in perfumes and cosmetics (Emamghoreishi et al., 2005).
Growing the crops in optimal conditions (temperature, humidity, CO2, and light) increases the yield and enhances levels of biologically active compounds, potentially boosting their health-promoting qualities. The rise in population, resource constraints, and climate change have driven the adoption of advanced controlled environment agricultural (CEA) systems, such as greenhouses and indoor vertical farms. In indoor vertical farming systems, the grower can tune the lighting and other environmental parameters (temperature, humidity, CO2 concentration) to optimize production with minimum use of resources (energy, water, and nutrients). Supplemental lighting and other environmental parameters make it possible to produce plants that meet precise criteria for optimal growth and accumulation of phytochemical nutrients (Kozai and Niu, 2020).
Light is a critical environmental factor influencing numerous plant physiological processes and photomorphogenesis (De Wit et al., 2016; D’Souza et al., 2015). Light spectrum, intensity, and photoperiod are three important characteristics of light. The light spectrum has a vital role in influencing various aspects of plants, including growth, development, the accumulation of secondary metabolites (Cammarisano et al., 2021), and energy use efficiency. Extensive research on optimizing the light spectrum (mainly the blue, green, red, and far-red wavebands) for specific crops, especially lettuce, tomato, cucumber, etc., is being performed in industry and academia. Spectral wavelengths in the red (R, 600–700 nm) and blue (B, 400–500 nm) regions of the electromagnetic spectrum are effective in promoting plant growth and, therefore, are emphasized by many researchers (Lin et al., 2013; Terashima et al., 2009; Wang et al., 2001). Blue light is absorbed chiefly through cryptochromes and phototropin, affecting plant phototropism, photomorphogenesis, stomatal opening, and biochemistry (Tarakanov et al., 2022; Bhatla and Lal, 2023). Phytochromes mostly absorb red light, and it is essential for balanced photomorphogenesis and efficient photosynthesis in plants (Urbonavičiūtė et al., 2007). Far-red (FR, 700–780 nm) light increases the chemical defense systems of plants against biotic and abiotic stressors, plays a crucial role in plant morphology, and increases overall net CO2 assimilation (Ballaré, 2014; Park and Runkle, 2017). FR is a regulator for phytochrome photoreceptors, crucial in affecting plant morphological development and, consequently, plant growth (Demotes-Mainard et al., 2016; Legris et al., 2019; Tan et al., 2022). Phytochromes can be found in two convertible forms, Pr and Pfr, which switch when R or FR light is absorbed (Demotes-Mainard et al., 2016). The R:FR ratio regulates the equilibrium between Pfr and Pr, which establishes the phytochrome photo stationary state (PSS) (Pierik and De Wit, 2014). Plants gage changes in photoperiod, seasons, and neighboring conditions by monitoring alterations in PSS values (Holmes and Smith, 1975; Jung et al., 2016).
Different light spectral combinations have different effects on crop growth and quality. In CEA, light recipes can be tailor-made for each crop and cultivar. In lettuce, it was demonstrated that the actions of the different light spectra can be combined. Adding FR increased growth and carbohydrates while increasing blue light fraction enhanced the nutritional value of lettuce, including pigments, phenolic compounds, and minerals (Van Brenk et al., 2024). A study on the effects of light spectrum on cilantro, conducted by Naznin et al. (2016), showed that the R-to-B light ratio of 10:1 resulted in a substantial accumulation of fresh and dry mass. It is noteworthy to mention that when it came to antioxidant properties accumulation, the use of monochromatic R light led to significantly decreased antioxidant contents. The study suggested that an improved selection of R-to-B ratios can produce antioxidant-rich vegetables. Nguyen et al. (2020) observed that compared to monochromatic B, R, and G light, mixed R:B (87:13) and R:B:FR (81.5:12.5:6) light was the most beneficial in stimulating the growth and the levels of minerals and bioactive chemicals in cilantro. The results showed that cilantro plants exhibited a significant increase in biomass, chlorophyll index, and ascorbic acid content when exposed to R:B or R:B:FR light treatments, compared to monochromatic light treatments. The combination of spectrum treatments within PAR is more effective than monochromatic light in plant quality and growth enhancement. Also, in the case of lettuce grown in a hydroponic system under mixed-spectrum light, specifically, fluorescent light combined with red (FLR) or blue (FLB) LEDs, showed improved growth, biomass, and pigment content compared to monochromatic red or blue LEDs, making FLR and FLB more effective for cultivation (Chen et al., 2014).
The optimum ratio of R and B light for cilantro cultivation has been investigated previously (Naznin et al., 2016; Gao et al., 2022). There is a research gap in investigating the optimal ratio of FR, R, and B light and its impact on the morphology, yield, phytochemical quality, and shelf life of cilantro. Therefore, this study aimed to determine the optimal light spectral combination of R, B, and FR to enhance these characteristics. It hypothesized that adding FR light would significantly improve cilantro morphology, productivity, and quality. Three different light spectral combinations (R4B1, R:B = 4:1; R3B1FR1, R:B:FR = 3:1:1; and R4B0.5FR0.5, R:B:FR = 4:0.5:0.5) with a uniform amount of photon flux density 160 ± 10 μmol m−2 s−1 have been investigated in an indoor vertical farming system.
2 Materials and methods
2.1 Plant material and growth conditions
2.1.1 Growth conditions during germination and seedling stage
This experiment was conducted in the indoor vertical farming unit at the Controlled Environment Engineering Lab, Department of Biological and Agricultural Engineering, University of California, Davis, from September to November 2023. The cilantro (Coriandrum sativum cv. Santo) seeds were procured from Johnny’s selected seeds in the United States. Before sowing, the seeds were soaked in tap water for approximately 4 h. Subsequently, four seeds were placed in each rock wool cube (2.54 × 2.54 × 3.81 cm) and kept in a climate-controlled dark chamber for 2 days (around 21°C). After germination, the seeds were transferred, along with the rock wool growing medium (Grodan rockwool, Roermond, the Netherlands), to the Nutraponics system [a commercial hydroponic unit with Nutrient Flow Technique (NFT)] for 2 weeks (Figure 1A). The average temperature was 24.00 ± 0.01°C, with a photoperiod of 16/8 h (day/night). The light was provided by fluorescent lamps placed 20 cm away from the cultivation surface. Light intensity at the plant canopy (15 cm from the lamp and 5 cm above the cultivation surface) measured an average of 156 ± 5 μmol m−2 s−1 PPFD (LI-180 spectrometer, LI-COR Biosciences, Lincoln, Nebraska, United States). The system maintained an electrical conductivity (EC) of 1.30 ± 0.01 mS cm−1 and a pH level of 6.01 ± 0.01.
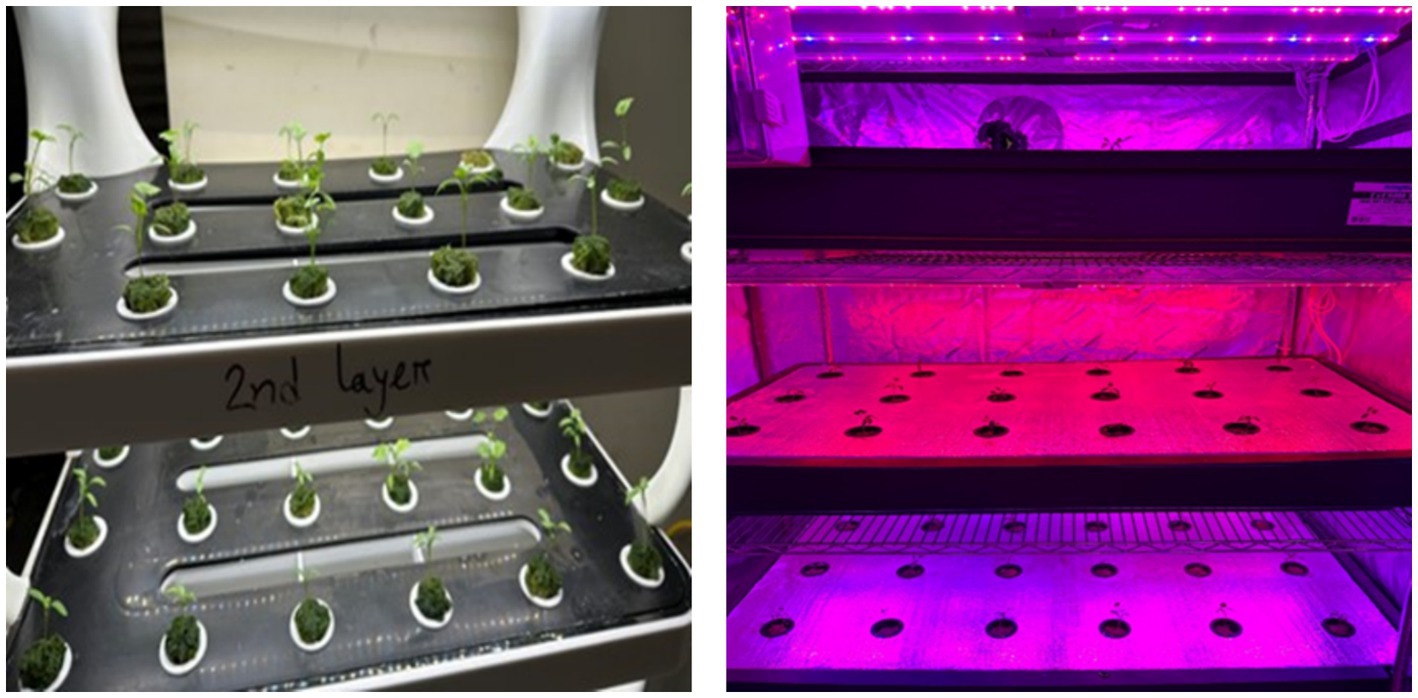
Figure 1. Seedlings of cilantro grown in Nutraponics system (A); different light spectral treatments across tiers in the climate-controlled chamber (B).
2.1.2 Growth conditions during the experimental stage
Two weeks after sowing, only one healthy seedling for each rook wool cube with approximately three leaves, reaching a height of around 4–5 cm, was transferred to a climate-controlled growth chamber in hydroponic (aeroponic) boxes (130 cm × 70 cm × 18 cm). Each hydroponic box accommodated 18 seedlings, maintaining a planting density of 20 plants per square meter (Figure 1B). The climatic conditions in the growth chamber were monitored and recorded throughout the experiment by a Raspberry Pi and Ardrino-based climate control computer (CEE lab, UC Davis). The data was recorded every 5 min. The average temperature was 23.00 ± 0.02°C, with a set point of 23°C, and a relative humidity (RH) of 49% was maintained. The sensor (HOBO, MX2301A, Onset Computer Corporation, Bourne, United States) measured the temperature and RH. The daily CO2 concentration was at an average of 575.0 ± 1.3 ppm. The irrigation system of this study was an aeroponic system where the nozzles were turned on for 10 min per hour (1 min on and 5 min off). Nutrient conditions were carefully revamped once a week by dosing the nutrient solutions A and B (Humboldt’s Secret Base A and B Bundle) to maintain an EC of 2.10 ± 0.00 mS cm−1 and a pH of 6.04 ± 0.02.
2.2 Experimental treatments and setup
Light-emitting diodes (LEDs) were employed for 3 weeks to illuminate plants inside the growth chamber featuring three tiers (Figure 1B). Each tier was equipped with three distinct tunable LED light bars (model number LBRM1, LBRF5, and LBSG1, Xtreme Lux company, United States) that had different spectra, and the combination provided a wide range of spectra for providing different light recipes. The peak emission wavelengths for B, R, and FR light were 450 nm, 660 nm, and 730 nm, respectively (Figure 2). In this experiment, three different light spectral combinations, R3B1FR1, R4B0.5FR0.5, and R4B1, were set up as mentioned in Table 1. The photon flux density (PFD) of 160 ± 10 μmol m−2 s−1 was consistently kept for all experimental treatments. The spectral distribution of PFD was assessed using a spectrometer (LI-180 by LI-COR Biosciences, Lincoln, Nebraska, United States) at 15 evenly spaced points at a height of 5 cm from the cultivation plate (Table 2). The LED lamp was positioned 30 cm away from the cultivation surface. The data (Mean ± SE mean) presented in Table 2 indicates average light intensity and standard error based on 15 measurement points. DLI was calculated by the formula DLI = PFD × photoperiod × 3600/1000,000. Figure 2 represents the spectrum distribution of each light treatment with a spectrometer.
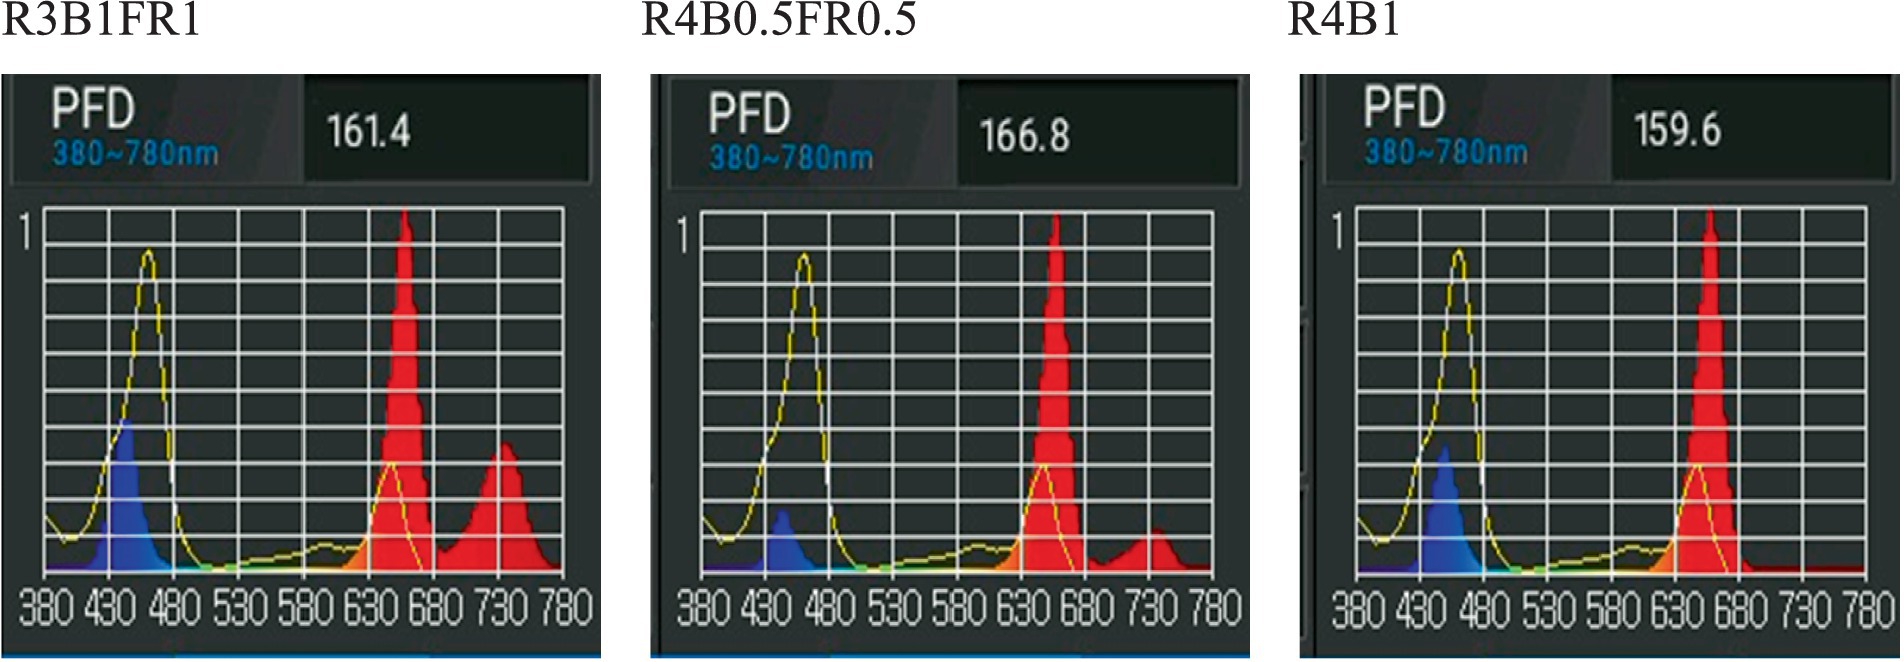
Figure 2. Measured PFD and light spectra of the three light treatments (R3B1FR1, R4B0.5FR0.5, R4B1).

Table 1. Light spectrum combinations and proportions for each treatment (R3B1FR1, R4B0.5FR0.5, R4B1), with PFD.

Table 2. Average value of measured total photon flux density (PFD, μmol m−2 s−1), individual wavebands’ PFD, ratios of red:far-red (R:FR), and daylight integral (DLI; mol m−2 d−1) of light treatments.
2.3 Data measurements
2.3.1 Morphological measurements and yield
In this study, each treatment was repeated two times with 18 plants in each tier. The central 12 plants from each tier were considered for morphological, yield, and quality analysis. Four plants were designated for morphological measurements, another four for shelf-life assessment, and the remaining four for analyzing phytochemical content. Morphological measurements were conducted 3 weeks after transplanting, using four plants from each treatment selected randomly from destructive harvest. Various morphological parameters such as plant height, stem thickness, leaf number, and total leaf area were recorded during this process. Stem thickness was gaged using a vernier caliper, while leaf area was quantified by capturing digital photographs of the leaves and subsequently analyzing them with Image J software (V1.8.0) (National Institute of Health and the Laboratory for Optical and Computational Instrumentation, United States). The picture of the leaves was taken from a distance of 30 cm above the leaf level (Figures 3A,B).
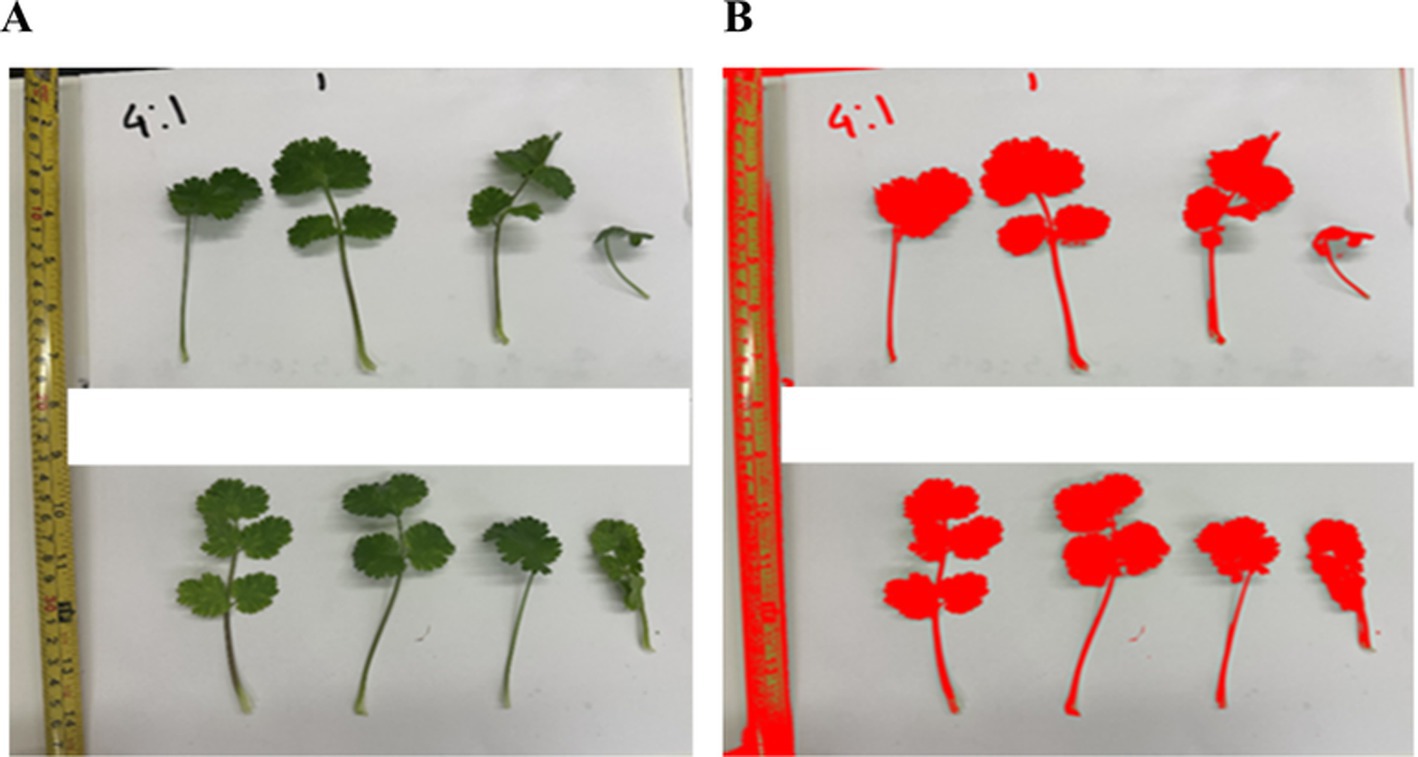
Figure 3. Image of cilantro leaves (A) the normal image for leaf area measurement and (B) the colored image after processing with Image J.
Furthermore, fresh and dry weights of the same four leaves, roots, and stems were determined using a Sartorius CP124S Analytical Balance (Sartorius, Göttingen, Germany) at the final harvest, followed by a 72-h drying process in a 105°C oven (Yamato DKN-402C, Yamato Scientific Co., Ltd., Japan). The stem-leaf ratio was estimated based on the ratio of stem dry weight to leaf dry weight. This study considered the fresh weight of above-ground biomass as a yield.
2.3.2 Overall visual quality and shelf-life measurements
Following the final harvest, at approximately 37 days after sowing, two fully expanded leaves from each of the four randomly selected plants per treatment were utilized for the shelf-life evaluation. Leaves with discoloration (e.g., large yellow or brown spots), decay (e.g., slimy or blackened areas), and physical damage (e.g., tears, bruises) were excluded to ensure consistency in visual quality assessment. The collected two leaves were stored within aluminum foil trays (15 L × 10 W × 5 H cm) that were covered with a plastic lid. Each tray lid contained 12 punctured pinholes (tears) to ensure high relative humidity and facilitate proper air exchange (Min et al., 2021). Beneath the leaves within an aluminum tray, a double layer of filter paper was moistened with 5 mL of Milli-Q water. There were 12 aluminum trays, and each treatment consisted of four trays. All trays were placed at 5°C in the regular fridge for 18 days. Data was collected through visual observation and smell at three-day intervals during storage. A scoring system from one to nine was used to evaluate based on four factors: color, shape, odor, and texture. The average score among these four factors was considered to estimate the overall visual quality (OVQ) score for the specific tray. It is important to note that a score of six represents the consumer threshold, which defines the point of determining postharvest shelf-life for leafy greens. The shelf-life experiment concluded when the OVQ score dropped below the consumer acceptability threshold of six. The scoring system of cilantro was done according to the approach used and the OVP matrix recommended by (Min et al., 2021). Two individual consumers evaluated the OVQ of cilantro leaf. The average OVQ value of four factors was fitted in the linear model to develop the regression correlation. The model could be used to estimate self-life based on the specific consumer threshold values.
2.3.3 Phytochemical quality parameter measurements
2.3.3.1 Chlorophyll content
Before the final harvest, approximately 36 days after sowing, four randomly selected plants from each light treatment were chosen for chlorophyll measurements. Portable CCM-200 (Opti-sciences, Hudson, New Hampshire, United States) was used to determine the chlorophyll content index nondestructively. The leaves selected for measurement were generally uniform in size. To ensure consistency, measurements were taken from the middle region of the adaxial side of the leaf blade. Five fully expanded young leaf blades from each plant were measured, and an average per plant was calculated.
2.3.3.2 Total phenolic content and mineral contents
After the 37-day growth period, four whole plant samples, randomly selected, from each of three of the different treatments were immediately immersed in liquid nitrogen and then stored at - 80°C. Subsequently, the Folin–Ciocalteu colorimetric assay was used to quantify total phenolics by oxidizing phenolic compounds and reducing the Folin–Ciocalteu reagent (Singleton and Rossi, 1965). This reduction changes the reagent’s color from yellow to blue. The extent of the color change is measured by absorbance at 725 nm (Molecular Devices SpectraMax Plus Spectrophotometer, San Jose, California, United States). The results were expressed in milligrams of gallic acid equivalents per gram of dry weight sample (mg GAE g −1 DW) (Waterhouse, 2002).
Nitrogen (N) content was assessed in dried whole plant samples using a CNS analyzer (Elementar varioMax CNS, Elementar Japan KK, Kanagawa, Japan). The determination of potassium (K), calcium (Ca), magnesium (Mg), phosphorus (P), iron (Fe), sulfur (S), manganese (Mn), and zinc (Zn) content in the dried plant samples was performed using an iCAP 6,000 series inductively coupled plasma-optical emission spectrometer (Thermo Fisher Scientific KK, Tokyo, Japan).
2.4 Statistical analysis
Statistical analyses were performed utilizing the GenStat software program (version 22.1.0.195; VSN International Ltd., Hemel Hempstead, United Kingdom). A total of 12 plants were sampled from each treatment to measure the overall morphological parameters, shelf life, and quality parameters. One-way ANOVA was performed, and Fisher’s protected Least Significant Difference (LSD) test was used for mean separation at a significance level of α = 0.05. In addition, the homogeneity of variances was assessed using Bartlett’s test, and the normality of residuals was assessed using the Shapiro–Wilk test. When the data failed to meet the assumptions, log transformation was applied, and the tests on residuals were subsequently re-executed. The data was presented as mean ± standard error of mean based on common variance. All measurement parameters were statistically repeated two times (two temporal replications of the experiment), and each replicate had four individual measurement plants. Regression analysis was performed for OVQ assessment, and a linear model (y = mx + b) was fitted to obtain shelf life.
3 Results
3.1 Effect of light spectral combinations on the morphology
Plant height was measured after a period of 21 days under the light treatments (Figure 4). Plant height exhibited a substantial and statistically significant variation among the treatments (p ≤ 0.001). The highest height, recorded at 16.38 cm, was associated with the R1B1FR1 treatment, while the lowest height of 12.62 cm was observed in the R4B1 treatment. Notably, the R4B0.5FR0.5 treatment was positioned at an intermediate height of 15.25 cm, indicating a substantial difference in the growth patterns (Figure 5A).
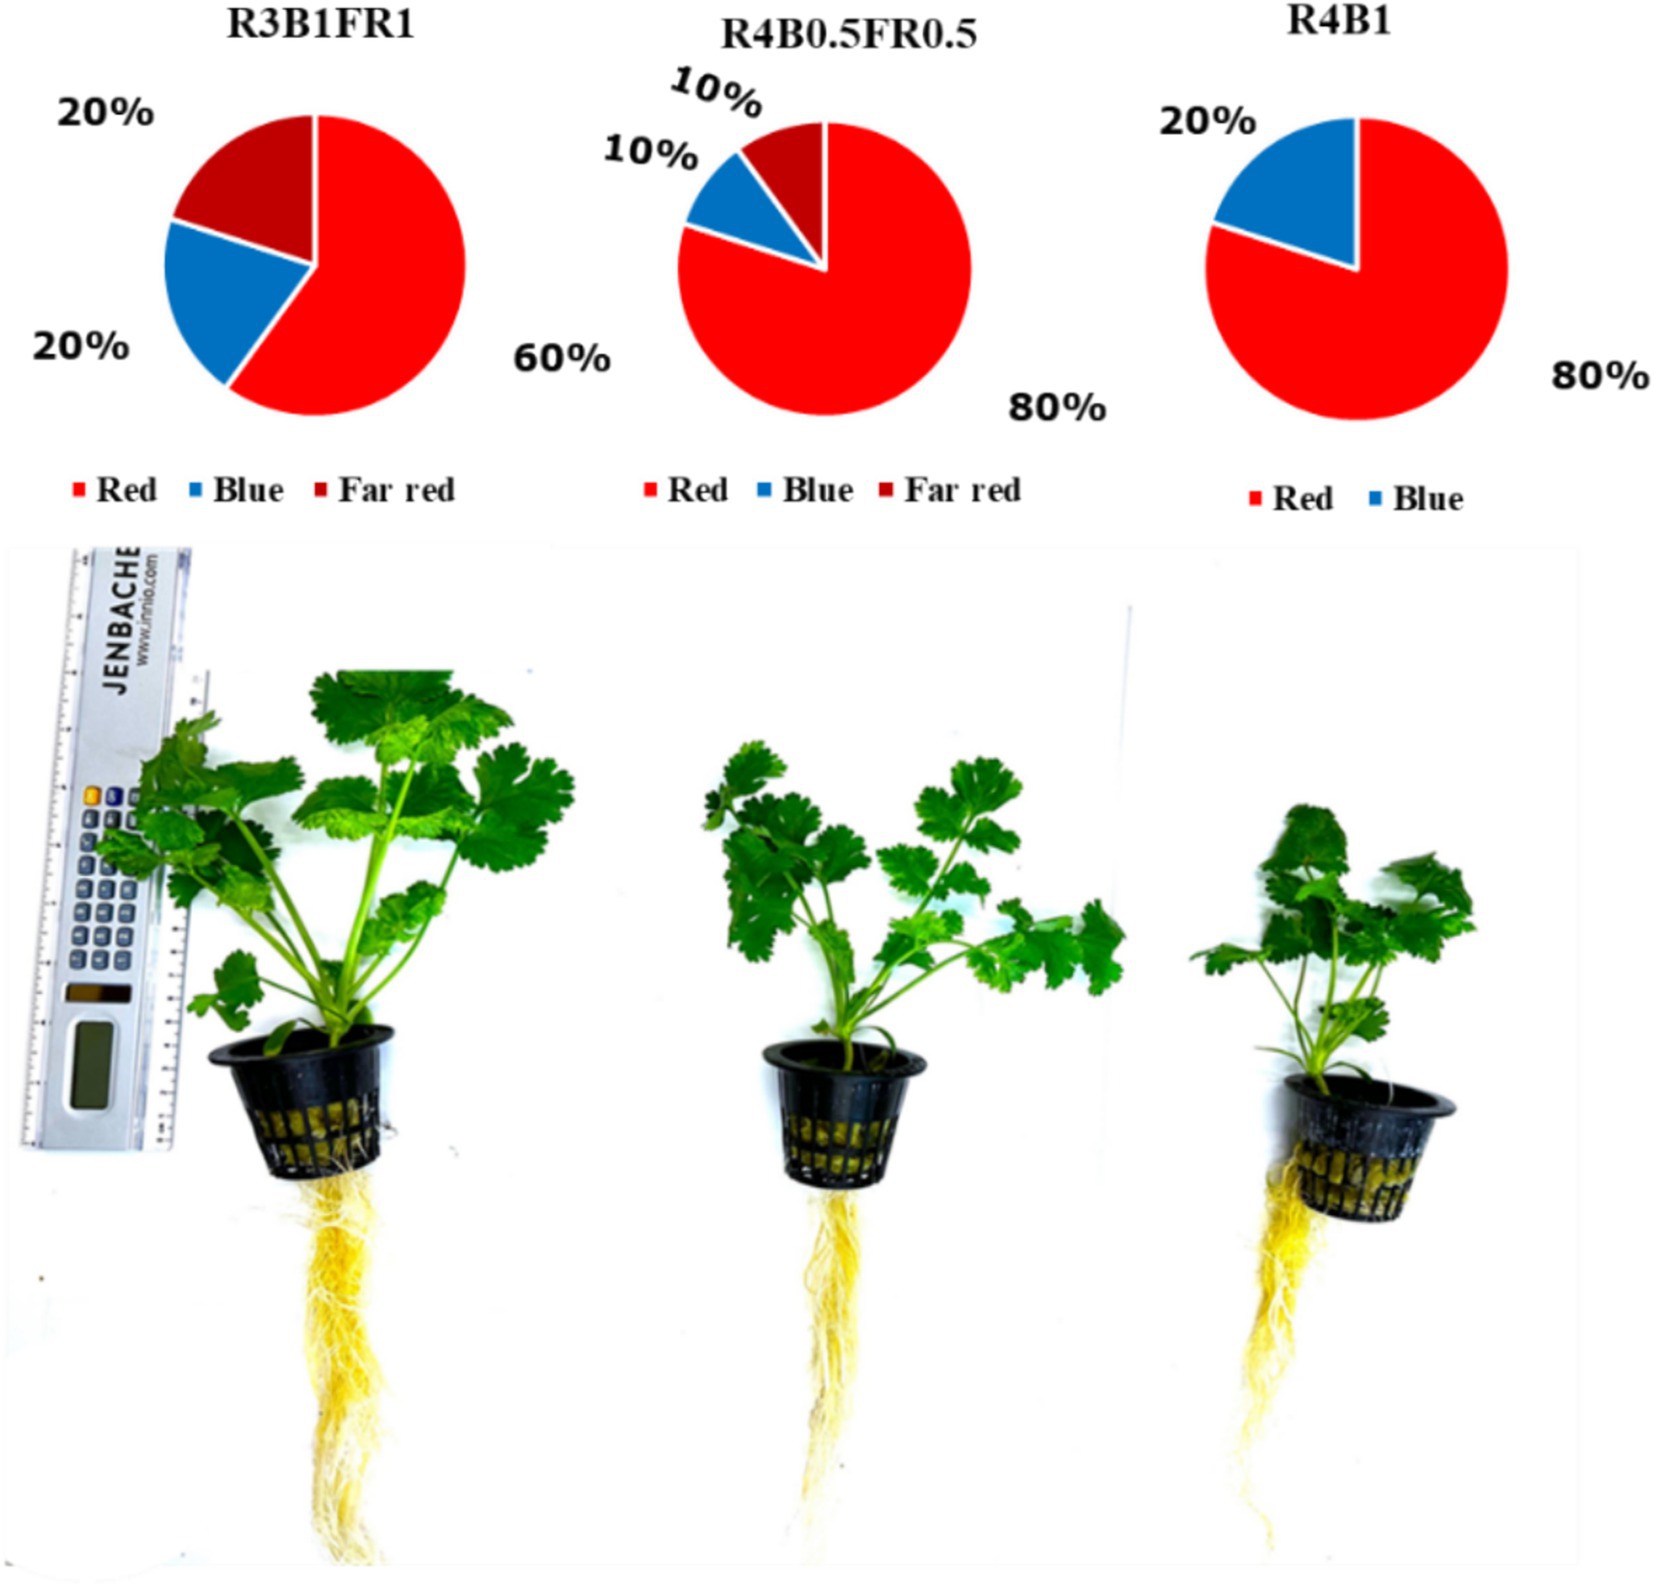
Figure 4. Three different light spectral treatments (R3B1FR1, R3B0.5FR0.5, R4B1) and side views of plants after 21 days of light treatments (total plant age 37 days from sowing).
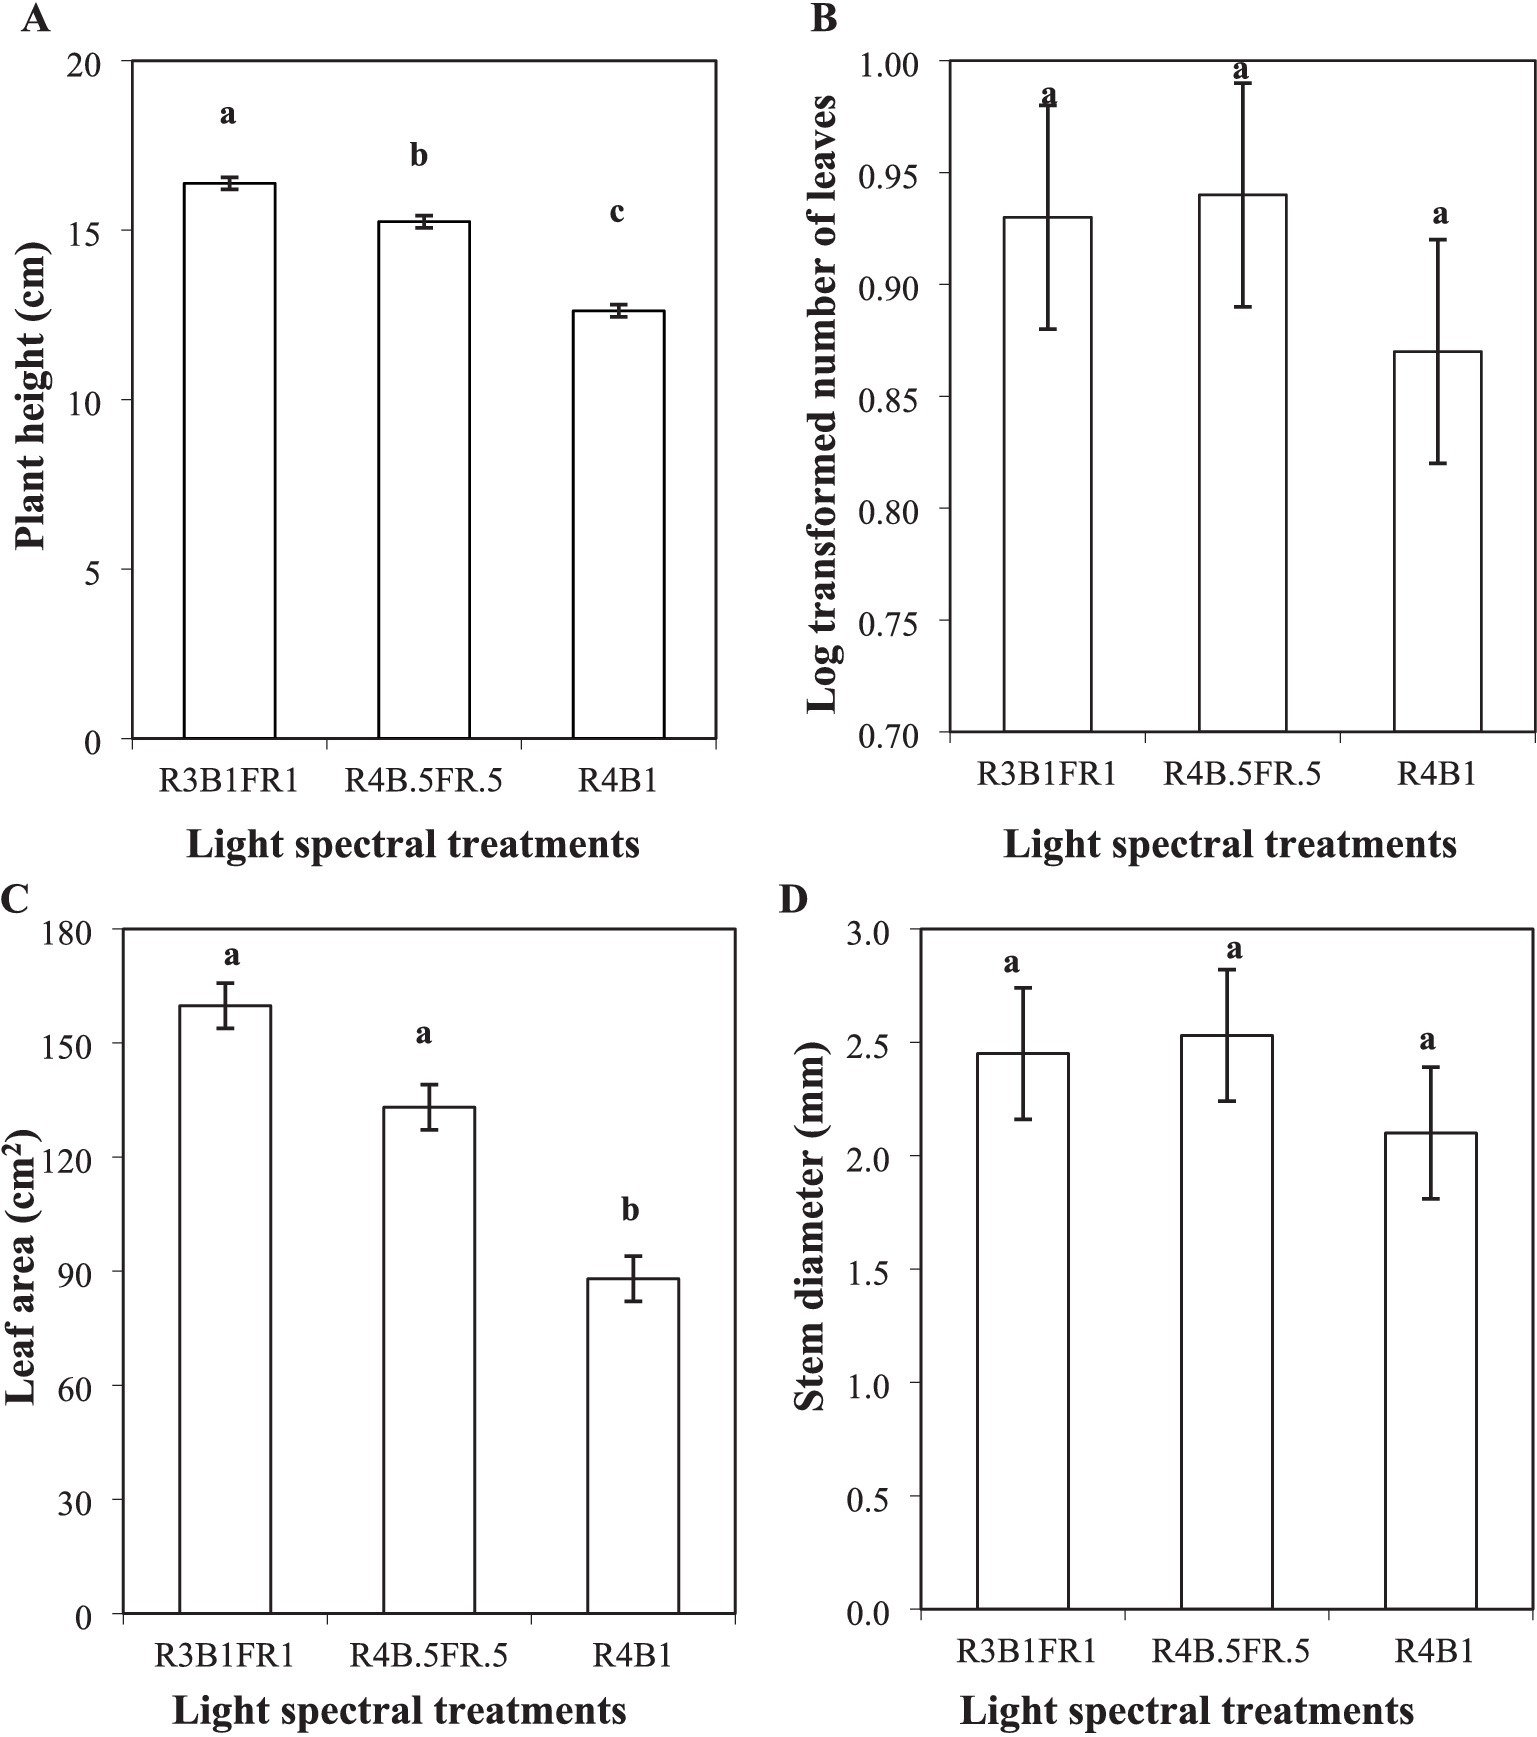
Figure 5. Plant height (A); number of leaves (B); leaf area (C) and stem diameter (D) of cilantro plants cultivated under different light spectral treatments (R:B:FR = 3:1:1 and 4:0.5:0.5, R:B = 4:1). Bars represent the mean ± standard error of the mean (SEM) (n = 4). Analysis was performed by using a one-way ANOVA. Different lowercase letters indicate significant differences among the treatments according to Fisher’s protected LSD test at α = 0.05. The same lowercase letter represents no variation among the treatments. R3B1FR1: red, blue, and far-red ratio = 3:1:1; R4B0.5FR0.5: red, blue, and far-red ratio = 4:0.5:0.5; R4B1: red, blue ratio = 4:1.
During the assessment of leaf numbers, the Shapiro–Wilk test for normality identified a non-normally distributed dataset (probability: 0.05). Consequently, a log transformation (log10) was applied to the data (probability = 0.07). The subsequent analysis revealed that the selected combinations of the light spectrum did not have a significant statistical impact on cilantro leaf numbers (p ≥ 0.5; Figure 5B).
In the case of the leaf area, the light spectral combinations revealed a significant impact (p ≤ 0.01). Plants cultivated under the R3B1FR1 light treatment reported the largest leaf area (159.75 cm2), while the R4B1 showed the smallest leaf area (87.97 cm2). Meanwhile, R3B1FR1 and R3B0.5FR0.5 (133.14 cm2) showed no significant difference (Figure 5C). Also, the different light spectral combinations had no significant effect on the stem diameter of cilantro plants (p ≥ 0.05; Figure 5D).
3.2 Effect of light spectral combinations on the yield
In the case of cilantro leaf fresh weight, a significant impact of the light spectral treatments was observed (p ≤ 0.05). R3B1FR1 showed the highest leaf fresh weight (4.10 g plant−1), and R4B1 showed the lowest leaf fresh weight (2.17 g plant−1; Figure 6A). No significant impact on cilantro leaf dry weight was observed under various light spectral combinations (p ≥ 0.05). R3B1FR1 and R4B0.5FR0.5 treatments showed numerically higher values (0.4 g plant−1) compared to control treatments (0.3 g plant−1; Figure 6B).
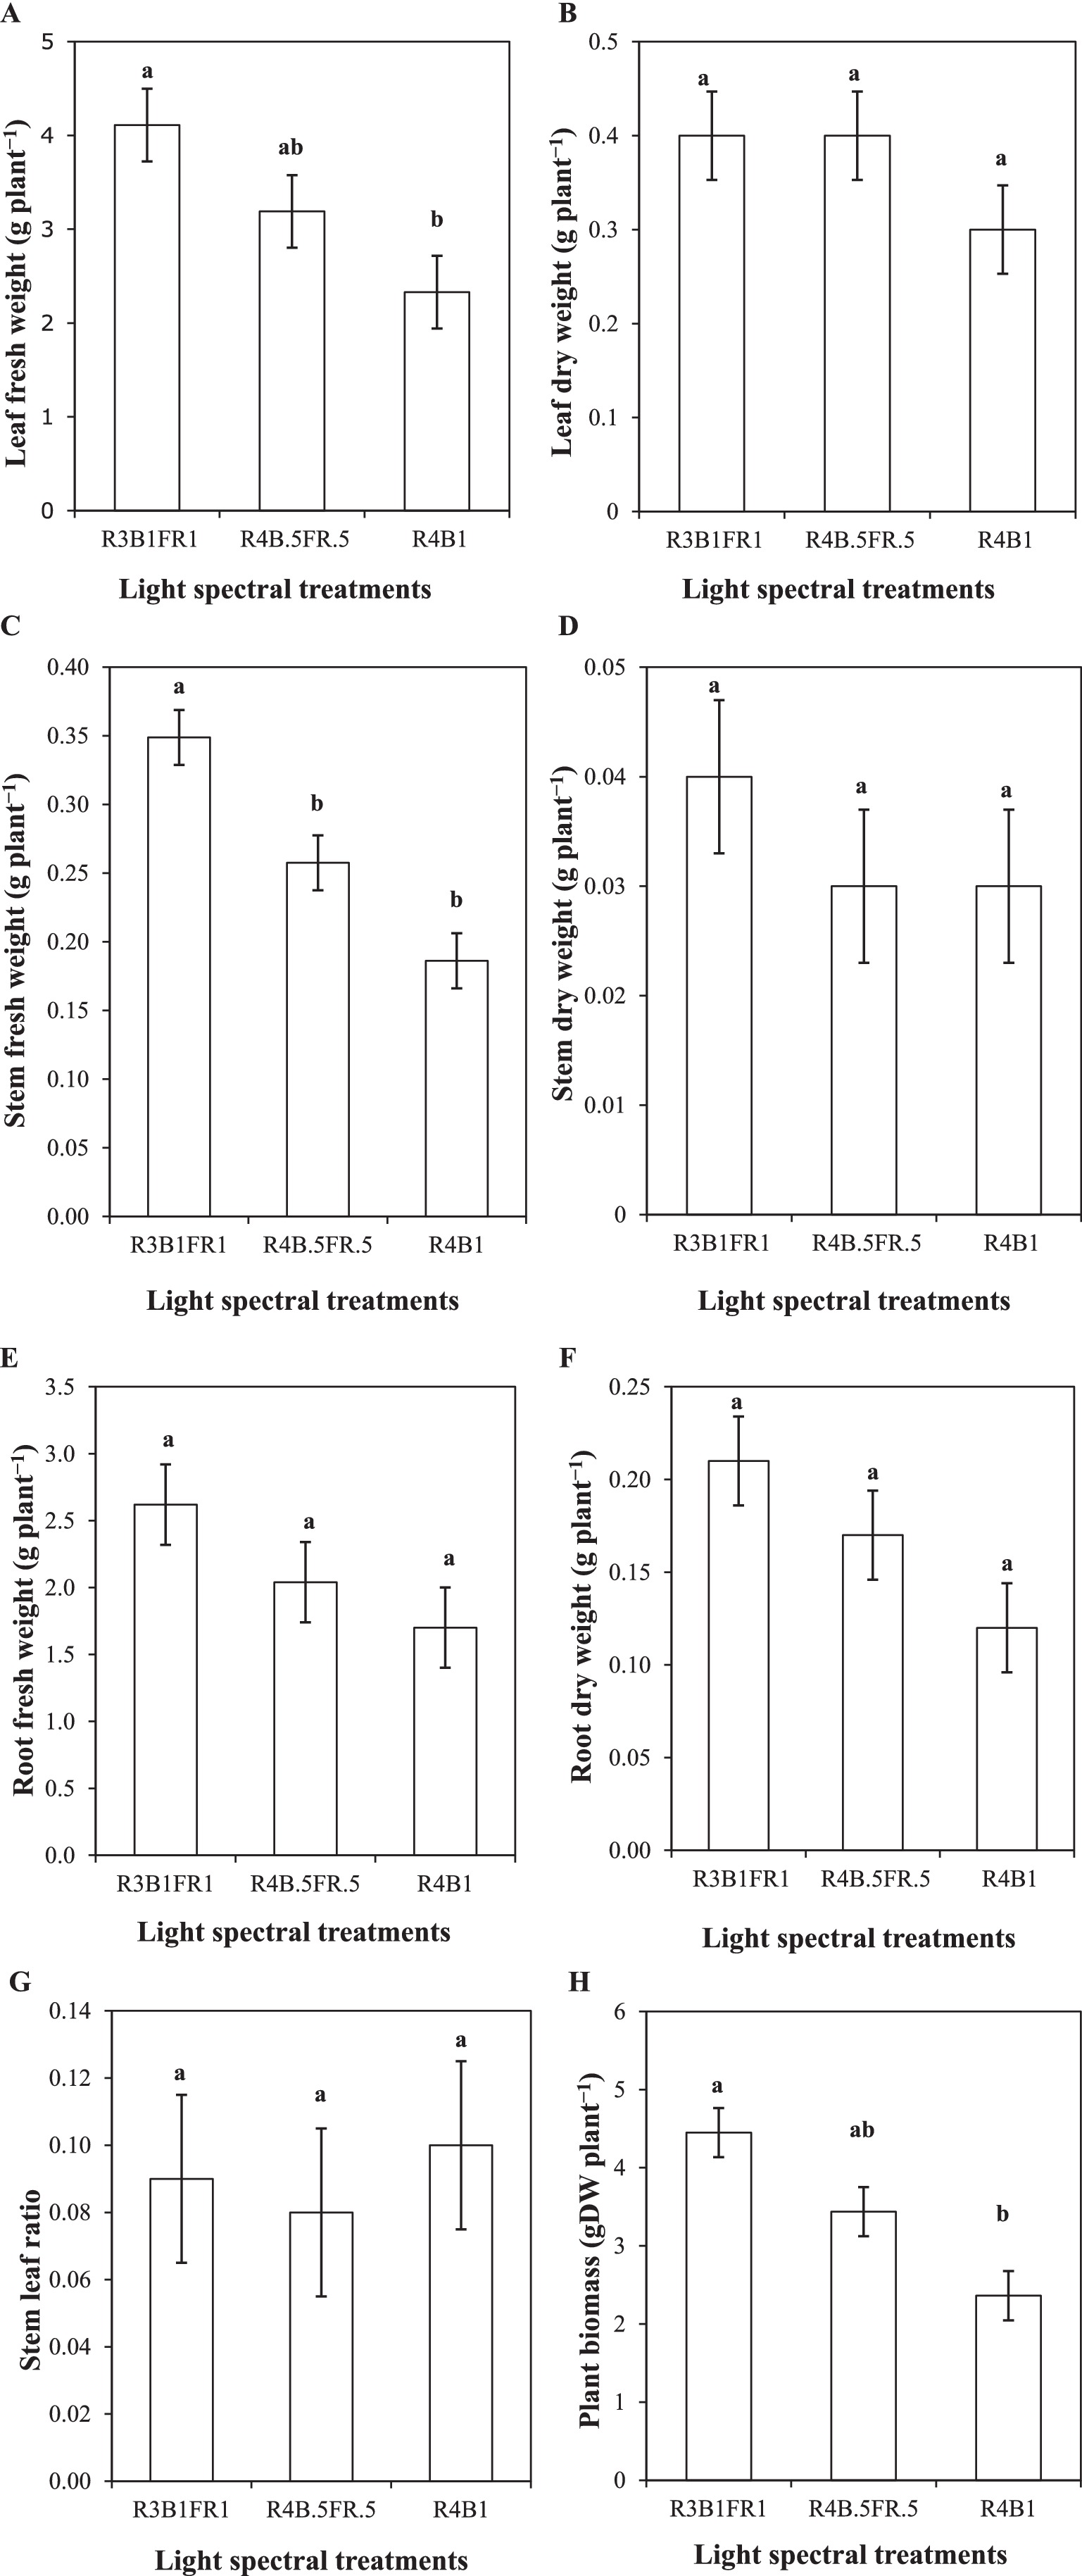
Figure 6. Leaf fresh weight (A); leaf dry weight (B); stem fresh weight (C); stem dry weight (D); root fresh weight (E); root dry weight of (F); stem leaf ratio (G) and biomass/yield (H) of cilantro plants cultivated under different light spectral treatments (R:B:FR = 3:1:1 and 4:0.5:0.5, R:B = 4:1).
The light spectral combinations significantly influenced the fresh stem weight of cilantro plants (p ≤ 0.05). R3B1FR1 treatment produced the greatest stem fresh weight (0.35 g plant−1), while the lowest fresh weight (0.19 g plant−1) was observed in the R4B1 (control) treatment (Figure 6C). The statistical assessment of stem dry weight revealed no significant results (p ≥ 0.05). The highest mean stem dry weight was found at R3B1FR1 (0.04 g plant−1) and almost identical to 0.038 g plant−1 for the other two treatments (Figure 6D).
Figures 6E,F show the impact on root fresh and dry weight, but it is not statistically significant (p ≥ 0.05). However, R4B0.5FR0.5 and R3B1FR1 showed an increasing pattern for root fresh and dry weight compared to the control (R4B1) treatment, with the same trend (R3B1FR1 > R4B0.5FR0.5 > R4B1). A different pattern was found for the different light spectral combinations on the stem-leaf ratio of cilantro plants, but the effect is not statistically significant (p ≥ 0.05; Figure 6G).
The yield or above-ground biomass of cilantro plants was analyzed using the data observed under the three light treatments. The fresh yield of cilantro demonstrated significant differences among treatments (p ≤ 0.05). The greatest yield of 4.45 g plant−1 was observed in the R3B1FR1 light treatment, while the lowest yield (2.36 g plant−1) was recorded in the R4B1 treatment. However, the R4B0.5FR0.5 (3.44 g plant−1) treatment did not exhibit a statistically significant difference among other treatments (Figure 6H) as the statistical outcomes for leaf fresh weight (Figure 6A).
3.3 Effect of light spectral combinations on the shelf life
3.3.1 Overall visual quality observations and shelf life measurement
OVQ was assessed once per replicate (n = 2), and 18 days were required for each assessment. The total OVQ score was identical on the harvest day for both replicates. Subsequently, the OVQ consistently decreased for all treatments on each observation day. In the initial replication, the R4B0.5FR0.5 treatment (shelf life 11.75 days) consistently exhibited a lower average OVQ score, reaching the threshold (score below 6) level about 2 days earlier than the other two light treatments (R4B1 and R3B1FR1). Except for day nine, the R4B1 treatment (shelf life 13.65 days) consistently displayed the highest OVQ score throughout the observation period. The slope (m) for the R4B0.5FR0.5 and R4B1 treatments was 0.21, while it was 0.20 for the R3B1FR1 treatment (Figure 7A). In general, a similar trend of OVQ was observed from the second replication. The R4B1 treatment consistently had a greater OVQ score on all observation days, while R4B0.5FR0.5 consistently had a lower OVQ score. Notably, R3B1FR1 (shelf life 9.92 days) reached the threshold level (score 6) earlier than the R4B1 treatment (12.16 days; Figure 7B).
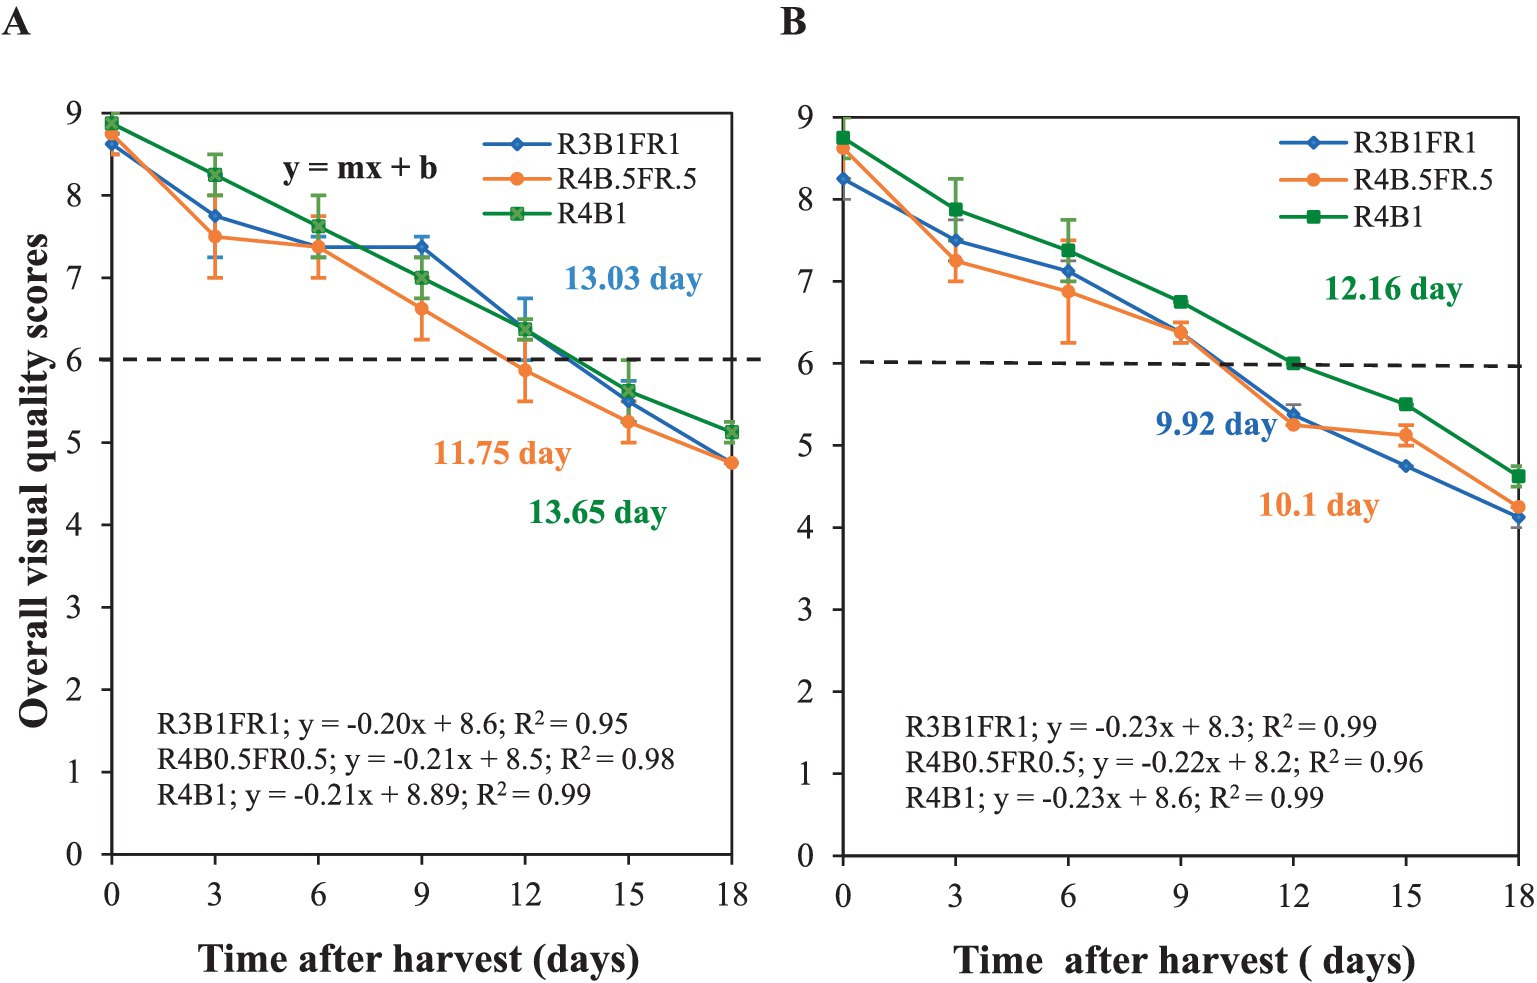
Figure 7. Total OVQ of cilantro plants changes during storage at 5°C in replication 1 (A) and 2 (B). The x-axis represents the observation days from harvesting to 18 postharvest days (5°C), with day 0 being harvest day. The y-axis, ranging from 1 (very bad) to 9 (excellent), shows the OVQ score. This score was calculated using four quality parameters: color, shape, odor, and texture. Data points represent means of 4 samples (n = 4), each consisting of 2 leaves from each plant. The horizontal black dash-dot line indicates the defined consumer acceptance threshold (OVQ score = 6). Shelf life was calculated from the intersection of fitted curves y = mx + b and consumer acceptance threshold. Error bars indicate the standard error of the mean of that measured value.
The shelf life was derived from OVQ score data using a linear model (y = mx ± b) (Figures 7A,B). The shelf-life (x) of cilantro was estimated based on the recommended consumer acceptance (OVQ 6) level (y). The R2 ranged between 0.95 and 0.99, indicating a strong correlation between the OVQ score and shelf-life for each treatment. However, there were no statistically significant differences in shelf life across all treatments (p ≥ 0.05). However, the R4B1 treatment exhibited a numerically longer shelf life of 12.91 days (average of two replicates) compared to R3B1FR1 (11.47 days) and R4B0.5FR0.5 (10.93 days; Figure 8).
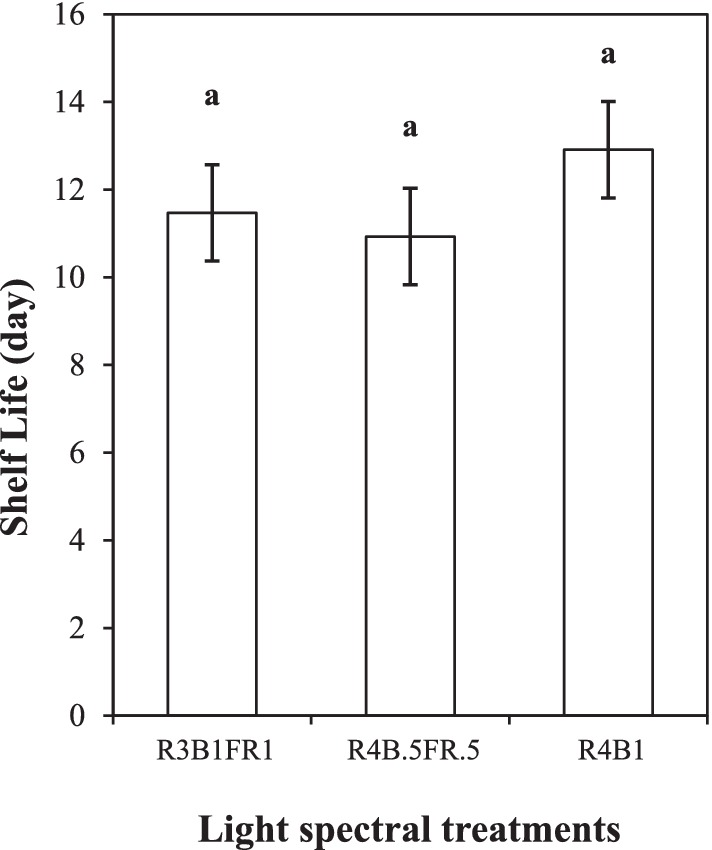
Figure 8. Shelf life of cilantro cultivated under different light spectral treatments (R:B:FR = 3:1:1 and 4:0.5:0.5, R:B = 4:1). Bars represent the mean ± SEM (n = 4). Analysis was performed by using a one-way ANOVA. The same lowercase letter represents no variation among the treatments.
3.4 Effect of light spectral combinations on the phytochemical content
3.4.1 Chlorophyll content index and total phenolic content
The selected light spectral combinations had no significant effects on chlorophyll content in cilantro leaves (p ≥ 0.05; Figure 9A). Although R3B1FR1 showed a lower CCI (17.8) and R4B1 observed a higher CCI (18.57), where R4B0.5FR0.5 treatment recorded an intermediate CCI (18.18).
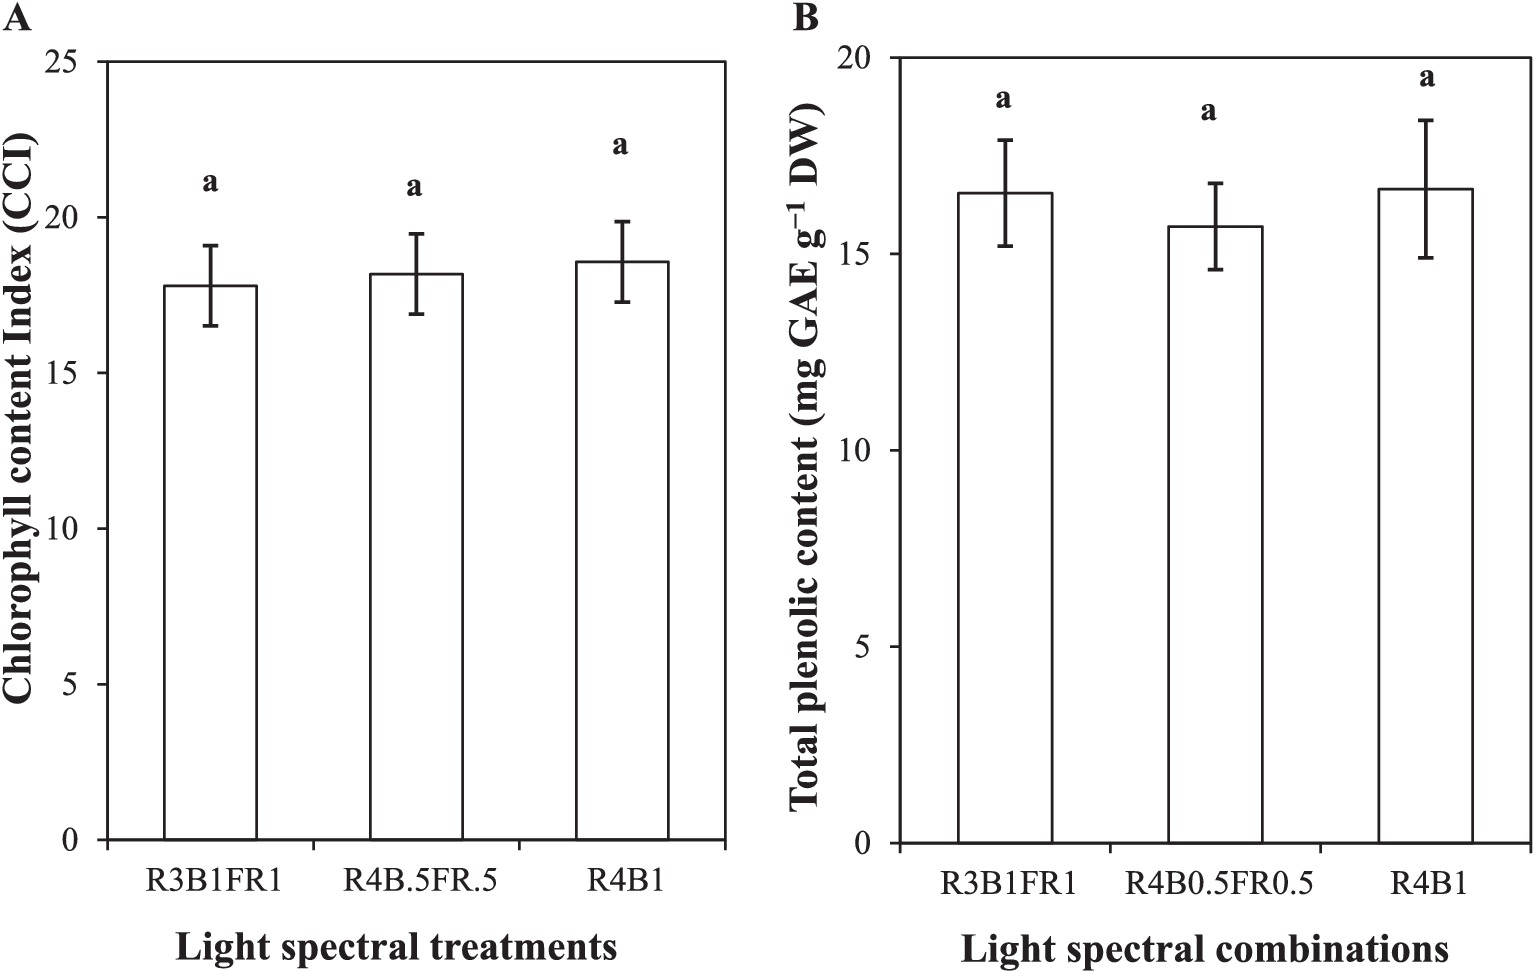
Figure 9. Chlorophyll content index (A); total phenolic content (B) of cilantro leaves (phenol content expressed as milligrams of gallic acid equivalents per gram of dry weight) cultivated under different light spectral treatments (R:B:FR = 3:1:1 and 4:0.5:0.5, R:B = 4:1). Data was the mean value derived from 2 replicates; each treatment was evaluated upon four individual plants (n = 4). Analysis was performed by using a one-way ANOVA. The error bars indicate ± standard error of means based on common variance. The same lowercase letter represents no variation among the treatments.
In the case of total phenolic content, no significant differences were observed among the leaves of cilantro cultivated under the tested light treatments (p ≥ 0.05). However, the R4B1 treatment showed numerically greater TPC (16.65 mg GAE g−1 DW), and R4B0.5FR0.5 showed lower TPC (15.7 mg GAE g−1 DW; Figure 9B).
3.5 Effect of light spectral combinations on the mineral content
The mineral contents in the cilantro plants under the selected light spectral combinations are shown in Table 3. It was evident that no significant variation was found among the light spectral treatments in any of the mineral components.
4 Discussion
This study aimed to determine the suitable spectral combinations (light recipe) of R, B, and FR for optimal growth, yield, and quality of cilantro. The spectral combination of light influences the growth, development, and morphogenesis of plants (Arena et al., 2016; Lanoue et al., 2018). This is attributed to the dual function of light as both an energy source and a regulatory signal for plants (Bian et al., 2015). FR radiation wavelength is generally excluded from photosynthetically active radiation (PAR, 400–700 nm) when the photosynthetic photon flux density (PPFD) is measured. It was considered less active for photosynthesis when applied alone (Zhen et al., 2021). FR, in conjunction with R, induces the Emerson effect, simultaneously stimulating photosystems I (PS I) and II (PS II), resulting in increased photosynthetic rates (Lysenko et al., 2014) and promoting biomass accumulation (Li and Kubota, 2009). In recent times, an expanding body of research suggests that plants can more effectively utilize FR photons for photosynthesis under broad-spectrum or combined lights than previously understood (Hogewoning et al., 2012; Murakami et al., 2018; Zhen and Van Iersel, 2017).
4.1 Conjugated FR with R and B light enhanced the growth and yield of cilantro
Light spectral combinations for cilantro showed various results based on plants and treatments (Nguyen et al., 2020; Kong and Nemali, 2021). The variations are probably because of different responses of plants to light spectra and different combination effects of light spectrum. For example, R light is the most effective for photosynthesis, but other wavelengths are crucial for optimizing growth and maintaining normal plant physiology. B light regulates stomatal opening and transpiration and is needed to prevent ‘red light syndrome’, which leads to suboptimal morphology (Davis and Burns, 2016). FR light regulates various photomorphogenic responses, such as stem elongation, larger leaf area, and enhanced whole-plant net assimilation (Park and Runkle, 2017), which positively correlates with biomass. In the current study, the plant height and leaf area showed a significant increase in R3B1FR1 compared to the other treatments (Figures 5A,C). These findings are consistent with the results reported by Nguyen et al. (2020) that the addition of FR with R and B lights (RBFR = 81.5:12.5:6) is beneficial for leaf area enlargement and stem length compared to monochromatic light or the combination of R and B. Similarly, Kong and Nemali (2021) reported that in lettuce plants, R:B:FR (42:42:16) exhibited photomorphogenic effects, decreased the phytochrome photo stationary state (PSS) and thus favored elongation growth for shade avoidance, and increased individual leaf area when compared to R:B (90:10) or R:B (50:50). Therefore, the observed increase in plant height with the addition of FR proportion along with R and B (R3B1FR1 or R4B0.5FR0.5) may be attributed to the role of FR light in regulating phytochrome-mediated morphological and developmental plant responses. This regulatory mechanism facilitates improved light capture and enhances survival under shaded conditions (Park and Runkle, 2017). In fact, reports say that due to the presence of FR, the low ratio of R:FR light perceived by phytochrome photoreceptors induces rapid changes in gene expression and physiological processes, initiating the shade-avoidance response (Keuskamp et al., 2010; Ruberti et al., 2012). Shade-avoidance response is a plant adaptation mechanism that optimizes light capture in environments with limited light due to shading.
In the current study, R3B1FR1 treatment did not affect leaf number, which was consistent with the results of Kong and Nemali (2021). Although leaf number did not increase, biomass was increased with R3B1FR1, which could be explained by the increased plant height and leaf area, as also found in several studies (Nguyen et al., 2020; Kong and Nemali, 2021; Kubota et al., 2011; Li and Kubota, 2009). Kubota et al. (2011) reported that adding FR lighting increased the fresh and dry mass of lettuce plants, ranging from 115 to 128% compared to the control. This enhancement was attributed to the increased light interception resulting from the extension of the leaf area. Hence, in our study, the observed increase in growth and yield under the R3B1FR1 compared to R4B1 treatment may be due to two associated reasons: (1) photomorphogenic effects and (2) enhanced photosynthesis and greater light interception.
4.2 Conjugated FR with R and B light did not affect the shelf life and phytochemical content of cilantro
The treatment R4B1 provided a shelf life of 13 days, which was numerically longer compared to the treatment R4B0.5FR0.5 (11 days) and R3B1FR1 (12 days) (Figure 8). This slight extension in shelf life under R4B1 may be associated with a numerical increase in chlorophyll content, which could contribute to antioxidant activity that delays decomposition, as suggested by Ma et al. (2012). Although chlorophyll and phenol contents did not show statistically significant differences among treatments, the higher total phenolic content trend under R4B1 may also contribute to the observed shelf life. Phenolic compounds are recognized for their antioxidant properties, potentially helping to delay senescence-associated deterioration, consistent with findings by Nguyen et al. (2020). Additionally, shelf-life differences could be influenced by variations in sample water content between treatments, although this study did not measure the water content of these specific samples directly. In the future, further investigation could be performed to analyze the correlation between self-life and the water content of cilantro. Also, the linear model could be further investigated using more data sets and a large number of evaluators.
4.3 Conjugated FR with R and B light did not affect mineral content in cilantro plants
Mineral content was not statistically significant with the treatments in the present study. However, the results showed some trend to numerical change in mineral content based on the light spectral treatment (Table 3). Samuolienė et al. (2021) observed in their study that the mineral content in dwarf tomatoes is not affected by the light spectrum [B, (447 nm) R, (660 nm), FR, (740 nm)] during the growth stage. This finding aligns with our results. But, the cilantro study by Nguyen et al. (2020) noted that different light spectral combinations significantly influenced the mineral content, which did not align with our results. This variation may be due to possible inter-species differences arising from experimental setup or specific light spectral combinations. Future studies should further investigate the aspect of mineral content discrepancy with different cultivars under the same lighting and environmental conditions (temperature, humidity, CO2, and nutrient treatments).
5 Conclusion
This study aimed to investigate the optimum light spectral combinations for the morphology, yield, phytochemical content, and shelf life of cilantro cultivated in indoor farming. Light spectral combinations with FR light significantly impact morphology and yield. Our study showed that conjugated FR with R and B light (R3B1FR1 and R4B0.5FR0.5) spectral combinations in cilantro led to a substantial increase in plant height and leaf area, ultimately contributing to a higher yield compared to R4B1 treatment. On the other hand, R4B1 showed a numerically longer shelf life, with numerically higher chlorophyll and total phenol content, compared to R3B1FR1; these effects were not statistically significant. Mineral contents were unaffected by light treatment. Overall, the R3B1FR1 combination proved most effective in enhancing yield without compromising quality, suggesting that tailored light spectra can support yield and quality improvements in cilantro production. Future studies should include investigations on the antioxidant contents and volatile components under different light spectral treatments, including the impact of UV light, especially on self-life. It also recommended detailed analysis for shelf-life analysis with many samples and using many evaluators.
Data availability statement
The raw data supporting the conclusions of this article will be made available by the authors, without undue reservation.
Author contributions
NA: Conceptualization, Data curation, Formal analysis, Methodology, Validation, Visualization, Writing – original draft, Writing – review & editing. LC: Formal analysis, Methodology, Writing – review & editing. GT: Methodology, Resources, Writing – review & editing. MN: Methodology, Writing – review & editing. JV: Supervision, Visualization, Writing – review & editing. MA: Conceptualization, Funding acquisition, Investigation, Methodology, Supervision, Writing – original draft, Writing – review & editing.
Funding
The author(s) declare that financial support was received for the research, authorship, and/or publication of this article. The University of California funded this research from USDA Hatch funding (NE2335:Resource Optimization in Controlled Environment Agriculture) through the University of California, Davis Agricultural Experiment Station for 2023.
Acknowledgments
We thank the Controlled Environment Engineering (CEE) lab members, especially Saeed Karimzadeh, a Ph.D. student at UC Davis, for assisting with the light setup and maintaining indoor experimental conditions. We also thank the ABF and WUFP Scholarship and Erasmus+ travel grant authorities for enabling the lead author to experiment with UC Davis.
Conflict of interest
The authors declare that the research was conducted in the absence of any commercial or financial relationships that could be construed as a potential conflict of interest.
Publisher’s note
All claims expressed in this article are solely those of the authors and do not necessarily represent those of their affiliated organizations, or those of the publisher, the editors and the reviewers. Any product that may be evaluated in this article, or claim that may be made by its manufacturer, is not guaranteed or endorsed by the publisher.
References
Arena, C., Tsonev, T., Doneva, D., De Micco, V., Michelozzi, M., Brunetti, C., et al. (2016). The effect of light quality on growth, photosynthesis, leaf anatomy, and volatile isoprenoids of a monoterpene-emitting herbaceous species (Solanum lycopersicum L.) and an isoprene-emitting tree (Platanus orientalis L.). Environ. Exp. Bot. 130, 122–132. doi: 10.1016/j.envexpbot.2016.05.014
Ballaré, C. L. (2014). Light regulation of plant defense. Annu. Rev. Plant Biol. 65, 335–363. doi: 10.1146/annurev-arplant-050213-040145
Bhat, S., Kaushal, P., Kaur, M., and Sharma, H. K. (2014). Coriander (Coriandrum sativum L.): processing, nutritional and functional aspects. African J. Plant Sci. 8, 25–33. doi: 10.5897/ajps2013.1118
Bhatla, S. C., and Lal, M. A. (2023). “Light perception and transduction” in Plant Physiology, Development and Metabolism. ed. S. C. Bhatla (Singapore: Springer Nature), 363–390.
Bhuiyan, M. N. I., Begum, J., and Sultana, M. (2009). Chemical composition of leaf and seed essential oil of Coriandrum sativum L. from Bangladesh. Bangl. J. Pharmacol. 4, 150–153. doi: 10.3329/bjp.v4i2.2800
Bian, Z. H., Yang, Q. C., and Liu, W. K. (2015). Effects of light quality on the accumulation of phytochemicals in vegetables produced in controlled environments: a review. J. Sci. Food Agric. 95, 869–877. doi: 10.1002/jsfa.6789
Cammarisano, L., Donnison, I. S., and Robson, P. R. (2021). The effect of red & blue-rich LEDs vs fluorescent light on Lollo Rosso lettuce morphology and physiology. Front. Plant Sci. 12:603411. doi: 10.3389/fpls.2021.603411
Chen, X. L., Guo, W. Z., Xue, X. Z., Wang, L. C., and Qiao, X. J. (2014). Growth and quality responses of ‘green oak leaf’ lettuce as affected by monochromic or mixed radiation provided by fluorescent lamp (FL) and light-emitting diode (LED). Sci. Hortic. 172, 168–175. doi: 10.1016/j.scienta.2014.04.009
Davis, P. A., and Burns, C. (2016). Photobiology in protected horticulture. Food Energy Secur. 5, 223–238. doi: 10.1002/fes3.97
De Wit, M., Galvao, V. C., and Fankhauser, C. (2016). Light-mediated hormonal regulation of plant growth and development. Annu. Rev. Plant Biol. 67, 513–537. doi: 10.1146/annurev-arplant-043015-112252
Demotes-Mainard, S., Péron, T., Corot, A., Bertheloot, J., Le Gourrierec, J., Pelleschi-Travier, S., et al. (2016). Plant responses to red and far-red lights, applications in horticulture. Environ. Exp. Bot. 121, 4–21. doi: 10.1016/j.envexpbot.2015.05.010
Divya, P., Puthusseri, B., and Neelwarne, B. (2014). The effect of plant regulators on the concentration of carotenoids and phenolic compounds in foliage of coriander. LWT Food Sci. Technol. 56, 101–110. doi: 10.1016/j.lwt.2013.11.012
D’Souza, C., Yuk, H. G., Khoo, G. H., and Zhou, W. (2015). Application of light-emitting diodes in food production, postharvest preservation, and microbiological food safety. Compr. Rev. Food Sci. Food Saf. 14, 719–740. doi: 10.1111/1541-4337.12155
El-Zaeddi, H., Calín-Sánchez, Á., Nowicka, P., Martínez-Tomé, J., Noguera-Artiaga, L., Burló, F., et al. (2017). Preharvest treatments with malic, oxalic, and acetylsalicylic acids affect the phenolic composition and antioxidant capacity of coriander, dill, and parsley. Food Chem. 226, 179–186. doi: 10.1016/j.foodchem.2017.01.067
Emamghoreishi, M., Khasaki, M., and Aazam, M. F. (2005). Coriandrum sativum: evaluation of its anxiolytic effect in the elevated plus-maze. J. Ethnopharmacol. 96, 365–370. doi: 10.1016/j.jep.2004.06.022
Gao, Q., Liao, Q., Li, Q., Yang, Q., Wang, F., and Li, J. (2022). Effects of LED red and blue light component on growth and photosynthetic characteristics of coriander in plant factory. Horticulturae 8:1165. doi: 10.3390/horticulturae8121165
Hogewoning, S. W., Wientjes, E., Douwstra, P., Trouwborst, G., Van Ieperen, W., Croce, R., et al. (2012). Photosynthetic quantum yield dynamics: from photosystems to leaves. Plant Cell 24, 1921–1935. doi: 10.1105/tpc.112.097972
Holmes, M. G., and Smith, H. (1975). The function of phytochrome in plants growing in the natural environment. Nature 254, 512–514. doi: 10.1038/254512a0
Jung, J. H., Domijan, M., Klose, C., Biswas, S., Ezer, D., Gao, M., et al. (2016). Phytochromes function as thermosensors in Arabidopsis. Science 354, 886–889. doi: 10.1126/science.aaf6005
Keuskamp, D. H., Pollmann, S., Voesenek, L. A., Peeters, A. J., and Pierik, R. (2010). Auxin transport through PIN-FORMED 3 (PIN3) controls shade avoidance and fitness during competition. Proc. Natl. Acad. Sci. 107, 22740–22744. doi: 10.1073/pnas.1013457108
Kong, Y., and Nemali, K. (2021). Blue and far-red light affect area and number of individual leaves to influence vegetative growth and pigment synthesis in lettuce. Front. Plant Sci. 12:667407. doi: 10.3389/fpls.2021.667407
Kozai, T., and Niu, G. (2020). “Role of the plant factory with artificial lighting (PFAL) in urban areas” in Plant factory. ed. T. Kozai (Cambridge, MA: Academic Press), 7–34.
Kubota, C., Chia, P., Yang, Z., and Li, Q. (2011). Applications of far-red light-emitting diodes in plant production under controlled environments. Greensys 2011, 59–66. doi: 10.17660/ActaHortic.2012.952.4
Lanoue, J., Leonardos, E. D., and Grodzinski, B. (2018). Effects of light quality and intensity on diurnal patterns and rates of photo-assimilate translocation and transpiration in tomato leaves. Front. Plant Sci. 9:756. doi: 10.3389/fpls.2018.00756
Legris, M., Ince, Y. Ç., and Fankhauser, C. (2019). Molecular mechanisms underlying phytochrome-controlled morphogenesis in plants. Nat. Commun. 10:5219. doi: 10.1038/s41467-019-13045-0
Li, Q., and Kubota, C. (2009). Effects of supplemental light quality on growth and phytochemicals of baby leaf lettuce. Environ. Exp. Bot. 67, 59–64. doi: 10.1016/j.envexpbot.2009.06.011
Lin, K. H., Huang, M. Y., Huang, W. D., Hsu, M. H., Yang, Z. W., and Yang, C. M. (2013). The effects of red, blue, and white light-emitting diodes on the growth, development, and edible quality of hydroponically grown lettuce (Lactuca sativa L. var. capitata). Sci. Hortic. 150, 86–91. doi: 10.1016/j.scienta.2012.10.002
Lysenko, V. S., Varduny, T. V., Simonovich, E. I., Chugueva, O. I., Chokheli, V. A., Sereda, M. M., et al. (2014). Far-red spectrum of second Emerson effect: a study using dual-wavelength pulse amplitude modulation fluorometry. Am. J. Biochem. Biotechnol. 10, 234–240. doi: 10.3844/ajbbsp.2014.234.240
Ma, G., Zhang, L., Kato, M., Yamawaki, K., Kiriiwa, Y., Yahata, M., et al. (2012). Effect of blue and red LED light irradiation on β-cryptoxanthin accumulation in the flavedo of citrus fruits. J. Agric. Food Chem. 60, 197–201. doi: 10.1021/jf203364m
Mahendra, P., and Bisht, S. (2011). Coriandrum sativum: a daily use spice with great medicinal effect. Pharm. J. 3, 84–88. doi: 10.5530/pj.2011.21.16
Min, Q., Marcelis, L. F., Nicole, C. C., and Woltering, E. J. (2021). High light intensity applied shortly before harvest improves lettuce nutritional quality and extends the shelf life. Front. Plant Sci. 12:615355. doi: 10.3389/fpls.2021.615355
Murakami, K., Matsuda, R., and Fujiwara, K. (2018). A mathematical model of photosynthetic electron transport in response to the light spectrum based on excitation energy distributed to photosystems. Plant Cell Physiol. 59, 1643–1651. doi: 10.1093/pcp/pcy085
Naznin, M. T., Lefsrud, M., Gravel, V., and Hao, X. (2016). Different ratios of red and blue LED light effects on coriander productivity and antioxidant properties. Acta Hortic. 1134, 223–230. doi: 10.17660/ActaHortic.2016.1134.30
Nguyen, D. T., Kitayama, M., Lu, N., and Takagaki, M. (2020). Improving secondary metabolite accumulation, mineral content, and growth of coriander (Coriandrum sativum L.) by regulating light quality in a plant factory. J. Hortic. Sci. Biotechnol. 95, 356–363. doi: 10.1080/14620316.2019.1677510
Park, Y., and Runkle, E. S. (2017). Far-red radiation promotes growth of seedlings by increasing leaf expansion and whole-plant net assimilation. Environ. Exp. Bot. 136, 41–49. doi: 10.1016/j.envexpbot.2016.12.013
Pierik, R., and De Wit, M. (2014). Shade avoidance: phytochrome signaling and other above-ground neighbour detection cues. J. Exp. Bot. 65, 2815–2824. doi: 10.1093/jxb/ert389
Ruberti, I., Sessa, G., Ciolfi, A., Possenti, M., Carabelli, M., and Morelli, G. (2012). Plant adaptation to dynamically changing environment: the shade avoidance response. Biotechnol. Adv. 30, 1047–1058. doi: 10.1016/j.biotechadv.2011.08.014
Samuolienė, G., Miliauskienė, J., Kazlauskas, A., and Viršilė, A. (2021). Growth stage-specific lighting spectra affect photosynthetic performance, growth, and mineral element contents in tomato. Agronomy 11:901. doi: 10.3390/agronomy11050901
Singleton, V. L., and Rossi, J. A. (1965). Colorimetry of total phenolics with phosphomolybdic-phosphotungstic acid reagents. Am. J. Enol. Vitic. 16, 144–158. doi: 10.5344/ajev.1965.16.3.144
Tan, T., Li, S., Fan, Y., Wang, Z., Raza, M. A., Shafiq, I., et al. (2022). Far-red light: a regulator of plant morphology and photosynthetic capacity. Crop J. 10, 300–309. doi: 10.1016/j.cj.2021.06.007
Tarakanov, I. G., Tovstyko, D. A., Lomakin, M. P., Shmakov, A. S., Sleptsov, N. N., Shmarev, A. N., et al. (2022). Effects of light spectral quality on photosynthetic activity, biomass production, and carbon isotope fractionation in lettuce, Lactuca sativa L., plants. Plants 11:441. doi: 10.3390/plants11030441
Terashima, I., Fujita, T., Inoue, T., Chow, W. S., and Oguchi, R. (2009). Green light drives leaf photosynthesis more efficiently than red light in strong white light: revisiting the enigmatic question of why leaves are green. Plant Cell Physiol. 50, 684–697. doi: 10.1093/pcp/pcp034
Urbonavičiūtė, A., Pinho, P., Samuolienė, G., Duchovskis, P., Vitta, P., Stonkus, A., et al. (2007). Effect of short-wavelength light on lettuce growth and nutritional quality. Sodin. Darž. 26, 157–165.
Van Brenk, J. B., Courbier, S., Kleijweg, C. L., Verdonk, J. C., and Marcelis, L. F. (2024). Paradise by the far-red light: far-red and red ratios independently affect yield, pigments, and carbohydrate production in lettuce, Lactuca sativa. Front. Plant Sci. 15:1383100. doi: 10.3389/fpls.2024.1383100
Wang, Y., Zhang, H., Zhao, B., and Yuan, X. (2001). Improved growth of Artemisia annua L. hairy roots and artemisinin production under red light conditions. Biotechnol. Lett. 23, 1971–1973. doi: 10.1023/A:1013786332363
Waterhouse, A. L. (2002). Determination of total phenolics. Curr. Protoc. Food Anal. Chem. 6:I1. doi: 10.1002/0471142913.fai0101s06
Zhen, S., and van Iersel, M. W. (2017). Far-red light is needed for efficient photochemistry and photosynthesis. J. Plant Physiol. 209, 115–122. doi: 10.1016/j.jplph.2016.12.004
Keywords: artificial lighting, light spectrum, cilantro, morphological changes, phytochemical content, shelf life
Citation: Akter N, Cammarisano L, Taylor G, Naznin MT, Verdonk JC and Ahamed MS (2024) Impact of light spectral combinations on morphology, yield, and quality of indoor-grown cilantro. Front. Sustain. Food Syst. 8:1499954. doi: 10.3389/fsufs.2024.1499954
Edited by:
José Pinela, Instituto Nacional de Investigação Agrária e Veterinária (INIAV), PortugalReviewed by:
Costanza Ceccanti, University of Pisa, ItalyLauria Giulia, University of Pisa, Italy, in collaboration with reviewer CC
Damiano Remorini, University of Pisa, Italy
Hafsa El Horri, University of Pisa, Pisa, Italy, in collaboration with reviewer DR
Copyright © 2024 Akter, Cammarisano, Taylor, Naznin, Verdonk and Ahamed. This is an open-access article distributed under the terms of the Creative Commons Attribution License (CC BY). The use, distribution or reproduction in other forums is permitted, provided the original author(s) and the copyright owner(s) are credited and that the original publication in this journal is cited, in accordance with accepted academic practice. No use, distribution or reproduction is permitted which does not comply with these terms.
*Correspondence: Md Shamim Ahamed, bWFoYW1lZEB1Y2RhdmlzLmVkdQ==
 Nazmin Akter
 Laura Cammarisano
 Gail Taylor
 Most Tahera Naznin
 Julian C. Verdonk
 Md Shamim Ahamed