- 1College of Economics and Management, Henan Agricultural University, Zhengzhou, China
- 2School of Politics and Public Administration, Zhengzhou University, Zhengzhou, China
- 3Business School, Zhengzhou University, Zhengzhou, China
- 4College of Geography and Environmental Science, Henan University, Kaifeng, China
Understanding the cycle of carbon emissions resulting from agricultural practices is critical for evaluating their effect on environmental quality. This study investigates the influence of corn production on environmental quality across six major corn producing provinces in China: Hebei, Heilongjiang, Henan, Hubei, Shandong, and Sichuan, using panel datasets spanning from 1990 to 2022. Utilizing a robust methodological framework and advanced econometric techniques such as the Panel Mean Group Autoregressive Distributed Lag model (PMG-ARDL), Panel Quantile Regressions (PQR), Panel Least Square regression (PLSR), this study offers a comprehensive analysis of both short-term and long-term impacts of several agricultural inputs, agricultural GDP, and temperature on environmental quality. The findings reveal significant long-term contributions to carbon emissions from the use of agricultural water, agricultural credit, and fertilizers use, indicating the environmental costs associated with intensive agricultural practices. The study shows carbon emissions have a long-term negative relationship with corn production. The results from the PMG-ARDL model are consistent with those obtained from the PQR, and PLSQR analyses, demonstrating strong positive correlations between agricultural loans, fertilizer use, agricultural water usage, and carbon emissions. The Dumitrescu and Hurlin results show unidirectional causation of carbon emissions from pesticide use, temperature, and agricultural GDP, and bidirectional causal relationship between carbon emissions, corn production, fertilizer use, agricultural water usage, and agricultural credit. The study underscores the critical need for policies that balance agricultural productivity with environmental quality, suggesting directions for future research to explore diverse agricultural systems and incorporate more dynamic modeling approaches to better understand and mitigate the environmental impacts of agriculture.
1 Introduction
Agricultural production systems play a critical role in the global economy, providing food for billions of people. However, these systems also contribute significantly to greenhouse gas (GHG) emissions, accounting 34% of worldwide emissions (Crippa et al., 2021). The shift from traditional to modern farming practices has increased reliance on fossil fuels due to advancements in land use and the adoption modern irrigation equipment (Khan et al., 2021; Dagar et al., 2020). As a result, agriculture now contributes about 30% of global GHG emissions (Fox et al., 2019; Maraseni et al., 2018), leading to a worldwide temperature increase of 1.1°C over the past decade (Ahmad et al., 2024; Nathaniel, 2021). The rapid growth of global GDP, increasing by 8.1% annually from 1961 to 2013, has also significantly increased CO2 emissions, with human activities responsible for 50% of this increase in recent decades (Shuai et al., 2018; Picano et al., 2022). It is crucial to address these challenges, as one of the sustainable development goals is to reduce CO2 emissions and ensure a healthier living environment for both current and future populations by 2030 (Murshed and Alam, 2021; Rehman et al., 2019).
China plays a crucial role in global agriculture, accounting for a quarter of the world's grain output and providing sustenance for a fifth of the global population (World Bank, 2020; FAOSTAT, 2020). China has experienced an annual growth rate of 4.6% in agricultural GDP since 1970 (Li et al., 2023; Yang et al., 2022). With the global population projected to reach 9.8 billion by 2050, the demand for food is expected to increase significantly (FAO, 2016). Maize, a staple grain and cash crop, is the world's second-largest cultivated crop (FAO, 2019). China is a major producer of maize, cultivating it across 43.4 million hectares in 2021, which accounts for 21.1% of the global maize cultivated area and contributes 23% of the world's maize production (FAOSTAT, 2023; FAO, 2021). Over the past two decades, China's maize production has seen a substantial increase, rising from 106 million tons to 273 million tons, representing a remarkable growth of 157.2% (NBSC, 2022). Maize production has been identified as a significant source of CO2 emissions due to the extensive fertilizer use and irrigation demands (Ullah et al., 2021; Rehman et al., 2020). The carbon emissions from maize production are particularly more carbon intensive than those wheat and rice production in China (Wang et al., 2020).
Advanced agricultural technologies have increased grain output in China, but they have also led to higher CO2 emissions, particularly in maize production (Chandio et al., 2023). This is mainly due to the adoption of modern agricultural technologies in the country. Approximately 55% of the country's agricultural output comes from progressive agricultural methods that optimize the use of pesticides, water, fossil fuels, and fertilizers (Ullah et al., 2021). Between 1993 and 2007, more than 49% of greenhouse gas (GHG) emissions in China were sourced from agricultural activities, a significant increase compared to the global average of 16.7% (FAOSTAT, 2020).
China also uses over 65% of its freshwater resources for agriculture and has a water usage efficiency of only 32%, a stark contrast to the global agricultural water consumption rate of 70% (Li et al., 2021; FAO, 2016). Fossil fuel-reliant irrigation plays a role in CO2 emissions in China's maize-producing regions (Li and Yin, 2024), and inefficient water management contributes to both water wastage and carbon emissions (Anser et al., 2020). Similarly, nitrogen fertilizers are a major source of agricultural CO2 emissions (Shao, 2024). The excessive use of fertilizer, with limited regulation, contributes to higher CO2 emissions (Rehman et al., 2019). In fact, the use of chemical fertilizers has increased, with China producing 70.37 million tons of fertilizers, of which 59.12 million tons were used in agriculture in 2013 (Sharma et al., 2021; Tewatia and Chanda, 2017).
Moreover, the environmental impact of maize production in China is notably high, with CO2 emissions reaching 621 kg CO2-eq per metric ton, surpassing emissions reported in other major maize-producing countries such as Germany (420 kg CO2-eq Mg−1) and the USA (231 kg CO2-eq Mg−1) (Chen et al., 2014; Forte et al., 2017; Grassini and Cassman, 2012). Figure 1 illustrates the trends in corn production and carbon emissions from 1990 to 2022 in China's major corn producing regions. The spatial distribution and temporal trends of annual corn production and carbon emissions are analyzed over three time periods: 1990–2000, 2001–2010, and 2011–2022. In each period, corn production shows an upward trend across most regions. By the 2011–2022 period, Shandong, Henan, and Sichuan stand out as regions with the highest emissions, indicating a direct relationship between rising corn production and increased carbon output. This highlights the environmental impact of agricultural growth in China, suggesting that while corn production has significantly increased to meet food demands, it has also contributed to higher carbon emissions. The per capita carbon emissions from Chinese agricultural sector have climbed significantly from 3 metric tons to 7.20 metric tons over the last 20 years (Banerjee and Murshed, 2020; Xu and Lin, 2017).
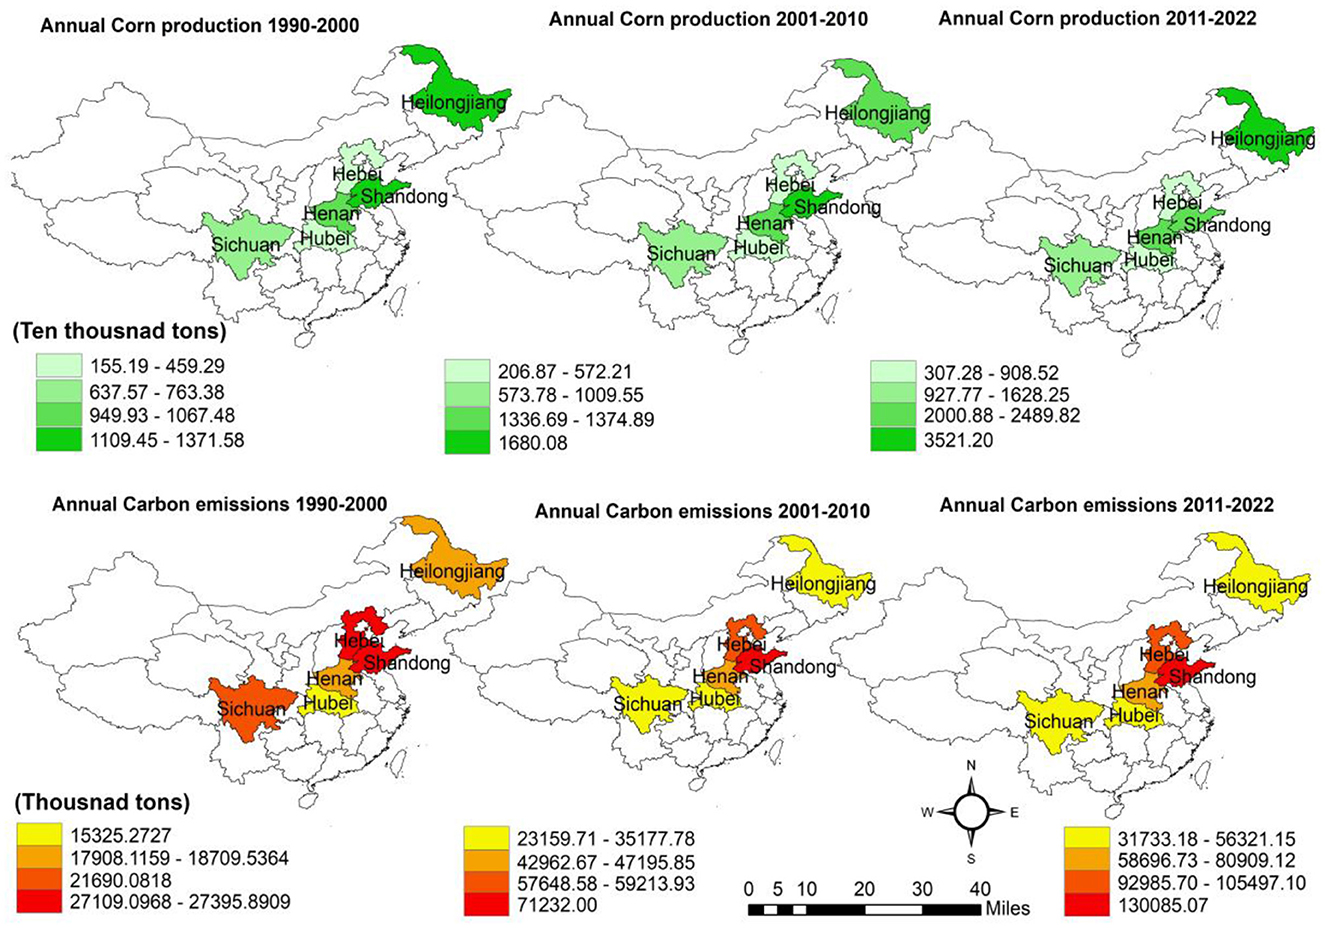
Figure 1. Trends of corn production and carbon emissions in China over the last three decades (source: authors calculation).
The growing use of agricultural inputs to enhance productivity has had a negative impact on the quality of the environment (Aiello et al., 2018; World Bank, 2020). Forecasts indicated that by 2023, worldwide CO2 emissions would reach to total 36.8 billion tons, with China expected to lead with emissions of 11.0 Gt, outpacing the United States, the European Union, India, and Brazil over the past 30 years (Zhu and Huo, 2022; Global Carbon Emissions, 2023; Mele and Magazzino, 2020). Specifically, China's farming industry accounted for 7% of its overall carbon emissions (Environmental Protection Agency [EPA], 2022).
Given these trends, the Intergovernmental Panel on Climate Change (IPCC) emphasized the necessity of cutting carbon emissions to cap global temperature rises at 1.5°C (IPCC, 2018). Similarly, the Food and Agriculture Organization (FAO) has advised an 80% to 88% reduction in emissions from agriculture by altering farming methods and switching to renewable energy sources (Reynolds and Wenzlau, 2012). As the principal global contributor of greenhouse gases, China has committed to significant emission reductions by 2030 and aims for carbon neutrality by 2060, a goal announced during the 75th United Nations General Assembly (Zhu and Huo, 2022). Supporting this goal, China's Ministry of Agriculture and Rural Affairs has published guidelines promoting sustainable agricultural practices from 2018 to 2030 (Shen et al., 2020). This initiative has led to a reduction in chemical fertilizer use from 70.37 million tons to 52.51 million tons over the last 10 years (Li et al., 2021). Although China's carbon emissions increased steadily from 1996 to 2016, they have since fallen by 49.6%, from 0.127 kg per yuan to 0.064 kg per yuan in 2016 (Huang et al., 2019). Further emission reductions in agriculture are being pursued through the introduction of intermittent irrigation in agricultural fields (Dong et al., 2018), the utilization of slow-release fertilizers (Hillier et al., 2009), and the adoption of straw return techniques to improve soil fertility and lower carbon outputs (Zhang J. et al., 2019; Zhang C. et al., 2019).
Previous studies have explored the relationship between agricultural practices and carbon emissions. Crippa et al. (2021) and Qin et al. (2024) found that high-input agricultural systems contribute significantly to global CO2 emissions due to intensive use of energy, fertilizers, and irrigation. Zhang et al. (2022) and Li et al. (2021), revealed that agricultural intensification in major crop-producing areas has markedly increased CO2 emissions over the past three decades. Additionally, research on maize production, a significant source of CO2 emissions in China, has highlighted the extensive use of fertilizers and irrigation as major contributors (Ullah et al., 2021; Rehman et al., 2020). Wang et al. (2020), further highlighted the carbon intensity of maize production relative to other crops. The role of agricultural credit in CO2 emissions has also been analyzed, showing that financial resources can promote high-input farming practices that, while productive, increase emissions (Koondhar et al., 2021a; Onyeneke et al., 2024). However, a notable gap exists in understanding the specific environmental impacts of maize production in China, particularly the combined effects of agricultural credit, water usage, climate change, and agricultural GDP. Previous studies tend to focus on broad agricultural practices or individual inputs, without isolating the contributions of specific staple crops like maize. Moreover, limited attention has been paid to the nuanced interactions between climate change and CO2 emissions in the context of China's maize production. Climate change exacerbate emissions as farmers adopt high-input practices to increase yields. Demirhan (2020) and Chandio et al. (2023) noted that temperature increases and climate change correlate with higher CO2 emissions due to increased fertilizer and irrigation use. The relationship between agricultural GDP and CO2 emissions is found complex. For example, Huang et al. (2019) found that higher agricultural GDP correlates with increased emissions in China's maize sector, while Wang and Zhang (2021) investigated that rising GDP could support sustainable practices, underlining the need for policies to balance economic growth and environmental health. Fox et al. (2019) and Maraseni et al. (2018) discussed the overall contribution of agriculture to GHG emissions but did not disaggregate the data to consider the impact of specific crops. This leaves a critical gap in our understanding of how staple crops like maize, which is heavily cultivated in China, contribute to CO2 emissions.
Furthermore, studies that do focus on maize production often overlook the complex interactions between different agricultural inputs and CO2 emissions. For instance, Zhang et al. (2022) examined the environmental impact of maize production in China but did not fully explored how variables like agricultural credit, temperature changes, and regional agricultural GDP might influence environmental quality in context of carbon emissions. This is a significant gap, as these factors can have substantial effects on both the scale and intensity of agricultural activities, thereby affecting environmental outcomes. This study focuses on the environmental impacts of maize production, particularly the use of fertilizers, pesticides, and water, which contribute to increased carbon emissions. Although previous research has focused on how agricultural inputs affect productivity, however, there still remains a lack of analysis concerning their effects on carbon emissions. Koondhar et al. (2021b) explored the effects of fertilizer use on cereal crop yields and carbon emissions; however, this study differs by concentrating on maize production and considering multiple influencing factors, including the use of pesticides and fertilizers, consumption of agricultural water, availability of agricultural credit, impacts of climate change, and the effect of agricultural GDP on carbon emissions. In fact, previous studies have explored the impact of irrigated land on agricultural productivity and the connection between water energy use, management practices, and carbon emissions. However, the link between agricultural water use and carbon emissions have not been extensively studied, and this study aims to address this gap. Additionally, this research examines the relationship among climate change, particularly temperature fluctuations, and carbon emissions, which has been underexplored in previous literature.
This study seeks to address these gaps by examining the environmental impacts of maize production in China by focusing on a comprehensive set of variables, including fertilizer use, agricultural water consumption, pesticide usage, agricultural credit, temperature, and agricultural GDP. By exploring these variables collectively, this study aims to contribute new insights into sustainable agricultural practices and provide targeted recommendations for balancing productivity with environmental protection.
The remainder of this paper is organized as follows: Section 2 introduces the Research Methods; Section 3 represents the results; Section 4 discusses findings; and Section 5 concludes with suggestions and policy measures.
2 Methodology
2.1 Conceptual framework
The environmental impact of agriculture is influenced by several factors, including the use of fertilizers, pesticides, irrigation, and credit availability, which can drive both direct and indirect carbon emissions (Shao, 2024). This study is anchored in the theory that modern agricultural practices, while boosting productivity, can lead to significant environmental externalities, particularly in the form of greenhouse gas (GHG) emissions. Drawing on resource-based theory, this study examines how agricultural inputs such as fertilizers, pesticides, water, and credit impact CO2 emissions. The theory posits that efficient resource use can mitigate environmental degradation, while overuse or inefficient practices tend to amplify carbon emissions (Rehman et al., 2019).
Furthermore, climate change impact suggests that temperature fluctuations directly and indirectly influence crop yields and agricultural practices, which, in turn, affect CO2 emissions (Demirhan, 2020). This study also considers the sustainability and development theory to evaluate the balance between agricultural growth and environmental sustainability, exploring whether economic gains can coexist with reduced carbon emissions.
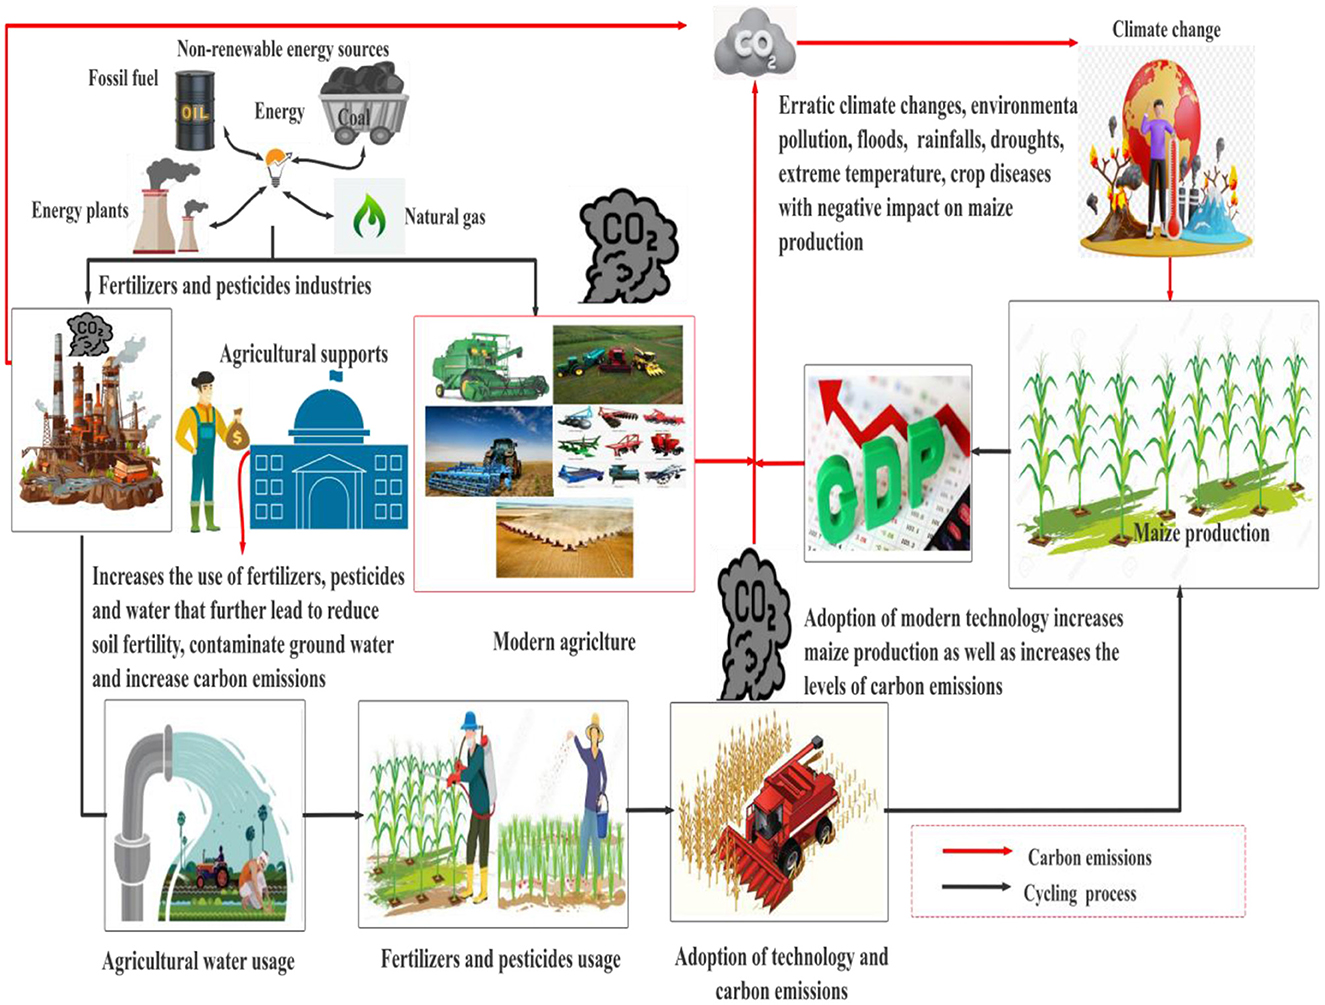
Figure 2 represents a cyclic process where agricultural practices designed to enhance productivity simultaneously drive carbon emissions. This cyclic process illustrates the complex association between agricultural practices, carbon emissions, and the environmental impact on maize production. The consumption of fossil fuels has increased across those producing fertilizers and pesticides. These industrial activities emit significant levels of carbon dioxide (CO2) in the environment. The emissions cycle connects to climate change and contribute to erratic climate patterns, including extreme temperatures, floods, droughts, and crop diseases.
Furthermore, agricultural support systems, government and institutional funding, promote modern agricultural practices through financial assistance to farmers. This support encourages farmers to increase the use of fertilizers, pesticides, and water, all of which are essential for high-yield farming. As a result, the excessive use of agricultural inputs can reduce soil fertility, contaminate groundwater, and further increase carbon emissions.
Modern agriculture involves advanced machinery and technologies that enhance maize productivity, as well as agricultural GDP. However, this productivity boost comes at an environmental cost, as the adoption of modern agricultural technology also leads to higher CO2 emissions. These emissions contribute to climate change, which in turn impacts crop yields. The red arrows represent the flow of carbon emissions through various processes, while the black arrows indicate the cycling of resources and environmental impact, emphasizing the interconnectedness between agricultural productivity, carbon emissions, and environmental sustainability.
2.2 The data
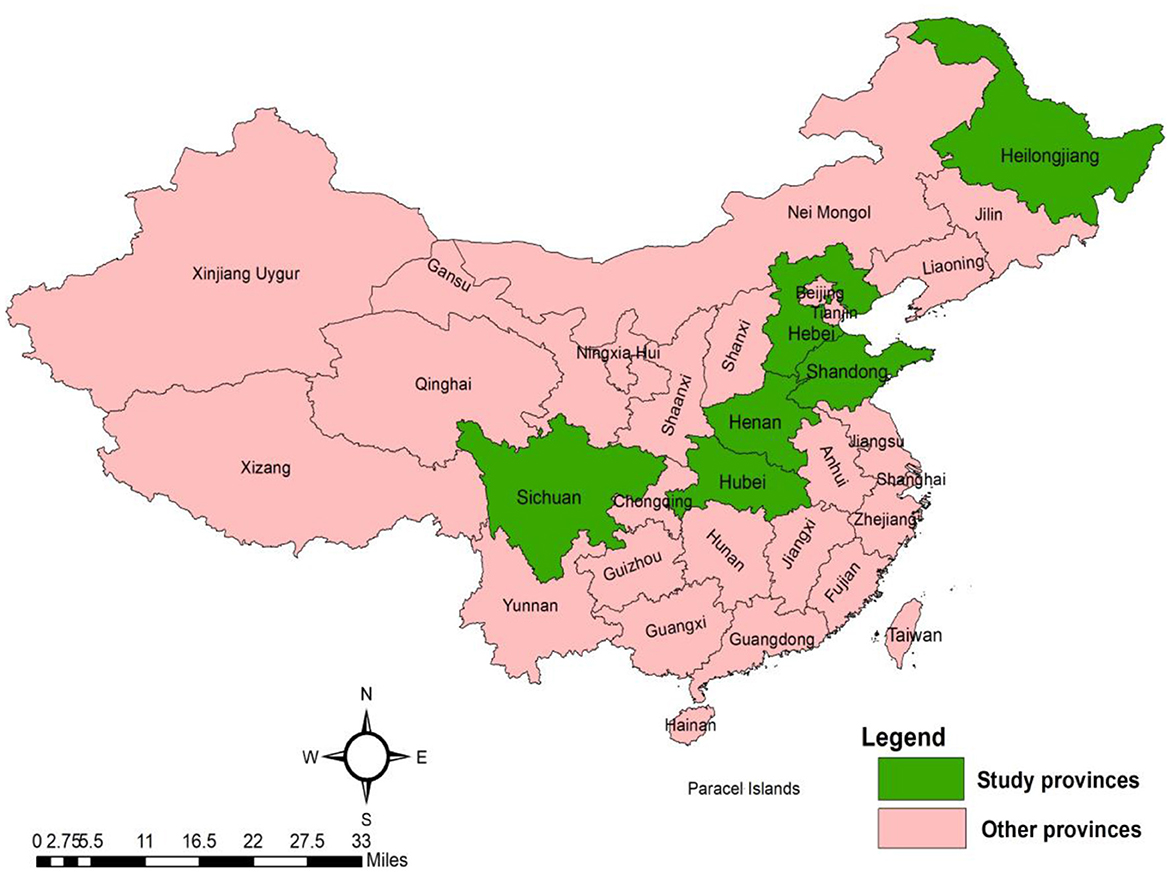
The study analyzes panel data from six major corn-producing provinces in China: Hubei, Sichuan, Henan, Heilongjiang, Hebei and Shandong as shown in Figure 3. The main goal is to evaluate the impact of maize productivity along with various influencing factors including pesticides use, fertilizers use, agricultural water usage, agricultural credit, climate Change, and agricultural gross domestic product (AGDP), all impact CO2 emissions. The data used in this study was derived from the China Agricultural Statistical Yearbook (CASY) for the years 1990 to 2022.1 Temperature records were obtained from models processed by Cubic Data Academy, which utilized baseline data from the National Oceanic and Atmospheric Administration's National Centers for Environmental Information (NCEI) (https://www.ncei.noaa.gov/data/global-summary-of-the-day/archive/) which offers highly accurate daily meteorological data from observation stations. These data are further processed by Cubic Data Academy to produce national temperature datasets, widely recognized for their reliability in climate studies. To address missing data within the panel datasets, we applied a meticulous mean imputation method, selected for its appropriateness given the nature and pattern of the missing data. The integrity of our results was validated through sensitivity analysis, which explored how different imputation methods and assumptions about missing data might affect our findings, detailed in Table 1. CO2 emissions were estimated based on historical terminal energy consumption data, as the primary emissions are generally linked to fossil fuel combustion (IPCC, 2007). Following methodologies from Li and Yin (2024) and Jiehua and Zhang (2020), our calculation for total CO2 emissions included nine energy sources, arranged in the following order: diesel, natural gas, coal, electricity, gasoline, kerosene, coke, crude oil, and fuel oil, as used in the following equation.
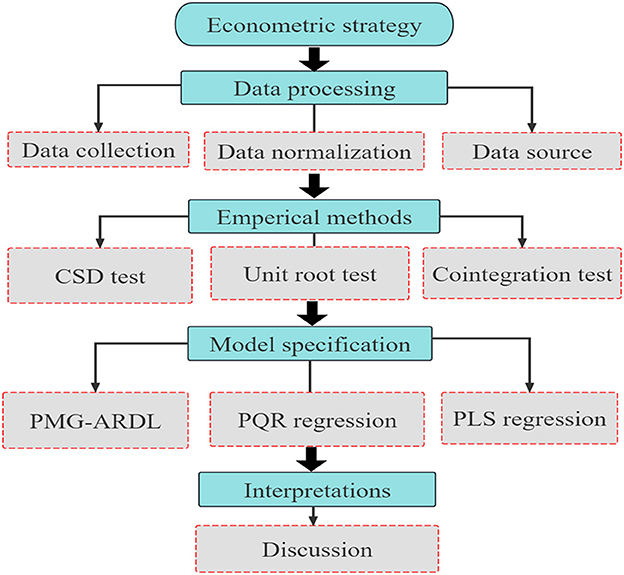
Cit signifies the total carbon emissions of province i in year t; Eijt denotes the usage of the jth type of energy in province i in year t; ηj signifies the carbon emission coefficient of the jth type of energy; i represents the province i; j represents the jth energy source. Since the original data on energy consumption is presented in physical quantities, necessitating conversion into standard statistical units to compute carbon emissions accurately. The conversion factors for these emissions are derived from the “2006 IPCC Guidelines for National Greenhouse Gas Inventories.” These factors take into account the average lower heating values and established carbon emission factors for each energy type. The calculated carbon emission coefficients for the nine energy types—coal, gasoline, diesel, natural gas, kerosene, fuel oil, crude oil, electricity, and coke—are 1.9003 kg-CO2/kg, 2.8604 kg-CO2/kg, 3.0202 kg-CO2/kg, 2.9251 kg-CO2/kg, 3.0179 kg-CO2/kg, 3.0959 kg-CO2/kg, 3.175 kg-CO2/kg, 2.1622 kg-CO2/m3, and 0.801 kg-CO2/kWh, respectively. The econometric approaches used in the empirical analysis are outlined in Figure 4.
3 Model specification and econometric approaches
To investigate the relationship between CO2 emissions and maize crop production (CP), we incorporated key factors including the pesticides use (PU), fertilizers use (FU), agricultural water use (AW), agricultural credit (AC), temperature (TM), and agricultural gross domestic product (AGDP). To analyze how these variables interact, the proposed model can be described as follows:
The comprehensive and logarithmic form of equations are given as:
where LCE is logarithm of CO2 emissions; LCP represents the natural log of corn production; LPU is the natural log of pesticide usage; LFU stands for the natural log of fertilizer application; LAW indicates the natural log of agricultural water consumption; LAC represents the natural log of agricultural credit; LTM denotes the natural log of temperature; and LAGD corresponds to the natural log of agricultural gross domestic product (AGDP) for each region; t specifies the time variable in the panel, while i refers to the entity's dimension.
We employed panel unit root tests to ensure stationarity, Cross-Sectional Dependence (CSD), and slope homogeneity using the Cross-sectionally Augmented Im, Pesaran, and Shin (CIPS) approach (Pesaran, 2015, 2006), as outlined in the following equations:
Where N represents the total number of observations in the dataset, n denotes an independent variable; v(T, n) is a complex term, and SW refers to Swami's statistical measure.
Second-generation unit root tests (Im et al., 2003) and cross-sectional dependence test (Pesaran and Yamagata, 2008) by using the following equation:
Where denotes the cross-sectional averages. The CIPS (Cross-sectionally Augmented Dickey-Fuller) results are derived using the following equation:
We also utilized second-generation panel co-integration tests (Persyn and Westerlund, 2008) by using the following equation:
The PMG-ARDL (Panel Mean Group Autoregressive Distributed Lag) was employed, proposed by Shin et al. (2014) for analyzing the short-term and long-term outcomes (Shin et al., 2014; Ma et al., 2024a; Tiwari et al., 2023; Wang et al., 2023; Ye et al., 2023). The mathematical formulation of the model is given as:
Where Xit is dependent variable at time t for panel unit i; and Xi represents a vector of independent variables. (Xi)t−l Shows dependent variable's lagged values (Xi) at time t − 1; (Zi)t−l is independent variable (Zi) lagged values at time t − 1; πil and ξil are dependent and independent variables lagged values coefficients, respectively; the error terms is shown by εit. Following equation is employed to estimate the long and short run impact.
Finally, we used the Dumitrescu and Hurlin (2012) panel causality test to investigate the relationships among the variables by using following model:
Where sn denotes the lag length for the variables, represents the autoregressive constraint, and is the slope constant.
In this study, all regression analyses and simulations were conducted using Stata 17. This software is particularly well-suited for implementing the various econometric techniques.
4 Results and discussion
4.1 Descriptive summary
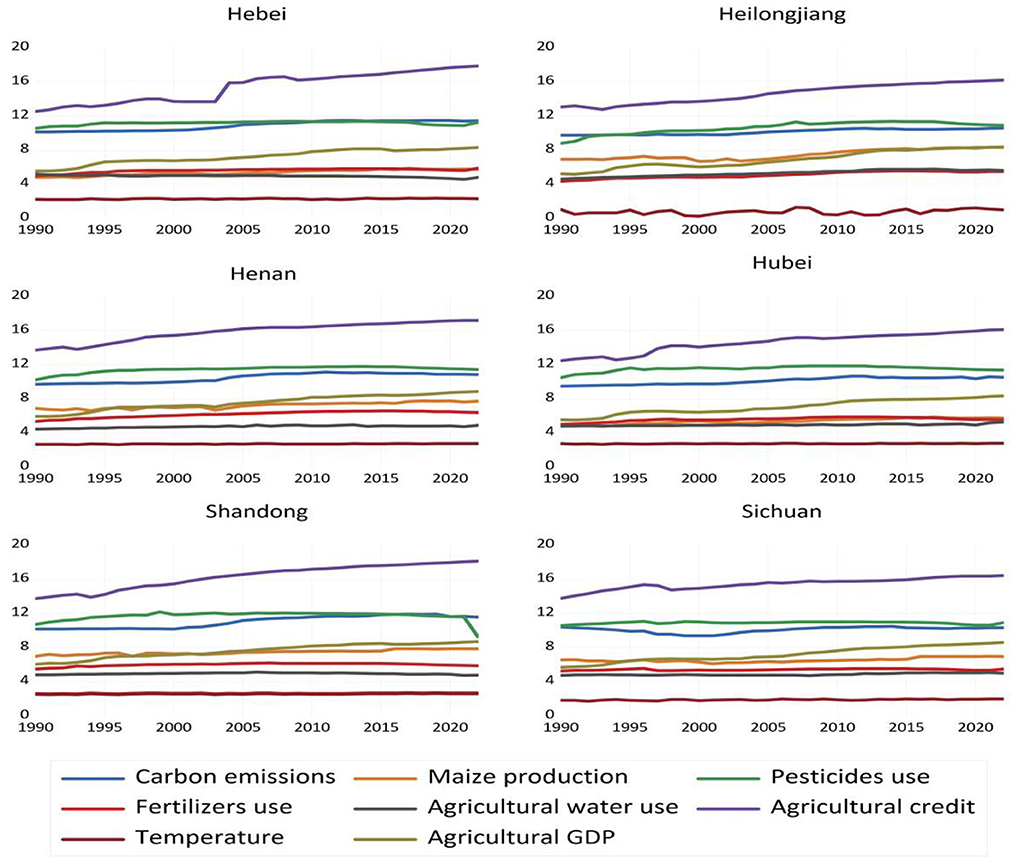
Table 2 presents a wide range between the minimum and maximum values of variables, suggesting the presence of outliers—data points that significantly differ from the overall trend when displayed in their logarithmic forms. Low standard deviation values suggest that the data points are closely grouped around their means, indicating that the dataset is stable and shows little variation from the average. Many of the variables display negative skewness, which points to an asymmetry that leans to the left, with a higher concentration of values toward the upper end of the scale. Kurtosis measures how the tails of a distribution compare to those of a normal distribution, where positive kurtosis indicates heavier tails and a sharper peak. Higher kurtosis values reflect more pronounced peaks and heavier tails, while lower values suggest a flatter distribution with lighter tails. The results of the Jarque-Bera (JB) test reveal that the data distribution is asymmetrical and deviates from the classic bell shape of a normal distribution, indicating variations in skewness and kurtosis. Figure 5 displays the logarithmic transformations of the variables examined across the provinces from 1990 to 2022. Table 3 presents the results of the correlation analysis, demonstrating strong positive relationships between CO2 emissions and the various independent variables examined in the study.
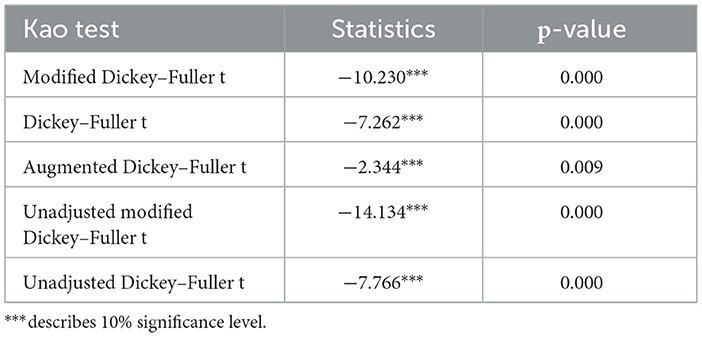
The results in Table 4 confirm the presence of cross-sectional dependence (CSD), indicating that standard shocks affect the variables across the specified provincial group. Table 5 presents the findings of second-generation unit root tests, including the CIPS and CADF test statistics for both level and first difference specifications. According to the results of the CIPS test, variables such as carbon emissions, fertilizer use, agricultural water usage, agricultural credit, and temperature are stationary at the level, whereas corn production, pesticide use, and agricultural GDP reach stationarity at the first difference. The CADF test results show that all variables except for LTM are stationary at the first difference. Table 6 displays Kao cointegration results, which shows a significant long-term relationship among the variables in our model. Co-integration tests are essential for investigating long-term relationships among variables (Gengenbach et al., 2006).
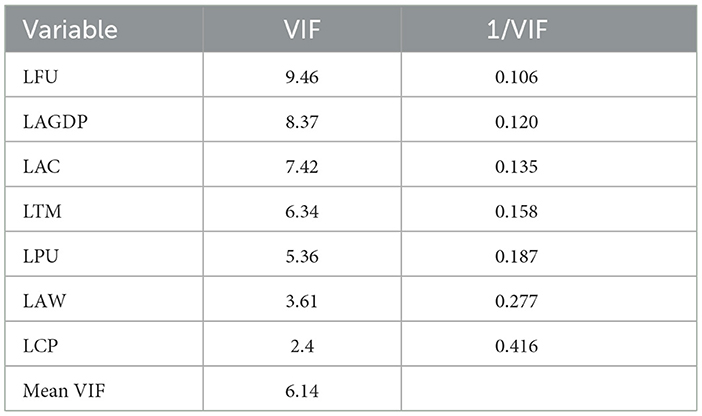
Before conducting the multiple regression analysis, the several diagnostic tests were employed to ensure the validity of results. Multicollinearity was assessed using the Variance Inflation Factor (VIF), with all values found to be below 10 as shown in Table 7, indicating no econometric issues (Wooldridge, 2009). Additionally, the Breusch-Pagan/Cook-Weisberg test was conducted to check for heteroskedasticity, which can lead to an underestimation of the intercept and an overestimation of the slope coefficients (Street, 2003). The results showed no evidence of heteroskedasticity, as the p-value was >0.05, confirming that the variance of the residuals was constant (Table 8). The Wooldridge test was employed to test for autocorrelation, and the results indicated its presence in the panel data, as the p-value (0.0006) was below 0.05, leading to the rejection of the null hypothesis (Table 9). To address this issue, the PMG-ARDL model and dynamic panel models were used, ensuring the autocorrelation was accounted for and reliable results were obtained.
4.2 Discussion
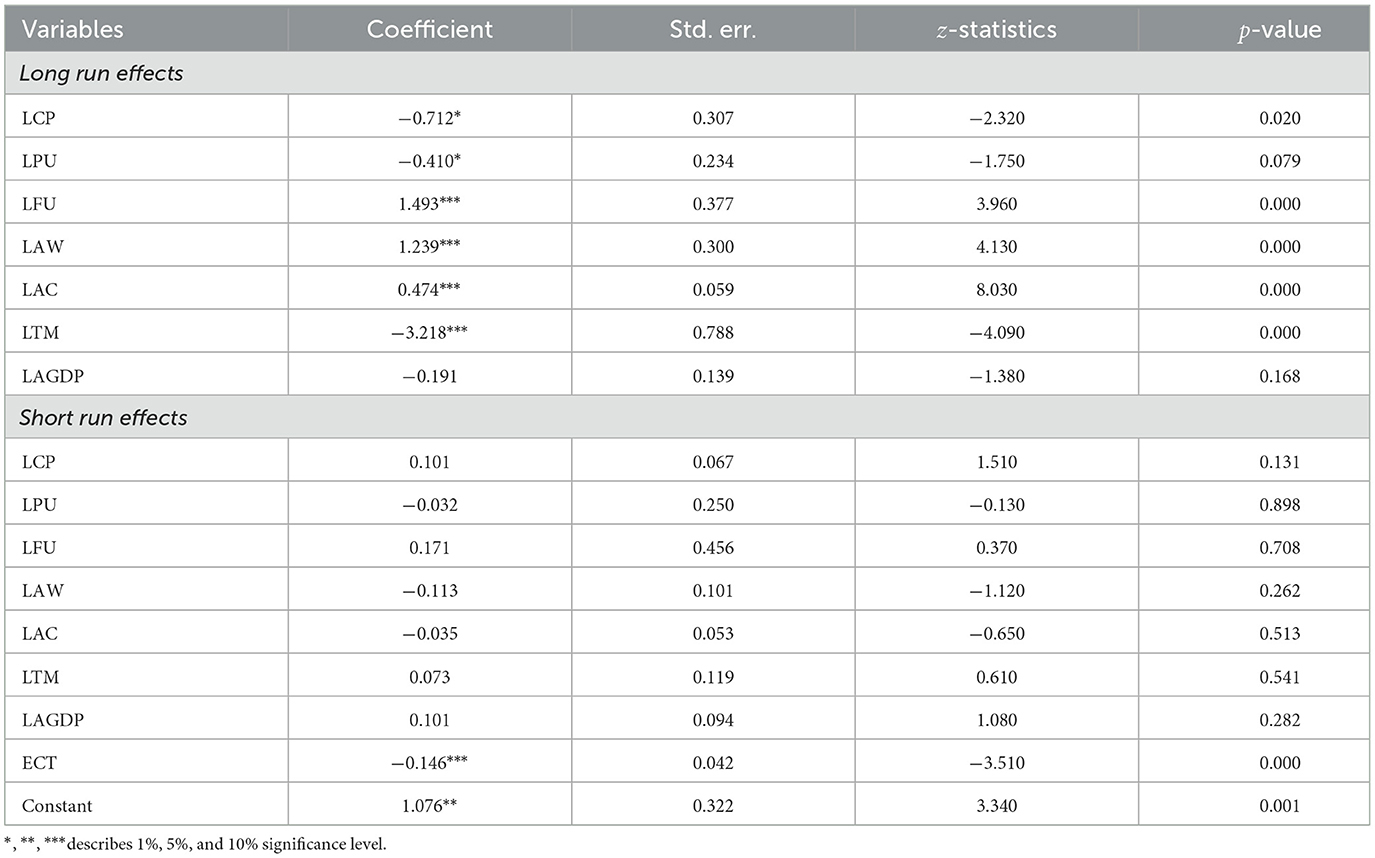
Table 10 presents the PMG-ARDL results, which show that the use of fertilizers, agricultural water, and agricultural credit significantly contribute the increase in CO2 emissions over the long term. Specifically, a one-unit increase in fertilizer use, agricultural water consumption, and agricultural credit corresponds to increases in CO2 emissions of 1.49, 1.23, and 0.47 units, respectively, in the long run. It is important to note that the effects of fertilizer and agricultural water usage are more substantial compared to other variables in the model. In contrast, corn production, pesticide use, temperature, and agricultural GDP show a negative relationship with CO2 emissions in the long term. Additionally, agricultural water use and agricultural credit positively impact CO2 emissions significantly, while corn productivity also correlates positively with CO2 emissions. In the short term, increases in corn production, fertilizer use, and agricultural GDP each contribute to significant environmental degradation, resulting in respective increases in CO2 emissions of 10%, 17%, and 10%, respectively. Furthermore, the Error Correction Term (ECT) is notably negative, which indicates strong support for the model's validity. This suggests that the model adjusts quickly toward equilibrium, with an adjustment speed of 15%. This rapid adjustment underscores the model's effectiveness in reflecting short-term deviations from long-term equilibrium.
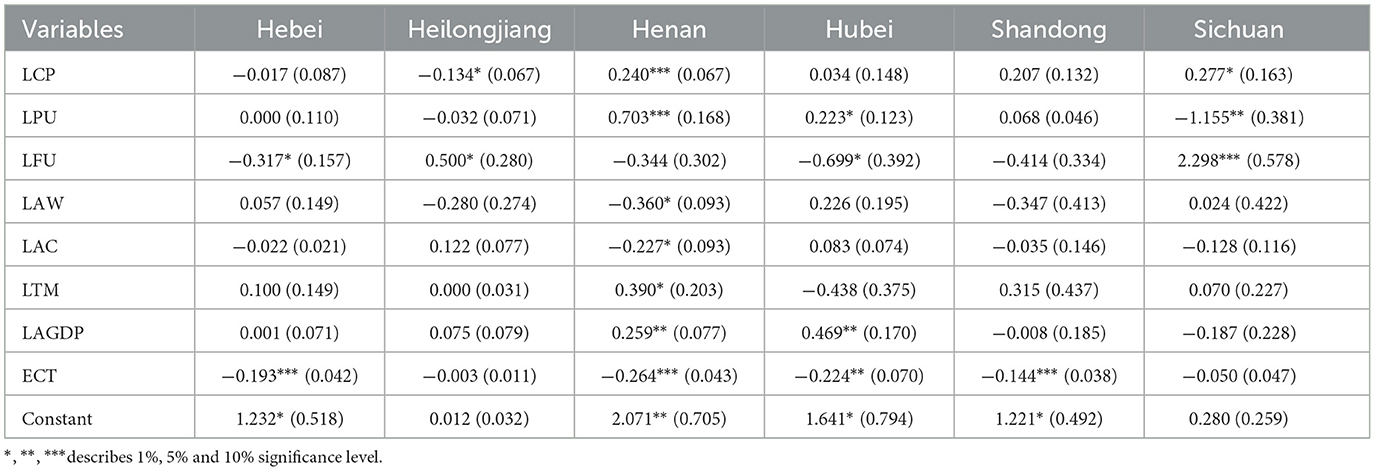
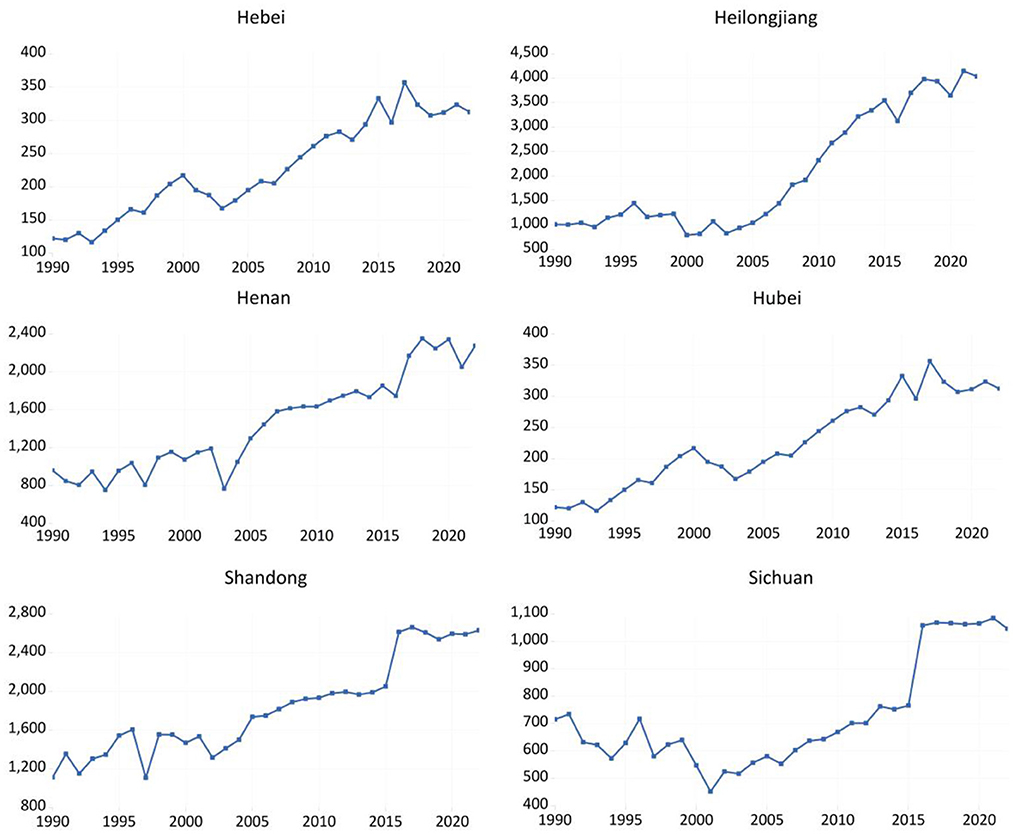
The findings from Table 11 display the PMG-ARDL short-term analysis results across provinces (the long-term results remain same as shown in Table 10). In the short term, corn production notably increases CO2 emissions in Henan and Sichuan provinces, which are major corn-producing regions with high pesticide use and agricultural water consumption, both contributing to increased emissions. In contrast, in Heilongjiang province, corn production has a negative impact on CO2 emissions. This difference may be attributed to factors such as urbanization in Northeast China, which has led to a shift of rural laborers to non-agricultural sectors. This shift has promoted increased mechanization in agriculture, enhancing agricultural efficiency and potentially reducing carbon emissions associated with inputs like pesticides and fertilizers. The flat terrain of the Heilongjiang Plain, along with its high level of mechanization in grain production, may also help mitigate emissions. Furthermore, fertilizer usage significantly contributes to increased CO2 emissions in both Heilongjiang and Sichuan provinces. Agricultural water consumption drives CO2 emissions in Hubei and Sichuan, while agricultural credit is linked to higher emissions in Heilongjiang and Hubei. Changes in temperature due to climate change generally raise carbon emissions across all examined provinces, except Hubei. Agricultural GDP is positively correlated with carbon emissions in all provinces, except Shandong and Sichuan. Additionally, Figures 6, 7 illustrate trends in pesticide use, fertilizer use, agricultural water consumption, agricultural credit, a temperature, and agricultural GDP over the period 1990 to 2022 across the studied provinces. Figure 8 illustrates the annual corn production in six major corn-producing provinces in the study from 1990 to around 2022. The trends suggest that most provinces have experienced overall growth in corn production over the past few decades, with varying degrees of stability or slight declines after reaching peak levels in recent years. Differences in peak times and fluctuations among provinces may be due to factors such as regional climate conditions, government policies, technological advancements, and investment in agricultural infrastructure. Figure 9 illustrates the share of CO2 emissions by sector in the world and China. The power sector is the largest contributor, accounting for 57% of total emissions, industrial sector at 26% and agricultural sector contribute to 1% share in total carbon emissions from energy use in China in 2022 (Statista, 2024). Globally, the power sector contributes 28% of total emissions, industrial sector at 23% and agricultural sector contribute to 17% share in total carbon emissions (IEA, 2022).
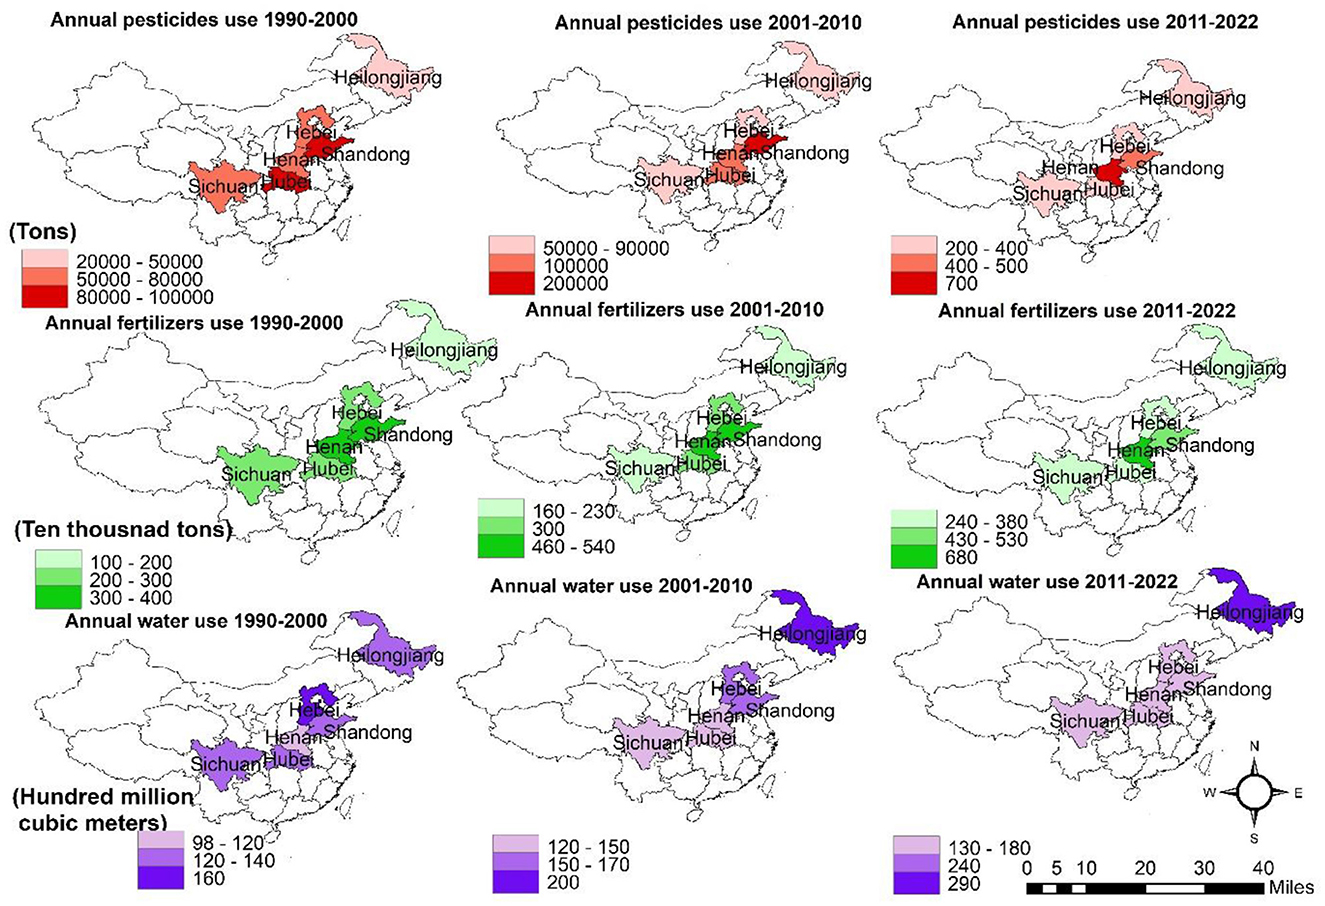
Figure 6. Patterns of pesticide use, fertilizer use, and agricultural water consumption in major agricultural provinces of China from 1990 to 2022. The red color represents the annual pesticide use (tons), the green color represents the annual fertilizer use (ten thousand tons), and the purple color represents the annual agricultural water use (hundred million cubic meters). Darker shades indicate higher levels of use in each category across three periods: 1990–2000, 2001–2010, and 2011–2022.
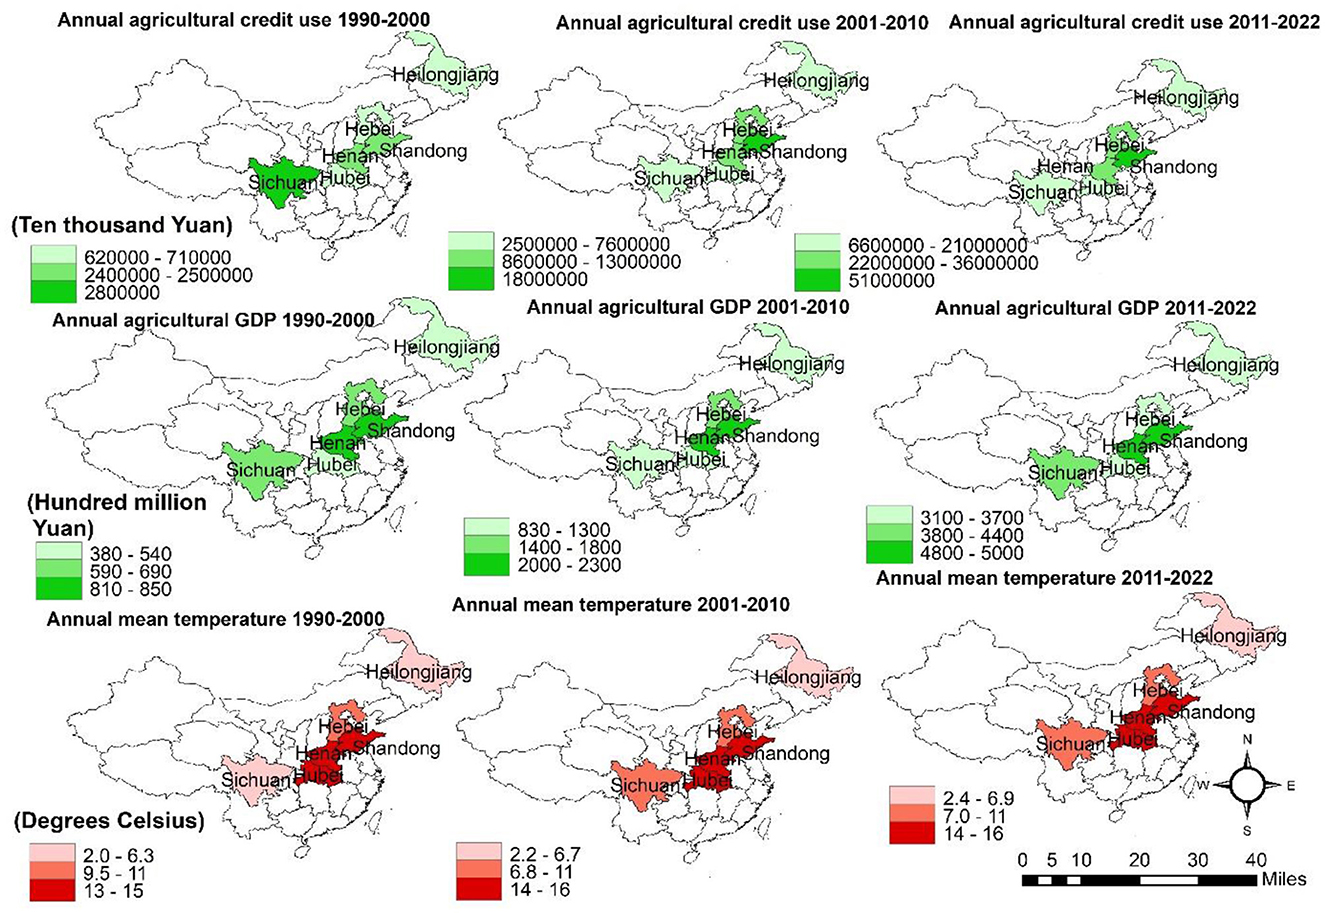
Figure 7. Patterns of agricultural credit use, agricultural GDP, and annual mean temperature in major agricultural provinces of China from 1990 to 2022. The green color represents the annual agricultural credit use (Ten Thousand Yuan) and agricultural GDP (Hundred million Yuan), while the red color represents the annual mean temperature (degrees Celsius). Darker shades indicate higher values of credit, GDP, and temperature across three periods: 1990–2000, 2001–2010, and 2011–2022.

Figure 9. CO2 emissions by sectors: China and global, 2022 (Statista, 2024; IEA, 2022).
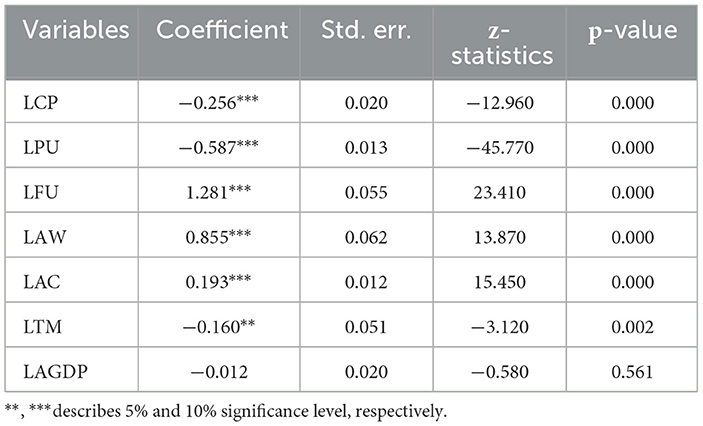
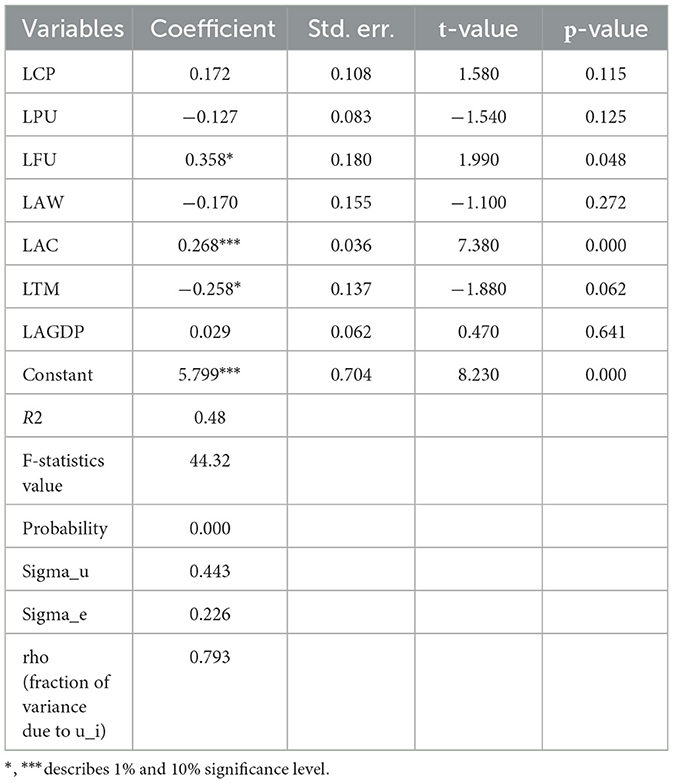
To ensure the robustness of our findings, we conducted a panel quantile regression analysis as shown in Table 12. The results indicate that corn production negatively affects CO2 emissions. In contrast, fertilizer use, agricultural credit, and agricultural water consumption have statistically significant and positive impacts on carbon emissions, supporting the findings from the PMG-ARDL model (Table 10). Providing financial assistance to farmers appears to encourage the adoption of modern agricultural practices, which can enhance crop yields but also increase carbon emissions. Our results thus suggest a strong link between agricultural financing and carbon emissions. Additionally, the interaction between temperature and agricultural GDP was found to have a negative impact on carbon emissions, consistent with the PMG-ARDL model. To further evaluate data reliability, we applied a Panel Least Squares regression analysis (Table 13). The findings confirm that carbon emissions are significantly influenced by corn production, agricultural credit, and fertilizer use. Temperature has a negative effect on carbon emissions, while agricultural GDP contributes positively. The R-squared value indicates that approximately 48% of the variation in carbon emissions can be explained by the model's explanatory variables. The research underscores the complex relationship between environmental quality and corn production, with a particular focus on carbon emissions. Our findings indicate a long-term negative relationship between CO2 emissions and corn production. However, the long-term increase in carbon emissions is significantly driven by the use of fertilizers, agricultural water, and agricultural credit. The results from the PMG-ARDL model (Table 10) align with those from the Panel Quantile Regression (Table 12) and Panel Least Squares (Table 13), all of which show strong positive correlations between agricultural loans, fertilizers use, agricultural water use, and carbon emissions.
The results of this study, as shown in Table 10, provide key insights into the long-term and short-term impacts of corn production and various agricultural inputs on CO2 emissions in China's major corn-producing provinces. In the long run, corn production shows a negative impact on CO2 emissions, suggesting that increased corn production over time is associated with a reduction in CO2 emissions. This finding aligns with Zhang et al. (2022), who reported that agricultural intensification, through higher crop yields, can lead to more efficient resource use, thereby lowering agriculture's carbon footprint. However, this negative relationship differs from the findings of Ullah et al. (2021), who observed a positive correlation between corn production and CO2 emissions, attributing it to the high input demands of modern corn farming, such as fertilizers and irrigation. This discrepancy may arise from differences in the scope and scale of the studies; while Ullah et al. (2021) focused on short-term impacts in specific regions, our study takes long-term perspective, potentially capturing the benefits of technological advancements and improved farming practices that reduce emissions over time. Additionally, regional variation in agricultural practices and policies may contribute to these contrasting findings.
The positive and significant effect of fertilizer use on CO2 emissions aligns with the findings of Rehman et al. (2019), who highlighted that the extensive use of nitrogen-based fertilizers significantly contributes to CO2 emissions due to both the production processes of these fertilizers and their application in the field. Similarly, Shao (2024) emphasized that fertilizer use is a major contributor to agricultural CO2 emissions globally and advocated for more efficient fertilizer use to mitigate these emissions. While several research have investigated the effects of crop productivity and irrigated land area (Zhai et al., 2017; Pickson et al., 2021; Zhang et al., 2022), fewer studies have explored the relationship between carbon emissions, water energy consumption, and water energy management (Anser et al., 2020; Wang et al., 2020). The link between agricultural water usage and carbon emissions, specifically in terms of quantity, remains underexplored. Our research on agricultural water use indicates a significant positive influence on carbon emissions, consistent with Rehman et al. (2020), suggesting that excessive irrigation, combined with fertilizer use, increases atmospheric evaporation, contributing to long-term carbon emissions. Our analysis shows a positive correlation between agricultural credit and carbon emissions. Agricultural water use similarly exhibits a positive and significant impact on CO2 emissions. This result aligns with Li and Yin (2024), who found that irrigation practices, especially in water-scarce regions, contribute significantly to CO2 emissions due to the energy required for pumping and distribution. Inefficient water management practices exacerbate these emissions in China's agricultural sector, a finding echoed by Anser et al. (2020), who recommended more sustainable water use in agriculture. Agricultural credit has a significant and positive impact on CO2 emissions in the long run, supporting Koondhar et al. (2021a), who reported that increased access to agricultural credit often results in higher CO2 emissions due to the expansion of high-input farming practices. Onyeneke et al. (2024) also found that agricultural credit enables farmers to invest in more intensive practices, which, while increasing productivity, also heightens emissions. However, our results suggest a stronger relationship between agricultural credit and CO2 emissions than reported in other studies. This may be due to the specific nature of corn production in the studied provinces, where credit may is often used to finance the purchase of fertilizers, pesticides, and irrigation equipment-all of which contributing to higher emissions.
The negative impact of temperature on CO2 emissions contrasts with the general expectation that higher temperatures lead to increased emissions. Demirhan (2020) found that rising temperatures often increase the use of water and energy for cooling in agriculture, and his finding suggest that, in the long run, high temperatures could be associated with the adaptation of less energy-intensive farming practices or shifts in crop types requiring fewer inputs. This counterintuitive result might also reflect the specific climatic conditions of the regions studied, where rising temperatures may reduce the need for energy-intensive practices like heating or might prompt a shift to less resource-intensive crops or farming methods. This underscores the complexity of the relationship between climate variables and CO2 emissions and highlights the importance of regional studies to fully understand these dynamics.
The agricultural GDP does not have a significant impact on CO2 emissions in the long run. This finding is somewhat surprising, as Huang et al. (2019) found a positive relationship between agricultural GDP growth and CO2 emissions, attributing it to the expansion of high-input agricultural practices. Some scholars have highlighted the decoupling effect between agricultural GDP and carbon emissions, suggesting that increases in agricultural value-added have limited long-term impacts on emissions due to enhanced efficiency and reduced energy dependency (Ghosh et al., 2023; Amin and Rahman, 2024). Additionally, some studies report that agricultural growth can reduce carbon emissions (Mahmood et al., 2019; Samargandi, 2017). Cole et al. (1997) found that technological advancements in agriculture have led to a 32% reduction in CO2 emissions. Zaharani et al. (2011) investigated that modern agricultural strategies such as efficient water use may contribute to a safe and sustainable environment. Conversely, Ullah et al. (2021) showed that agricultural value-added negatively impacts carbon emissions, while Waheed et al. (2018) identified agriculture as a significant source of CO2 emissions. Wang and Zhang (2021) suggested that increases in agricultural GDP might also enable investments in more sustainable practices, potentially mitigating emissions. The lack of a significant relationship in this study could indicate China's agricultural policies have promoted sustainable practices (e.g., crop rotation, conservation tillage, and integrated pest management) that help reduce greenhouse gas (GHG) emissions even as productivity increases (Zou et al., 2024; Yang et al., 2014). Furthermore, technological advancements and the adoption of precision agriculture have enabled Chinese farmers to use inputs more efficiently. For instance, modern irrigation systems and optimized fertilizer application reduce CO2 emissions, mitigating the environmental impact typically associated with agricultural growth (Ma et al., 2024b; Chen et al., 2024; Long et al., 2018). Moreover, government support for renewable energy in agriculture, including solar-powered irrigation and bioenergy from agricultural waste, has also played a key role in reducing carbon emissions (Zhu and Huo, 2022). Ecological methods such as Integrated Rice-Animal Farming (IRF) with fish and ducks have not only reduced the need for fertilizers and pesticides but also helped preserve environmental diversity in China (Yifan et al., 2023). Diversified cropping systems, efficient fertilizer use, intensified crop rotations, and integrated practices increase agricultural productivity while lowering carbon footprints (Cheng et al., 2011). Yang et al. (2022) found that the trend in agricultural carbon emissions shifted from increasing to continuously decreasing after 2015 at the national level, mainly due to improvements in major grain-producing areas. They concluded that advancements in agricultural infrastructure and human capital have positively contributed to agricultural eco-efficiency growth. This finding suggests that economic growth in agriculture does not automatically translate into higher emissions but rather depends on the nature of the growth and the types of practices it supports.
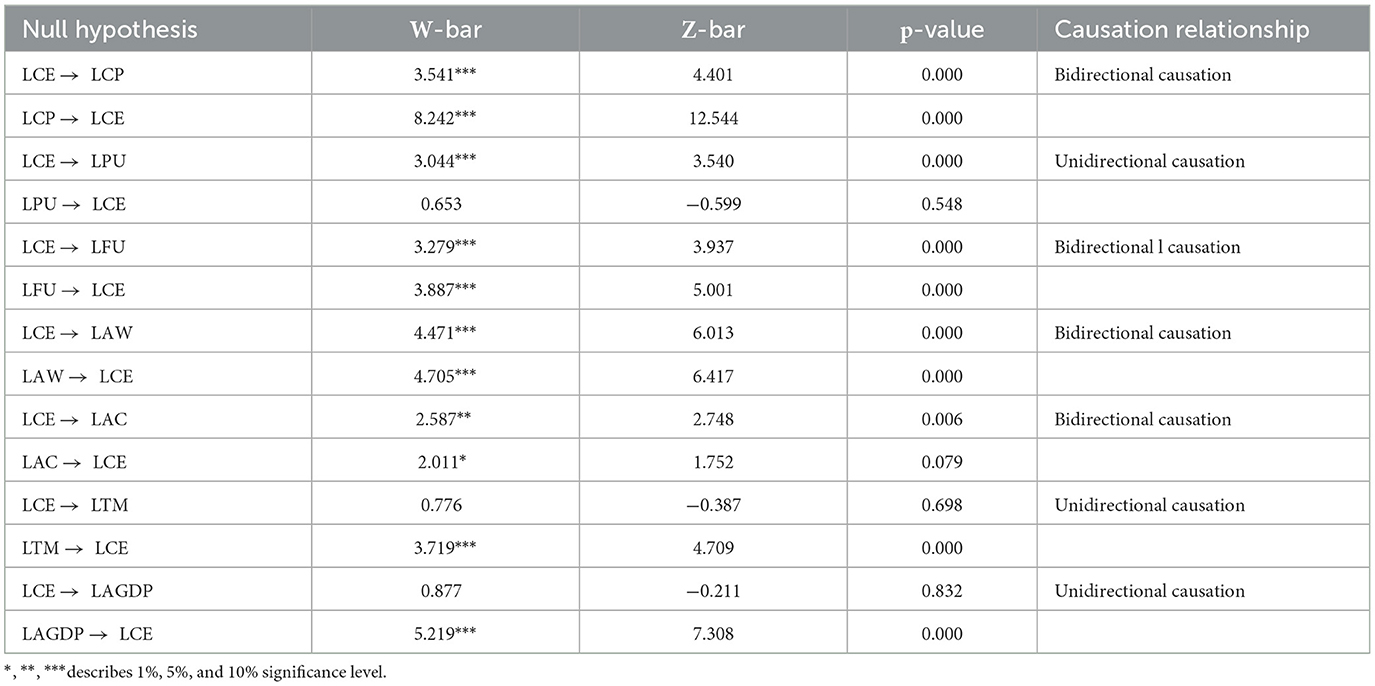
The Dumitrescu and Hurlin (2012) approach indicates causal relationships among variables (Table 14). The findings reveal significant unidirectional and bidirectional causal links between the variables. Unidirectional causation is observed between carbon emissions and pesticide use, carbon emissions and temperature, and carbon emissions and agricultural GDP. Additionally, a bidirectional causal relationship exists between carbon emissions and several other variables, including corn production, fertilizer application, agricultural water usage, and agricultural credit.
5 Conclusions
This study uses panel datasets from 1990 to 2022 to investigate the impact of corn production on carbon emissions in China. The study employs several rigorous econometric methods to ensure robust results. The findings reveal a negative long-term relationship between corn production and CO2 emissions in the long term. The influencing factors, such as fertilizer use, agricultural water use, and access to credit have positive and significant impact on carbon emissions in the long term. Agricultural credit plays a critical role in shaping carbon emissions by enabling high-input farming practices, leading to increased use of fertilizers, pesticides, and irrigation equipment. Notably, temperature has a strong negative impact, likely reflecting the role of climate change in shaping resource demand and efficiency. Agricultural GDP does not significantly impact carbon emissions in the long run, possibly due to the adoption of sustainable farming practices. Causality analysis reveals unidirectional causality between carbon emissions and factors like pesticide use, temperature, and agricultural GDP, as well as bidirectional causality with corn production, fertilizer use, agricultural water use, and agricultural credit use. Future research could examine how sustainable farming practices, such as organic and precision agriculture, reduce carbon emissions. It could also investigate the role of policies, subsidies, and renewable energy in agriculture. Expanding the geographic scope to diverse agricultural settings and integrating agronomy, climate science, and socio-economic analysis would provide broader and deeper insights into factors influencing CO2 emissions globally.
Data availability statement
The datasets presented in this study can be found in online repositories. The names of the repository/repositories and accession number(s) can be found in the article/Supplementary material.
Author contributions
YZ: Data curation, Funding acquisition, Writing – original draft, Writing – review & editing, Conceptualization, Formal analysis, Investigation, Methodology. MA: Conceptualization, Formal analysis, Investigation, Methodology, Resources, Software, Supervision, Validation, Writing – original draft, Writing – review & editing. QS: Funding acquisition, Resources, Supervision, Writing – review & editing, Validation. MB: Formal analysis, Validation, Writing – review & editing. CZ: Formal analysis, Funding acquisition, Writing – review & editing. HM: Funding acquisition, Resources, Supervision, Writing – review & editing, Methodology, Validation.
Funding
The author(s) declare financial support was received for the research, authorship, and/or publication of this article. This research was funded by the National Natural Science Foundation of China (Grant No. 72103054); the China Postdoctoral Science Foundation (Grant No. 2021T140181); the National Natural Science Foundation of China (Grant Number: 72003057); the National Social Science Fund of China: Research on the Practical Logic, Driving Mechanism, and Collaborative Optimization of Dual Governance of Collective Economic Organizations in Traditional Agricultural Areas (Grant No: 22BJY179); the Henan Province Philosophy and Social Sciences Planning Project: Research on the Internal Logic and Realization Path of High-Quality Farmers innovation and Entrepreneurship under the background of Rural Revitalization (2023BJJ086); the Postgraduate Education Reform and Quality Improvement Project of Henan Province (YJS2025SZ05); and the Henan Province Higher Education Teaching Reform Research and Practice Project (Grant No. 2021SJGLX094).
Conflict of interest
The authors declare that the research was conducted in the absence of any commercial or financial relationships that could be construed as a potential conflict of interest.
Publisher's note
All claims expressed in this article are solely those of the authors and do not necessarily represent those of their affiliated organizations, or those of the publisher, the editors and the reviewers. Any product that may be evaluated in this article, or claim that may be made by its manufacturer, is not guaranteed or endorsed by the publisher.
Supplementary material
The Supplementary Material for this article can be found online at: https://www.frontiersin.org/articles/10.3389/fsufs.2024.1492262/full#supplementary-material
Footnotes
1. ^The study uses panel data from 1990 to 2022 instead of extending to 2023 or 2024, due to inherent delays in data publication in China. Data for China's statistical yearbooks are compiled through multiple administrative layers, beginning at the county level, then aggregated to the city, province, and finally national levels. This multi-level process causes a delay in releasing the latest data. For example, the 2023 China statistical yearbook, which includes data for 2022, is expected to be published in 2024. As this study was organized in late 2023, it relies on the most recent available provincial data up to 2022, ensuring that the analysis was conducted using the latest reliable information at the time.
References
Ahmad, M. I., Ma, H., Shen, Q., Rehman, A., and Oxley, L. (2024). Climate change variability adaptation and farmers decisions of farm exit and survival in Pakistan. Clim. Serv. 33:100437. doi: 10.1016/j.cliser.2023.100437
Aiello, G., Giovino, I., Vallone, M., Catania, P., and Argento, A. (2018). A decision support system based on multisensor data fusion for sustainable greenhouse management. J. Clean. Prod. 172, 4057–4065. doi: 10.1016/j.jclepro.2017.02.197
Amin, M. M. I., and Rahman, M. M. (2024). Assessing effects of agriculture and industry on CO2 emissions in Bangladesh. PLoS Clim. 3:e0000408. doi: 10.1371/journal.pclm.0000408
Anser, M. K., Yousaf, Z., Usman, B., Nassani, A. A., Abro, M. M. Q., and Zaman, K. (2020). Management of water, energy, and food resources: go for green policies. J. Clean. Prod. 251:119662. doi: 10.1016/j.jclepro.2019.119662
Banerjee, S., and Murshed, M. (2020). Do emissions implied in net export validate the pollution haven conjecture? Analysis of G7 and BRICS countries. Int. J. Sustain. Econ. 12, 297–319. doi: 10.1504/IJSE.2020.111539
Chandio, A. A., Jiang, Y., Akram, W., Ozturk, I., Rauf, A., Mirani, A. A., et al. (2023). The impact of R and D investment on grain crops production in China: analysing the role of agricultural credit and CO2 emissions. Int. J. Finance Econ. 28, 4120–4138. doi: 10.1002/ijfe.2638
Chen, G., Ren, L., Wang, J., Liu, F., Liu, G., Li, H., et al. (2024). Optimizing fertilization depth can promote sustainable development of dryland agriculture in the Loess Plateau region of China by improving crop production and reducing gas emissions. Plant Soil 499, 73–89. doi: 10.1007/s11104-022-05795-6
Chen, X., Cui, Z., Fan, M., Vitousek, P., Zhao, M., Ma, W., et al. (2014). Producing more grain with lower environmental costs. Nature 514, 486–489. doi: 10.1038/nature13609
Cheng, K., Pan, G., Smith, P., Luo, T., Li, L., Zheng, J., et al. (2011). Carbon footprint of China's crop production—An estimation using agro-statistics data over 1993–2007. Agric. Ecosyst. Environ. 142, 231–237. doi: 10.1016/j.agee.2011.05.012
Cole, C. V., Duxbury, J., Freney, J., Heinemeyer, O., Minami, K., Mosier, A., et al. (1997). Global estimates of potential mitigation of greenhouse gas emissions by agriculture. Nutr. Cycl. Agroecosyst. 49, 221–228. doi: 10.1023/A:1009731711346
Crippa, M., Solazzo, E., Guizzardi, D., Monforti-Ferrario, F., Tubiello, F. N., and Leip, A. J. N. F. (2021). Food systems are responsible for a third of global anthropogenic GHG emissions. Nat. Food 2, 198–209. doi: 10.1038/s43016-021-00225-9
Dagar, V., Bansal, E., Murshed, M., Mishra, V., Alvarado, R., Kumar, A., et al. (2020). Stochastic frontier analysis to measure technical efficiency: evidence from skilled and unskilled agricultural labour in India. Int. J. Agric. Stat. Sci. 16:647.
Demirhan, H. (2020). Impact of increasing temperature anomalies and carbon dioxide emissions on wheat production. Sci. Total Environ. 741:139616. doi: 10.1016/j.scitotenv.2020.139616
Dong, W., Guo, J., Xu, L., Song, Z., Zhang, J., Tang, A., et al. (2018). Water regime-nitrogen fertilizer incorporation interaction: field study on methane and nitrous oxide emissions from a rice agroecosystem in Harbin, China. J. Environ. Sci. 64, 289–297. doi: 10.1016/j.jes.2017.06.007
Dumitrescu, E. I., and Hurlin, C. (2012). Testing for Granger non-causality in heterogeneous panels. Econ. Model. 29, 1450–1460. doi: 10.1016/j.econmod.2012.02.014
Environmental Protection Agency [EPA] (2022). Inventory of US Greenhouse Gas Emissions and Sinks: 1990–2009. Available at: http://epa.gov/climatechange/emissions/ (accessed September 4).
FAO (2016). Food and Agriculture Organization of the United Nations, 2016, FAOSTAT database. FAO[DB/OL] Available at: http://www.fao.org/faostat
FAO (2021). World food situation. Available at: https://www.fao.org/world~foodsituation/csdb/en/ (accessed August 15).
FAOSTAT (2020). Emissions Agriculture. Food and Agriculture Organization of the United Nations. Available at: http://www.fao.org/faostat/en/#data/GT (accessed September 6).
FAOSTAT (2023). FAOSTAT statistical database. Food and Agriculture Organization of the United Nations.
Forte, A., Fagnano, M., and Fierro, A. (2017). Potential role of compost and green manure amendment to mitigate soil GHGs emissions in Mediterranean drip irrigated maize production systems. J. Environ. Manage. 192, 68–78. doi: 10.1016/j.jenvman.2017.01.037
Fox, J. A., Adriaanse, P., and Stacey, N. T. (2019). Greenhouse energy management: the thermal interaction of greenhouses with the ground. J. Clean. Prod. 235, 288–296. doi: 10.1016/j.jclepro.2019.06.344
Gengenbach, C., Palm, F. C., and Urbain, J. P. (2006). Cointegration testing in panels with common factors. Oxf. Bull. Econ. Stat. 68, 683–719. doi: 10.1111/j.1468-0084.2006.00452.x
Ghosh, B. C., Eyasmin, F., and Adeleye, B. N. (2023). Climate change and agriculture nexus in Bangladesh: evidence from ARDL and ECM techniques. PLOS Clim. 2:e0000244. doi: 10.1371/journal.pclm.0000244
Global Carbon Emissions (2023). Country-by-Country for 2023. Available at: https://sigmaearth.com/global-carbon-emissions-country-by-country-for~2023/#:~:text=China%20is%20the%20world%E2%80%99s%20largest%20emitter%20of%20carbon,accounting%20for%2032%25%20of%20global%20emissions%20in%202023 (accessed November 19).
Grassini, P., and Cassman, K. G. (2012). High-yield maize with large net energy yield and small global warming intensity. Proc. Nat. Acad. Sci. 109, 1074–1079. doi: 10.1073/pnas.1116364109
Hillier, J., Hawes, C., Squire, G., Hilton, A., Wale, S., and Smith, P. (2009). The carbon footprints of food crop production. Int. J. Agric. Sustain. 7, 107–118. doi: 10.3763/ijas.2009.0419
Huang, X., Xu, X., Wang, Q., Zhang, L., Gao, X., and Chen, L. (2019). Assessment of agricultural carbon emissions and their spatiotemporal changes in China, 1997–2016. Int. J. Environ. Res. Public Health 16:3105. doi: 10.3390/ijerph16173105
IEA (2022). CO2 Emissions from fuel combustion. Available at: https://www.iea.org/data-and-statistics/data-products?filter=emissions (accessed November 26).
Im, K. S., Pesaran, M. H., and Shin, Y. (2003). Testing for unit roots in heterogeneous panels. J. Econom. 115, 53–74. doi: 10.1016/S0304-4076(03)00092-7
IPCC (2007). The Fourth Assessment Report of the Intergovmental Panel on Climate Change. Cambridge: Cambridge University Press.
IPCC (2018). Global Warming of 1.5°C. An IPCC Special Report on the Impacts of Global Warming of 1.5°C Above Pre-industrial Levels and Related Global Greenhouse Gas Emission Pathways, in the Context of Strengthening the Global Response to the Threat of Climate Change, Sustainable Development, and Efforts to Eradicate Poverty. Berne, Swtizerland: IPCC.
Jiehua, L., and Zhang, Z. (2020). China's provincial carbon emission accounting standards and empirical test. Stat. Decis. 36, 46–51. doi: 10.13546/j.cnki.tjyjc.2020.03.009
Khan, Z., Murshed, M., Dong, K., and Yang, S. (2021). The roles of export diversification and composite country risks in carbon emissions abatement: evidence from the signatories of the Regional Comprehensive Economic Partnership agreement. Appl. Econ. 53, 4769–4787. doi: 10.1080/00036846.2021.1907289
Koondhar, M. A., Shahbaz, M., Ozturk, I., Randhawa, A. A., and Kong, R. (2021a). Revisiting the relationship between carbon emission, renewable energy consumption, forestry, and agricultural financial development for China. Environ. Sci. Pollut. Res. 28, 45459–45473. doi: 10.1007/s11356-021-13606-1
Koondhar, M. A., Udemba, E. N., Cheng, Y., Khan, Z. A., Koondhar, M. A., Batool, M., et al. (2021b). Asymmetric causality among carbon emission from agriculture, energy consumption, fertilizer, and cereal food production–a nonlinear analysis for Pakistan. Sustain. Energy Technol. Assess. 45:101099. doi: 10.1016/j.seta.2021.101099
Li, A., and Yin, X. (2024). Analysis of factors influencing carbon emissions from rural residential energy consumption in China. Shandong Soc. Sci. 2, 169–176. doi: 10.14112/j.cnki.37-1053/c.2024.02.019
Li, Y., Ai, Z., Mu, Y., Zhao, T., Zhang, Y., Li, L., et al. (2023). Rice yield penalty and quality deterioration is associated with failure of nitrogen uptake from regreening to panicle initiation stage under salinity. Front. Plant Sci. 14:1120755. doi: 10.3389/fpls.2023.1120755
Li, Z. Z., Li, R. Y. M., Malik, M. Y., Murshed, M., Khan, Z., and Umar, M. (2021). Determinants of carbon emission in China: how good is green investment? Sustain. Prod. Consump. 27, 392–401. doi: 10.1016/j.spc.2020.11.008
Long, X., Luo, Y., Wu, C., and Zhang, J. (2018). The influencing factors of CO 2 emission intensity of Chinese agriculture from 1997 to 2014. Environ. Sci. Pollut. Res. 25, 13093–13101. doi: 10.1007/s11356-018-1549-6
Ma, B., Karimi, M. S., Mohammed, K. S., Shahzadi, I., and Dai, J. (2024a). Nexus between climate change, agricultural output, fertilizer use, agriculture soil emissions: novel implications in the context of environmental management. J. Clean. Prod. 450:141801. doi: 10.1016/j.jclepro.2024.141801
Ma, Z., Zhu, Y., Liu, J., Li, Y., Zhang, J., Wen, Y., et al. (2024b). Multi-objective optimization of saline water irrigation in arid oasis regions: Integrating water-saving, salinity control, yield enhancement, and CO2 emission reduction for sustainable cotton production. Sci. Total Environ. 912:169672. doi: 10.1016/j.scitotenv.2023.169672
Mahmood, H., Alkhateeb, T. T. Y., Al-Qahtani, M. M. Z., Allam, Z., Ahmad, N., and Furqan, M. (2019). Agriculture development and CO2 emissions nexus in Saudi Arabia. PLoS ONE 14:e0225865. doi: 10.1371/journal.pone.0225865
Maraseni, T. N., Deo, R. C., Qu, J., Gentle, P., and Neupane, P. R. (2018). An international comparison of rice consumption behaviours and greenhouse gas emissions from rice production. J. Clean. Prod. 172, 2288–2300. doi: 10.1016/j.jclepro.2017.11.182
Mele, M., and Magazzino, C. (2020). A machine learning analysis of the relationship among iron and steel industries, air pollution, and economic growth in China. J. Clean. Prod. 277:123293. doi: 10.1016/j.jclepro.2020.123293
Murshed, M., and Alam, M. S. (2021). Estimating the macroeconomic determinants of total, renewable, and non-renewable energy demands in Bangladesh: the role of technological innovations. Environ. Sci. Pollut. Res. 28, 30176–30196. doi: 10.1007/s11356-021-12516-6
Nathaniel, S. P. (2021). Environmental degradation in ASEAN: assessing the criticality of natural resources abundance, economic growth and human capital. Environ. Sci. Pollut. Res. 28, 21766–21778. doi: 10.1007/s11356-020-12034-x
Onyeneke, R. U., Ejike, R. D., Osuji, E. E., and Chidiebere-Mark, N. M. (2024). Does climate change affect crops differently? New evidence from Nigeria. Environ. Dev. Sustain. 26, 393–419. doi: 10.1007/s10668-022-02714-8
Persyn, D., and Westerlund, J. (2008). Error-correction–based cointegration tests for panel data. Stata J. 8, 232–241. doi: 10.1177/1536867X0800800205
Pesaran, M. H. (2006). Estimation and inference in large heterogeneous panels with a multifactor error structure. Econometrica 74, 967–1012. doi: 10.1111/j.1468-0262.2006.00692.x
Pesaran, M. H. (2015). Testing weak cross-sectional dependence in large panels. Econometr. Rev. 34, 1089–1117. doi: 10.1080/07474938.2014.956623
Pesaran, M. H., and Yamagata, T. (2008). Testing slope homogeneity in large panels. J. Econom. 142, 50–93. doi: 10.1016/j.jeconom.2007.05.010
Picano, E., Mangia, C., and D'Andrea, A. (2022). Climate change, carbon dioxide emissions, and medical imaging contribution. J. Clin. Med. 12:215. doi: 10.3390/jcm12010215
Pickson, R. B., He, G., and Boateng, E. (2021). Impacts of climate change on rice production: evidence from 30 Chinese provinces. Environ. Dev. Sustain. 24, 3907–3925. doi: 10.1007/s10668-021-01594-8
Qin, J., Duan, W., Zou, S., Chen, Y., Huang, W., and Rosa, L. (2024). Global energy use and carbon emissions from irrigated agriculture. Nat. Commun. 15:3084. doi: 10.1038/s41467-024-47383-5
Rehman, A., Chandio, A. A., Hussain, I., and Jingdong, L. (2019). Fertilizer consumption, water availability and credit distribution: major factors affecting agricultural productivity in Pakistan. J. Saudi Soc. Agric. Sci. 18, 269–274. doi: 10.1016/j.jssas.2017.08.002
Rehman, A., Ma, H., and Ozturk, I. (2020). Decoupling the climatic and carbon dioxide emission influence to maize crop production in Pakistan. Air Qual. Atmosp. Health 13, 695–707. doi: 10.1007/s11869-020-00825-7
Reynolds, L., and Wenzlau, S. (2012). Climate-friendly agriculture and renewable energy: working hand-in-hand toward climate mitigation. Worldwatch Institute. Available at: http://www.renewableenergyworld (accessed August 10).
Samargandi, N. (2017). Sector value addition, technology and CO2 emissions in Saudi Arabia. Renew. Sustain. Energy Rev. 78, 868–877. doi: 10.1016/j.rser.2017.04.056
Shao, H. (2024). Agricultural greenhouse gas emissions, fertilizer consumption, and technological innovation: a comprehensive quantile analysis. Sci. Total Environ. 926:171979. doi: 10.1016/j.scitotenv.2024.171979
Sharma, P. C., Jat, H. S., and Fagodiya, R. K. (2021). Nitrogen management in conservation agriculture-based cropping systems. Ind. J. Fert. 17, 1166–179. Available at: http://krishi.icar.gov.in/jspui/handle/123456789/69750
Shen, J., Zhu, Q., Jiao, X., Ying, H., Wang, H., Wen, X., et al. (2020). Agriculture green development: a model for China and the world. Front. Agric. Sci. Eng. 7, 5–13. doi: 10.15302/J-FASE-2019300
Shin, Y., Yu, B., and Greenwood-Nimmo, M. (2014). “Modelling asymmetric cointegration and dynamic multipliers in a nonlinear ARDL framework,” in Festschrift in honor of Peter Schmidt: Econometric methods and applications, 281–314. doi: 10.1007/978-1-4899-8008-3_9
Shuai, C., Chen, X., Wu, Y., Tan, Y., Zhang, Y., and Shen, L. (2018). Identifying the key impact factors of carbon emission in China: results from a largely expanded pool of potential impact factors. J. Clean. Prod. 175, 612–623. doi: 10.1016/j.jclepro.2017.12.097
Statista (2024). Distribution of carbon dioxide emissions from energy use in China in 2022, by sector. Available at: https://www.statista.com/statistics/1088662/china-share-of-energy-related-carbon-dioxide-emissions-by-sector/ (accessed November 20, 2024).
Street, A. (2003). How much confidence should we place in efficiency estimates? Health Econ. 12, 895–907. doi: 10.1002/hec.773
Tewatia, R. K., and Chanda, T. K. (2017). “Trends in fertilizer nitrogen production and consumption in India,” in The Indian Nitrogen Assessment (Elsevier), 45–56. doi: 10.1016/B978-0-12-811836-8.00004-5
Tiwari, S., Mohammed, K. S., Mentel, G., Majewski, S., and Shahzadi, I. (2023). Role of circular economy, energy transition, environmental policy stringency, and supply chain pressure on CO2 emissions in emerging economies. Geosci. Front. 15:101682. doi: 10.1016/j.gsf.2023.101682
Ullah, S., Ahmad, W., Majeed, M. T., and Sohail, S. (2021). Asymmetric effects of premature deagriculturalization on economic growth and CO2 emissions: fresh evidence from Pakistan. Environ. Sci. Pollut. Res. 28, 66772–66786. doi: 10.1007/s11356-021-15077-w
Waheed, R., Chang, D., Sarwar, S., and Chen, W. (2018). Forest, agriculture, renewable energy, and CO2 emission. J. Clean. Prod. 172, 4231–4238. doi: 10.1016/j.jclepro.2017.10.287
Wang, M., Hossain, M. R., Mohammed, K. S., Cifuentes-Faura, J., and Cai, X. (2023). Heterogenous Effects of Circular Economy, Green energy and Globalization on CO2 emissions: policy based analysis for sustainable development. Renew. Energy 211, 789–801. doi: 10.1016/j.renene.2023.05.033
Wang, Q., and Zhang, F. (2021). The effects of trade openness on decoupling carbon emissions from economic growth–evidence from 182 countries. J. Clean. Prod. 279:123838. doi: 10.1016/j.jclepro.2020.123838
Wang, X. C., Klemeš, J. J., Wang, Y., Dong, X., Wei, H., Xu, Z., et al. (2020). Water-Energy-Carbon Emissions nexus analysis of China: an environmental input-output model-based approach. Appl. Energy 261:114431. doi: 10.1016/j.apenergy.2019.114431
Wooldridge, J. M. (2009). Introductory Econometrics: A Modern Approach. Mason, OH, USA: South-Western Cengage Learning.
World Bank (2020). World development indicators. The World Bank. Available at: https://data.worldbank.org/country/CN (accessed September 2).
Xu, B., and Lin, B. (2017). Factors affecting CO2 emissions in China's agriculture sector: evidence from geographically weighted regression model. Energy Policy 104, 404–414. doi: 10.1016/j.enpol.2017.02.011
Yang, H., Wang, X., and Bin, P. (2022). Agriculture carbon-emission reduction and changing factors behind agricultural eco-efficiency growth in China. J. Clean. Prod. 334:130193. doi: 10.1016/j.jclepro.2021.130193
Yang, X., Gao, W., Zhang, M., Chen, Y., and Sui, P. (2014). Reducing agricultural carbon footprint through diversified crop rotation systems in the North China Plain. J. Clean. Prod. 76, 131–139. doi: 10.1016/j.jclepro.2014.03.063
Ye, M., Si Mohammed, K., Tiwari, S., Ali Raza, S., and Chen, L. (2023). The effect of the global supply chain and oil prices on the inflation rates in advanced economies and emerging markets. Geol. J. 58, 2805–2817. doi: 10.1002/gj.4742
Yifan, L., Tiaoyan, W., Shaodong, W., Xucan, K., Zhaoman, Z., Hongyan, L., et al. (2023). Developing integrated rice-animal farming based on climate and farmers choices. Agric. Syst. 204:103554. doi: 10.1016/j.agsy.2022.103554
Zaharani, K. H., Al-SHAyAA, M. S., and Baig, M. B. (2011). Water conservation in the Kingdom of Saudi Arabia for better environment: implications for extension and education. Bulgar. J. Agric. Sci. 17, 389–395.
Zhai, S., Song, G., Qin, Y., Ye, X., and Lee, J. (2017). Modeling the impacts of climate change and technical progress on the wheat yield in inland China: an autoregressive distributed lag approach. PLoS ONE 12:e0184474. doi: 10.1371/journal.pone.0184474
Zhang, C., Liu, S., Wu, S., Jin, S., Reis, S., Liu, H., et al. (2019). Rebuilding the linkage between livestock and cropland to mitigate agricultural pollution in China. Resour. Conserv. Recycl. 144, 65–73. doi: 10.1016/j.resconrec.2019.01.011
Zhang, H., Chandio, A. A., Yang, F., Tang, Y., Ankrah Twumasi, M., and Sargani, G. R. (2022). Modeling the impact of climatological factors and technological revolution on soybean yield: evidence from 13-major provinces of China. Int. J. Environ. Res. Public Health 19:5708. doi: 10.3390/ijerph19095708
Zhang, J., Bei, S., Li, B., Zhang, J., Christie, P., and Li, X. (2019). Organic fertilizer, but not heavy liming, enhances banana biomass, increases soil organic carbon and modifies soil microbiota. Appl. Soil Ecol. 136, 67–79. doi: 10.1016/j.apsoil.2018.12.017
Zhu, Y., and Huo, C. (2022). The impact of agricultural production efficiency on agricultural carbon emissions in China. Ener. 15:4464. doi: 10.3390/en15124464
Keywords: agricultural credit, agricultural input, carbon emissions, climate change, corn production
Citation: Zhang Y, Ahmad MI, Shen Q, Boota MW, Zhao C and Ma H (2025) Unveiling the environmental impact of corn production in China: evidence from panel ARDL approach. Front. Sustain. Food Syst. 8:1492262. doi: 10.3389/fsufs.2024.1492262
Received: 06 September 2024; Accepted: 13 December 2024;
Published: 10 January 2025.
Edited by:
Rajiv Kumar Srivastava, Texas A and M University, United StatesReviewed by:
Omid Karami, Purdue University, United StatesMuhammad Tamoor, Chinese Academy of Sciences (CAS), China
Copyright © 2025 Zhang, Ahmad, Shen, Boota, Zhao and Ma. This is an open-access article distributed under the terms of the Creative Commons Attribution License (CC BY). The use, distribution or reproduction in other forums is permitted, provided the original author(s) and the copyright owner(s) are credited and that the original publication in this journal is cited, in accordance with accepted academic practice. No use, distribution or reproduction is permitted which does not comply with these terms.
*Correspondence: Muhammad Irshad Ahmad, bWlhaG1hZEB6enUuZWR1LmNu
 Ying Zhang
 Muhammad Irshad Ahmad
 Qiong Shen2