- 1Agricultural Mechanization Strategy and Application Research Center, Sichuan Academy of Agricultural Machinery Science, Chengdu, China
- 2College of Management, Minzu University of China, Beijing, China
The construction of ecological barriers in the Yellow River Basin represents a significant step toward reducing agricultural carbon emissions, achieving carbon neutrality, and reaching carbon peaking in China. The diverse agrarian development objectives of various regions within the basin have resulted in a heterogeneous approach to greening agriculture. Therefore, this paper will evaluate the development of carbon sink agriculture across 34 cities and municipalities in the lower Yellow River basin from 2008 to 2021 based on the EBM-GML model, and analyze the spatial-temporal evolution of agricultural green total factor productivity (AGTFP) in each region through the application of the Moran index, kernel density estimation, and spatial Markov chain analysis. The results demonstrate that agricultural carbon emissions in the Lower Yellow River Basin gradually decreased throughout the study period. Furthermore, overall carbon emission efficiency improved, indicating significant potential for further emission reduction. In addition, Agricultural Green Technology Progress (AGTC) has become a primary driver of AGTFP growth, while Agricultural Green Technology Efficiency (AGEC) has demonstrated a gradual upward trend. Locally, most areas are weakly connected and display an isolated development trend. The results of the kernel density analysis demonstrate a notable degree of mobility in the distributional dynamics of AGTFP growth, characterized by a gradual narrowing of the gap between locations. The transfer of (AGTFP) types in the lower reaches of the Yellow River Basin is stable, with a noticeable “club convergence” phenomenon, while geographical conditions significantly influence the transfer of AGTFP types in this region. Based on long-term trend predictions, the future trajectory of AGTFP in the lower Yellow River Basin appears optimistic and is expected to improve progressively, with the overall distribution tending toward equilibrium.
1 Introduction
The acceleration of global warming has led to a series of adverse effects, including the melting of glaciers, rising sea levels, increased frequency of extreme weather events, and severe impacts on biodiversity. To achieve the temperature control targets set out in the Paris Agreement, the Chinese Government has committed to a phased emissions reduction program. This commitment represents a positive contribution to the development of a global community united in addressing the 21st century's challenges. The Yellow River Basin encompasses four distinct geomorphological units from west to east. It serves as a significant ecological barrier within China and boasts abundant agricultural resources. Consequently, the basin plays a pivotal role in China's agricultural economic development and ecological security (Liu et al., 2024). The accelerated development of the Yellow River Basin over an extended period has led to a considerable increase in resource and environmental loading, significantly impacting the region's ecological environment (Zhu et al., 2024). The Chinese Academy of Agricultural Sciences (CASA) has published the “2023 China Agricultural and Rural Low-Carbon Development Report,” which indicates that China's plantation production significantly contributes to greenhouse gas emissions and lacks the innovative technologies needed to increase production while reducing emissions. Consequently, it is essential to further investigate the potential for combining strategies to simultaneously minimize pollution and carbon emissions and to develop a more sustainable production model that balances economic growth with environmental protection. The Yellow River Basin, which encompasses four major grain-producing regions, is facing mounting pressure on agricultural carbon emissions. This underscores the need for transitioning to a low-carbon ecological development model, gradually reducing agricultural carbon emissions, and pursuing green agricultural development. The advancement of green agriculture can effectively address the persistent depletion and overexploitation of agricultural resources and facilitate the transformation of agriculture from unregulated, carbon-intensive development to a more sustainable, resource-efficient model (Zhang et al., 2023). It is therefore necessary to determine how agricultural carbon emissions in the Yellow River Basin and municipal areas should be measured, analyzed, and quantified. What is the efficiency intensity of agricultural low-carbon production? What are the principal factors that drive agricultural green total factor productivity (GTFP)? How do the spatial and temporal evolution characteristics change? The investigation of these questions offers theoretical value and practical significance, particularly in terms of promoting the application of agricultural green technology and facilitating the high-quality development of agriculture.
In their analysis of the measurement aspects of total factor productivity (TFP) in agriculture, Myeki et al. (2023) employed the Malmquist-Luenberger productivity index to examine TFP in African countries. Le Clech and Fillat Castejón (2020) Measuring global agricultural TFP and its evolution through the Malmquist Index (MI) and FPI. Yaqoob et al. (2022) used the Tornqvisit-Theil index to measure TPF in African agriculture. In their study, Bernard et al. (2023) employed a non-parametric data envelopment analysis-Malmquist technique to analyze total factor growth rates for 42 countries in Africa. Spolador and Danelon (2024) Analyses of Total Factor Productivity in Brazilian Agriculture Using the Stochastic Production Frontier Approach. Shah et al. (2024) employed the DEA Malmquist productivity index method to assess the overall efficiency of agricultural water use in 31 provinces of China. Scholars have also conducted comprehensive analyses from the standpoint of the factors that influence it. These include the consumption of resources, innovative technologies, and environmental constraints (Gebeyehu and Bedemo, 2024; Zhou et al., 2024; Bocean, 2024). Baležentis et al. (2021) employed the log-mean Divisia index in their analysis and constructed a data envelopment analysis model intending to identify the unobserved benefits of different factors of agricultural production on agricultural productivity. Quddus and Kropp (2020) concluded that labor poses a significant barrier to agricultural production, based on structured questionnaire findings. Adenubi et al. (2021) investigated the influence of digital technology adoption on TFP in agriculture through the utilization of an econometric approach. Ortiz-Bobea et al. (2021) employed robust econometric modeling to analyze the impact of climate on global agricultural total factor productivity, demonstrating that anthropogenic climate change (ACC) exerts a considerable influence on agricultural productivity and that global agriculture is particularly susceptible to persistent climate change. Huang and Ping (2024) employed mediation effect modeling to investigate the impact of agricultural science and technology innovation on agricultural green total factor productivity (AGTFP) and the mediating role of environmental regulation in 30 provinces in China. Jin et al. (2024) employ an econometric model to empirically examine the impact of digital financial inclusion on agricultural total factor productivity and its mechanism of action in Zhejiang Province. In examining the spatiotemporal dynamic evolution of agriculture, Araújo et al. (2024) employed the Mann-Kendall trend test to analyze the spatial dynamics of land use and the soybean crop over time. Maranhão et al. (2019) analyze the spatial and temporal dynamics and spatial correlation of plantation and livestock farming in Brazil through the examination of relevant time series data. Allaire et al. (2015) investigated the geographical and temporal dissemination of distinct forms of organic agriculture in France. Rossi et al. (2022) Spatio-temporal dynamics and correlates of CO2 emissions in the State of Mato Grosso (SMT), Brazil, assessed using a time series of multispectral images. Zhang (2024) employed a series of analytical techniques, including the center-of-gravity-standard deviation ellipse, kernel density estimation, and GeoDetector, to examine the spatial distribution pattern of green total factor productivity in Chinese agriculture and the dynamic evolution of its distribution across different regions. He and Ding (2023) employed spatial autocorrelation analysis and geographically and temporally weighted regression (GTWR) to empirically investigate the effects of technological progress and agricultural centrality on the spatio-temporal heterogeneity of agricultural carbon emissions.
In conclusion, the literature on agricultural total factor productivity has yielded significant insights. In this paper, the AGTFP of the Lower Yellow River Basin is assessed using a relevant model, and the interregional interconnectedness within the Lower Yellow River Basin is examined. Based on the concept of regional coordinated development, the spatial and temporal correlation of agricultural green development is investigated, and the spatial-temporal evolution of AGTFP in the downstream watershed is analyzed to gain deeper insights into the dynamic characteristics of agricultural green development throughout the study period. Interregional agricultural green production activities are analyzed to elucidate the migration patterns of agricultural green development within the main grain-producing areas, revealing the spatio-temporal characteristics of green agricultural development in the Lower Yellow River Basin. Finally, suggestions for improvement and enhancement paths for low-carbon agricultural development are proposed. This study contributes to understanding the pathways for developing countries like China to advance carbon sink agriculture.
2 Methodology
2.1 Materials
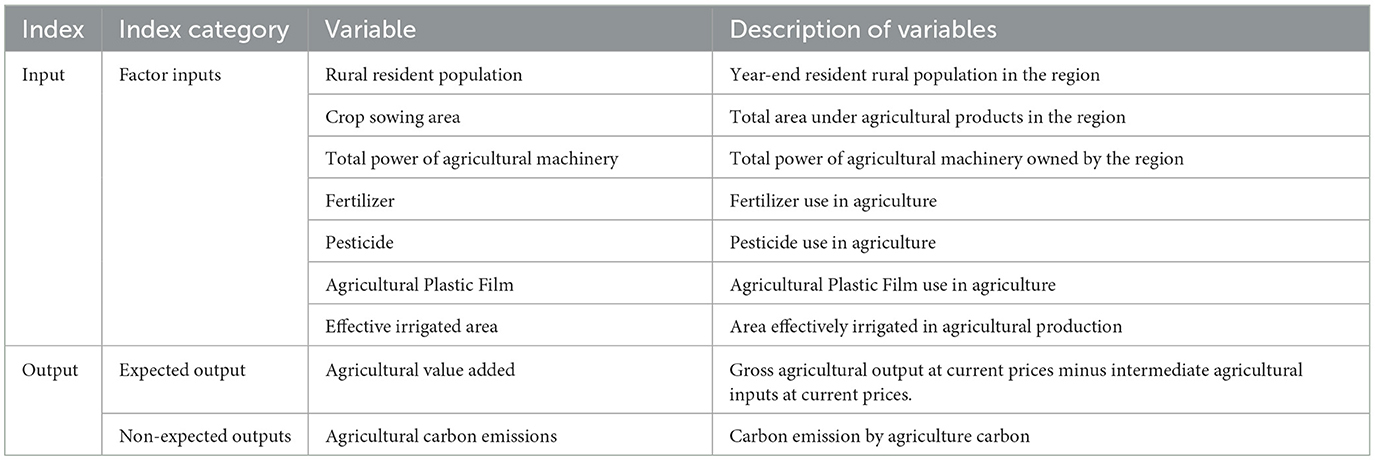
In light of the limitations imposed by natural conditions, the effective utilization of available resources is emerging as a key driver of both economic growth and ecological sustainability. In contrast to conventional total factor productivity (TFP), which primarily considers inputs, outputs, and scaling, AGTFP assesses the quality of economic development by incorporating additional factors such as undesirable outputs. Focusing on carbon sink agriculture in the Lower Yellow River Basin, this paper constructs a measurement index system for analyzing AGTGP of carbon sink agriculture in the Lower Yellow River Basin (see Table 1), which is mainly composed of three categories: resource inputs, desired outputs and non-desired outputs.1 The resource input category serves as an input indicator for AGTFP, encompassing all types of factor inputs. The primary indicator of success in the desired output category is the growth of the agricultural economy. The indicator for the non-desired output category is agricultural carbon emissions. While facilitating the allocation of carbon sink agricultural resources, it is essential to promote agricultural economic growth and the development of ecological safeguards in the Yellow River Basin to ensure stable economic development in the major grain-producing regions.
In traditional agricultural production, the most prevalent agricultural input variables are land, labor, and capital (Touch et al., 2024; Rittirong et al., 2024). Considering data availability and agricultural cultivation characteristics, this paper selects the sown area of crops, labor force, total power of agricultural machinery, agrochemical inputs, including fertilizers, and effective irrigated area as input indicators. The “crop-sown area” refers to the total land area available to farmers for agricultural activities, including the cultivation of crops. Laborers are individuals directly participating in the operation and production of agricultural activities. Fertilizers, pesticides, and agricultural plastic films are consumables essential for ensuring output per unit area. Effective irrigated area refers to the arable land that has access to a reliable water source, where the land is relatively flat, with appropriate irrigation infrastructure or equipment in place, and where irrigation can be routinely performed under typical conditions.
Agricultural output is categorized into desired and undesirable outputs, where agricultural economic growth is the desired output component of the AGTFP and is usually measured in terms of output value or yield. In accordance with the established criteria for data validity, this paper has elected to utilize the value added by the agricultural sector as its primary measure. The value added of agriculture excludes the intermediate input costs of agriculture, making its value fluctuations more indicative of the overall development of the agricultural economy. In non-desired outputs, agricultural carbon emissions are used as its measure. The most important sources of carbon emissions in agriculture can be categorized into two primary sources: firstly, direct emissions from energy combustion, primarily from diesel use in agricultural machinery operations and electricity consumption in irrigation machinery, and secondly, indirect emissions from agricultural production consumables, such as fertilizers and pesticides. Referring to the carbon emission estimation formula of Jin and Zhong (2024) to calculate the agricultural carbon emission.
2.2 Super-efficient EBM modeling
Current research indicates that most methods for measuring total factor productivity in agriculture are primarily based on the SBM model, which was proposed by Tone (2001) as a measure of slack efficiency built upon the DEA model. Although it can circumvent the premise of proportional increases and decreases, it does not address the radial problem. The EBM model, proposed by Tone and Tsutsui (2010), effectively addresses the limitations of the SBM model by incorporating both radial and non-radial distance functions. Additionally, the EBM model is capable of incorporating undesirable outputs, allowing for the analysis of the relationship between various agricultural inputs, economic performance, and agro-ecological systems. Therefore, this study utilizes the EBM model to calculate the AGTFP values of the Lower Yellow River Basin from 2008 to 2021. The following is the specific calculation formula:
In the formula, γ*denotes the AGTFP in carbon sink agriculture; x, y, and q respectively represent the raw data for inputs, desired outputs and non-desired outputs; m, s, and q represent the number of indexes for inputs, desired output and non-desired outputs; ρ and μ are radial modeling parameters; b and ω denote the slack variables and weights of the elements, respectively; i denotes non-radial input factors; εx is a non-radial core parameter and satisfies 0 ≤ εx ≤ 1.
2.3 Global Malmquist-Luenberger index methodology
The GML index was proposed by Pastor and Lovell (2005) after analyzing the limitations of the Malmquist productivity index. It addresses the limitations of the ML index, such as the inability to analyze short-term changes in productivity between consecutive periods, the tendency of the mixed directional distance function to lead to infeasible solutions in linear programming, and the inability to observe long-term productivity trends. Therefore, in this study, the GML index is used to observe the growth of AGTFP. Since the model measures both efficiency and technological change, the growth of AGTFP is further decomposed into Agricultural Green Technological Progress (AGTC) and Agricultural Technological Efficiency (AGEC). Following Pastor and Lovell (2005), the GML index is calculated using the following formula:
In the above formula, the global directional distance function ; If more desired outputs and fewer non-desired outputs are produced, then the GMLt, t+1>1, which represents an increase in AGTFP. Conversely, a decrease in AGTFP occurs when fewer desired outputs and more non-desired outputs are produced. In order to gain further insight into the alterations in AGTC and AGEC, the GML index is subjected to a further decomposition as follows:
If AGEC> 1, it indicates an increase in the efficiency of green technology in agriculture, and vice versa, it indicates a decrease in the efficiency of green technology in agriculture; if AGTC> 1, it indicates progress in green technology in agriculture, and vice versa, it indicates a regression in green technology in agriculture.
2.4 Moran index
In order to achieve a more comprehensive understanding of the green development of agriculture in the Yellow River Basin and to present the findings in a detailed and specific manner, this paper will employ the Moran index, as proposed by Moran (1950), to examine the measurement results in greater detail, exclude erroneous data, visualize and analyze the data, and observe the spatial autocorrelation of all units within the study area with neighboring regions.2 The formula is as follows:
In the above equation, ; n is the total number of space units; yi and yj represent the attribute values of the ith and jth spatial units respectively; y is the mean of all spatial cell attribute values; wij is the spatial weight value. Since different spatial weights can affect the resulting values, this paper utilizes Queen's method to construct the spatial weight matrix in order to obtain more stable results.
2.5 Kernel density
The evolutionary characteristics and patterns of the overall distribution pattern of AGTFP among regions are further explored. In this paper, kernel density estimation is selected as an analytical method to explore the evolution of AGTFP. Estimating the temporal distribution pattern of AGTFP in the Lower Yellow River Basin using the Kernel density method. The kernel density function of the random variable x is:
xi is the AGTFP for each municipality; AGTFPi are independently distributed observations; is denoted as the mean value of AGTFP; n is the number of observations, m is the window width, and K(x) represents the Gaussian and density functions.
2.6 Spatial Markov chain
The Markov chain model will consider the evolution of regional phenomena as a Markov process. This will be achieved by introducing the method of transfer probability matrix analysis, which will superimpose the dynamic evolution of each phenomenon in the region at different times. This will enable the reflection of the state of each area in the region and its mobility of upward or downward transfer. Accordingly, the present paper employs the Markov chain model to investigate the spatial evolution of AGTFP.
Firstly, a 1 × k matrix At = [a1t, a2t, ⋯ , akt] is constructed to store the probability of the carbon emission efficiency of each region in t periods. Secondly, the transfer of regional carbon emission efficiency in different periods can be represented by setting up a k×k matrix S:
In accordance with the principle of categorizing the number of each type of phenomenon in a similar manner, this paper classifies the AGTFP values in the lower Yellow River basin into four categories based on the quartiles, with values assigned to k = 1, 2, 3, 4, respectively, in descending order of magnitude. The matrix is a Markov transfer probability matrix, wherein the matrix element Pij denotes the probability of being type i at moment t and type j at moment t+1. This is defined as , where zij denotes the number of regions belonging to type i in period t that are of type j at moment t+1, and zi is the number of regions belonging to type i.
To further analyze the spatial characteristics of regional phenomena, based on the transmission probability matrix of the traditional Markov chain, the concept of “spatial lag” is introduced as a condition, and the same is divided into 4 types, and the 4 × 4 transmission probability matrix into the 4 matrix of 4 × 4 transfer conditional probabilities:
The element Pki|jin the matrix represents the probability that the region will change from the initial state type i to type j at the next moment under the condition that the spatial lag type is k (k = 1, 2, 3, 4). The spatial lag type takes into account the geographical units neighboring the region, and the spatial lag value lagα of the region α is a weighted average of the observed values of the geographical units surrounding the region, as specified in the equation:
In this equation, Yβ represents the observed value of region β; lagα denotes the spatial lag value of region α; n signifies the total number of cities; and the spatial weight matrix Wαβ depicts the spatial relationship between region α and region β.
It is assumed that after a long period of transfer, the system will emerge in a stable state called equilibrium, which implies that the state will be unaffected by changes in time and remain steady over time. Accordingly, the equilibrium state can be determined using the Markov transfer probability matrix, and the equilibrium distribution probabilities of the stochastic process offer valuable insights for predicting future trends of the Markov process. Therefore, the following can be observed:
This equation is obtained by substituting it into the recursive equation of the Markovian prediction model:
The equation represents the equilibrium state matrix for the evolution of the Markov process, designated as τ. If τ satisfies the condition , then τ represents an equilibrium point of a traditional Markov process. Furthermore, it can be incorporated into a spatial Markov chain, through which the equilibrium points can be computed with different lags.
To ascertain whether the spatial lag effect is statistically significant, a hypothesis test is required. This assumes that the shifts in the types of agricultural carbon emission performance are independent of each other and independent of the type of neighborhood state. The test is formulated as follows:
In this context, k represents the number of city carbon emission performance state types. mij denotes the traditional Markov transfer probability, while mij(S) signifies the spatial Markov transfer probability of neighborhood state type S. Similarly, nij(S) denotes the number of cities that indicate the spatial Markov transfer of neighborhood state type S. Finally, φb is defined as obeying the chi-square distribution with degree of freedom k(k− 1)2.
3 Empirical analysis
3.1 Total agricultural carbon emissions and their annual growth rate
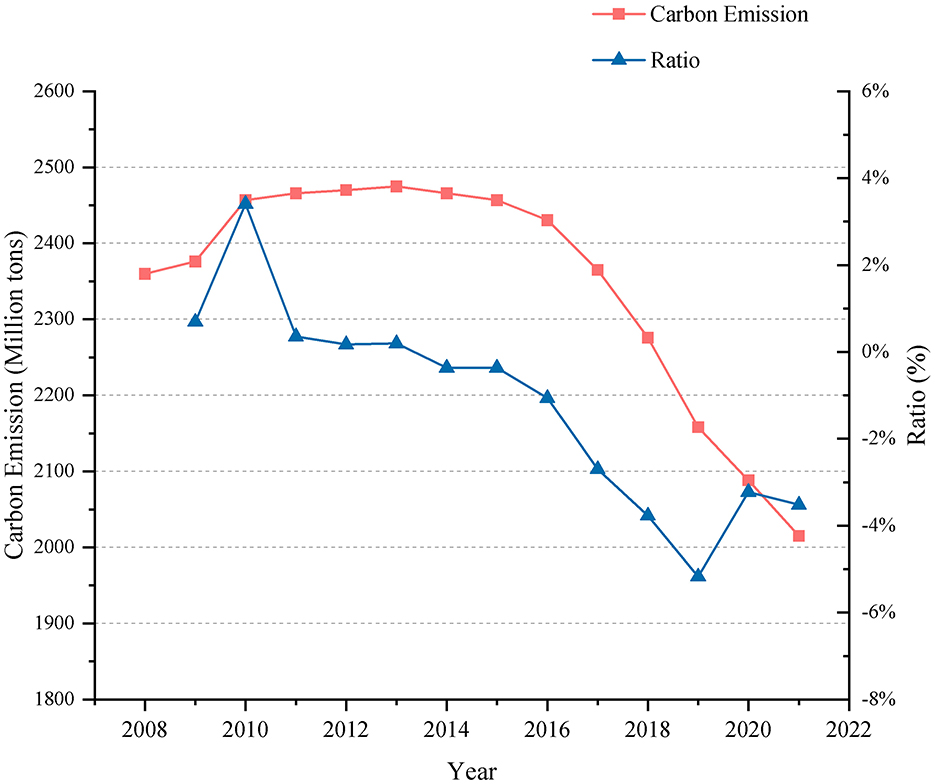
Using the formula for carbon emissions from agriculture, the carbon emissions from the plantation industry in the lower Yellow River Basin from 2008 to 2021, and the annual growth rate over this period, are calculated as shown in Figure 1. The graph indicates that total agricultural carbon emissions show an inverted “U” trend, with an average annual growth rate of −1.2%. Total agricultural carbon emissions increased annually from 2008 to 2013, with an average annual growth rate of 1%, peaking at 23.730 million tons in 2013. Afterward, agricultural carbon emissions decreased annually, reaching a minimum of 19.436 million tons in 2021.
The development trend of agricultural carbon emissions in the Lower Yellow River Basin consists of three main phases. The first phase, from 2008 to 2010, saw the fastest increase in agricultural carbon emissions due to the rigid growth in consumption demand for agricultural products in China. Resource and environmental constraints are growing increasingly severe, the overall balance of supply and demand for agricultural products is tightening, structural imbalances are intensifying, and the influence of the international market has grown considerably. As a result, China has introduced a series of relevant policies during this period, which, while boosting farmers' motivation to cultivate, improving production efficiency, and securing domestic food security, have also contributed to increased use of agricultural inputs such as chemical fertilizers, thereby exacerbating carbon emissions from agriculture.
The second phase, from 2011 to 2015, saw a lower overall year-on-year growth rate in agricultural carbon emissions, indicating a more stable platform period. During this period, China was in the “Twelfth Five-Year Plan” and was transitioning from crude small-scale farming to modernized agriculture. Concurrently, the use of bio-pesticides, high-efficiency, low-toxicity, and low-residue pesticides, organic fertilizers, and the recycling of agricultural film and pesticide packaging were promoted, resulting in a low rate of change in agricultural carbon emissions.
The third phase, from 2016 to 2021, saw a yearly decline in agricultural carbon emissions. During this period, China's food subsidies transitioned from three subsidies to agricultural support protection subsidies, focusing on protecting arable land and soil fertility and large-scale production. The production of major grain-producing areas shifted to green development. Document No. 1 issued during this period also clearly states that environmental protection should be strengthened, leading to a significant reduction in agricultural carbon emissions.
3.2 Sources of agricultural emissions, regional shares, and changes in carbon emissions
Figure 2 illustrates the sources and regional distributions of carbon emissions resulting from cultivation activities. Agricultural fertilizers are identified as the primary contributor to carbon emissions among the various indicators, accounting for approximately 75 percent of total emissions, while other sources contribute significantly less to overall emissions. Further analysis reveals an inverted U-shaped trend in the development of carbon emissions across various agrarian activities, including pesticides, agricultural plastic film, diesel, arable land, and fertilizers. While agricultural carbon output is declining, agrarian irrigation is increasing annually. Regarding the regional distribution of agricultural carbon emissions, the majority in the Lower Yellow River Basin originate from Shandong Province. However, the proportion attributable to Henan Province is rising, increasing from 29.6% in 2008 to 37.1% in the most recent dataset.
Figure 3 illustrates the mean annual carbon emissions from agriculture in the municipalities of the Lower Yellow River Basin. To more clearly demonstrate the range of carbon emissions, this paper employs the natural break classification method to categorize them into five levels. As Figure 3 demonstrates, there are notable variations in the annual agricultural carbon emissions across the Lower Yellow River Basin. Most high-emission areas are concentrated in the central part of Shandong Province, with the highest in Weifang, where the average annual agricultural emissions are 1.472 million tons. The cities of Hebi, Jiyuan, Sanmenxia, and Luohe have relatively low average annual agricultural carbon emissions, with Jiyuan exhibiting the lowest level at 76,820 tons. From 2008 to 2015, the areas in the southern part of Henan Province and the northern part of Shandong Province with the highest levels of emissions gradually increased in size. In Shandong Province, the highest number of high agricultural carbon emission areas were identified in Weifang City, Jining City, and Dezhou City, with the greatest emissions occurring in 2015. From 2016 to 2021, high-emission areas in Shandong Province were reduced. The central region of Henan Province demonstrated greater stability, as evidenced by Luohe City and Zhengzhou City. Since 2017, the agricultural carbon emission pattern in the Lower Yellow River Basin cities has remained consistent. Overall, primary agricultural carbon emissions exhibited a high southeast and low northwest trend.
In conclusion, agricultural carbon emissions in the Lower Yellow River Basin are gradually declining. However, agricultural fertilizers account for a relatively high proportion of these emissions, while carbon emissions from agricultural irrigation are on the rise. The majority of agricultural carbon emissions are concentrated in Shandong Province, particularly in cities with more developed agriculture, such as Weifang and Nanyang. This suggests that, despite the shift toward sustainable development, the agricultural sector in these regions has not yet fully transitioned from a resource-intensive model to one that is more environmentally conscious. The continued prevalence of high inputs and emissions indicates there is still room for improvement in the sustainability of agricultural practices.
3.3 The efficiency of green production in agriculture
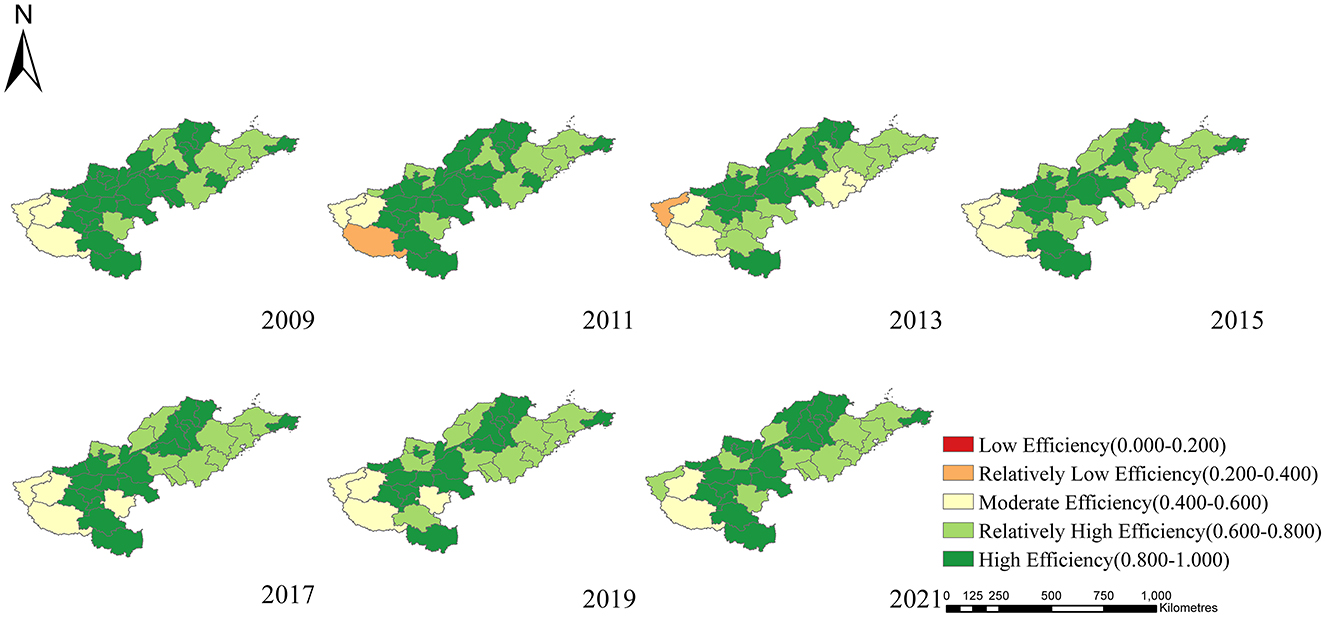
The efficiency of agricultural green production was measured using the EBM model. To gain insight into the spatial evolution of the Lower Yellow River Basin, the data were visualized and mapped using ArcGIS software, as shown in Figure 4. Spatially, the green productivity of agriculture in most cities has increased markedly over the study period, with the most pronounced increase occurring between 2015 and 2021. Since 2008, regional cities such as Kaifeng, Nanyang, Jinan, and Qingdao have exhibited considerable growth in agricultural green productivity, whereas Heze, Binzhou, Hebi, and Jiyuan have demonstrated comparatively modest gains. It is noteworthy that the agricultural carbon emission performance of cities such as Anyang, Xuchang, and Puyang exhibited a discernible downward trend between 2008 and 2010. Furthermore, areas such as Jinan, Qingdao, Luoyang, and Sanmenxia demonstrated favorable upward trends from 2011 to 2015. However, during the subsequent period of 2016 to 2021, the agricultural carbon emission performance of Dezhou and Weihai exhibited a declining trend, indicating a discernible decline in green production efficiency. By 2021, the spatial pattern of agrarian carbon emission performance in the Lower Yellow River Basin exhibited a distinctive “high in the southwest and low in the northeast” trend. Additionally, the agricultural green production efficiency in Henan Province cities demonstrated notable superiority over those in Shandong Province. This was primarily reflected in the high values of Shangqiu and Yantai. Conversely, the northern regions of Henan and Shandong exhibited comparatively lower levels of agricultural green production efficiency.
3.4 Results of AGTFP calculations
The indices for the three scenarios of the Lower Yellow River Basin from 2008 to 2021 were calculated using the EBM-GML model as the AGTFP, AGTC, and AGEC indices, respectively. Figure 5 illustrates the alterations in the cumulative indices reflecting the AGTFP, AGTC, and AGEC in the Lower Yellow River Basin. The cumulative AGTFP index demonstrated a fluctuating growth trend from the outset. In contrast, the cumulative AGTC index exhibited a growth trend, while the cumulative AGEC index displayed an inverse trajectory, suggesting a deterioration in the efficacy of green eco-technology in agriculture. This is consistent with the findings of Yin et al. (2024) regarding agroecological total factor productivity. The ascendance of the AGTFP index parallels that of AGTC and inversely correlates with that of AGEC. This indicates that the advancement of agricultural green technology is the primary catalytic for AGTFP growth in the Lower Yellow River Basin, while the efficacy of agricultural green technology has a constrained influence.
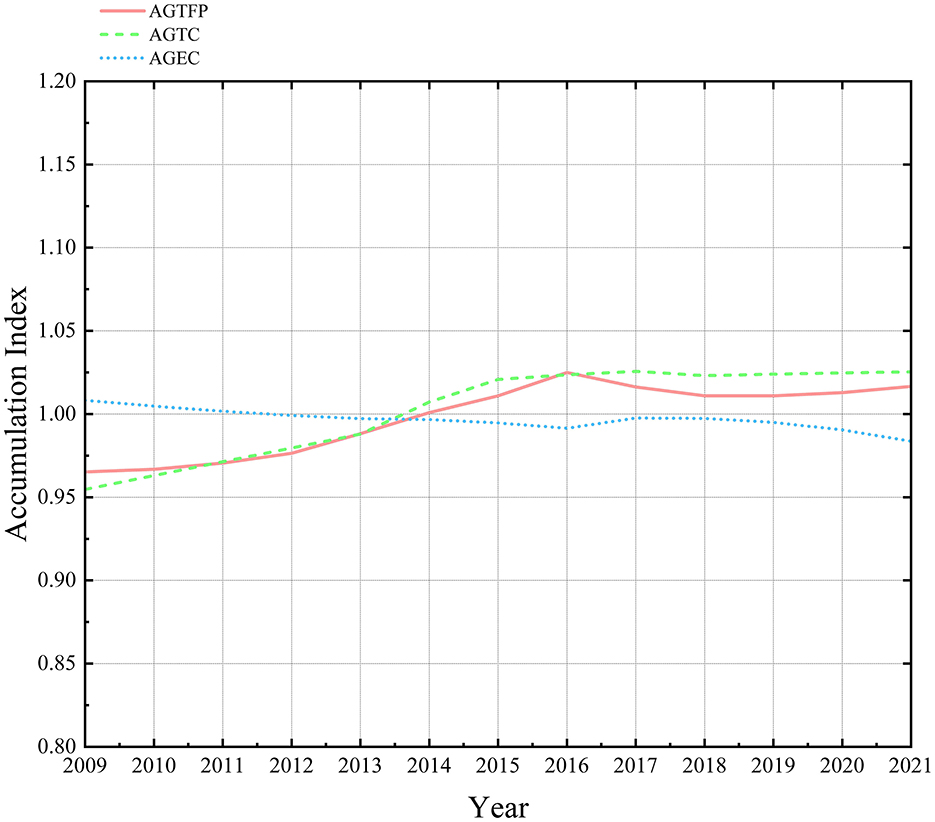
Figure 5. Schematic diagram of changes in accumulation index under different scenarios in the lower Yellow River Basin 2008–2021.
The period in question can be roughly divided into three stages based on AGTFP: 2009–2014, 2015–2018, and 2019–2021. The initial stage of AGTFP showed gradual and consistent growth, with an average annual growth rate of 0.527%. This is particularly evident in the parallel growth of AGTC (0.658%), while AGEC (−0.067%) showed a contrasting trend, declining. This stage reflects that during this period, the management of the agro-ecological environment began. However, due to serious environmental pollution and inefficient resource use, the development of agro-ecological functions slowed. Additionally, the analysis of the concept of green agricultural development was not sufficiently in-depth. In the second stage, agricultural supply-side structural reform was pursued with unwavering commitment, the construction of rural ecological civilization was reinforced, and China's No. 1 central document for 2024 issued during this period made numerous references to the green development of agriculture and the implementation of the corresponding ecological restoration project. The AGTFP in the Lower Yellow River Basin entered a development period, with an average annual growth rate of 0.038%. In this context, AGTC continued to be the core driver (0.364%), while AGEC was characterized by negative growth (−0.284%). This can be described as a “single-core” growth mode driven by technological progress. In the third stage, AGTFP in the Lower Yellow River Basin decelerated, with an average annual growth rate of 0.313%. During this period, the primary driver of AGTFP alternated between AGTC and AGEC, with AGTC exhibiting an average annual growth rate of −0.029% and AGEC demonstrating an average annual growth rate of 0.334%. However, the “double-driver” mode of joint promotion by AGTC and AGEC did not occur.
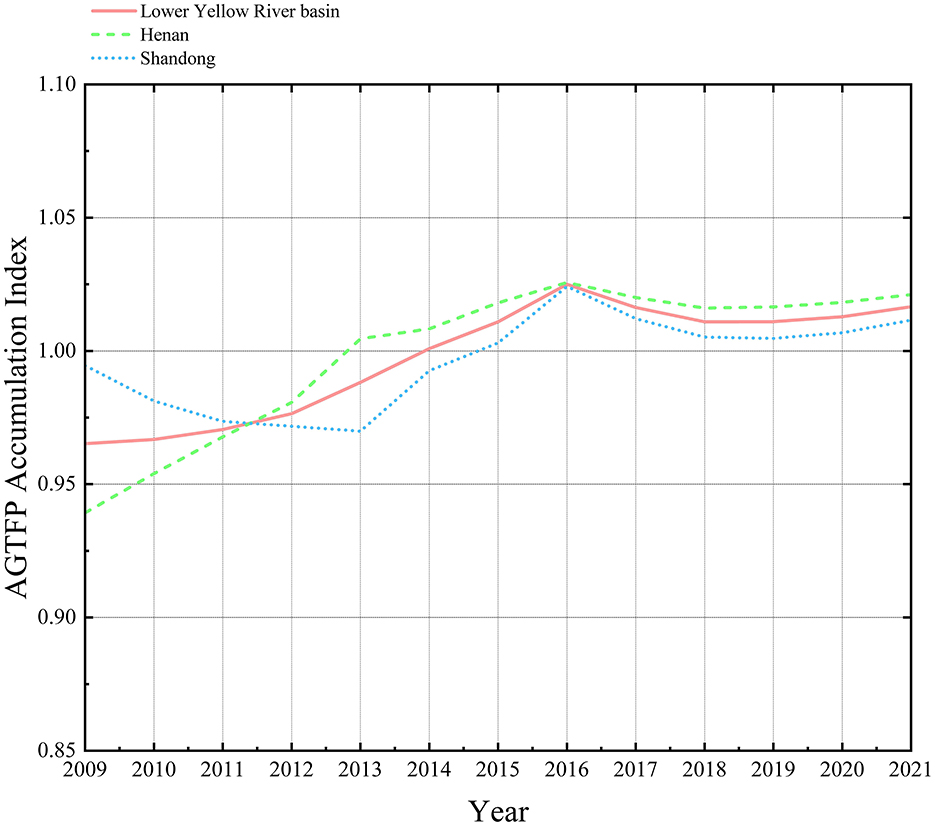
Figure 6 illustrates the accumulation index of AGTFP in the downstream region of the Yellow River Basin and its variation across different downstream regions. The growth of AGTFP in the lower Yellow River Basin follows a gradient pattern between the provinces of Henan and Shandong. Historically, the AGTFP of Shandong Province has consistently surpassed that of Henan Province. However, after 2011, Henan Province experienced a reversal, with Henan Province surpassing Shandong in AGTFP and subsequently taking the lead.
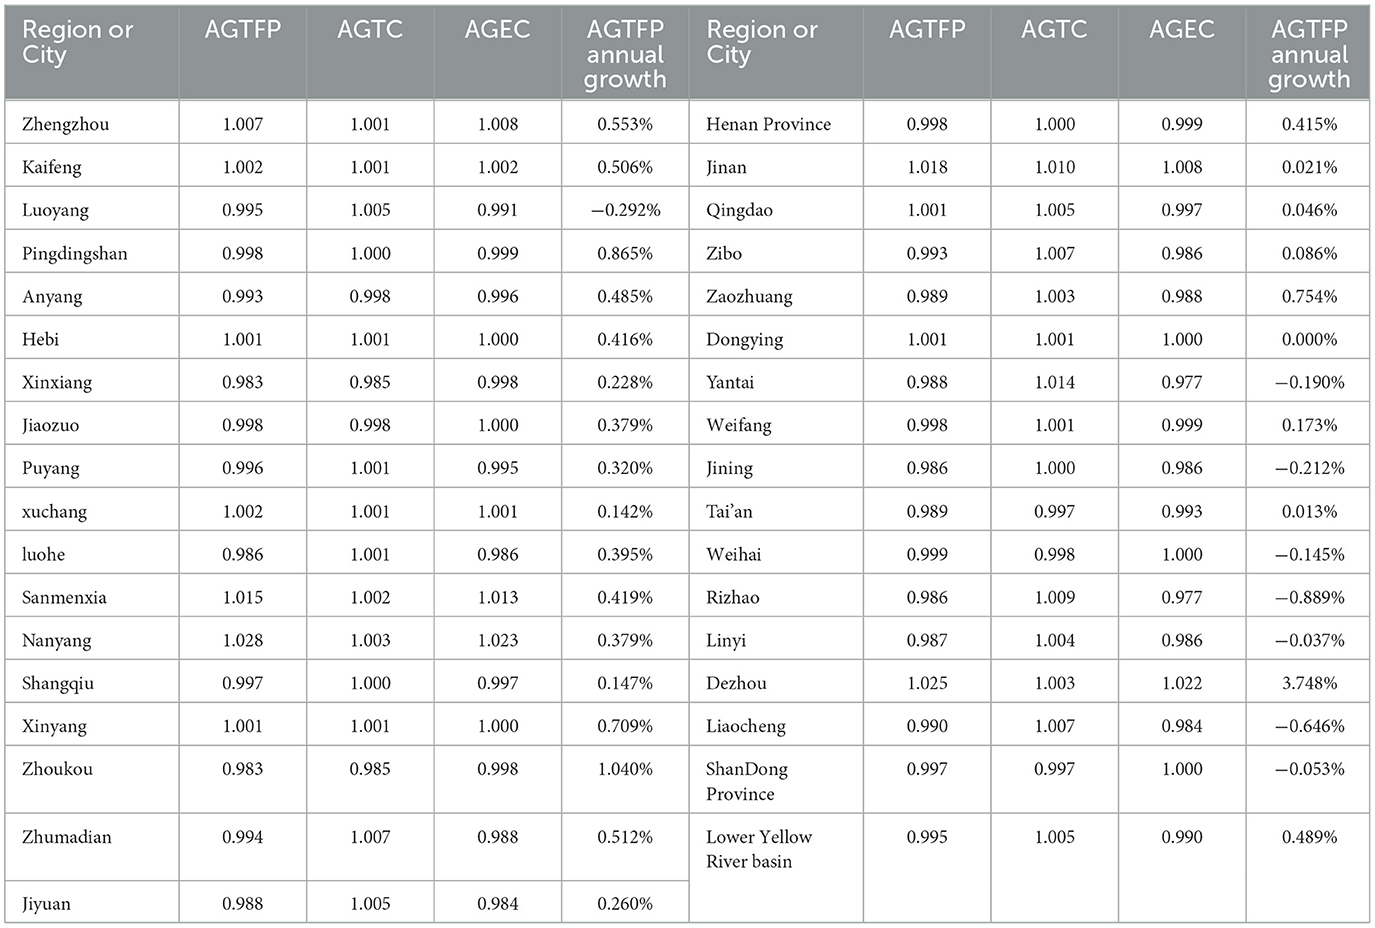
This paper employs the GML index to calculate the AGTFP of each region in the lower Yellow River Basin from 2009 to 2021 and decomposes these measurements. The mean values of AGTFP and agricultural technological progress (AGTC) are in Table 2. Additionally, the agricultural technological efficiency (AGEC) in the lower Yellow River Basin is 0.995, 1.005, and 0.990, respectively. It can be observed that the advancement in agricultural technology (AGTC) is the primary driver of AGTFP in the region.
AGTFP increased in most regions during the period, with particularly high rates in Dezhou City, Zaozhuang City, Zhoukou City, and Zhengzhou City, where the average annual growth rate exceeded 0.5 percent. Conversely, some regions, primarily in Shandong Province, experienced negative growth. The majority of these cities are situated in Henan Province, which boasts a robust agricultural sector with substantial investments in ecological infrastructure and a notable capacity for adopting novel agricultural green products. Cities with slower growth rates include Rizhao City, Liaocheng City, Luoyang City, and Yantai City, among others. Their average annual growth rates are −0.889%, −0.646%, −0.292%, and −0.190%, respectively. These cities are mainly in Shandong Province, where rapid development in manufacturing and tourism, combined with relatively low agricultural resources and a suboptimal ecological environment, leads to lower prioritization of agricultural green technology.
3.5 Moran's I index results
In this paper, we used Geoda software to calculate the global Moran's I index of AGTFP from 2009 to 2021 in the lower Yellow River basin to test its significance. The results are shown in Table 3.
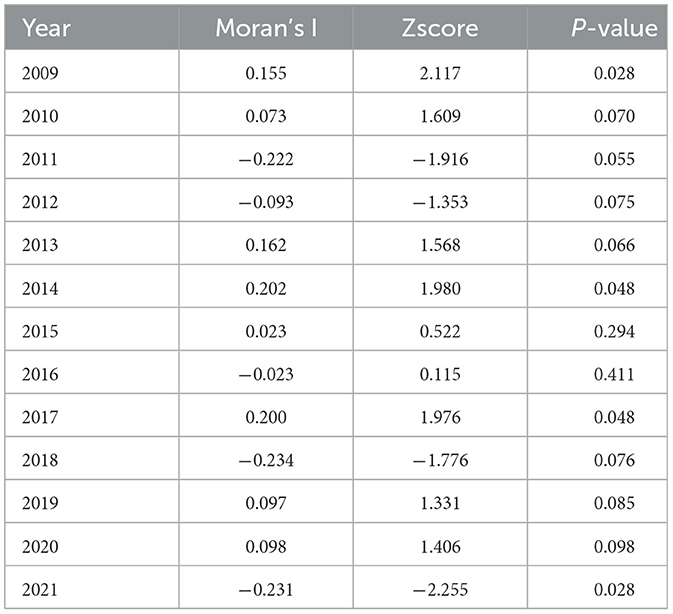
Table 3. Global Moran's I index of green total factor productivity in agriculture in the lower Yellow River Basin, 2009–2021.
The results demonstrate that Moran's I is greater than zero in the majority of years, exhibiting an overall oscillating trend. Furthermore, the majority of years showed statistically significant results. During the 12th Five-Year Plan period, a negative spatial correlation between AGTFP and the Lower Yellow River Basin was observed. However, as economic development advanced and environmental protection policies were implemented, AGTFP demonstrated a gradual positive correlation, shifting after 2016. AGTFP development is influenced by various natural environmental factors, such as topography, climate, and water sources. It is therefore unsurprising that neighboring major food-producing regions tend to have similar natural environments. This has led to a convergence of AGTFP levels in neighboring regions. From a social perspective, neighboring regions are expected to imitate and borrow from each other in the process of continuously promoting agricultural green total factor productivity (TFP). This is because they have similar natural and social conditions, providing a foundation for policy application and technology implementation. As a result, spatial correlation characteristics of AGTFP emerge.
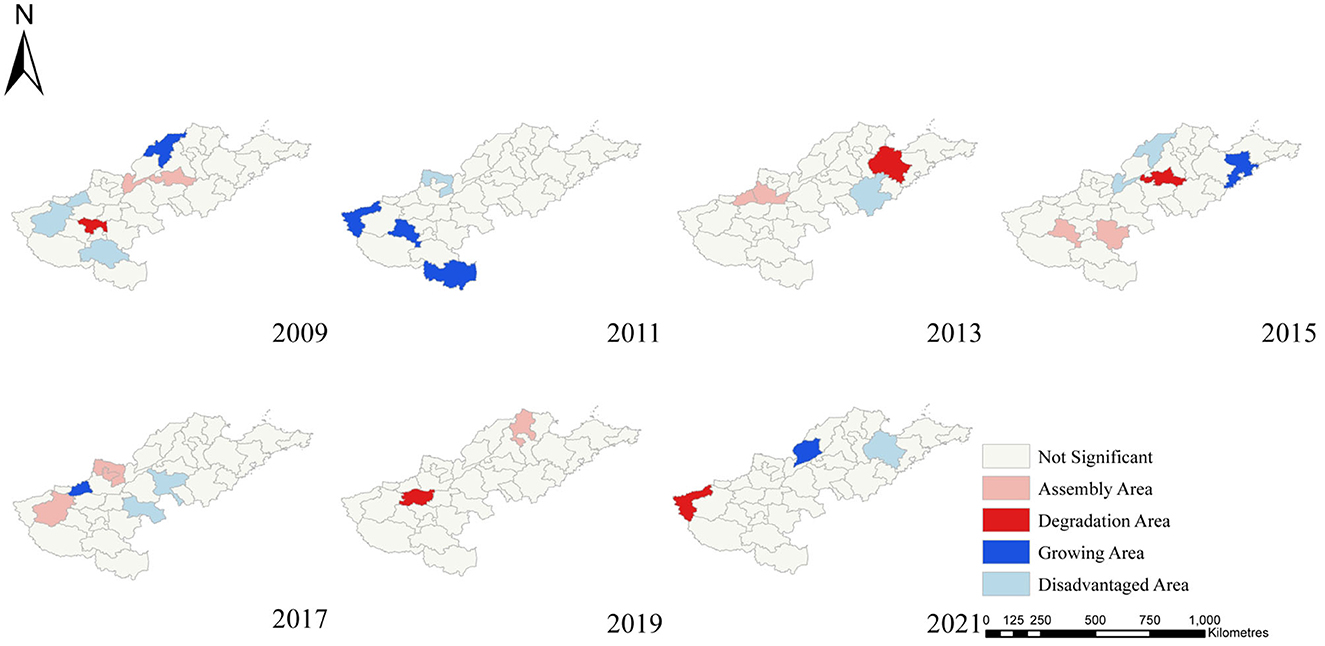
To elucidate the extent of auto-correlation disparities in AGTFP within the lower Yellow River basin, hot and cold spots were plotted by aligning the attributes of each spatial unit with its location at the α = 0.05 significance level, thus demonstrating the heterogeneity of the local spatial units and their evolving trends (see Figure 7). The calculated spatial units can be classified into four types, characterized as follows:
1. This area is characterized by a high intensity of AGTFP within its spatial unit and in neighboring units of superior agricultural green development quality, known as “high-high (H-H)” agglomeration areas. From 2009 to 2013, these areas were primarily located in the western portion of Shandong Province and the northern region of Henan Province. From 2014 to 2017, the intensive areas gradually declined, shifting toward the central and northern regions of Henan Province. From 2018 to 2021, the intensive areas in central Henan Province experienced a reduction and a subsequent relocation toward northern Shandong Province.
2. The term “lagging area” is used to describe a region where agricultural green development is poor, both within the region itself and in neighboring regions. Such regions are referred to as “low-low (L-L)” agglomeration areas. These areas are characterized by low levels of agricultural green development and exhibit similar lags in neighboring regions. The spatial distribution of these areas is more dispersed but concentrated in central Henan Province and northern Shandong Province from 2009 to 2015. From 2016 to 2019, the lagging areas were mainly concentrated in parts of Shandong Province, and by 2021, they shifted gradually to the coastal areas of Shandong Province.
3. The region is experiencing a period of growth. This type of region is characterized by low agricultural green development but exhibits relatively high agricultural green development in neighboring units. It can be classified as a “low-high (L-H)” agglomeration region. This type of region is characterized by the advancement of agricultural green technology and infrastructure, enhancing economic growth and facilitating the expansion of AGTFP, thus creating a novel spatial heterogeneity. Figure 7 illustrates that there is a paucity of these regions, primarily concentrated in Henan Province and other cities from 2009 to 2015. Subsequently, this type of region gradually ceased to exist and re-emerged in Liaocheng City in 2021.
4. The region in question is characterized by a decline in quality. This type of region is characterized by high agricultural green development, albeit at relatively low levels in neighboring units. The spatial relationship indicates a negative correlation and can be classified as a “High-Low (H-L)” agglomeration region. This suggests that the region's agricultural green development is associated with elevated carbon emissions that extend to neighboring regions. Consequently, while agricultural green development increases, the agricultural greenness of neighboring regions demonstrates a contrasting decline. This category of region is less prevalent, with most examples located in the southern part of Henan Province and the coastal cities of Shandong Province.
3.6 Evolution of distributional dynamics of AGTFP growth in the lower Yellow River basin
This paper utilizes kernel density analysis to gain deeper insight into the time-series dynamic evolution characteristics of the agricultural green total factor productivity growth rate (AGTFP). Figure 8 illustrates the distribution of AGTFP kernel density estimates for the Lower Yellow River Basin and the two principal grain-producing regions within the basin.

Figure 8. Estimation of AGTFP kernel density in the Lower Yellow River Basin and the two main grain producing regions within the basin.
The kernel density estimation of AGTFP in the Lower Yellow River Basin, as illustrated in Figure 8A, from 2009 to 2021, demonstrates a rightward shift in the position of the curve, the center of the kernel density function, and the curve as a whole. This indicates that AGTFP in the Lower Yellow River Basin follows a gradual growth process. Regarding the peak value, the evolution process presents a high-low-high pattern, with an expanded change interval, indicating a certain difference in AGTFP in the Lower Yellow River Basin. Regarding curve morphology, the period from 2009 to 2013 shows a clear single-peak distribution. From 2014 to 2018, the peak evolved from a single peak to a bimodal distribution, characterized by a secondary peak. From 2019 to 2021, the peak shifts from a bimodal to a trimodal distribution, with two additional smaller peaks. From 2019 to 2021, the peak transforms from a double peak with “one main peak and one peak” to a triple peak with “one main peak and two small peaks.” This suggests that AGTFP in the Lower Yellow River Basin experienced a notable surge during the observation period. However, the discrepancy between provinces gradually increased, leading to multilevel differentiation. This may be attributed to differing attitudes toward green agricultural development among various municipalities, influenced by factors including economic development, urban-rural structure, and the application of green agricultural technologies. Consequently, there is a disparity in R&D and the application of green agricultural technologies among municipalities, increasing the inter-provincial disparity in AGTFP.
Figure 8B illustrates the AGTFP kernel density estimation for the two principal grain-producing regions from 2009 to 2021. The data indicate a rightward shift in the position of the curve, the center of the kernel density function, and the curve as a whole, suggesting growth in AGTFP in Henan Province. Regarding the evolution of the peak, it has diminished, indicating that the disparity in AGTFP between cities in Henan Province has increased. The curve exhibited a single-peak distribution from 2009 to 2012. From 2013 to 2016, the distribution pattern transformed from a single-peak distribution to a “one main peak, one peak” pattern. From 2017 to 2020, the distribution pattern shifted from a “one main peak, one peak” pattern to a single-peak distribution. Finally, in 2021, the distribution pattern reverted to a “one main peak, one peak” pattern. This suggests that during the observation period, the AGTFP gap in Henan Province showed a pattern of strengthening and then weakening. This may be attributed to Henan Province's ongoing economic advancement and distinctive geographical advantages, which have led to a greater focus on low-carbon development. This focus has contributed to the expansion of AGTFP within the province and reduced the gap between municipalities.
Figure 8C illustrates that from 2009 to 2021, the center of the kernel density function and the curve as a whole exhibited a rightward shift, indicating that AGTFP in Shandong Province experienced growth. Regarding the change in peak value, the wave peak's transition from decreasing to increasing and then decreasing again reflects the ongoing increase in the AGTFP gap between cities in Shandong Province. The curve's shape demonstrates a transition from a single-peak distribution from 2010 to 2014, evolving to a “one main peak, one peak” distribution from 2015 to 2017, and then shifting gradually to a triple-peak distribution with “one main peak and two smaller peaks” from 2018 to 2021. The data demonstrate significant disparities in AGTFP across Shandong Province. Cities and municipalities exhibit distinct industrial structures and development trajectories, with considerable variation in financial investment in agricultural green construction. These factors collectively contribute to the ongoing expansion of AGTFP in Shandong Province.
To gain further insight into the spatio-temporal evolution characteristics of AGTFP, traditional, and space-based Markov transfer probability matrices have been constructed. A classification of agricultural green total factor productivity based on LISA clustering was devised, comprising four states: lagging, degraded, growing, and balanced. These states are denoted by k = 1, 2, 3, 4, respectively. In this context, transfer from a low-value region to a high-value region is defined as upward migration, while transfer from a high-value region to a low-value region is defined as downward migration. Table 4 presents the traditional Markov transfer probability matrix for AGTFP from 2009 to 2021, based on the calculations provided.
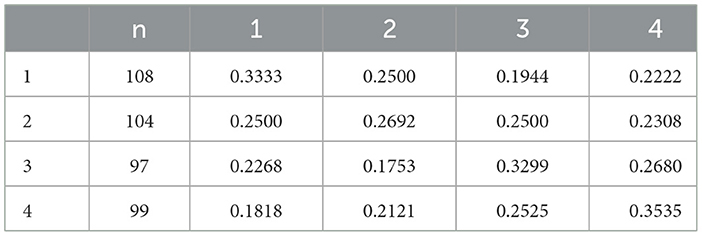
Table 4. Markov matrix for carbon emission performance classes at the agriculture level of lower Yellow river basin in 2009–2021.
1. The lower diagonal values of intra-group mobility of AGTFP are all larger than the non-diagonal values, which are 0.3333, 0.2692, 0.3299, and 0.3535, respectively. This indicates that there is a “path-dependence” effect in the transfer of different states of AGTFP.
2. The probability of transferring AGTFP to a neighboring state is relatively low. The probability of transferring the backward state to the degraded state is 0.2500, the probability of transferring the growth state to the equilibrium state is 0.2680, and the maximum probability of transferring all kinds of states across the state is 0.2308. This indicates that there is a possibility of transferring across the state.
3. There is a Matthew effect in the evolution process of AGTFP. The probability of maintaining the original state in the backward state and the equilibrium state is greater than that of the degraded state and the equilibrium state. Furthermore, the region in the equilibrium state is more easily maintained in its leading position. However, it is more difficult for the backward region to transfer to a more optimal state, and the phenomenon of bifurcation occurs.
The addition of spatial lag conditions to the traditional Markov chain transfer probability matrix allows the construction of a spatial Markov transfer probability matrix. The effect of different adjacent geographical contexts on AGTFP transfer is explored by comparative analysis of the transfer probability of AGTFP in different adjacent geographical contexts. Table 5 presents the spatial Markov transfer probability matrix of various AGTFP types in the lower Yellow River basin from 2009 to 2021, as calculated:
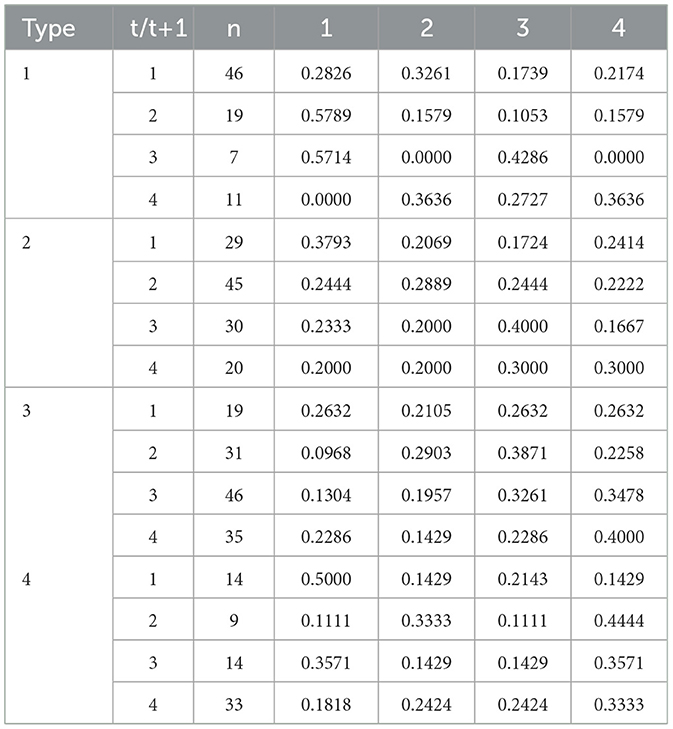
Table 5. Spatial Markov transfer probability matrices of different types of AGTFP in the lower Yellow River basin in 2009–2021.
1. The lower diagonal values of intra-group mobility for AGTFP are all larger than the non-diagonal values, which are 0.3333, 0.2692, 0.3299, and 0.3535, respectively. This indicates a “path-dependence” effect in the transfer between different states of AGTFP.
2. The probability of transferring AGTFP to a neighboring state is relatively low. The probability of transferring from the backward state to the degraded state is 0.2500, from the growth state to the equilibrium state is 0.2680, and the maximum probability of transferring across all states is 0.2308. This suggests that there is a possibility of transferring across different states.
3. A Matthew effect is observed in the evolution process of AGTFP. The probability of maintaining the original state is higher for the backward and equilibrium states compared to the degraded state. Furthermore, regions in the equilibrium state are more likely to maintain their leading position. However, it is more difficult for the backward region to transition to a more optimal state, leading to a phenomenon of bifurcation.
Table 6 presents the results of the long-term evolution trend analysis of AGTFP transfer within the lower Yellow River basin. In the absence of spatial lag, comparing the equilibrium state with the initial state based on the traditional Markov transfer probability matrix reveals a reduction in the number of backward and degraded states and an increase in the probability of upward transfer. For example, the initial probability of transferring to the equilibrium state is 0.0294, which increases to 0.2716 under equilibrium conditions. Over time, a more balanced distribution of the four state types is expected to occur under conditions where degraded areas are in proximity to one another. In neighboring conditions, the probability of an upward shift in AGTFP is higher than that of a downward shift. Based on these conclusions, it can be posited that AGTFP in each backward state region will transition to a higher state. Furthermore, the overall trend in AGTFP transfer shows an upward pattern.
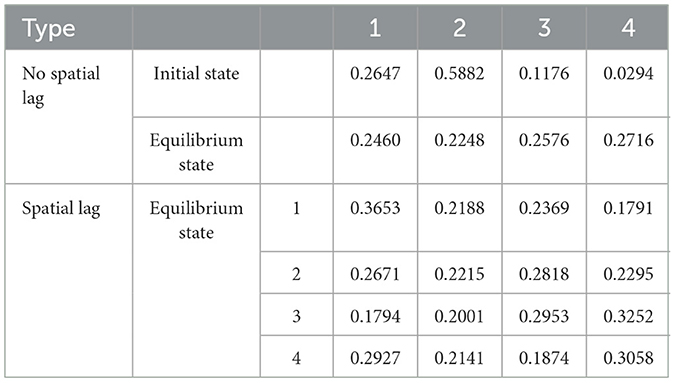
Table 6. The evolution trend prediction for carbon emission performance classes at the agriculture level of lower Yellow river basin in 2009–2021.
In conclusion, the spatial spillover of agricultural economic activities between regions is influenced by the interaction of various factors, leading to changes in both the positive and negative impacts of these activities. The spatial spillover effect of AGTFP results from the collective influence of multiple geographic elements, including market conditions, technology, and systems. Given the current trajectory, the long-term evolution of AGTFP in the Lower Yellow River Basin appears promising. AGTFP is likely to continue growing over time, with a clear tendency toward concentration at higher values. Additionally, the number of regions exhibiting each performance type is expected to rise, progressing from lower to higher performance categories. The impact of varying neighboring regional contexts on the trajectory of AGTFP is variable. Cities near regions with less advanced development exhibit a reduced tendency for spatial shifts in AGTFP advancement. Conversely, cities close to developed regions have a higher probability of AGTFP transfer to these developed areas. Overall, AGTFP shows an increasing trend.
Through the analysis of the spatial Markov chain, we found that when a region is in the growth area, the likelihood of upward transfer increases, while other areas are more likely to maintain the status quo, indicating that China's agriculture remains in a transformative phase toward intelligence and sustainability. Currently, China emphasizes the importance of adhering to a strategy of coordinated regional development to dismantle administrative barriers, reduce market segmentation, and promote regional economic integration. From the perspective of inter-regional economic development, we conclude that the green development of agriculture in the main grain-producing areas of the lower Yellow River Basin is in a critical phase, and the overall development situation shows a stable and improving trend. Thus, based on the findings of this paper, we conclude that the agricultural aspect of China's inter-regional low-carbon development evolves from low to high quality, dependent on the development of surrounding areas. However, factors such as industry, labor force, and natural environment impede the upward transfer of agricultural low-carbon development. There is a need to prioritize the development of various regions and subsequently extend benefits to surrounding areas. While this aligns with the theory of the “trickle-down effect,” it must be contextualized within China's specific circumstances. Through regional coordination, we aim to achieve low-carbon agricultural co-development and establish ecological barriers to mitigate ecological losses resulting from economic development.
4 Conclusions and implications
This paper employed the EBM model to assess the AGTFP of cities in the Lower Yellow River Basin from 2008 to 2021 and further decomposed AGTFP measurements using the GML index to explore the driving roles of AGEC and AGTC in AGTFP growth. Through the adoption of the Moran index, the spatial interactions between AGTFP in cities across the Lower Yellow River Basin were examined, revealing interregional linkages. The time flow characteristics of AGTFP growth were analyzed using kernel density. Finally, spatial-temporal analyses of AGTFP were conducted using spatial Markov chains to explore the fundamental characteristics and spatial-temporal dynamics across regions with varying development levels in the pursuit of low-carbon agriculture in the Lower Yellow River Basin. The principal conclusions of the study are as follows:
Firstly, agricultural carbon emissions in the Lower Yellow River Basin exhibit an inverted “U” trend, with an average annual growth rate of −1.2%. These emissions peaked at 23.730 million tons in 2013 before declining annually. The primary source of agricultural carbon emissions is chemical fertilizers, with the majority originating from Shandong Province. Regionally, this indicates a persistent pattern of “high in the southwest, high in the northeast, and low elsewhere” in the main grain-producing areas. This distribution confirms that the majority of agrarian carbon emissions originate from Shandong Province. Additionally, areas with the highest agricultural carbon emissions are concentrated in the more developed agricultural regions. The spatial pattern of agrarian carbon emissions is characterized by “high in the southwest and low in the northeast,” suggesting that the predominant agricultural development mode in the main grain-producing areas is still characterized by high carbon intensity.
Secondly, an analysis of the spatial and temporal data reveals a fluctuating growth trend in the cumulative AGTFP index in the Lower Yellow River Basin. The advancement of green technology in agriculture is the primary driver of AGTFP growth in the Lower Yellow River Basin, while the efficiency of this technology has a relatively limited impact on AGTFP growth. During the observation period, AGTFP in Shandong Province was higher than in Henan Province. However, from 2011 onwards, Henan Province surpassed Shandong Province in AGTFP, assuming the lead position. With a few exceptions, where AGTFP growth is closely linked to neighboring cities and municipalities, most regions exhibit a weakly linked, isolated development pattern.
Thirdly, the results of the dynamic evolution show a tendency toward unipolar growth in the AGTFP distribution pattern, with pronounced mobility in distribution dynamics. Regarding peak changes, AGTFP in the Lower Yellow River Basin has increased during the observation period, narrowing the gap between regions. The evolution of AGTFP in Henan Province resembles that in the Lower Yellow River Basin, while Shandong Province's overall kernel density pattern differs from both the Lower Yellow River Basin and Henan Province. Despite the observed increase in AGTFP, the pattern exhibits characteristics of multipolarization. Regarding spatial dynamics, a “path dependence” effect is observed in AGTFP growth transfer in the Lower Yellow River Basin. Furthermore, AGTFP transfer can lead to a “club convergence” phenomenon within specific geographic ranges due to the spillover effects exerted by neighboring regions. The probability of AGTFP remaining in its original state is higher than the probability of upward transfer. This indicates that spatial conditions significantly affect AGTFP development and that there is also a notable “Matthew effect.”
Optimizing AGTFP development globally is a crucial factor in accelerating the implementation of higher quality and productivity standards while promoting environmentally sustainable agricultural practices. It also plays a key role in advancing intelligent and environmentally sustainable agricultural development and stimulating new industry growth. Additionally, it is crucial for reducing regional development disparities and for promoting the integrated advancement of agricultural development and ecological systems. Based on the research findings discussed, this paper offers the following insights:
Firstly, it is improve awareness among stakeholders of green development and gradually shift the existing agricultural development model. Although the provinces in the Lower Yellow River Basin play a crucial role in ensuring China's food security, the agricultural economic development and resource endowment vary across cities within the basin, leading to disparities in the adoption of green technologies and the process of green transformation. According to the National Agricultural Green Development Plan for the 14th Five-Year Plan of the Ministry of Development of China 2021, in order to alleviate the vicious competition brought about by homogenization, cities should formulate locally adapted agricultural green development plans according to the current state of local development and demand, among other factors. it is essential to clarify the role of ecological protection in the Yellow River Basin in promoting economic development, to establish the government as a hub between agricultural stakeholders and economic development, encourage production and management entities to adopt environmentally friendly practices, and provide relevant policy support and incentive mechanisms.
Secondly, it is imperative to enhance research and development in agricultural green technology, along with the transformation and application of its findings. From a macro perspective, it is important to bolster policy support for agricultural green technology innovation, establish diverse funding sources, and maintain a dynamic innovation workforce by facilitating the steady transfer of professionals in relevant fields, thereby ensuring continuous advancement in agricultural green technology. Promoting the application of agricultural green technology outcomes in relevant agricultural scenarios is essential. Additionally, developing agricultural green technology services, optimizing technology transfer, and enhancing the dissemination and application of agricultural green technology are key objectives. Also, it is essential to focus on reducing pesticide and fertilizer use, mitigating pollutant loss from farmland, and promoting soil testing and formula application, organic fertilizer substitution, biological control technologies, and other methods to minimize ecological impact.
Thirdly, the objective is to achieve a form of regional development that is synergistic in nature, whereby economic growth is balanced with the protection of the natural environment. The principal objectives are to reinforce the exchange and collaboration on green technologies in agriculture between towns and cities, to encourage the inter-provincial dissemination of green technologies, to establish a cross-regional cooperation mechanism, to create a regional platform for agricultural cooperation, and to promote the coordinated development of greening in agriculture. The key to achieving coordinated development of urbanization and agricultural modernization is to integrate urban and rural areas, resources and the environment. Such integration should promote the orderly and balanced development of the spatial distribution of green total factor productivity in agriculture, thereby enhancing the impact of high-quality agricultural development on neighboring regions. This, in turn, should support economic and social development strategies that are consistent with the spatial development framework.
Data availability statement
The original contributions presented in the study are included in the article/Supplementary material, further inquiries can be directed to the corresponding author.
Author contributions
JH: Data curation, Formal analysis, Investigation, Methodology, Software, Visualization, Writing – original draft, Writing – review & editing, Funding acquisition, Conceptualization. MH: Conceptualization, Data curation, Formal analysis, Methodology, Supervision, Validation, Writing – original draft, Writing – review & editing, Project administration, Resources.
Funding
The author(s) declare that no financial support was received for the research, authorship, and/or publication of this article.
Conflict of interest
The authors declare that the research was conducted in the absence of any commercial or financial relationships that could be construed as a potential conflict of interest.
Publisher's note
All claims expressed in this article are solely those of the authors and do not necessarily represent those of their affiliated organizations, or those of the publisher, the editors and the reviewers. Any product that may be evaluated in this article, or claim that may be made by its manufacturer, is not guaranteed or endorsed by the publisher.
Supplementary material
The Supplementary Material for this article can be found online at: https://www.frontiersin.org/articles/10.3389/fsufs.2024.1474813/full#supplementary-material
Footnotes
1. ^The data mentioned in the paper were obtained from the China Agricultural Statistical Yearbook (https://www.stats.gov.cn), Henan Provincial Statistical Yearbook (https://tjj.henan.gov.cn), Shandong Provincial Statistical Yearbook (http://tjj.shandong.gov.cn), and the EPS database (https://www.epsnet.com.cn). Missing data were filled in using interpolation and the ARIMA filling method.
2. ^All remotely sensed data in this article were obtained from the Geospatial Data Cloud (https://www.gscloud.cn/).
References
Adenubi, O. T., Temoso, O., and Abdulaleem, I. (2021). Has mobile phone technology aided the growth of agricultural productivity in sub-Saharan Africa? South African J. Econ. Manag. Sci. 24, 1–9. doi: 10.4102/sajems.v24i1.3744
Allaire, G., Poméon, T., Maigné, E., Cahuzac, E., Simioni, M., and Desjeux, Y. (2015). Territorial analysis of the diffusion of organic farming in France: between heterogeneity and spatial dependence. Ecol. Indic. 59, 70–81. doi: 10.1016/j.ecolind.2015.03.009
Araújo, M. L. S.d, Rufino, I. A. A., Silva, F. B., Brito, H. C.d., et al. (2024). The relationship between climate, agriculture and land cover in Matopiba, Brazil (1985–2020). Sustainability 16:2670. doi: 10.3390/su16072670
Baležentis, T., Li, T., and Chen, X. (2021). Has agricultural labor restructuring improved agricultural labor productivity in China? A decomposition approach. Socioecon. Plann. Sci. 76:100967. doi: 10.1016/j.seps.2020.100967
Bernard, B. M., Song, Y., Narcisse, M., Hena, S., and Wang, X. (2023). A nonparametric analysis of climate change nexus on agricultural productivity in Africa: implications on food security. Renew. Agric. Food Syst. 38:e9. doi: 10.1017/S1742170522000424
Bocean, C. G. (2024). A cross-sectional analysis of the relationship between digital technology use and agricultural productivity in EU countries. Agriculture 14:519. doi: 10.3390/agriculture14040519
Gebeyehu, L., and Bedemo, A. (2024). How agricultural credit and subsidies impact agricultural productivity in Ethiopia: empirical evidence using ardl model. Cogent Food Agric. 10:2329118. doi: 10.1080/23311932.2024.2329118
He, H., and Ding, R. (2023). Spatiotemporal heterogeneity effect of technological progress and agricultural centrality on agricultural carbon emissions in China. Front. Environ. Sci. 10:1078357. doi: 10.3389/fenvs.2022.1078357
Huang, L., and Ping, Y. (2024). The impact of technological innovation on agricultural green total factor productivity: the mediating role of environmental regulation in China. Sustainability 16:4035. doi: 10.3390/su16104035
Jin, M., Feng, Y., Wang, S., Chen, N., and Cao, F. (2024). Can the development of the rural digital economy reduce agricultural carbon emissions? A spatiotemporal empirical study based on China's provinces. Sci. Total Environ. 939:173437. doi: 10.1016/j.scitotenv.2024.173437
Jin, S., and Zhong, Z. (2024). Impact of digital inclusive finance on agricultural total factor productivity in Zhejiang Province from the perspective of integrated development of rural industries. PLoS ONE 19:e0298034. doi: 10.1371/journal.pone.0298034
Le Clech, N., and Fillat Castejón, C. (2020). New estimates of total factor productivity, technical and efficiency changes for the global agricultural economy. No. ART-2020-118376. doi: 10.5424/sjar/2020182-15224
Liu, C. J., Zhai, X. W., and Ai, K. Y. (2024). Ecological safety assessment and convergence of resource-based cities in the yellow river Basin. Sustainability 16:2983. doi: 10.3390/su16072983
Maranhão, R. L. A., de Carvalho Júnior, O. A., Hermuche, P. M., Gomes, R. A. T., McManus Pimentel, C. M., and Guimarães, R. F. (2019). The spatiotemporal dynamics of soybean and cattle production in Brazil. Sustainability 11:2150. doi: 10.3390/su11072150
Moran, P. A. P. (1950). Notes on continuous stochastic phenomena. Biometrika 37, 17–23. doi: 10.1093/biomet/37.1-2.17
Myeki, L. W., Matthews, N., and Bahta, Y. T. (2023). Decomposition of green agriculture productivity for policy in Africa: an application of global malmquist–luenberger index. Sustainability 15:1645. doi: 10.3390/su15021645
Ortiz-Bobea, A., Ault, T. R., Carrillo, C. M., Chambers, R. G., and Lobell, D. B. (2021). Anthropogenic climate change has slowed global agricultural productivity growth. Nat. Clim. Chang. 11, 306–312. doi: 10.1038/s41558-021-01000-1
Pastor, J. T., and Lovell, C. A. K. (2005). A global Malmquist productivity index. Econ. Lett. 88, 266–271. doi: 10.1016/j.econlet.2005.02.013
Quddus, A., and Kropp, J. D. (2020). Constraints to agricultural production and marketing in the lagging regions of Bangladesh. Sustainability 12:3956. doi: 10.3390/su12103956
Rittirong, J., Chuenglertsiri, P., Nitnara, P., and Phulkerd, S. (2024). Developing key indicators for sustainable food system: a comprehensive application of stakeholder consultations and Delphi method. Front. Sustain. Food Syst. 8:1367221. doi: 10.3389/fsufs.2024.1367221
Rossi, F. S., de Araújo Santos, G. A., de Souza Maria, L., Lourençoni, T., Pelissari, T. D., Della-Silva, J. L., et al. (2022). Carbon dioxide spatial variability and dynamics for contrasting land uses in central Brazil agricultural frontier from remote sensing data. J. South Am. Earth Sci. 116:103809. doi: 10.1016/j.jsames.2022.103809
Shah, W. U. H., Hao, G., Yasmeen, R., Yan, H., and Qi, Y. (2024). Impact of agricultural technological innovation on total-factor agricultural water usage efficiency: evidence from 31 Chinese Provinces. Agric. Water Manag. 299:108905. doi: 10.1016/j.agwat.2024.108905
Spolador, H. F. S., and Danelon, A. F. (2024). New evidence of the driving forces behind Brazil's agricultural TFP growth—A stochastic frontier analysis with climatic variables and land suitability index. Austr. J. Agric. Resour. Econ. 68, 366–385. doi: 10.1111/1467-8489.12558
Tone, K. (2001). A slacks-based measure of efficiency in data envelopment analysis. Eur. J. Oper. Res. 130, 498–509. doi: 10.1016/S0377-2217(99)00407-5
Tone, K., and Tsutsui, M. (2010). An epsilon-based measure of efficiency in DEA – A third pole of technical efficiency. Eur. J. Oper. Res. 207, 1554–1563. doi: 10.1016/j.ejor.2010.07.014
Touch, V., Tan, D. K. Y., Cook, B. R., Liu, D. L., Cross, R., Tran, T. A., et al. (2024). Smallholder farmers' challenges and opportunities: implications for agricultural production, environment and food security. J. Environ. Manage. 370:122536. doi: 10.1016/j.jenvman.2024.122536
Yaqoob, N., Jain, V., Atiq, Z., Sharma, P., Ramos-Meza, C. S., Shabbir, M. S., et al. (2022). The relationship between staple food crops consumption and its impact on total factor productivity: does green economy matter? Environ. Sci. Pollut. Res. 29, 69213–69222. doi: 10.1007/s11356-022-22150-5
Yin, C., Yang, K., and Tian, Y. (2024). Agroecological total factor productivity growth in China: empirical facts, regional differences and dynamic evolution. China Rural Econ. 20–43. doi: 10.20077/j.cnki.11-1262/f.2024.02.002
Zhang, J. (2024). Spatial distribution of green total factor productivity in chinese agriculture and analysis of its influencing factors. Polish J. Environ. Stud. 33, 2473–2485. doi: 10.15244/pjoes/174780
Zhang, X., Sun, S. H., and Yao, S. B. (2023). Spatiotemporal distribution and dynamic evolution of grain productivity efficiency in the Yellow River Basin of China. Environ. Dev. Sustain. 26, 12005–12030. doi: 10.1007/s10668-023-03619-w
Zhou, Z., Sharif, A., Inglesi-Lotz, R., and Bashir, M. F. (2024). Analysing the interplay between energy transition, resource consumption, deforestation, and environmental factors on agricultural productivity: insights from APEC countries. J. Clean. Prod. 446:141408. doi: 10.1016/j.jclepro.2024.141408
Keywords: green agricultural development, low carbon, lower yellow river basin, spatial and temporal evolution, carbon emission efficiency
Citation: He J and Han M (2024) Analysis of spatial and temporal characteristics and evolution of green total factor productivity in agriculture in the lower Yellow River basin. Front. Sustain. Food Syst. 8:1474813. doi: 10.3389/fsufs.2024.1474813
Received: 02 August 2024; Accepted: 14 October 2024;
Published: 11 November 2024.
Edited by:
Guochang Fang, Nanjing University of Finance and Economics, ChinaReviewed by:
Wenbin Zhang, Jiangsu Second Normal University, ChinaEmiliana Silva, University of the Azores, Portugal
Copyright © 2024 He and Han. This is an open-access article distributed under the terms of the Creative Commons Attribution License (CC BY). The use, distribution or reproduction in other forums is permitted, provided the original author(s) and the copyright owner(s) are credited and that the original publication in this journal is cited, in accordance with accepted academic practice. No use, distribution or reproduction is permitted which does not comply with these terms.
*Correspondence: Mingyang Han, bWF0ZXJpYWwwNTA0QDE2My5jb20=
 Junru He
 Mingyang Han