 Qiyan Ding
 Zhen Yang1,2*
- 1College of Urban and Environmental Sciences, Central China Normal University, Wuhan, China
- 2Key Laboratory for Geographical Process Analysis & Simulation of Hubei Province, Central China Normal University, Wuhan, China
High-quality development refers to an efficient, equitable and sustainable development aimed at meeting the growing needs of individuals for a better life, and is an inevitable requirement for agriculture and rural areas development. Based on data at the provincial level, this study used the entropy method, Dagum Gini coefficient decomposition, and spatial Markov chain to estimate the spatio-temporal differentiation of high-quality development of agriculture and rural areas (HQDAR) in China from 2008 to 2022. Additionally, the geographically and temporally weighted regression was employed to analyze the spatial heterogeneity of influencing factors. The results showed that: (1) During the study period, the level of HQDAR in China increased steadily, and the spatial distribution showed a pattern of highest in the eastern region, followed by the center and the lowest in the west. (2) The HQDAR in China had obvious spatial agglomeration characteristics. Hot spots were primarily situated in some eastern and central provinces, while cold spots were primarily situated in the western regions. (3) There were clear spatial differences in the HQDAR in China, mainly due to inter-regional differences, followed by intra-regional differences and hypervariable density. (4) The HQDAR in China maintained the stability of the original state and demonstrated an obvious trend of overall upward transfer. The neighborhood background had an important influence on the change in its transfer, and the influence of varying neighborhood backgrounds was different. (5) The influencing factors showed significant spatio-temporal heterogeneity. The urbanization level, transportation infrastructure, scientific and technological innovation ability, and Internet penetration rate mainly had positive effects, while industrial structure and rural population aging mainly had negative effects. These findings can provide relevant policy recommendations for improving the quality of agriculture and rural areas.
1 Introduction
Since the reform and opening up, the development of agriculture and rural areas has made tremendous progress in China, and there have been considerable changes in the rural landscape. However, problems remain in some agriculture and rural areas, such as unbalanced development within rural areas, high consumption of agricultural production resources, and inadequate living environment. The condition of agriculture and rural areas is still a major issue affecting the national economy and human livelihoods. The 19th National Congress of the Communist Party of China proposed the implementation of a rural revitalization strategy to accelerate the modernization of agriculture and rural areas. The 20th National Congress of the Communist Party of China established an overall arrangement for agriculture and rural work, emphasizing the need to prioritize the development of these sectors and to accelerate the process of building a powerful agricultural nation. At present, agriculture and rural in China are in the transition from traditional to modern, from quantity increasing to quality increasing, and gradually entering the high-quality growth stage. As a crucial part of high-quality development, the level of high-quality development of agriculture and rural areas (HQDAR) is an important basis for promoting rural revitalization and solving the problem of unbalanced regional development. Therefore, a comprehensive assessment of the level of HQDAR can clarify and grasp its status and regularity, which is of great significance for identifying the problems existing in agricultural and rural development in China, formulating more targeted agricultural and rural development policies, and comprehensively promoting modernization.
In recent years, scholars have produced abundant studies on the quality of development of agriculture, rural areas, and the integration of the two from the perspectives of modernization or high-quality or sustainable development, concentrating on the basic connotation, measurement and evaluation, influencing factors, and paths to enhancement. In terms of basic connotation, there is currently no uniform definition of development connotation. Zhao and Cui (2024) argued that the HQDAR represented a coupled symbiosis of agriculture, rural areas, and farmers, which were complementary and inseparable in extension. Wei (2019) believed that agriculture and rural modernization constitute an organic whole that included the modernization of rural industry, ecology, culture, governance, and life. Some scholars have interpreted the meaning of HQDAR from the new development concepts, as development with innovation as the primary driving force, coordination as the endogenous feature, greenness as the universal form, openness as the necessary path, and sharing as the fundamental purpose (Ji, 2021).
In terms of measurement and evaluation, as the connotation of development quality is relatively rich, it is typically measured by constructing multi-dimensional indicators. Scholars have mainly used the analytic hierarchy process (Liu and Du, 2021; Yang et al., 2022; Abdar et al., 2022), multi-attribute utility theory (Talukder et al., 2018), entropy method (Zhao and Cui, 2024; Wang, 2024; Tian et al., 2021; Mukairanmu, 2022), entropy weight TOPSIS method (Yang and Zhong, 2024; Chen et al., 2018), benefit of doubt approach (Magrini and Giambona, 2022), and comprehensive weight method (Ji, 2021) to construct an evaluation system to comprehensively measure the regional development quality of agriculture and rural areas. Additionally, scholars have mainly used the spatial autocorrelation (Liu et al., 2020), kernel density estimation (Liu et al., 2023), Dagum Gini coefficient decomposition (Chen and Zeng, 2022), and Markov chain (Guo and Liu, 2022) to explore the distribution features, regional differences and evolution trends of regional development level. For instance, Abdar et al. (2022) identified sustainability indicators in terms of economic, social and environmental dimensions and then weighted them using pairwise comparative and hierarchical analyses to empirically assess agricultural sustainability in Iranian provinces. Wang and Li (2024) used the entropy method to measure HQDAR level in China based on scientific and technological innovation development, output quality and efficiency improvement, structural optimization layout, green ecological development, and coordinated and shared development. According to the theoretical framework and practical demands, Yang and Zhong (2024) assessed the level of agricultural modernization by applying the entropy weight TOPSIS method from three dimensions of agricultural inputs, agricultural outputs, and rural social development, and investigated its spatial evolution by applying spatial autocorrelation and Dagum Gini coefficient decomposition.
In terms of influencing factors, scholars have mainly used the qualitative analysis (Dong, 2023), coupling coordination evaluation model (Jiang et al., 2022), obstacle degree model (Chen et al., 2022), geographically weighted regression (Zhou and Zhang, 2024), geographic detector (Zhao and Cui, 2024; Hu and Zhuang, 2024), and panel regression model (Du et al., 2023; Ahmed et al., 2022) to study influencing factors such as digital technology (Fu, 2023; Tang, 2022), urbanization level (Gu, 2024; Vasylieva and James, 2021), agricultural socialization service (Li et al., 2024), digital finance (Wang et al., 2021; Zhao and Zhang, 2023), urban–rural integration (Yao and Li, 2023), vocational education (Huang et al., 2024), population aging (Tang and Jiang, 2023), fiscal finance (Han and Cao, 2023; Rozélia et al., 2020), and agricultural credit (Bekun et al., 2018). Li et al. (2024) used a panel regression model to find that agricultural socialization services could improve rural development, but the effects of different types of socialized agricultural services were different. Through qualitative analysis, Dong (2023) found that the new digital infrastructure was an important factor in agricultural and rural development. Ahmed et al. (2022) used the panel auto-regressive distributed lags method to propose that agricultural insurance can encourage farmers to adopt environmentally friendly production technology, improve production efficiency and promote the improvement of agricultural quality. Hu and Zhuang (2024) used geographic detector to find that rural per capita GDP, government support and rural industrial modernization were decisive factors for the differentiation of Chinese-style agricultural and rural modernization, but the influence of these factors was decreasing year by year.
In terms of the promotion path, Xue (2023) determined that digital rural construction should be the focus and digital agriculture should be the core of the process of advancing the HQDAR. Dong and Zhao (2022) found that it is imperative to enhance land-intensive management and actively foster a new form of agricultural entity. Zhang and Li (2024) determined that agricultural and rural modernization should be promoted by optimizing the industrial structure, building a livable and pleasant countryside, constructing rural cultural management systems, and promoting common prosperity in the spiritual lives of farmers. Chen and Lu (2022) noted that promoting inclusive growth in rural areas accelerates the construction of modern agricultural industries and promotes the integration of urban and rural development. Smith (2020) suggested that high-quality development of agriculture required robust and cost-effective monitoring and enforcement tools. Chen (2020) emphasized the necessity of promoting development by prioritizing development, actively advancing “three-chain integration,” enhancing infrastructure construction, improving the public service system, and comprehensively deepening rural reform.
In conclusion, the existing research has laid a solid foundation for conducting an in-depth analysis of the status and underlying factors contributing to the HQDAR in China. Nevertheless, previous studies have mainly focused on economic and managerial perspectives, whereas a comprehensive exploration from geographical and spatial perspectives remains unexplored. Therefore, this study drew on existing research and measured the level of HQDAR in 31 provinces of China (excluding Hong Kong, Macao and Taiwan) from 2008 to 2022 based on the new development concept from the five dimensions of innovation, coordination, greenness, openness and sharing. Additionally, we explored the regional differences and dynamic evolution of development using spatial autocorrelation, Dagum Gini coefficient decomposition and spatial Markov chain methods, and we analyzed the spatio-temporal heterogeneity of influencing factors using geographically and temporally weighted regression. Combined with the new concept of high-quality development, this study evaluated the development of agriculture and rural areas as a whole from the perspectives of time and space, which can more comprehensively quantify the development quality of agriculture and rural areas, enrich the research content of rural geography, and provide decision-making basis for the high-quality development of agriculture and rural areas in China.
2 Materials and methods
2.1 Indicator system construction
The HQDAR is a complex system with a wide scope. To date, no unified evaluation standard has been established. As a new requirement for high-quality development in the new era, the new development concept is the guide for the HQDAR, so the HQDAR is a development with innovation as the first driving force, coordination as the endogenous feature, greenness as the universal form, openness as the necessary path, and sharing as the fundamental purpose (Ji, 2021). Considering the results of relevant domestic studies (Zhao and Cui, 2024; Ji, 2021; Latruffe et al., 2016), and implementing the principles of completeness, systematicity and accessibility in the selection, we constructed an evaluation indicator system for HQDAR based on innovation, coordination, greenness, openness and sharing. The particular evaluation indicator system was displayed in Table 1.
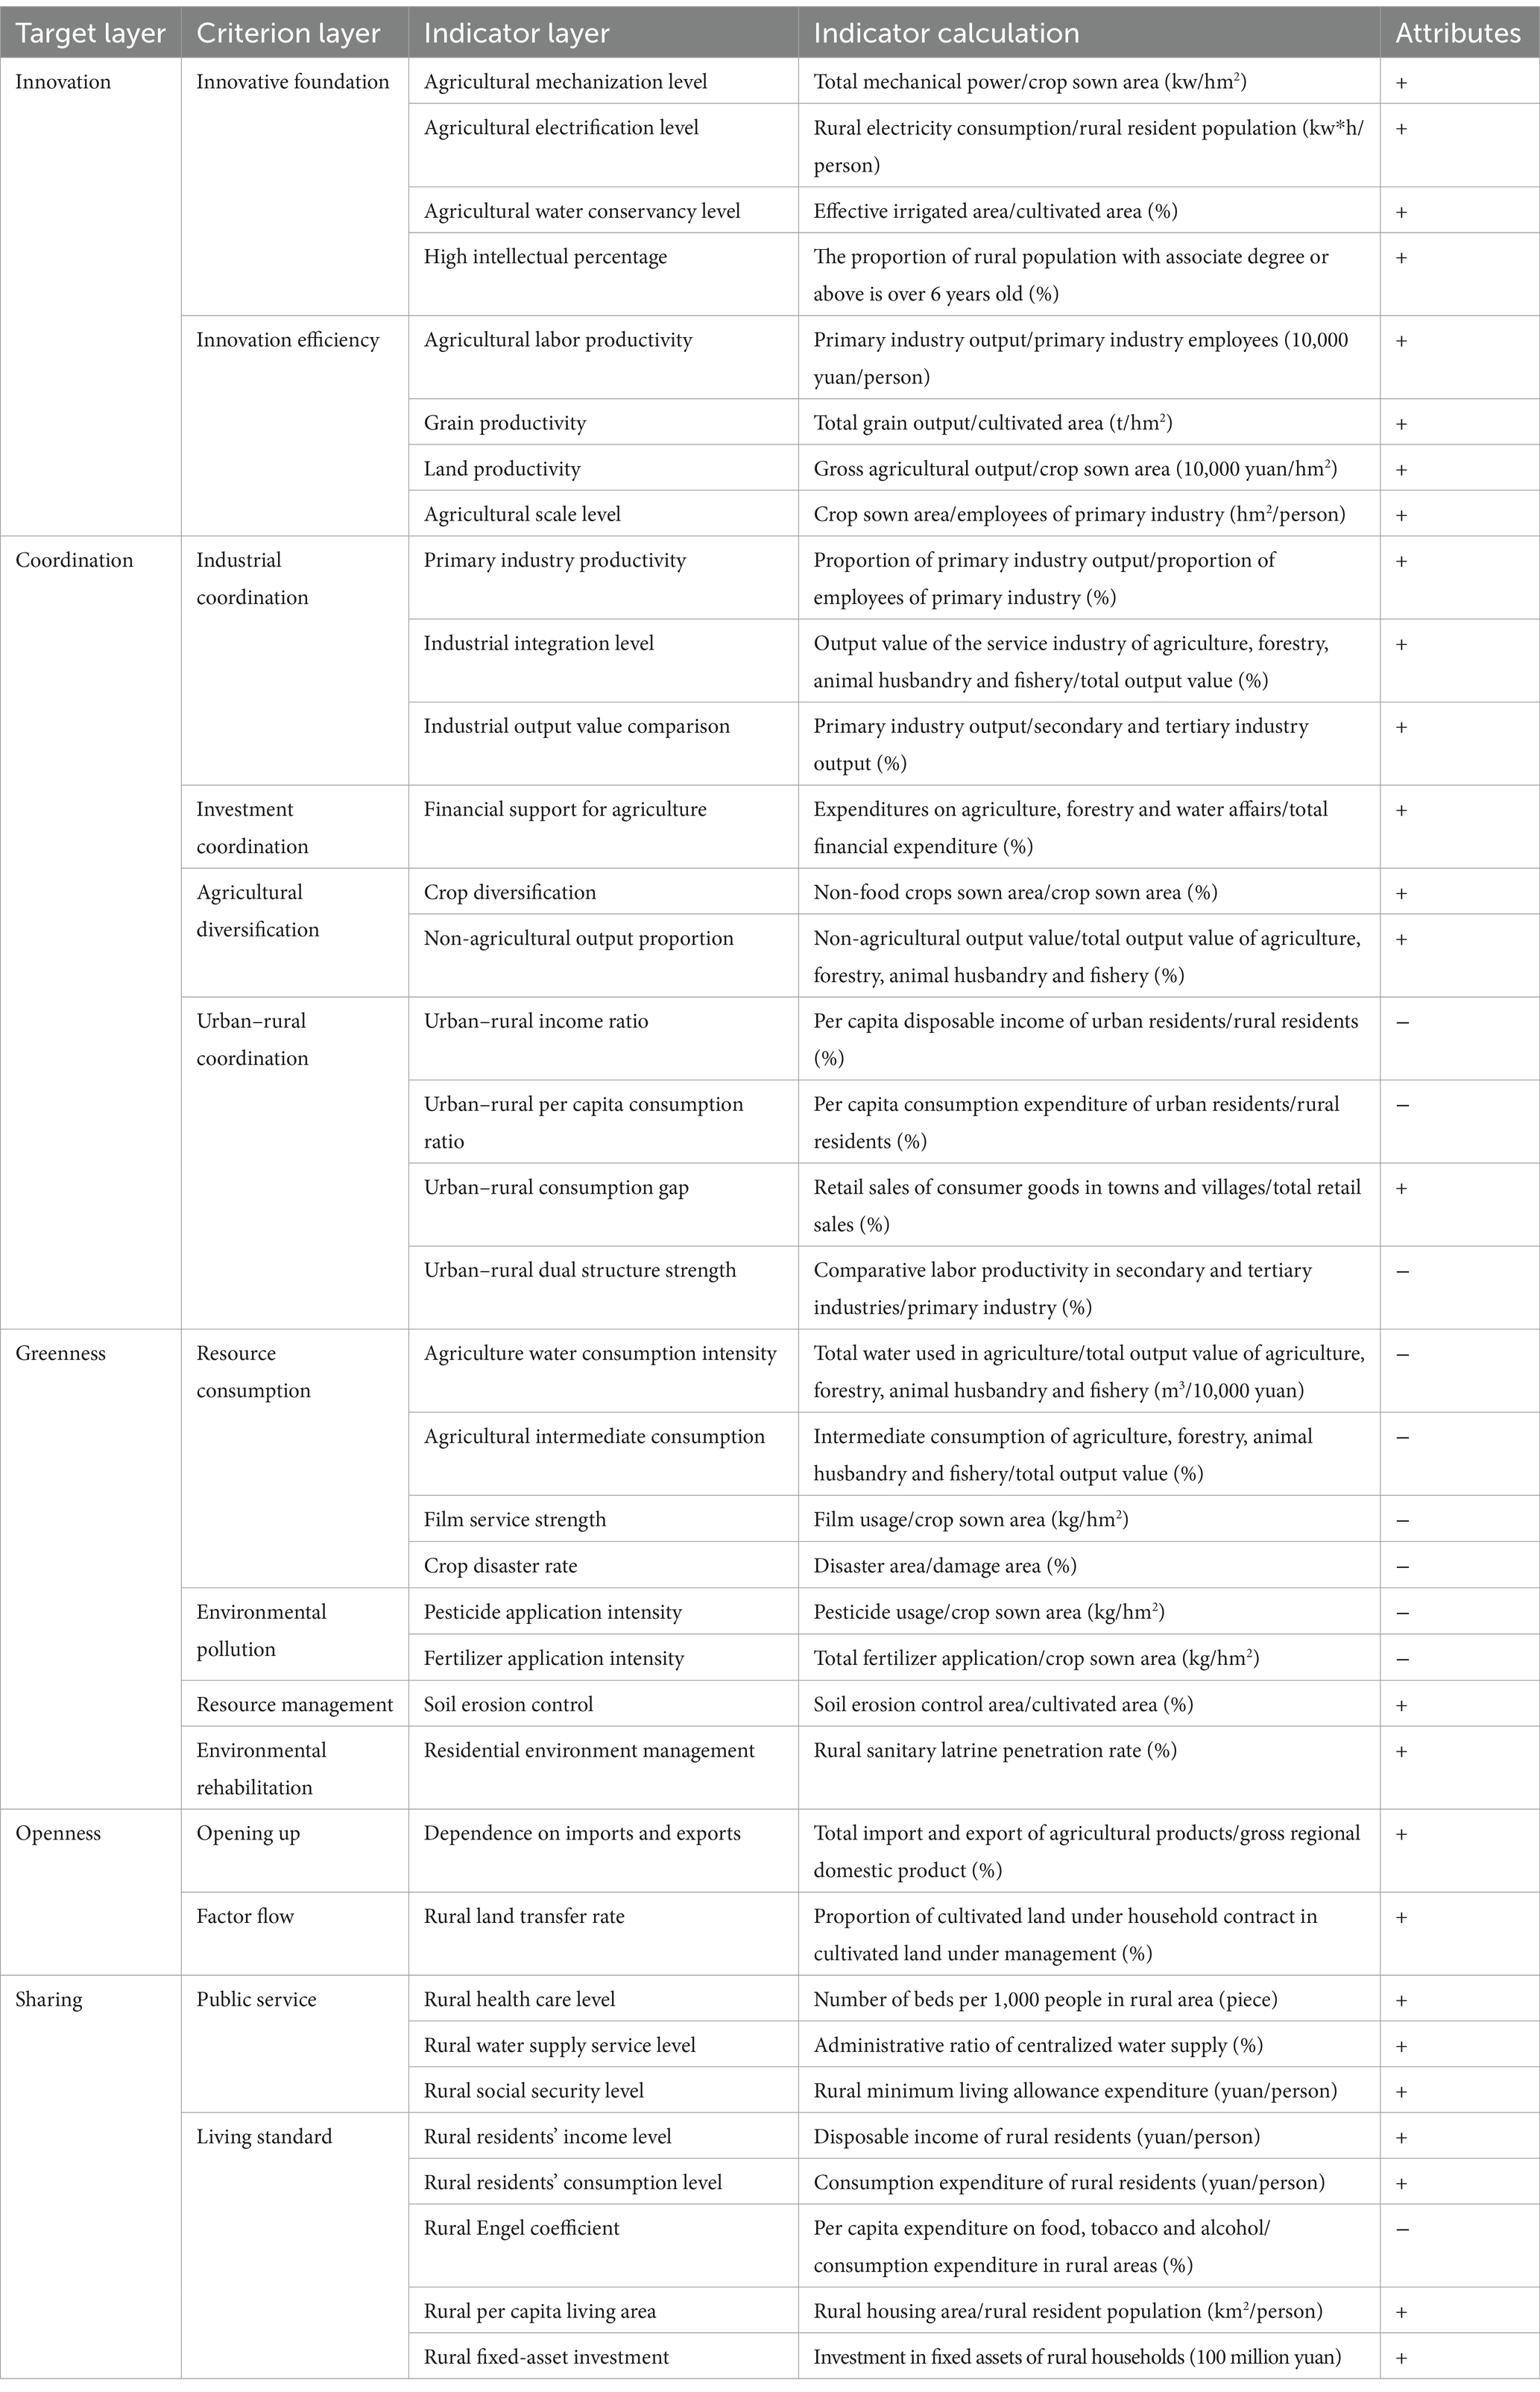
Table 1. Evaluation indicator system of HQDAR in China.
2.2 Research methods
2.2.1 Entropy method
Entropy method is an objective weighting method that has been widely used in the evaluation of comprehensive development levels due to its objectivity (Gorgij and Moayeri, 2023). Therefore, this method is employed to calculate the weight coefficient of each indicator and the score of HQDAR in each province. Firstly, in order to eliminate the deviation caused by different dimensions and magnitude of indicators on evaluation results, it is also essential to standardize the indicator data. Since each index is divided into positive and negative directions, it is processed by standardizing the extreme difference method, which is calculated as follows (Wu et al., 2023):
Where rij represents the original value of the j indicator with region i, and Xij is the standardized value.
In order to avoid the phenomenon of zeros in the quantitative processing of no outline, the matrix is shifted by 0.01 according to the actual situation to obtain Y’ij = Xij + 0.01, and the proportion of Y’ij in the index is calculated:
Where Yij represents the proportion.
Then the entropy value ej and the coefficient of variation wj are calculated for the j indicator.
Where n is the total number of evaluation areas and m is the total number of evaluation indicators.
After data standardization and information entropy calculation are completed, the weight of each indicator is multiplied by its standardized value and summed up to calculate the HQDAR score. The score is calculated:
In the formula, Si is the total evaluation score of region i.
2.2.2 Spatial Markov chain model
Markov chain is essentially a prediction method for transition problems based on a random process that discretizes the study variables into different interval types according to a specific range of values and describes the process of transition from one type to another over some time (Gallo, 2004). In the traditional Markov chain, the study variables are divided into N types and a N × N matrix of type transition probabilities is constructed. The probabilities in the matrix are calculated as follows:
Where Pbc represents the transition probability of a region from type b at time t to type c at time t + 1, nbc is the total count of provinces that have transferred from type b at time t to type c at time t + 1, and nb is the total count of provinces with type b.
The spatial Markov chain introduces the spatial lag, which addresses the shortcomings of traditional Markov chains in accounting for spatial correlation between regions. By considering the spatial lag type of the initial year as a condition and dividing it into N types, the N × N matrix is decomposed into N groups N × N matrix to create a new spatial Markov transition probability matrix (Rey, 2010). The classification and determination of the spatial lag type are based on the geographically weighted average value of variables in adjacent provinces. This is calculated (Anselin, 1995):
Where xi represents the variable value, n represents the total of provinces, wij represents the spatial weight matrix.
2.2.3 Geographically and temporally weighted regression
The geographically weighted regression (GWR) model proposed by Brunsdon et al. (1996) can evaluate the extent of the impact of driving factors on various areas and is an essential method for exploring regional heterogeneity in the degree of influence. However, this model only covers the spatial dimension and absent the temporal dimension. Huang et al. (2010) introduced the temporal dimension, and proposed the geographically and temporally weighted regression (GTWR) model. This model not only deals with the issue of the limited number of cross-sectional data samples, but also takes into account the temporal and spatial non-stationarity and can correctly predict the factor coefficients. The model is calculated:
Where (ri, si, zi) is the spatio-temporal coordinate of the i province, X and Y are explanatory and interpreted variables respectively, p is the amount of explanatory variables, β0(ri, si, zi) represents the intercept term, βk(ri, si, zi) represents the estimated coefficient, εi is the residual.
2.3 Data sources and processing
Based on the reliability and availability, the data were obtained from the China Statistical Yearbook, China Rural Statistical Yearbook, China Agricultural Statistical Yearbook, China Agricultural Machinery Industry Yearbook, China Environmental Statistical Yearbook, Statistical Yearbook of provinces, Statistical Bulletin of provinces, official websites of provinces, Ministry of Commerce of the People’s Republic of China agricultural products import and export for the period of 2009–2023. Some incomplete data were filled by interpolation or replacement of adjacent year values.
3 Results
3.1 Spatio-temporal differentiation and dynamic evolution of HQDAR in China
3.1.1 Spatial and temporal distribution of HQDAR in China
Based on the entropy method, comprehensive scores were calculated for the HQDAR in China from 2008 to 2022. The results showed that the level of HQDAR in China steadily increased (Figure 1). The score fluctuated from 0.1876 in 2008 to 0.3473 in 2022, indicating a significant increase. In the eastern region, it increased from 0.2332 to 0.3891, and after a small fluctuation, it increased further to 0.4076 in 2020, with an average value of 0.3203. In the central region, it increased from 0.1787 to 0.3414, with an average value of 0.2573. In the western region, it increased from 0.1517 to 0.2959, with an average value of 0.2199. During the process of long-term evolution, the level of HQDAR consistently varied among the eastern, central and western regions, exhibiting a characteristic of high in the east, and low in the west, with the central region having a medium value.
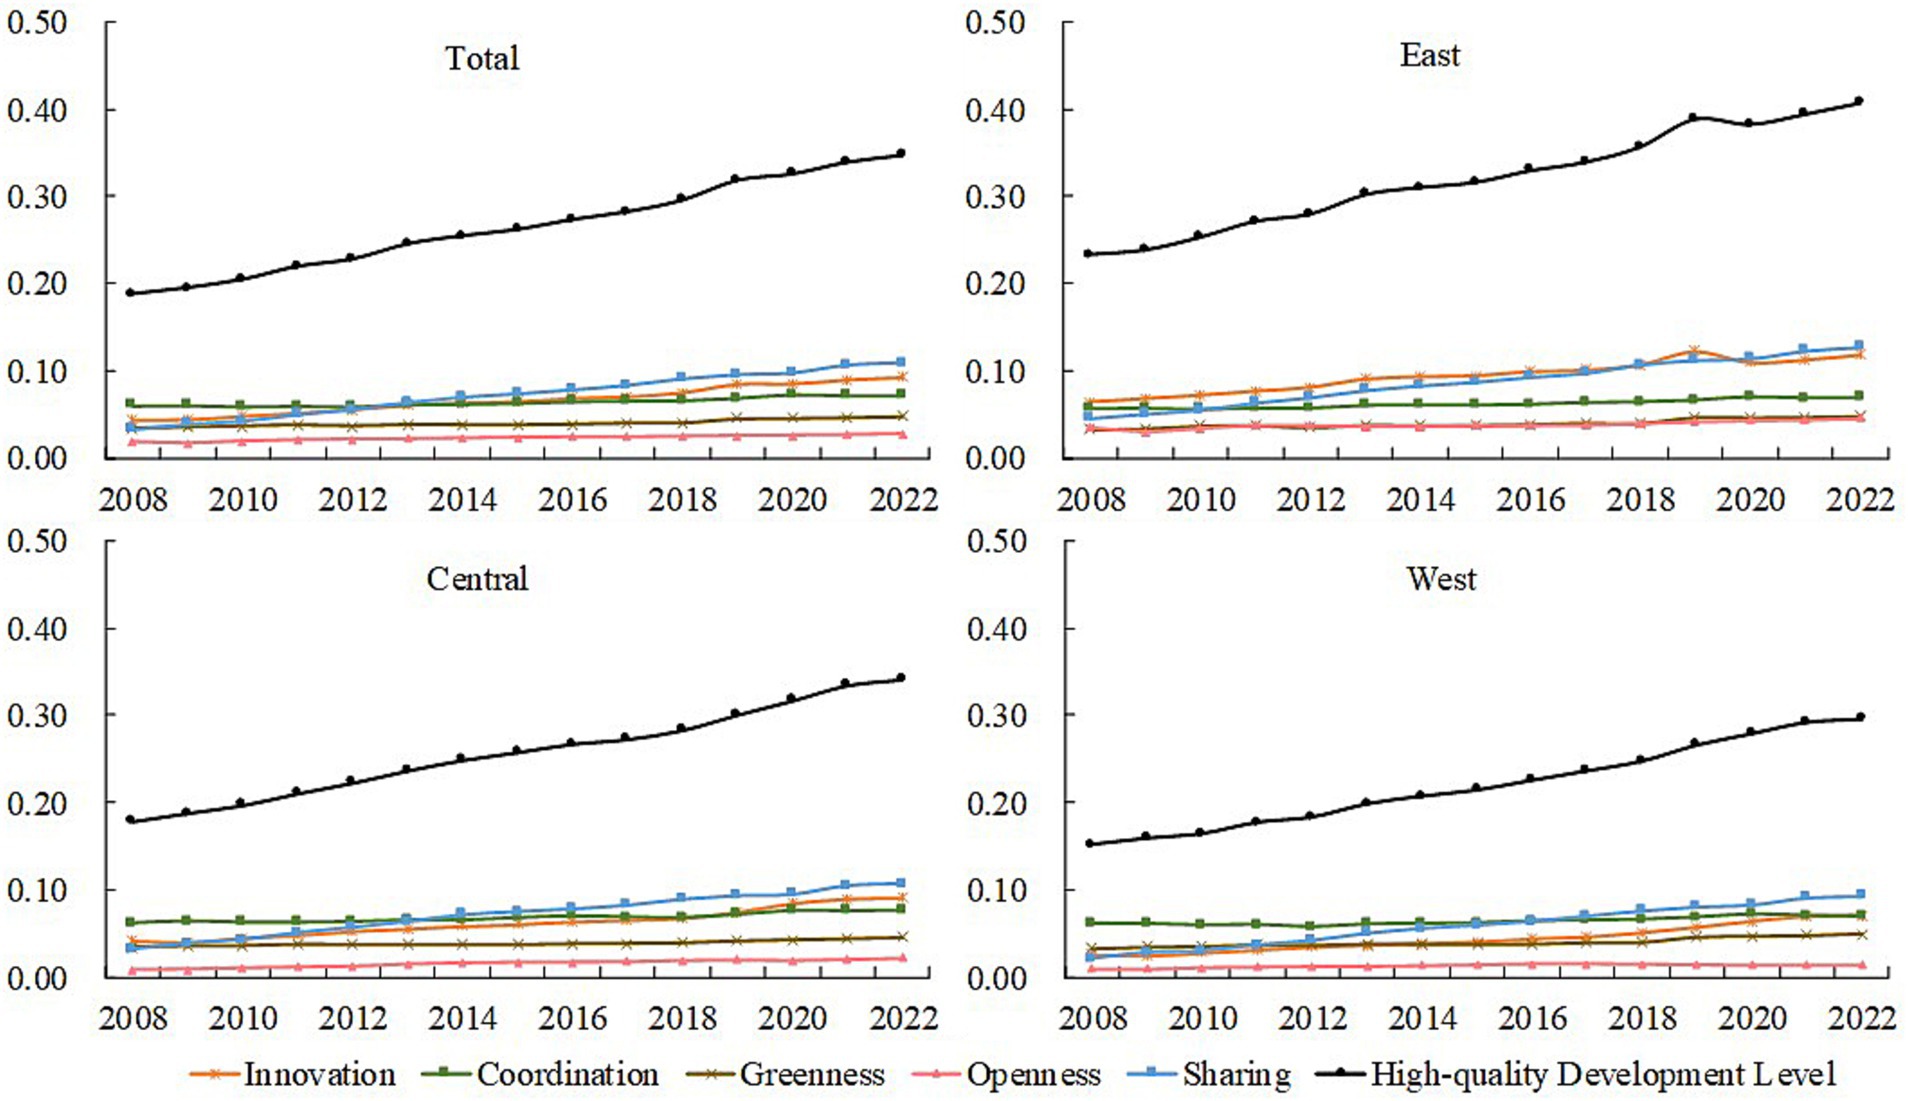
Figure 1. The level of HQDAR and the dynamic evolution of each dimension in China.
In terms of specific dimensions, the innovation dimension increased slightly from 0.0435 to 0.0927, demonstrating a slight increase, with the value in the western region being significantly lower than those in the eastern and central regions. The coordination dimension increased from 0.0601 to 0.0710, with a relatively smooth overall change, forming a spatial pattern in which the central region is superior to the west and the west is superior to the east. The greenness dimension increased from 0.0333 to 0.0479 with some fluctuation, showing the pattern of the best in the west, the second in the east and the lowest in the center. The openness dimension increased from 0.0182 to 0.0273 in a fluctuating manner, with a large difference between the three regions, and the eastern region is much superior to the central and western regions. The sharing dimension increased from 0.0325 to 0.1084, with an obvious growth, forming a distribution feature of upper in the east, low in the west and middle in the center.
The HQDAR levels in provinces of China were divided into four types using the quartile method. If the comprehensive measurement score was within the interval [0.1167, 0.2050], it belonged to the first level, which was called a low-level area. If the score was in the interval (0.2050, 0.2564], it belonged to the second level, which was called a relatively low-level area. If the score was in the interval (0.2564, 0.3157], it belonged to the third level, which was called a relatively high-level area. If the score was in the interval (0.3157, 0.5417], it belonged to the fourth level, which was called a high-level area. A visualization was performed (Figure 2). In general, the level of HQDAR had an obvious pattern of being the highest in the east, lowest in the west and intermediate in the center, with the high-value areas mainly concentrated in the eastern coastal region and the low-value areas mainly concentrated in the northwestern region.
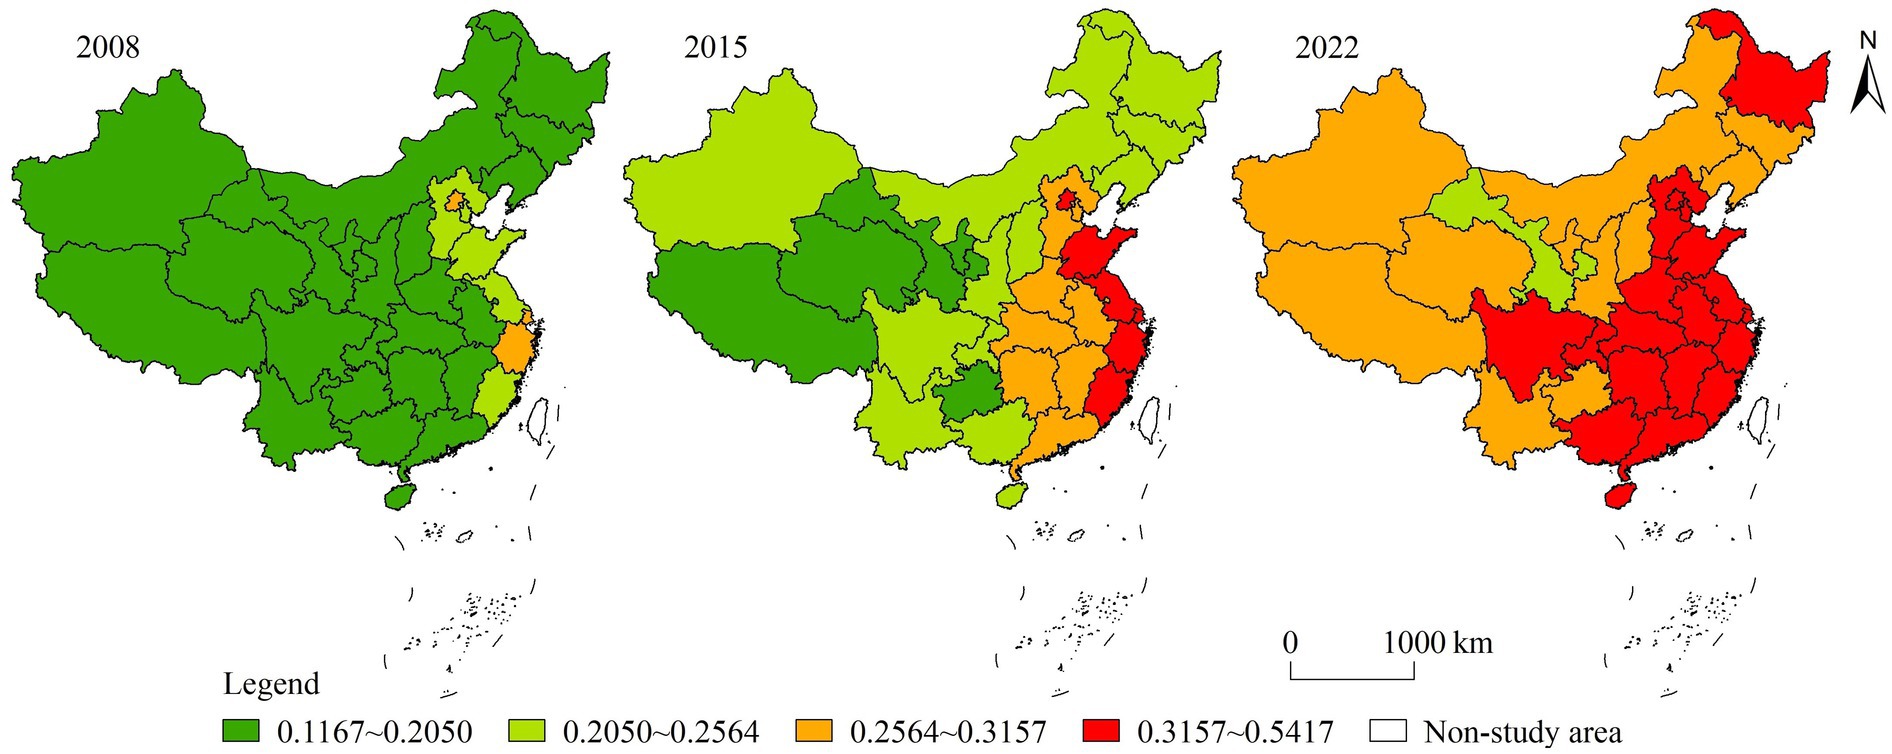
Figure 2. Evolution of spatial and temporal patterns of the level of HQDAR in China.
3.1.2 Agglomeration characteristics of HQDAR in China
The spatial autocorrelation analysis of HQDAR in China was conducted using the global Moran’s I, and the results were presented in Table 2. From 2008 to 2022, the global Moran’s I values of HQDAR exceeded 0.50, Z values exceeded 2.58, and p-values were below 0.01, which passed the significance test at the 99% confidence level, showing that there was a notable positive spatial autocorrelation and distinct spatial agglomeration characteristics. The I value increased from 0.5499 to 0.6672 during 2008–2022, indicating that the spatial agglomeration of HQDAR in China was strong and continuously enhanced during development.
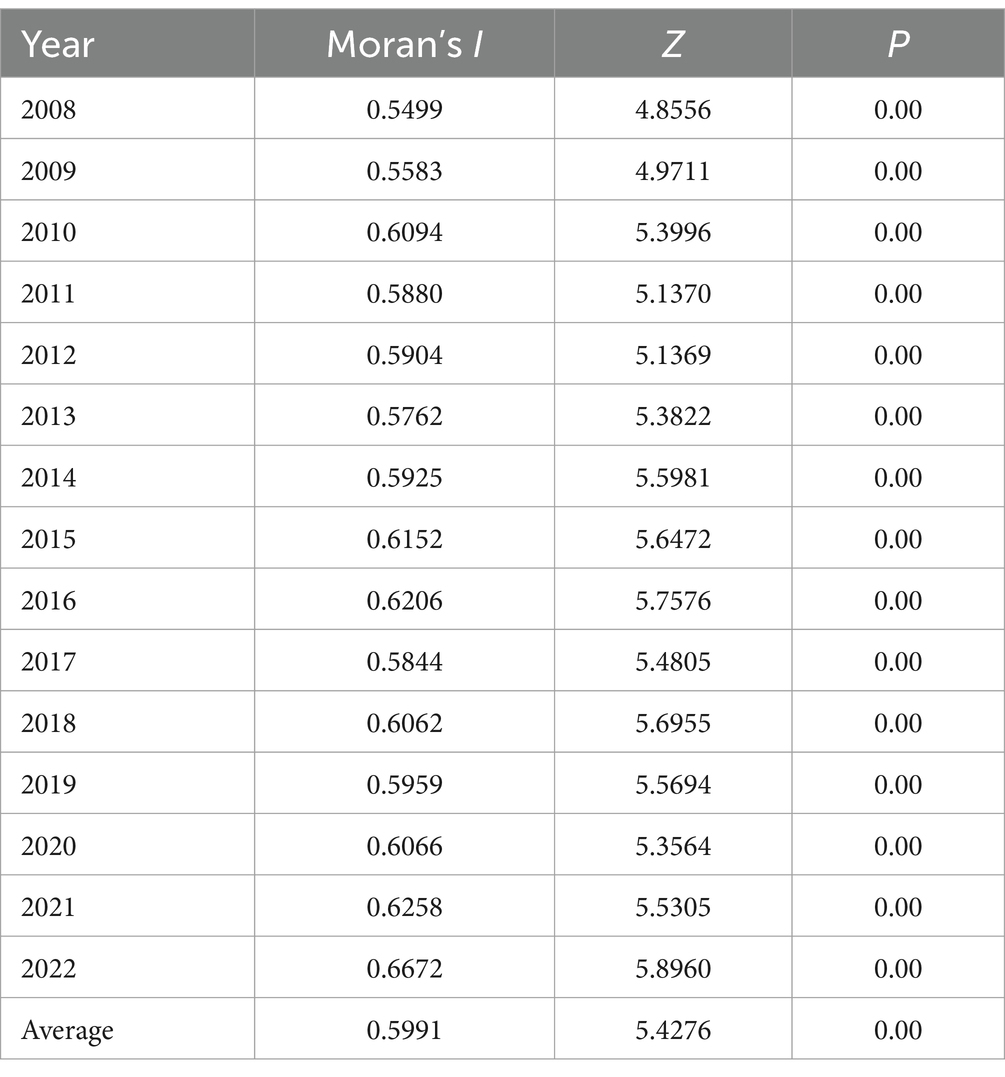
Table 2. Global Moran’s I of HQDAR in China.
To further explore the spatial clustering location of high or low values of HQDAR, Getis-Ord Gi* was applied to identify the distribution of statistically significant hot and cold spots (Figure 3). It can be seen that HQDAR in China exhibited significant local spatial agglomeration characteristics. The cold and hot spots were mostly concentrated continuously in a faceted manner. Hot spots were primarily situated in some eastern and central provinces, while cold spots were primarily situated in the western regions. In 2008, 2015 and 2022, the number of hot spots gradually increased with time, and the distribution area expanded from the eastern region to the central and southern regions, gradually forming a concentrated distribution area with Jiangsu, Zhejiang and Shanghai as the core. The prevalence of cold spots also increased over time, with a tendency to spread northwestward. Furthermore, the ranges of hot and cold spots increased, indicating that the local spatial agglomeration of HQDAR in China increased.
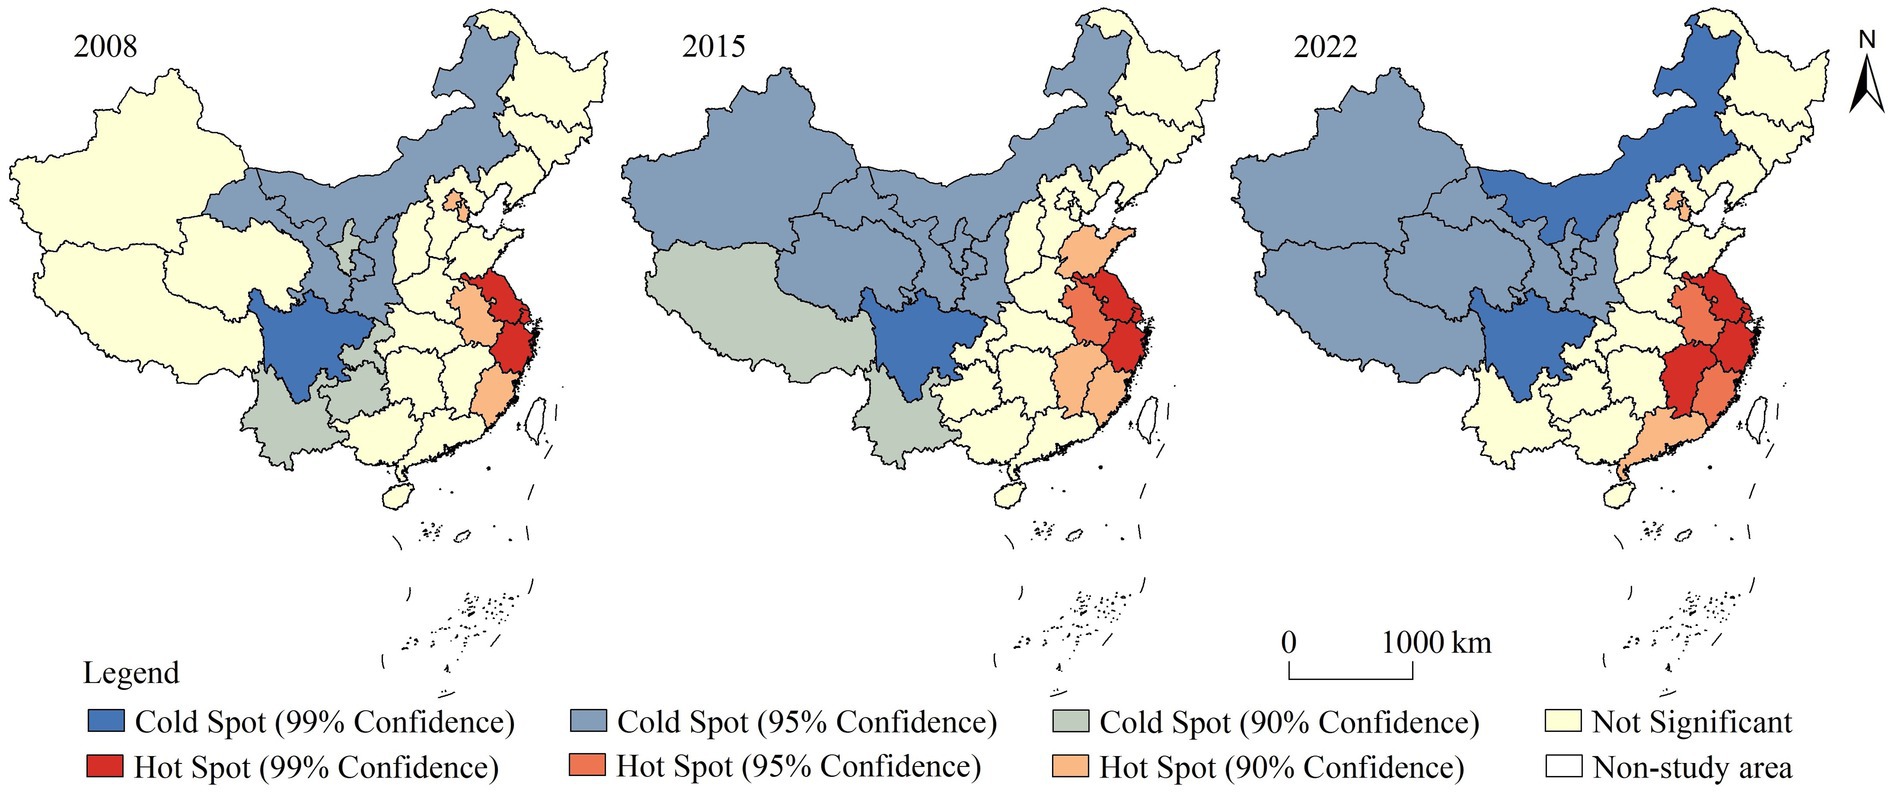
Figure 3. Distribution of cold spots and hot spots of HQDAR in China.
3.1.3 Regional differences and sources of HQDAR in China
To reveal the spatial composition and sources of regional differences in HQDAR in China, the Dagum Gini coefficient and its decomposition were employed to compute the overall Gini coefficient, and further decompose and calculate the sources (Dagum, 1997). The results were summarized in Table 3. The overall Gini coefficient exhibited a fluctuating declining trend, decreasing from 0.1333 to 0.1057, indicating that the regional disparity in HQDAR in China narrowed under the impetus of supportive policies in the central and western regions. In terms of Gini coefficients of the three regions, the eastern region was the highest, followed by the central and western regions, and all of them showed a fluctuating downward trend.
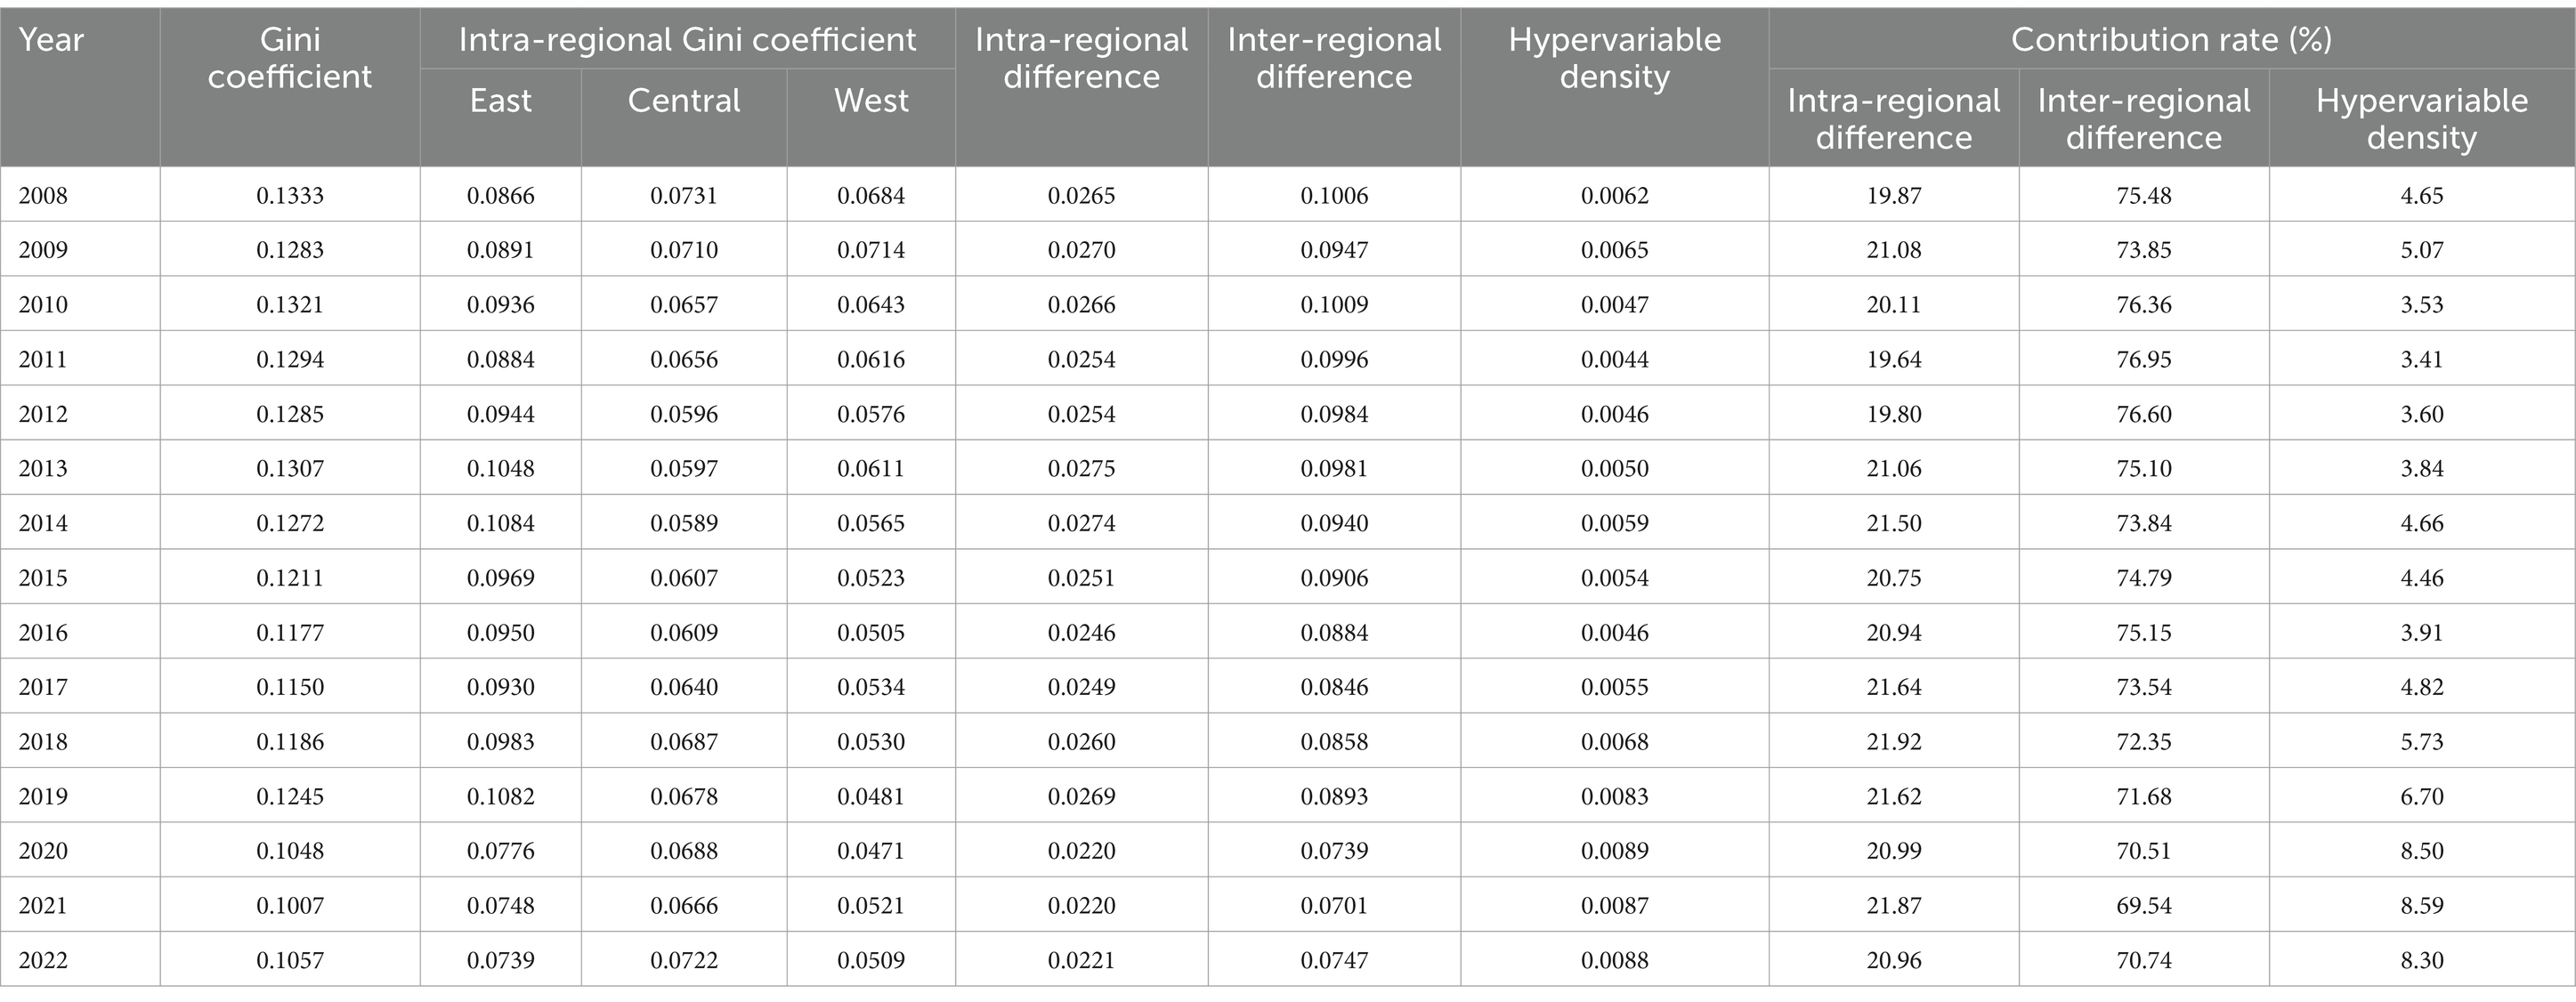
Table 3. The Gini coefficient and its decomposition of HQDAR in China.
From 2008 to 2022, the inter-regional difference showed a fluctuating declining trend, from 0.1006 to 0.0704, but its contribution was consistently the largest. The intra-regional difference also demonstrated a fluctuating downward tendency, with a smaller decrease from 0.0265 to 0.0221, and its contribution rate was inferior to that of the inter-regional difference. The hypervariable density increased from 0.0062 to 0.0088, with the smallest contribution rate. Therefore, the inter-regional difference was the primary source of HQDAR spatial differences in China.
The inter-regional differences among the three regions were illustrated in Figure 4. It demonstrated that the inter-regional differences in HQDAR in China were the greatest in the east–west region, followed by the east–central region, and were the least pronounced in the central–west region from 2008 to 2022. From an evolutionary standpoint, the inter-regional differences in the east–west and east–central regions exhibited similar fluctuating downward trajectories, from 0.2121 to 0.1620 and from 0.1379 to 0.1066, respectively. The central–west region exhibited a gradual decline, from 0.1097 to 0.0949. Overall, the inter-regional differences in HQDAR were primarily attributable to the large differences between the eastern region and the central as well as western regions. Therefore, HQDAR in the central and western regions ought to be improved as soon as possible.
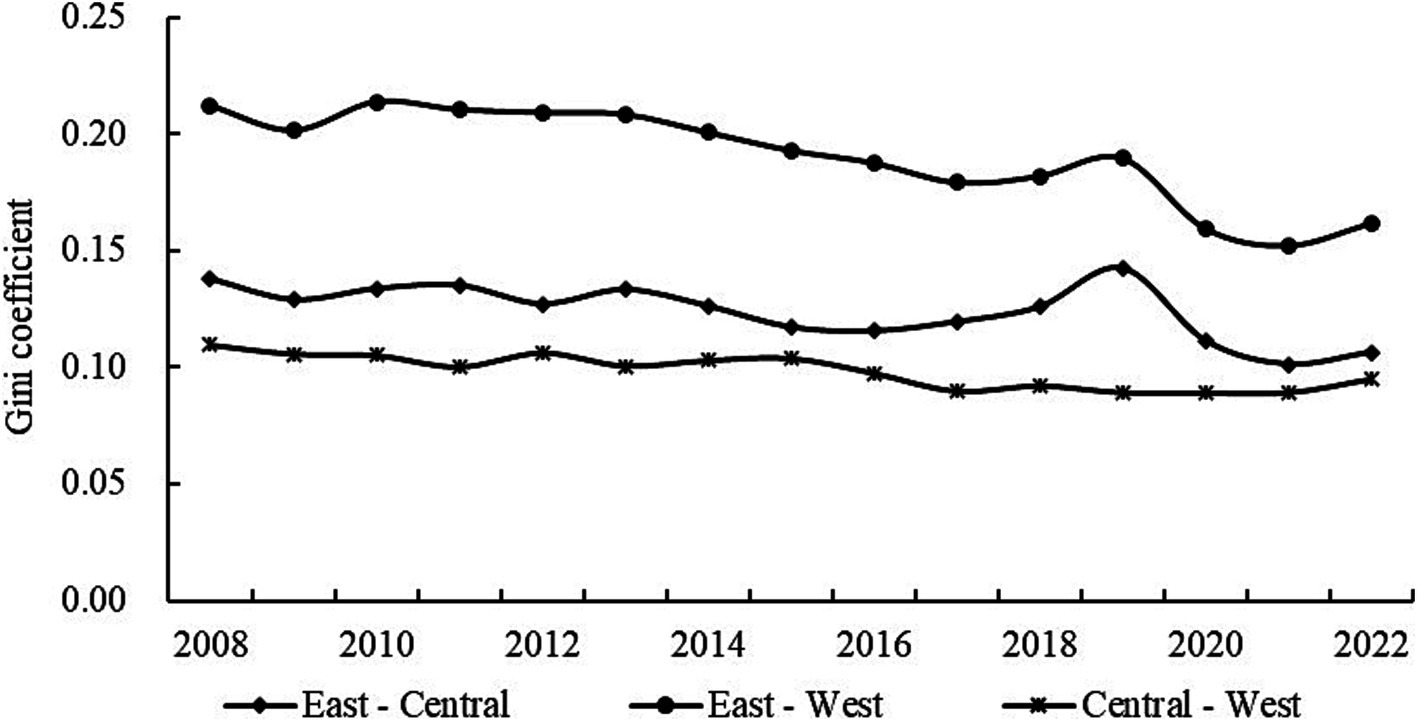
Figure 4. Inter-regional differences and evolution of HQDAR in China.
3.1.4 State transition of HQDAR in China
In the Markov transition probability matrix, the values on the diagonal represented the probability of a type maintaining its original type in adjacent years, whereas values beyond the diagonal represented the probability of a type transitioning between different types in adjacent years. Based on the previous section, the HQDAR was divided into four types: low-level, relatively low-level, relatively high-level and high-level, which were represented by the numbers 1, 2, 3, and 4, respectively. The traditional Markov chain transition probabilities of these types were calculated and listed in Table 4. It was clear that the HQDAR had the stability to maintain its original type. All probability values on the diagonal were noticeably larger than those on the non-diagonal, indicating that regardless of the period, the level of HQDAR in a specific province was classified as belonging to a particular type in the current year, and there was a high probability that it still belonged to this type in the following years. The values on the diagonals of low-levels and relatively low-levels were relatively small and easy to shift, while the values on the diagonals of relatively high-levels and high-levels were the largest, indicating that these two types had the greatest probability of maintaining stability. In addition, the HQDAR level showed a trend of upward transition. The probabilities of low-level, relatively low-level and relatively high-level upward transitions were 0.1983, 0.2261, and 0.1792, respectively, and none of the types had the probability of a downward transition. It was challenging to achieve a leapfrog transition in HQDAR in China, and the state transition mainly occurred between adjacent levels, with no cross-level transfers.
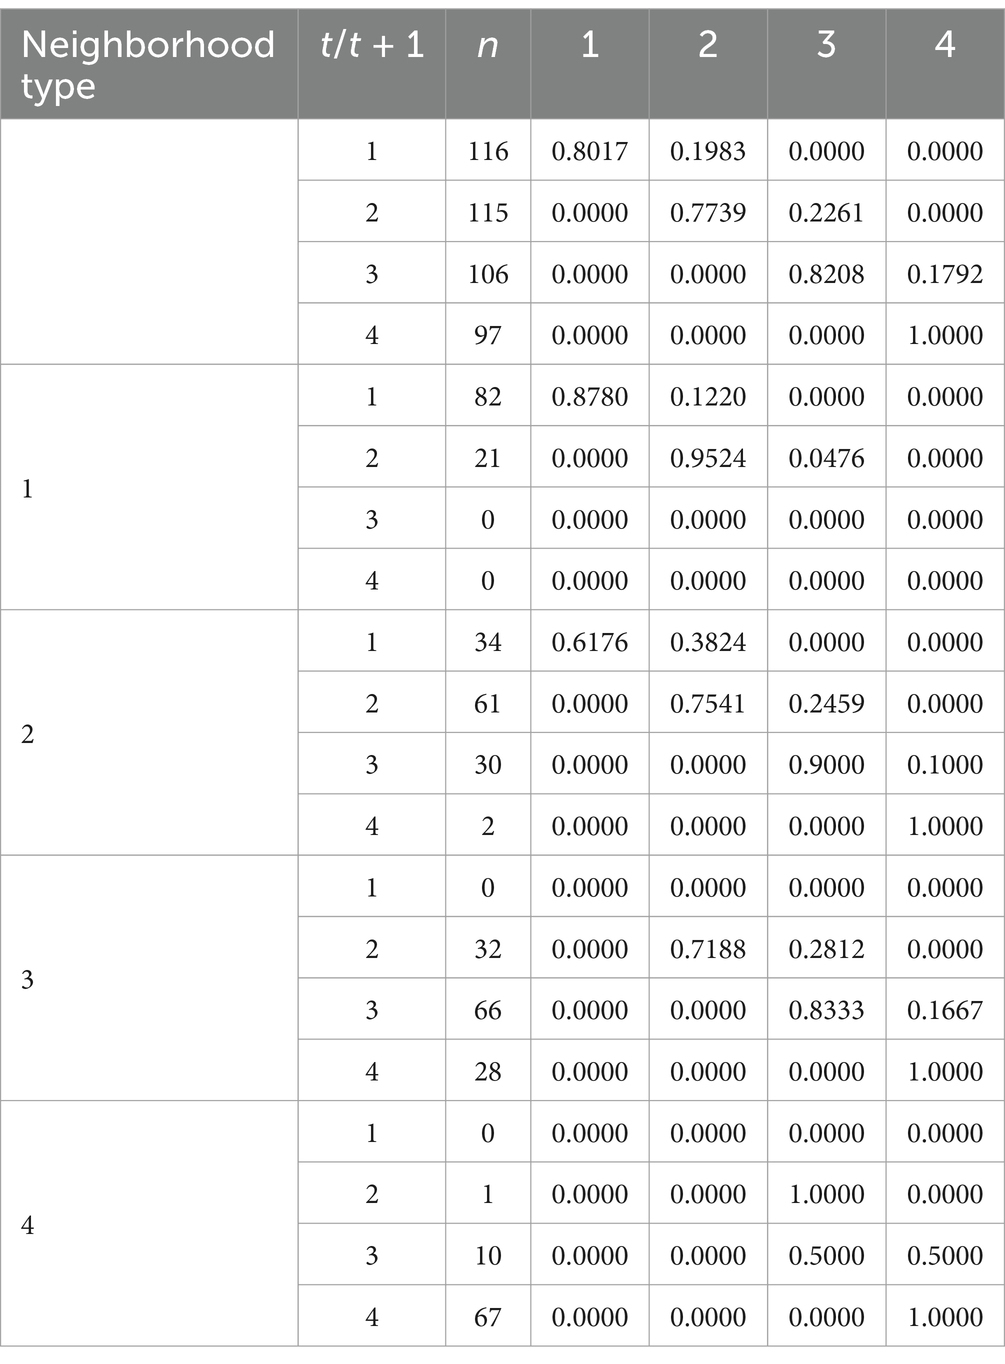
Table 4. Matrix distribution of Markov chain transition probability.
The improvement of HQDAR in China not only depended on the progress and integration of various internal elements, but also complemented each other and effectively related to the surrounding areas. The traditional Markov chain model ignores the effect of type transfer in the surrounding regions, then the spatial lag is introduced, and the impact of different geographical neighborhood types on the transition probability matrix is studied through the spatial Markov chain model. Table 4 exhibited the calculation results. The findings demonstrated that the diagonal probability values of the spatial Markov transition probability matrix under different neighborhood types were larger than the non-diagonal ones, revealing that the transition probability of the HQDAR level had a certain stability. The non-diagonal probability values were clustered to the right of the diagonal. The transformation of HQDAR occurred incrementally between neighboring types, without crossing hierarchical levels. Neighborhood background had an important influence on the transfer and change of the level of HQDAR in China. For example, when the spatial neighborhood context was disregarded, the probability of the low-level type remaining in its current state was 0.8017. After adding spatial effects, the probabilities of preserving the current state were 0.8780, 0.6176, 0, and 0 when adjacent to low, relatively low, relatively high, and high level areas, respectively. The influence of different neighborhood backgrounds differed, and a high-level neighborhood background was more likely to be transferred upward than a low-level. When the neighborhood background was relatively low-level, the upward transition probabilities of low-level, relatively low-level and relatively high-level were 0.3824, 0.2459, and 0.1000, respectively. When the neighborhood background was relatively high-level, the upward transition probabilities of low-level, relatively low-level and relatively high-level were 0, 0.2813, and 0.1667, respectively.
3.2 Influencing factors of HQDAR in China
3.2.1 Indicator selection
The above results show that HQDAR exhibits considerable spatial differences in China. Therefore, identifying the key factors affecting HQDAR is of enormous practical significance for narrowing the development gap, alleviating regional imbalances and proposing optimization strategies. Studies have shown that the HQDAR in China is closely related to the natural environment, demographic status, economic development, urbanization, finance, infrastructure, industrial structure, scientific and technological innovation and government policies (Ji, 2021; Zhao and Cui, 2024; Wang and Li, 2024; Pham and Smith, 2014). For example, Ji (2021) found that urbanization, industrial structure, marketization degree and scientific and technological innovation ability have an impact on the HQDAR in China, and the driving effect of each factor has spatial heterogeneity. Pham and Smith (2014) pointed out that the driving factors of agricultural sustainability can be attributed to demographic and natural factors, socio-economic factors and political, and institutional and management factors. Zhao and Cui (2024) concluded that the HQDAR is affected by factors such as fiscal support for agriculture, financial support for agriculture, urbanization, economic development, scientific and technological innovation, transportation infrastructure and industrial structure, and the interaction between the two factors is greater than that of a single factor. By referring to the existing research results, this paper selected the indicators of urbanization level, industrial structure, marketization degree, transportation infrastructure, scientific and technological innovation ability, environmental regulation, rural population aging, and Internet penetration rate as influencing factors, which are measured by the urbanization rate, the proportion of the added value of secondary and tertiary industries in the GDP, the ratio of individuals and private sector employees to the total population, the density of road and railway networks, the number of domestic patents granted per capita, the ratio of total investment in environmental pollution control the gross regional product, the proportion of rural population aged 65 years or older, and the number of Internet broadband users access per 100 people.
3.2.2 Spatio-temporal heterogeneity analysis of influencing factors
The Ordinary least squares (OLS) model does not consider the spatial heterogeneity between HQDAR and its influencing factors. The GWR model can handle this issue well, but it only includes spatial aspects. The GTWR model combines the two aspects of spatial and temporal to solve the spatio-temporal heterogeneity. Before calculating the GWR and GTWR models, the interconnection between HQDAR and its influencing factors was examined using the OLS regression model, and the calculation results were listed in Table 5. The variance inflation factors among the explanatory variables were below 5, indicating that there were no collinearity problems among the explanatory variables. However, the influences of marketization degree and environmental regulation were not significant, so these two variables were eliminated.
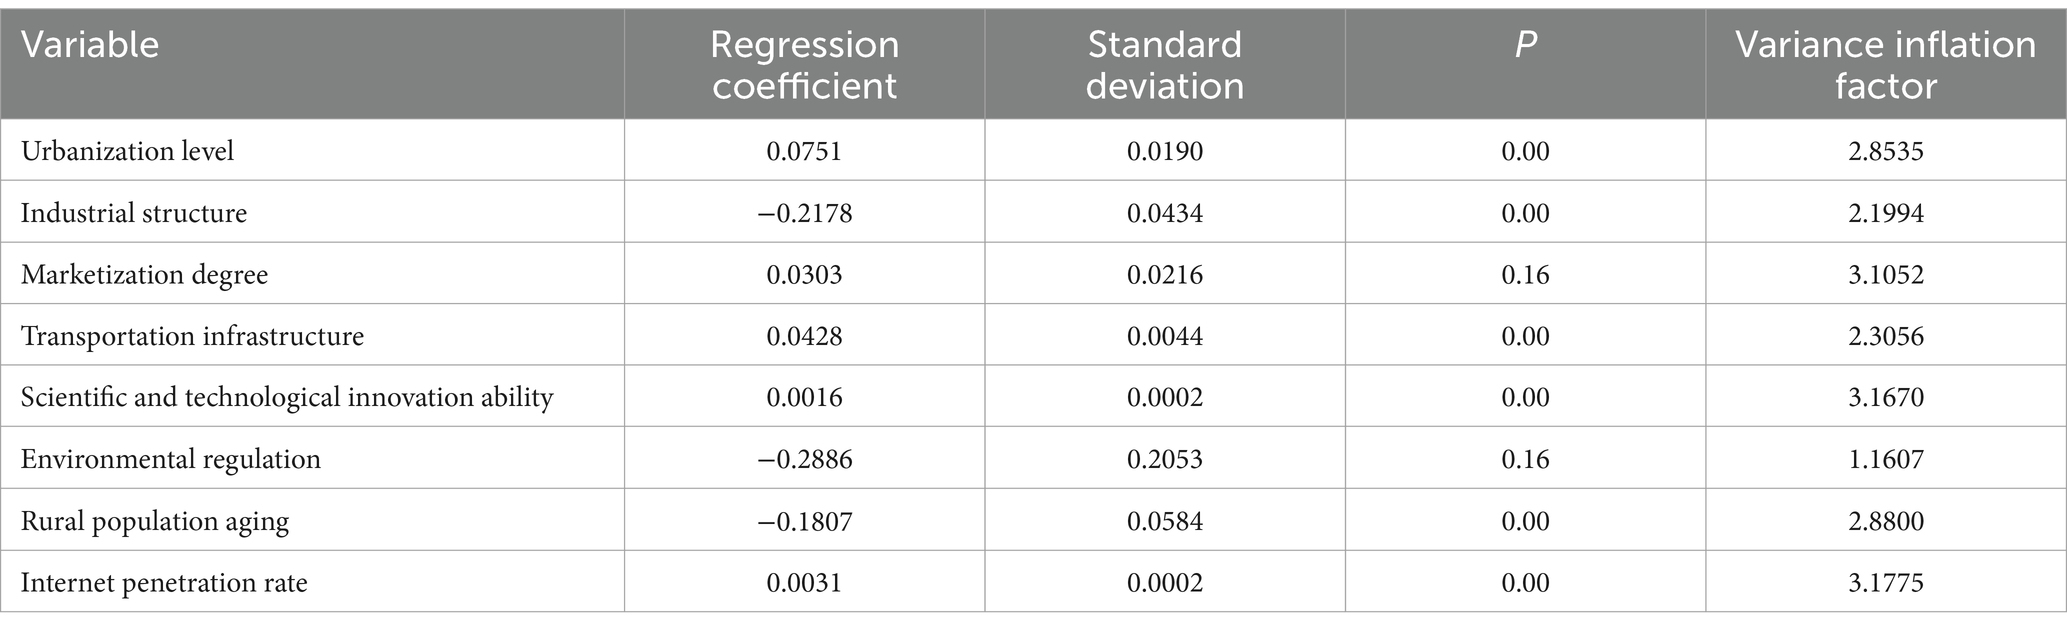
Table 5. Ordinary least squares (OLS) regression results and collinearity test.
After eliminating marketization degree and environmental regulation, the results of the remaining variables were calculated using the OLS, GWR and GTWR models. The results revealed that the fit goodness of the GTWR model was 0.9704, which was higher than those of the OLS and GWR models, and the AICc value (−2445.87) was lower, suggesting that the fitting effect of GTWR was better. Therefore, the GTWR model was suitable for use in this study.
Further analysis of influencing factors of HQDAR and the estimated regression coefficients revealed that the influence of the factors exhibited temporal and spatial heterogeneity. The urbanization level, transportation infrastructure, scientific and technological innovation ability, and Internet penetration rate had mainly positive effects on the HQDAR, and the regression coefficient showed little change. The industrial structure and rural population aging had negative effects, and the regression coefficient changed significantly.
To better understand the differences in the spatial distribution of the regression coefficients of various factors, the regression results of 2008, 2015, and 2022 were visualized using the natural breakpoint method in ArcGIS10.5, and spatio-temporal distribution maps of the regression coefficients were obtained. The results were as follows:
(1) Urbanization level. The regression coefficients of urbanization level were positive in some regions and negative in others, indicating that the link between the urbanization level and HQDAR was complex (Figure 5). There was a two-way impact of urbanization on HQDAR, which was similar to the findings of Ji (2021). The spatial distribution of the regression coefficients showed that high-value areas were primarily located in northern and southern China, whereas low-value areas were primarily located in northwestern China. Over time, the role of the urbanization level gradually increased. In the process of urbanization, cities continue to spread toward peripheral rural regions, and a considerable portion of cultivated land is converted into building land, which reduces resources and opportunities for agriculture and rural. Simultaneously, an increasing number of rural residents choose to relocate to urban regions in pursuit of better living conditions and employment opportunities, resulting in a rural labor shortage, that is not supportive of high-quality rural development. Nevertheless, as urbanization increases, the connection between urban and rural areas becomes increasingly closer, and technology and capital from urban areas flow into rural areas, providing the market, technology and capital for development.
(2) Industrial structure. The regression coefficients of the industrial structure showed obvious spatial heterogeneity, with high-value areas mostly situated in eastern China and low-value areas situated in northern China (Figure 6). This was mainly due to the more advanced development in eastern China, where the industrial structure was dominated by service and light industries, and many enterprises were distributed in rural areas, providing technical support for production and processing for high-quality agricultural development, and promoting the optimization and upgrading of the rural, thus promoting the development of HQDAR (Liu et al., 2020). Ji (2021) pointed out that although the upgrading of industrial structure helps to optimize the regional development momentum, there is a certain downward pressure on the HQDAR. In some regions, industries are dominated by heavy and chemical industries, resource-based industries and traditional manufacturing industries, which absorb a large number of rural laborers for employment, exacerbating the hollowing out of the rural population to a certain extent and weakening the potential for high-quality development.
(3) Transportation infrastructure. The regression coefficients of transportation infrastructure had large spatial differences, with high-value areas mostly positioned in northern China and low-value areas positioned in southwestern and southern China (Figure 7). Transportation infrastructure is a public service facility established for the purpose of ensuring socio-economic activities, improving living environment, overcoming natural obstacles and achieving resource sharing, which is of great significance to regional development. The transportation infrastructure is conducive to broadening commodity circulation channels, accelerating external exchanges and information dissemination, improving production and living conditions, enhancing production efficiency and living quality, and driving high-quality local development of rural. The role of the transportation infrastructure was negative in some areas, possibly because the initial investment in building transport systems is greater, the payback cycle is longer, and the roles of agricultural and rural development have a certain time lag (Guo and Zeng, 2021).
(4) Scientific and technological innovation ability. The regression coefficients showed a progressive increase in the spatial pattern from east to west. High-value areas were mostly situated in the western region, while low-value areas were situated in the eastern and southern regions (Figure 8). From a temporal perspective, the influence of this factor was always relatively weak. Scientific and technological innovation is the engine of agricultural and rural progress and is critical for enhancing productivity and accelerating agricultural transformation and upgrading. Scientific and technological innovation not only promotes the generation of new rural factors, but also enables traditional production factors to achieve upgrading through the innovation of new technologies to a certain extent (Wang and Qu, 2020). Although both the level of HQDAR and scientific and technological innovation ability increased during the study period, there was a mismatch between the two in some regions in some years, resulting in a negative correlation phenomenon. It may be that scientific and technological innovation involves more new technologies and industries, and relevant technologies and infrastructure need time to be continuously improved, which has a lagging effect.
(5) Rural population aging. The regression coefficients of rural population aging were positive in some regions and negative in others, decreasing from southeast to northwest. The high-value areas were mainly located in the southeastern coastal regions, whereas the low-value areas were located in the Tibet and Xinjiang regions (Figure 9). Tang and Jiang (2023) pointed out that there was a two-way impact of rural population aging on HQDAR. In some areas, the rural population aging lead to a decrease in the quantity and proportion of working-age individuals involved in agricultural production, which is detrimental to technological progress and agricultural development. On the other hand, owing to their physical limitations, aging farmers may be more inclined to increase mechanical input or land transfer to compensate for labor shortages, thus improving the levels of agricultural mechanization and production efficiency and promoting HQDAR.
(6) Internet penetration rate. The spatial difference in the regression coefficients of the Internet penetration rate was striking, which was basically positive (Figure 10). It can be seen that the Internet penetration rate promoted the HQDAR, but the effect was weak. The popularization of the Internet provided a new impetus and possibilities for HQDAR. The continuous progress and promotion of the Internet plays a crucial role in fostering the digital transformation of agriculture and the construction of rural e-commerce. Simultaneously, the integration of informatization into rural governance can significantly enhance both the governance system and its capacity to foster HQDAR. The rapid development of the Internet have quietly penetrated into all corners, becoming a new engine for the development of new industries and new business in rural areas.
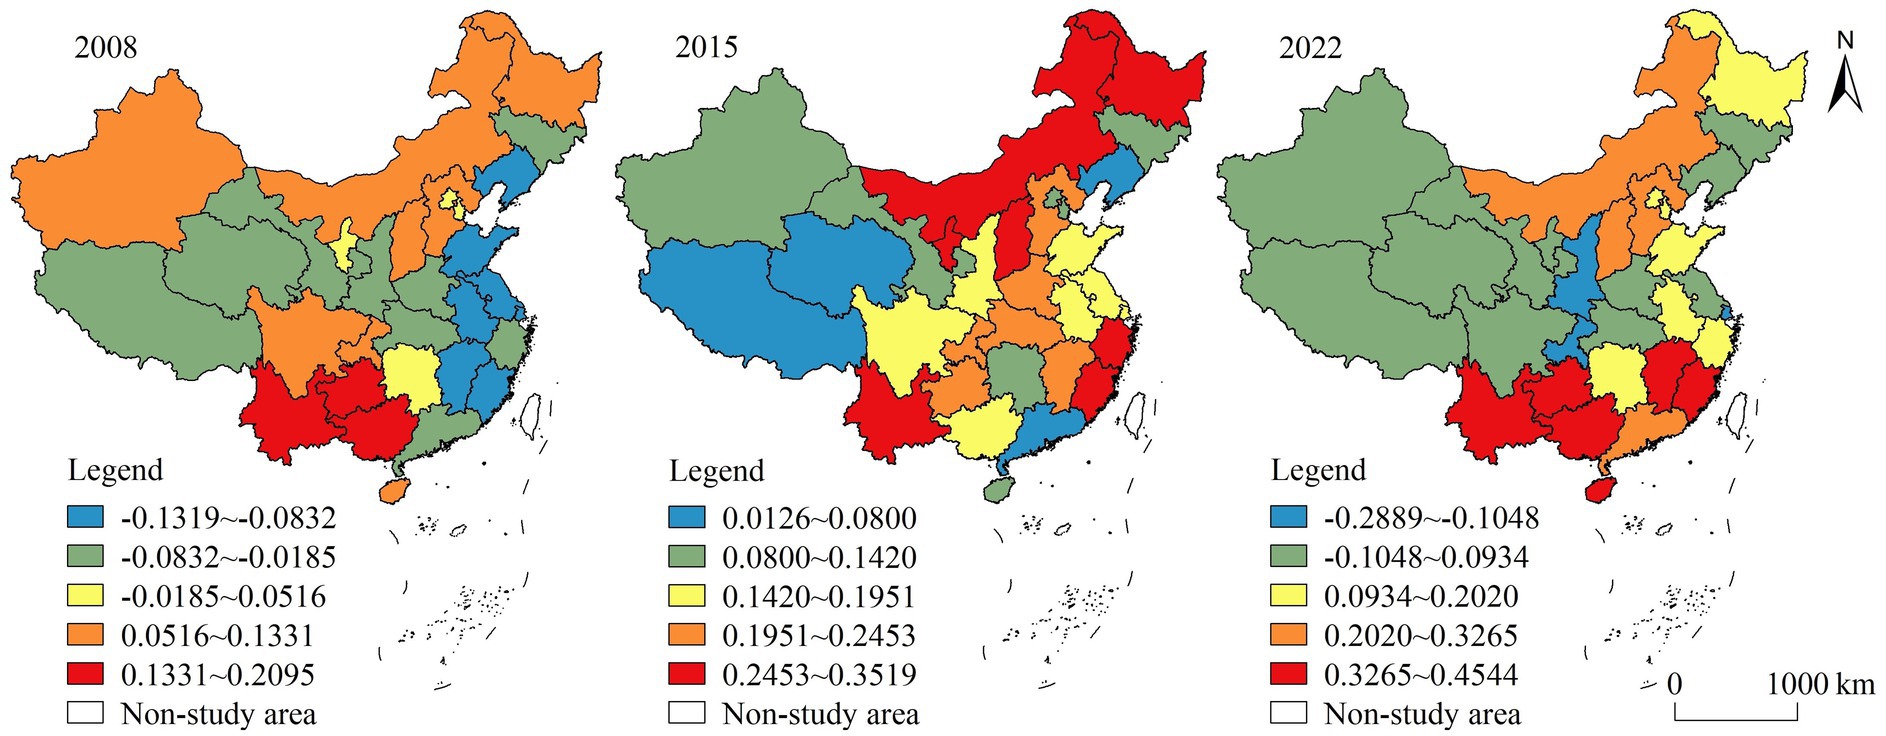
Figure 5. Spatial distribution of GTWR regression coefficients for urbanization level.
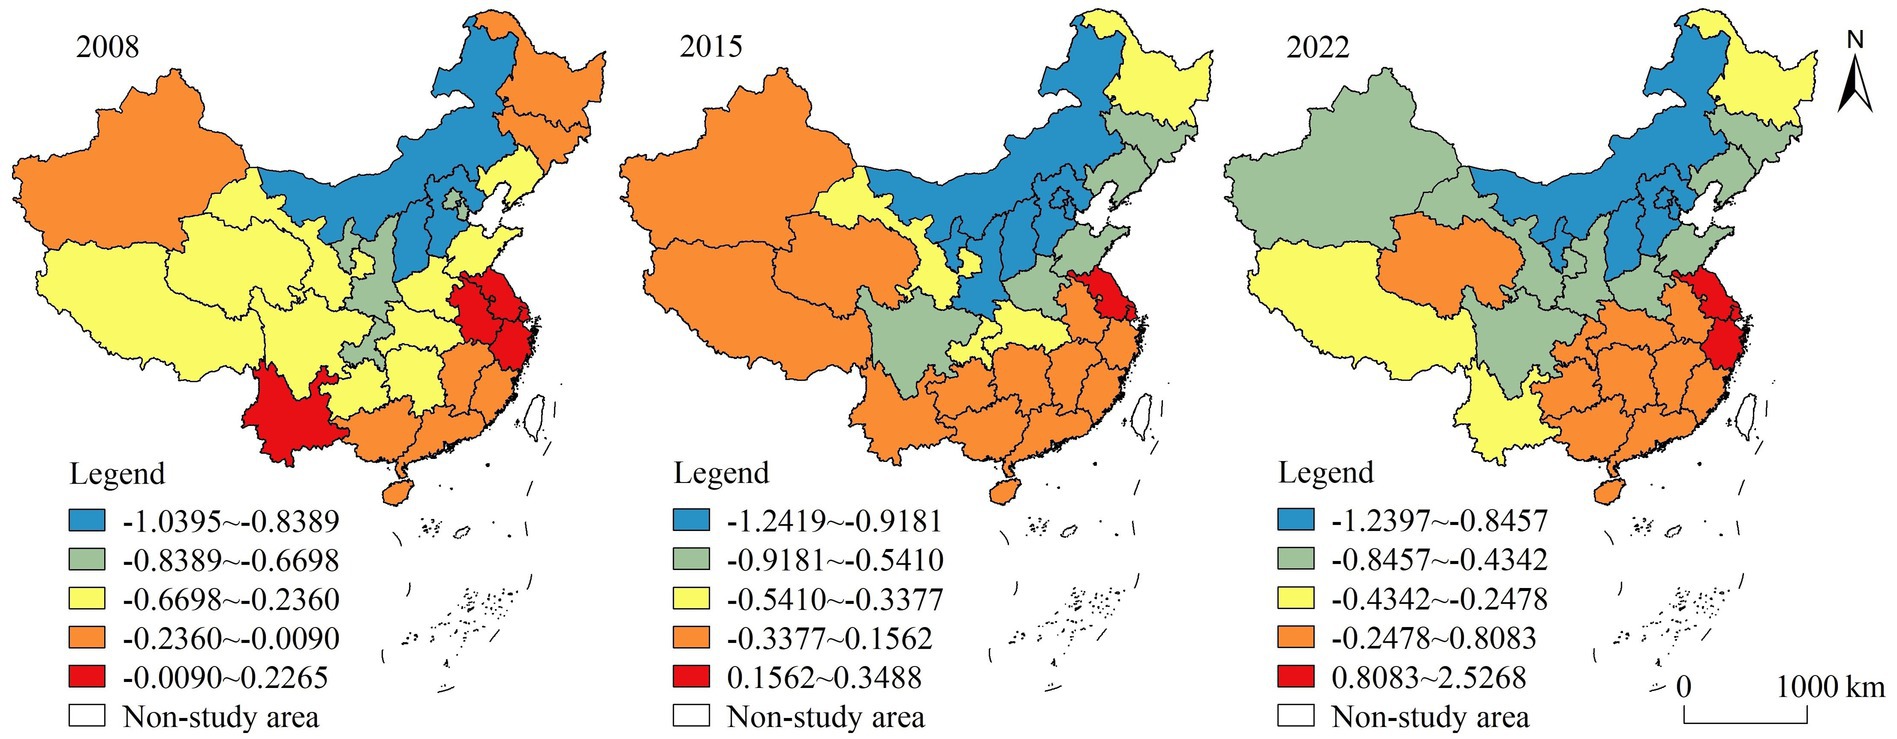
Figure 6. Spatial distribution of GTWR regression coefficients for industrial structure.
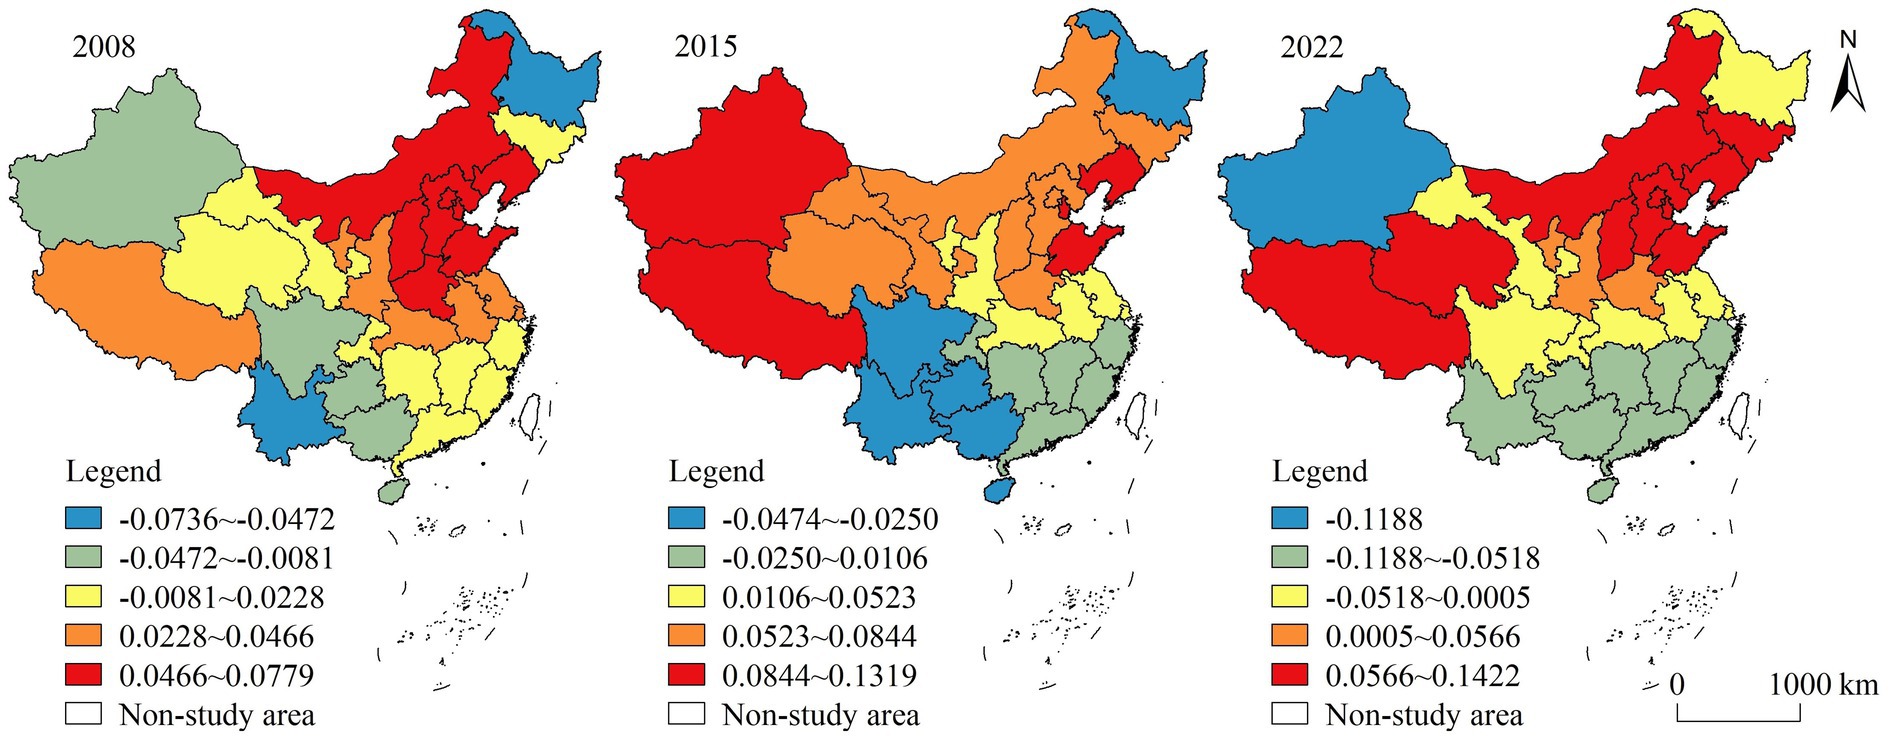
Figure 7. Spatial distribution of GTWR regression coefficients for transportation infrastructure.
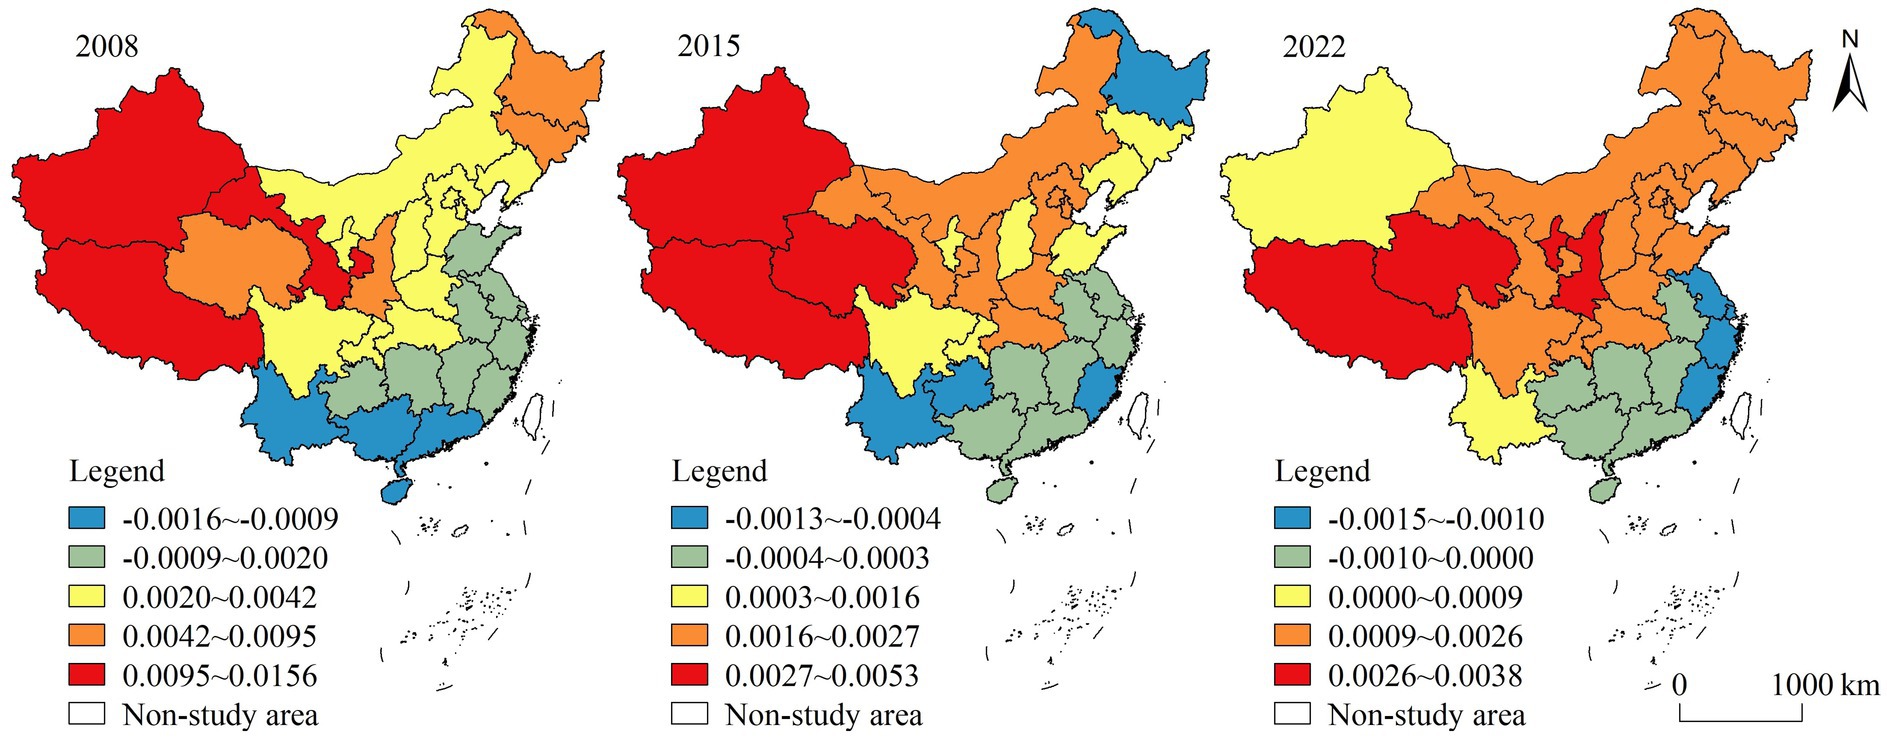
Figure 8. Spatial distribution of GTWR regression coefficients for scientific and technological innovation ability.
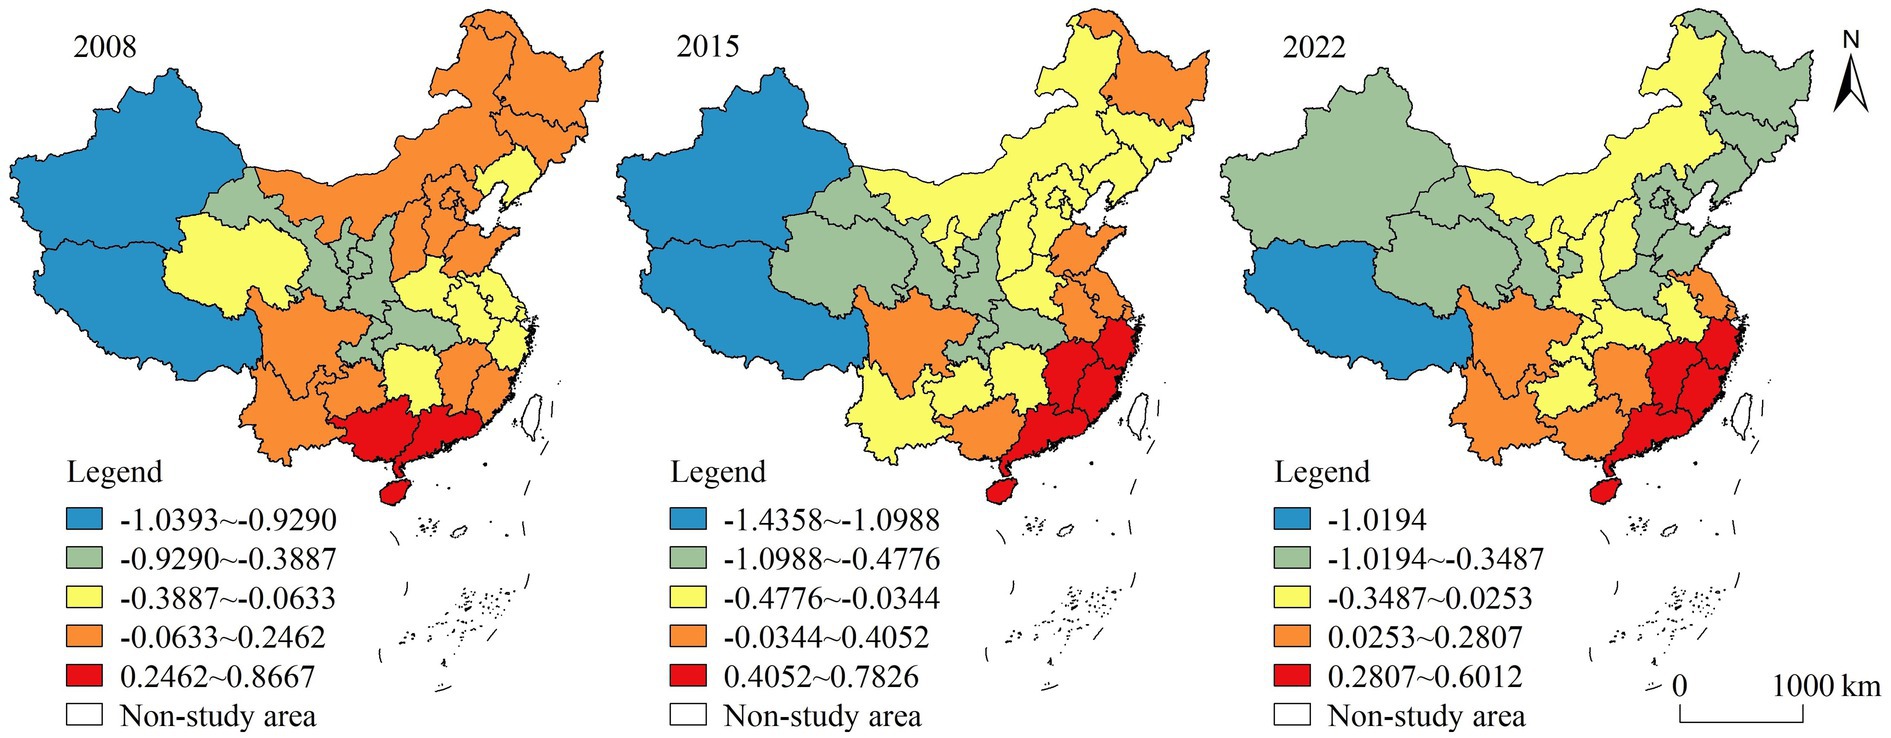
Figure 9. Spatial distribution of GTWR regression coefficients for rural population aging.
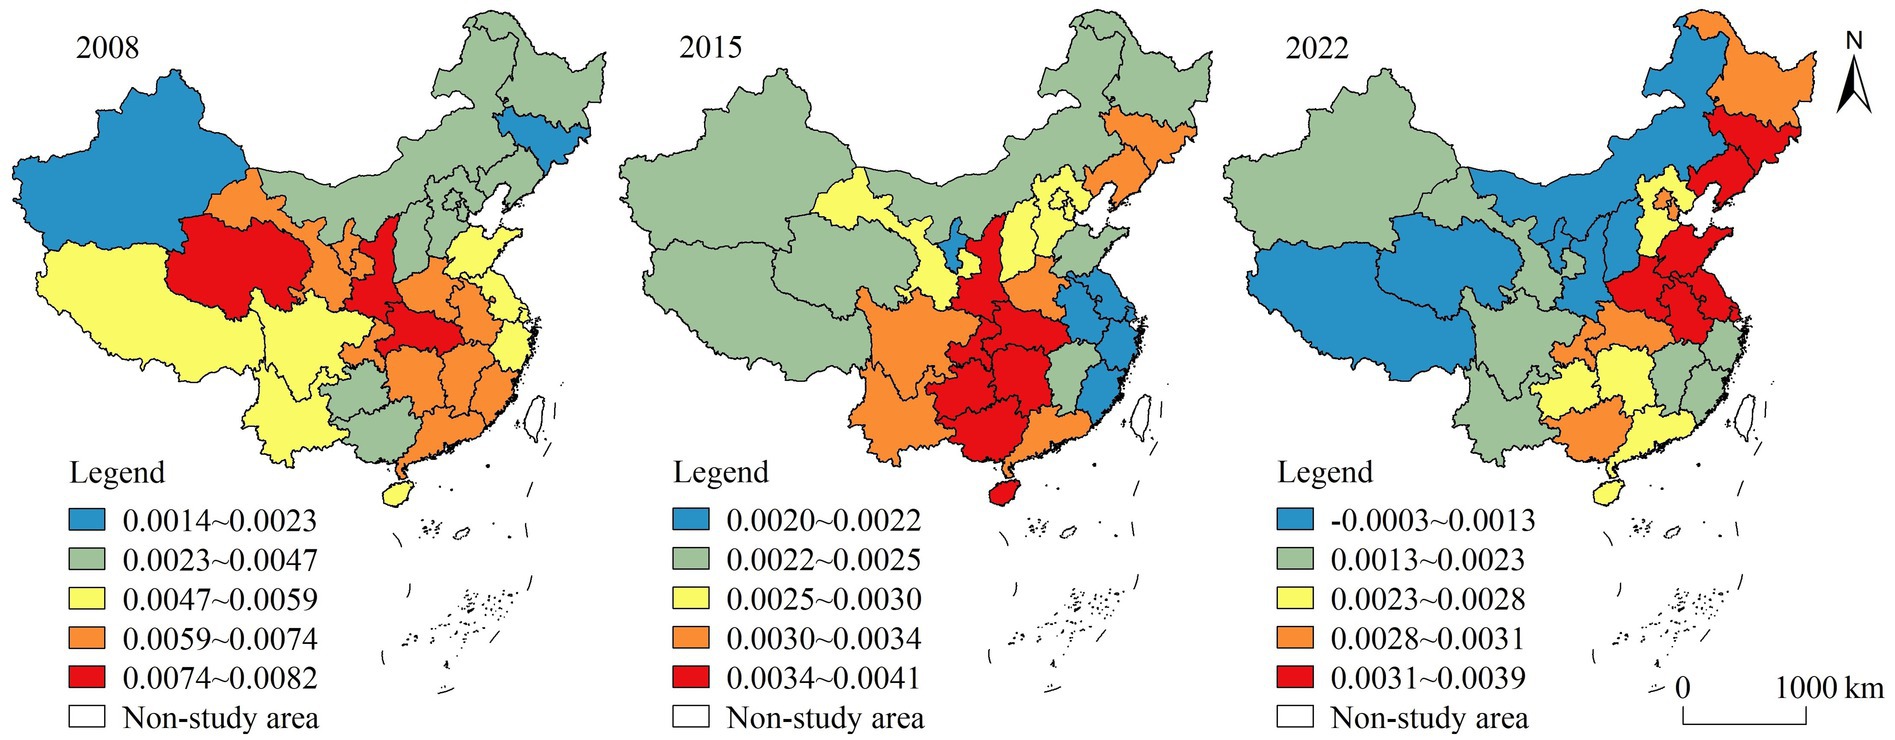
Figure 10. Spatial distribution of GTWR regression coefficients for internet penetration rate.
4 Conclusion and recommendations
HQDAR is the basis for building a strong agricultural nation and promoting comprehensive rural revitalization. Based on provincial panel data in China from 2008 to 2022, this study established an evaluation system for the HQDAR from the new development concepts, and measured the level of HQDAR. It analyzed its spatio-temporal distribution and evolution characteristics based on spatial autocorrelation, hot and cold spots analysis, Dagum Gini coefficient and Markov chain. The spatio-temporal heterogeneity of the influencing factors was explored by the GTWR model. The results of this study enrich theoretical research on high-quality development and provide a basis for decision-making.
(1) During 2008–2022, the level of HQDAR in China increased from 0.1876 to 0.3473, showing a steady upward trend. In terms of spatial distribution, the HQDAR mainly showed a pattern of high in the east and low in the west, with the high-value areas mainly concentrated in the eastern coastal region and the low-value areas mainly concentrated in the northwestern region.
(2) The HQDAR had a high positive spatial autocorrelation, with strong global geographical clustering, and it was constantly increasing in fluctuation. In addition, the local spatial agglomeration characteristics were also highly pronounced. The hot spots were mainly in the eastern region and some provinces in the central region, while the cold spots were mainly in the western region. The cold and hot spots mostly distributed in a planar continuous way and the distribution ranges gradually increased.
(3) The Dagum Gini coefficient decomposition showed that there were some regional disparities in HQDAR in China. The overall Gini coefficient difference was small and showed a clear downward trend. The inter-regional differences were the main source of regional differences, followed by the intra-regional differences, and finally the hypervariable density. The intra-regional differences in the three regions exhibited a tendency to fluctuate and narrow, with the eastern region being the largest. With regard to inter-regional disparities, the largest difference was seen between the eastern and western regions, next between the eastern and central regions, and finally between the central and western regions.
(4) The traditional Markov transfer probability matrix showed that the HQDAR in China exhibited stability in maintaining its original classification. Furthermore, there was an overall trend toward upward mobility. Type transfer mainly occurred between neighboring levels, while cross-level transfer had not yet occurred. After introducing the spatial Markov chain, it was shown that the neighborhood background had a significant impact on the transfer of HQDAR. The influence of different neighborhood backgrounds was different, and the high-level neighborhood background was easier to transfer upwards than the low-level one.
(5) The influencing factors of the HQDAR in China had significant spatial and temporal heterogeneity. The urbanization level, transportation infrastructure, scientific and technological innovation ability and Internet penetration rate had mainly positive effects on the HQDAR, with small changes in the regression coefficients. The industrial structure and rural population aging had mainly negative effects, with large changes in the regression coefficients.
Based on the conclusions, this study makes the following recommendations:
(1) Each region must consider both its resource endowments and developmental history to explore its path according to local conditions. For regions with high levels of development, it is necessary to adhere to the concepts of innovative and green development, utilize the economic base, target existing weaknesses, create new advantages, and further optimize high-quality development. For regions with low levels of development, it is important to promote high-quality development in an orderly and categorical manner based on actual conditions, focus on the introduction of advanced technologies, encourage farmers to find employment and start businesses through policies such as inclusive financing, optimize the flow of factors, and pay attention to issues such as infrastructure construction and environmental protection.
(2) Coordinated regional development is a key support. It is essential to consider coordinated inter-regional and intra-regional development. On the one hand, it is imperative to reinforce inter-regional agricultural technology cooperation and transfer. The scale effect and spillover effect of the eastern region in technological innovation, management experience and digital economy should be given full play, the inter-regional linkage effect should be realized and a bridge between east and west should be built. On the other hand, we should focus on regional polarization, and devise tailored strategies to address the specific weaknesses of individual provinces, encourage the exchange and sharing of experience within the region, and leverage the leadership of advanced provinces to drive collective high-quality development.
However, there were still some limitations in this study, which can be improved and expanded in the future. In terms of variable selection, this study had tried to select variables with different dimensions of representation when screening measurement index variables. Some variables were still missed due to difficulties in obtaining data. More detailed studies can be conducted in the future to include more research variables to facilitate the discovery of more scientific and accurate results. In addition, this study took 31 provinces in China as the research object, and the research scale was large. It was challenging to fully reveal the specific development status only by examining the spatio-temporal pattern and influencing factors at the provincial scale. The city or county levels should be discussed further in future studies. Furthermore, the spatio-temporal evolution is the result of multiple driving factors, and owing to limited data availability, only a subset of influencing factors is concerned. In future research, more influencing factors should be considered to systematically examine the spatio-temporal differentiation of influencing factors from the interaction of multiple factors.
Data availability statement
The original contributions presented in the study are included in the article/supplementary material, further inquiries can be directed to the corresponding author.
Author contributions
QD: Conceptualization, Data curation, Formal analysis, Methodology, Software, Validation, Visualization, Writing – original draft, Writing – review & editing. ZY: Conceptualization, Funding acquisition, Methodology, Supervision, Writing – review & editing. ZH: Data curation, Supervision, Writing – review & editing.
Funding
The author(s) declare that financial support was received for the research, authorship, and/or publication of this article. This work was supported by the Humanities and Social Science Found of Youth Ministry of Education (Grant no. 19YJCZH220).
Conflict of interest
The authors declare that the research was conducted in the absence of any commercial or financial relationships that could be construed as a potential conflict of interest.
Publisher’s note
All claims expressed in this article are solely those of the authors and do not necessarily represent those of their affiliated organizations, or those of the publisher, the editors and the reviewers. Any product that may be evaluated in this article, or claim that may be made by its manufacturer, is not guaranteed or endorsed by the publisher.
References
Abdar, Z. K., Amirtaimoori, S., Mehrjerdi, M. R. Z., and Boshrabadi, H. M. (2022). A composite index for assessment of agricultural sustainability: the case of Iran. Environ. Sci. Pollut. Res. 29, 47337–47349. doi: 10.1007/s11356-022-19154-6
Ahmed, N., Hamid, Z., Mahboob, F., Rehman, K. U., Sibt, M., Senkus, P., et al. (2022). Causal linkage among agricultural insurance, air pollution, and agricultural green total factor productivity in United States: pairwise granger causality approach. Agric. 12:1320. doi: 10.3390/agriculture12091320
Anselin, L. (1995). Local indicators of spatial association—LISA. Geogr. Anal. 27, 93–115. doi: 10.1111/j.1538-4632.1995.tb00338.x
Bekun, F. V., Hassan, A., and Osundina, O. A. (2018). The role of agricultural credit in agricultural sustainability: dynamic causality. Int. J. Agric. Resour. Gov. Ecol. 14, 400–417. doi: 10.1504/IJARGE.2018.098026
Brunsdon, C., Fotheringham, A. S., and Charlton, M. (1996). Geographically weighted regression: a method for exploring spatial non-stationarity. Geogr. Anal. 28, 281–298. doi: 10.1111/j.1538-4632.1996.tb00936.x
Chen, M. X. (2020). Challenges and countermeasures for the high-quality development of agriculture and rural areas in the 14th five-year plan period. Acad. J. Zhongzhou, 49–55.
Chen, W. J., and Lu, X. Y. (2022). Process and promotion path of high quality agricultural rural development in China. Acad. Exch., 127–138.
Chen, H. Q., and Zeng, F. S. (2022). Level measurement and regional difference of agricultural and rural modernization development in Hunan Province. Econ. Geogr. 42, 185–194. doi: 10.15957/j.cnki.jjdl.2022.11.020
Chen, J. T., Zhang, Q. H., and Lv, J. Q. (2018). Evaluation of agricultural modernization level in China's provinces and the analysis of influencing factors based on spatial econometrics. Chin. J. Agric. Resour. Reg. Plann. 39, 205–213. doi: 10.7621/cjarrp.1005-9121.20180231
Chen, L. M., Zheng, Q. Y., and Zhou, N. (2022). Green development in China’s agriculture and rural areas: an evaluation based on TOPSIS and hindrance model. J. Hebei Agric. Univ. 24, 106–114. doi: 10.13320/j.cnki.jauhe.2022.0054
Dagum, C. (1997). A new approach to the decomposition of the Gini income inequality ratio. Empir. Econ. 22, 515–531. doi: 10.1007/BF01205777
Dong, X. B. (2023). Innovation path of the new digital infrastructure driving high-quality development in agriculture and rural areas. Stud. Pract., 33–42. doi: 10.19624/j.cnki.cn42-1005/c.2023.01.010
Dong, Z. Y., and Zhao, C. X. (2022). Path choice of China’s agricultural and rural high-quality development in rural revitalization. J. Party Sch. Cent. Comm. CPC (Chin. Acad. Gov.) 26, 80–88. doi: 10.14119/j.cnki.zgxb.2022.02.012
Du, J. G., Li, B., and Yang, H. (2023). Impact of agricultural human capital on agricultural green total factor productivity under population aging. China Popul. Resour. Environ. 33, 215–228. doi: 10.12062/cpre20230501
Fu, X. M. (2023). Research on empowering high-quality development of agriculture and rural areas with digital technology. Southwest Financ., 81–93.
Gallo, L. J. (2004). Space-time analysis of GDP disparities among European regions: a Markov chains approach. Int. Reg. Sci. Rev. 27, 138–163. doi: 10.1177/0160017603262402
Gorgij, A. D., and Moayeri, M. M. (2023). Proposing a novel method for the irrigation water quality assessment, using entropy weighted method, entitled: “EIWQI”. Environ. Earth Sci. 82:462. doi: 10.1007/s12665-023-11150-4
Gu, L. J. (2024). Digital economy, urbanization and high-quality development of agriculture and rural areas—an empirical analysis based on Anhui Province. Stat. Decis., 40, 22–27. doi: 10.13546/j.cnki.tjyjc.2024.11.004
Guo, J. J., and Liu, Y. P. (2022). Spatio-temporal differences and dynamic evolution of high-quality development of agriculture in China. Ecol. Econ. 38, 102–110.
Guo, C. Y., and Zeng, F. S. (2021). Analysis on the mechanism and effects of rural infrastructure on the high-quality development of agriculture. Res. Agric. Modern. 42, 1017–1025. doi: 10.13872/j.1000-0275.2021.0074
Han, L., and Cao, J. Y. (2023). Fiscal-financial synergy and agricultural and rural modernization: mechanism of action, empirical tests and case verification. Southwest Financ., 67–79.
Hu, H., and Zhuang, T. H. (2024). Measurement of the modernization level of Chinese style agriculture and rural areas and analysis of influencing factors. Sci. Manage. Res. 42, 126–134. doi: 10.19445/j.cnki.15-1103/g3.2024.01.014
Huang, B., Wu, B., and Barry, M. (2010). Geographically and temporally weighted regression for modeling spatio-temporal variation in house prices. Int. J. Geogr. Inf. Sci. 24, 383–401. doi: 10.1080/13658810802672469
Huang, Y. H., Yang, Y. F., and Li, A. G. (2024). Research on coordination mechanism between agricultural and rural modernization and vocational education’ high quality development: based on CCDM-PVAR model. China Soft Sci., 131–140.
Ji, Z. H. (2021). Spatial differences and driving mechanism of high quality development in China's agriculture and rural areas. J. Quant. Technol. Econ. 38, 25–44. doi: 10.13653/j.cnki.jqte.2021.12.001
Jiang, H., Zhang, C., and Jiang, H. P. (2022). Study on effect and mechanism of China's agricultural economic resilience on agricultural high-quality development. Agric. Econ. Manage., 20–32.
Latruffe, L., Diazabakana, A., Bockstaller, C., Desjeux, Y., Finn, J., Kelly, E., et al. (2016). Measurement of sustainability in agriculture: a review of indicators. Stud. Agric. Econ. 118, 123–130. doi: 10.7896/j.1624
Li, Y. H., Chen, H., and You, X. (2024). Theoretical mechanism and empirical study on agricultural socialization services enabling high-quality rural development. Res. Agric. Mod. 45:79. doi: 10.13872/j.1000-0275.2024.0013
Liu, T., and Du, S. M. (2021). The construction of high-quality development evaluation index system of agricultural based on new development concept. Chin. J. Agric. Resour. Reg. Plann. 42, 1–9. doi: 10.7621/cjarrp.1005-9121.20210401
Liu, T., Li, J. X., and Huo, J. J. (2020). Spatial-temporal pattern and influencing factors of high-quality agricultural development in China. J. Arid Land Resour. Environ. 34, 1–8. doi: 10.13448/j.cnki.jalre.2020.261
Liu, C. M., Ning, A. N., Jia, B. B., and Zhang, D. Y. (2023). Statistical measurement and spatiotemporal characteristics of agricultural and rural modernization in China. Stat. Decis. 39, 43–48. doi: 10.13546/j.cnki.tjyjc.2023.11.007
Magrini, A., and Giambona, F. (2022). A composite indicator to assess sustainability of agriculture in European union countries. Soc. Indic. Res. 163, 1003–1036. doi: 10.1007/s11205-022-02925-6
Mukairanmu, W. (2022). Evaluation and countermeasures for the high quality development of Heilongjiang agriculture. Ind. Eng. Innov. Manage. 5, 59–64. doi: 10.23977/ieim.2022.050308
Pham, L. V., and Smith, C. (2014). Drivers of agricultural sustainability in developing countries: a review. Environ. Syst. Decis. 34, 326–341. doi: 10.1007/s10669-014-9494-5
Rey, S. J. (2010). Spatial empirics for economic growth and convergence. Geogr. Anal. 33, 195–214. doi: 10.1111/j.1538-4632.2001.tb00444.x
Rozélia, L., Arminda, P., and Wagner, M. E. (2020). Sustainable development in agriculture and its antecedents, barriers and consequences – an exploratory study. Sustain. Prod. Consump. 27, 298–311. doi: 10.1016/j.spc.2020.10.032
Smith, L. E. D. (2020). Policy options for agriculture green development by farmers in China. Front. Agr. Sci. Eng. 7, 90–97. doi: 10.15302/J-FASE-2019290
Talukder, B., Hipel, K. W., and van Loon, G. W. (2018). Using multi-criteria decision analysis for assessing sustainability of agricultural systems. Sustain. Dev. 26, 781–799. doi: 10.1002/sd.1848
Tang, W. H. (2022). Digital technology drives high-quality development of agriculture and rural areas: theoretical interpretation and practical path. J. Nanjing Agric. Univ. 22, 1–9. doi: 10.19714/j.cnki.1671-7465.2022.0018
Tang, X. P., and Jiang, J. (2023). Impact of rural population aging on high-quality agricultural development. J. South China Agric. Univ. 22, 45–56. doi: 10.7671/j.issn.1672-0202.2023.03.005
Tian, J. X., Chen, J. Y., and Shi, B. F. (2021). The agricultural and rural high-quality development level in the middle Yellow River region-evidence from the survey data from 1939 households. Rural Financ. Res., 22–30. doi: 10.16127/j.cnki.issn1003-1812.2021.09.001
Vasylieva, N., and James, H. (2021). The effect of urbanization on food security and agricultural sustainability. Econ. Soc. 14, 76–88. doi: 10.14254/2071-789X.2021/14-1/5
Wang, Z. (2024). Research on the evaluation of agricultural and rural modernization development level and spatial distribution differences in Shaanxi province. Chin. J. Agric. Resour. Reg. Plann. 45, 218–227. doi: 10.7621/cjarrp.1005-9121.20240321
Wang, L., and Li, X. (2024). Evaluation and analysis of the high-quality development level of agriculture and rural areas. J. Shihezi Univ. 38, 48–55. doi: 10.13880/j.cnki.cn65-1210/c.20240329.001
Wang, X. G., and Qu, H. Y. (2020). The ideas and suggestions on promoting high-quality agricultural development through scientific and technological innovation. Stud. Explor., 120–127.
Wang, X. H., Zhang, Y., and Hu, D. C. (2021). Digital finance for high-quality agricultural and rural development: a study of typical cases, realistic dilemmas and mechanism innovation. J. Jiangnan Univ. 20, 18–32.
Wei, H. K. (2019). Grasp the scientific connotation of agricultural and rural modernization. Rural Work Commun., 1.
Wu, H., Guo, X. Y., and Tang, H. (2023). Comprehensive evaluation of the development level of Beijing’s agricultural and rural modernization from 2015 to 2020. J. China Agric. Univ. 28, 175–190. doi: 10.11841/j.issn.1007-4333.2023.07.16
Xue, D. Z. (2023). The logical and practical approach of digital technology enabling high-quality development of agriculture and rural areas. Agric. Econ., 28–30.
Yang, Q. F., Zhang, P. Y., Li, J., Liu, W. X., and He, X. L. (2022). Development level and spatio-temporal evolution of agricultural modernization in Northeast China. Sci. Geogr. Sin. 42, 1588–1599. doi: 10.13249/j.cnki.sgs.2022.09.008
Yang, T. P., and Zhong, G. Z. (2024). Spatiotemporal evolution characteristics and influencing factors of China’s agricultural and rural modernization. Stat. Decis. 40, 94–99. doi: 10.13546/j.cnki.tjyjc.2024.05.017
Yao, Y. C., and Li, B. (2023). Mechanisms, challenges and approaches of promoting high-quality development of agriculture and in rural areas through urban-rural integration. Tianjin Soc. Sci., 99–106. doi: 10.16240/j.cnki.1002-3976.2023.03.006
Zhang, J. H., and Li, Y. Q. (2024). Logical correlation, dilemma review and advancing path of agricultural and rural modernization in the process of high-quality development. J. China Agric. Univ., 3–6.
Zhao, D. Y., and Cui, J. J. (2024). The spatial-temporal characteristics, regional disparities, and influencing factors of high-quality agricultural and rural development in China. J. Huazhong Agric. Univ., 10–24. doi: 10.13300/j.cnki.hnwkxb.2024.03.002
Zhao, M., and Zhang, Y. (2023). The impact of China’s digital inclusive finance on the high-quality development of agriculture and rural areas. Hubei Agric. Sci. 62, 243–251. doi: 10.14088/j.cnki.issn0439-8114.2023.12.042
Keywords: agriculture, rural, high-quality development, spatio-temporal differentiation, influencing factor, China
Citation: Ding Q, Yang Z and Huang Z (2025) Spatio-temporal differentiation and influencing factors of high-quality development of agriculture and rural areas in China. Front. Sustain. Food Syst. 8:1471197. doi: 10.3389/fsufs.2024.1471197
Edited by:
Athula Naranpanawa, Griffith University, AustraliaReviewed by:
Majid Ali, Xi’an Jiaotong University, ChinaPeng Jiquan, Jiangxi University of Finance and Economics, China
Copyright © 2025 Ding, Yang and Huang. This is an open-access article distributed under the terms of the Creative Commons Attribution License (CC BY). The use, distribution or reproduction in other forums is permitted, provided the original author(s) and the copyright owner(s) are credited and that the original publication in this journal is cited, in accordance with accepted academic practice. No use, distribution or reproduction is permitted which does not comply with these terms.
*Correspondence: Zhen Yang, emhlbnlhbmdAY2NudS5lZHUuY24=