 Yan Meng
 Yangyang Shen
 Wei Wang
 Yunqiang Liu
 Fang Wang
 Huan Wang
- College of Management, Sichuan Agricultural University, Chengdu, China
Mitigating agricultural carbon emissions is pivotal for attaining the objectives of carbon peak and carbon neutrality. Utilizing a time-varying parametric Cobb-Douglas (C-D) production function, this study employs an enhanced Logarithmic Mean Divisia Index (LMDI) decomposition approach, the Tapio decoupling model, and Monte Carlo simulations to investigate the determinants and decoupling dynamics of agricultural carbon emissions within Sichuan Province from 2010 to 2020. The findings reveal that: (1) Factors such as carbon emission intensity, agricultural structure, labor inputs, and capital stock played a significant role in suppressing agricultural carbon emissions, collectively contributing to a reduction of 484.12 million tonnes. (2) The unstable decoupling of agricultural carbon emissions from economic development in Sichuan Province. Capital stock, alongside carbon emission intensity and agricultural structure, significantly contributed to this decoupling. To harmonize agricultural economic growth with carbon emission reduction, emphasis should be placed on manure management and resource utilization in livestock and poultry farming. Furthermore, leveraging technological advancements to enhance resource efficiency is crucial for reducing carbon emissions. Simultaneously, strategic management of fixed asset growth, focused on energy conservation, can catalyze the synergistic effects of economic development and technological spillovers.
1 Introduction
In recent years, global warming and its adverse impacts have attracted widespread human attention.1 Greenhouse gases are the main cause of global warming (Ojo and Baiyegunhi, 2021). Among the greenhouse gases, carbon dioxide (CO2), accounting for 68% of global greenhouse gas emissions, contributes significantly to the continuous rise in global temperatures (Moon et al., 2020; Idroes et al., 2023).
Agriculture is a basic industry for the development of the national economy, and the total amount of carbon emissions generated in the production process should not be underestimated. According to the Intergovernmental Panel on Climate Change (IPCC), agriculture accounted for 15% of annual anthropogenic greenhouse gas emissions in 2019 and has seen an increase of about 17% over the past three decades (FAO, 2023). China ranks among the world’s largest GHG emitters, its agricultural carbon emissions constitute a significant component of the country’s overall emissions (Ming et al., 2024). Therefore, reducing China’s agricultural carbon emissions will help promote global energy conservation and emission reduction.
In its pursuit of carbon emission reduction, China is implementing a sustainable development strategy with a series of measures aimed at reducing carbon emissions and has pledged to achieve carbon peaking by 2030 and carbon neutrality by 2060. Since the 18th National Congress of the Communist Party of China (CPC), China has successively introduced agricultural low-carbon development policies, such as “one empty, two reductions and three basics” and “emission reduction and carbon sequestration in agriculture and rural areas,” for example, constructing a new rice cropping model with high rice yield and methane emission (CH4) reduction under straw return, and promoting water-saving irrigation technology in rice fields to achieve the goals of carbon peaking and carbon neutrality (Botong et al., 2024).
The first task to achieve carbon emission reduction in agriculture is to accurately account for the total amount of carbon emissions. Scholars around the world have developed models including national inventories, life cycle assessment (LCA), and denitrification decomposition of agroecosystems (DNDC; Alhashim et al., 2021). These models help to measure carbon emissions from different regions and sectors, creating a comprehensive measurement system for agricultural carbon emissions (Sus et al., 2010). Compared to national accounting inventories, LCA provides a more comprehensive view of carbon accounting by taking into account carbon emissions from the neglected import and export of products based on the carbon-emitting links in the production chain (Müller et al., 2020). Despite recent mathematical and computational improvements in LCA, the data availability of LCA remains the biggest constraint for LCA in novel social issues and environmental change (Jebari et al., 2024). Agricultural LCA models apply to environments with different characteristics (Nemecek et al., 2024), and a detailed description of environmental impacts requires the construction of a detailed and customized system, a requirement that often leads to inadequate LCA estimates. On the other hand, DNDC is mainly used in agroecology for modeling nitrogen and carbon cycling processes to estimate carbon emissions. For example, it simulates rice production based on changes in yield and GHG emissions after multi-objective optimization (Yulin et al., 2024), but data upper bounds on crop yields and carbon emissions in simulation experiments may be unclear due to limited data.
Secondly, most of the studies on identifying drivers of agricultural emissions combine the logarithmic mean Divisia index (LMDI) model with the C-D function, from the population (Jia et al., 2024), economic growth (Maulidar et al., 2024), energy structure and intensity (Lauk et al., 2024), industrial structure (Peng et al., 2024), technological progress (Liu and Feng, 2021), agricultural policy (Mac Leod et al., 2015; Dharmasena and Gunasena, 2024) and other aspects of the empirical analyses, indicating that agricultural carbon emissions are affected by the complexity of macro-environment and industrial characteristics.
Finally, regarding how agriculture can reduce emissions to meet standards and achieve a dynamic balance between economic growth and carbon emission reduction, some scholars have applied the decoupling factors proposed by the Organization for Economic Co-operation and Development. They used the Tapio decoupling model to study the decoupling stages of various localities (Yuan et al., 2023; Jia et al., 2024). The separation of economic growth and environmental pressure can be effectively achieved by promoting low-carbon agricultural technologies (Raza et al., 2023) and optimizing agricultural structures to improve energy efficiency (Chen et al.,2020), which can lead to a shift from weak decoupling to strong decoupling of agricultural carbon emissions, enhancing the agricultural economy’s sustainability. However, the existing literature only emphasizes a certain perspective of factor inputs, ignoring the impact of the production process on carbon emissions, resulting in an underestimation of the total carbon emissions. At the same time, the research methodology mostly adopts the traditional LMDI and decoupling model, which uses the C-D production function with constant output elasticity to estimate the impact of technology, capital, and labor factors on carbon emissions, and ignores the impact of technological progress and changes in factor inputs on outputs (Solow, 1957), which fails to accurately propose a scientific path to achieve carbon emission reduction while realizing economic development.
The innovation of this paper is reflected in three aspects. First, the importance of the research object. Sichuan, known as the “Land of Heaven” since ancient times, is a significant traditional agricultural province in China. This makes it strategically important for ensuring the supply of crucial domestic primary products. In 2023, the province’s grain sowing area spanned 960.6 million mu (a traditional Chinese unit of area, where 1 mu equals approximately 0.0667 hectares), comprising 6.4% of the country’s total. Moreover, the province accounted for 9.17% of the country’s total with 66.627 million pigs slaughtered. Considering the environmental pollution problems caused by agricultural cultivation and breeding in Sichuan in recent years, Sichuan is facing an urgent need for a green transformation of agriculture. However, previous studies have focused on industrial carbon emissions, ignoring the carbon emissions caused by agricultural development, and the data are mainly based on national data, and few data at the provincial level are used. Second, the measurement indicators and methods are innovative. Compared with the traditional LMDI and Tapio decoupling models, which are often used for agricultural carbon emission analysis, the study object of the drivers and decoupling relationship is relatively fixed, and cannot reveal the impact of changes in factors such as technological progress, investment expansion and employment expansion on agricultural carbon emissions. Therefore, this study centers on Sichuan Province, utilizing the C-D production function and the LMDI decomposition approach to examine the determinants and the degree of decoupling in agricultural carbon emissions between 2010 and 2020. Additionally, it constructs a Monte Carlo simulation model to forecast the prospective trajectory of agricultural carbon emissions in Sichuan Province. It considers changes in technology, labor, and capital, aiming to understand the contributions of these factors to emissions. Third, the closeness of the theoretical and practical connection. This analysis provides objective data to support Sichuan’s economic and social development and its agricultural green transformation. The ultimate goal is to accelerate Sichuan’s achievement of carbon neutrality and peak carbon emissions targets.
2 The methodology
2.1 Carbon emission measurement methods and data sources
Greenhouse gases (GHG) mainly include , , and nitrous oxide ( ), and the World Resources Institute (WRI) and the World Business Council for Sustainable Development (WBCSD) have classified the sources of GHG emissions from agriculture into mechanical and non-mechanical categories. The mechanical category mainly comes from agricultural irrigation, power generation, and other operations involving the combustion of fossil fuels (Seungman et al., 2023); The non-mechanical category is generated through complex biological reactions, such as intestinal fermentation and manure treatment of ruminant livestock, which produces large quantities of (Charlotte et al., 2023), nitrogen-intensive agricultural practices, such as the use of fertilizers and pesticides, generate . Additionally, changes in the anaerobic environment during rice cultivation (Qiang et al., 2023), agricultural land preparation, and straw burning can induce and emissions (Carla et al., 2024, Bhuvaneshwari et al., 2019).
Based on the above discussion, and concerning existing studies (Kamarposhti et al., 2024) and the situation in Sichuan Province, this paper measures agricultural carbon emissions from two major perspectives (Figure 1): among them, carbon emissions from six types of carbon sources, namely, electricity, fertilizer, agricultural film, pesticide, irrigation, and straw burning (including Corn, Wheat and Rice), are measured from the perspective of factor inputs; and from the perspective of the production process, focusing on animal intestinal fermentation and fecal management, four types of carbon emissions, namely, cattle, swine, sheep, and poultry, are measured. Fertilizer use is measured based on the discounted amount. The amounts of various factor inputs, the yields of different crops, planted areas, and unit yields are based on actual quantities recorded in the current year’s statistical yearbook. Due to the lack of direct, detailed data on soil management types, the actual sown area (including Corn, Wheat and Rice) of the current year serves as an approximate indicator for analysis (Cheng-shi and Yu, 2021). According to the National Bureau of Statistics (NBS), in 2021, cereal production in Sichuan province accounted for 80.38% of the province’s grain crop production, potatoes accounted for about 15.61%, and legumes accounted for about 9.68%; the cereal crops planted in Sichuan province are mainly rice, maize, and wheat, and rice production accounted for 51.86% of the province’s cereal crop production. Therefore, the use of rice, wheat, and maize as the sources of carbon emissions from agricultural soil management and straw treatment in Sichuan Province is highly representative; For the measurement of the number of cattle, pigs, sheep, and other livestock, calculations were based on the stock data for the year as recorded in the China Livestock Yearbook to ensure the accuracy and reliability of the data. The required data come from the 2010 to 2020 editions of the China Rural Statistics Yearbook, the China Livestock Yearbook, and the Sichuan Statistics Yearbook.
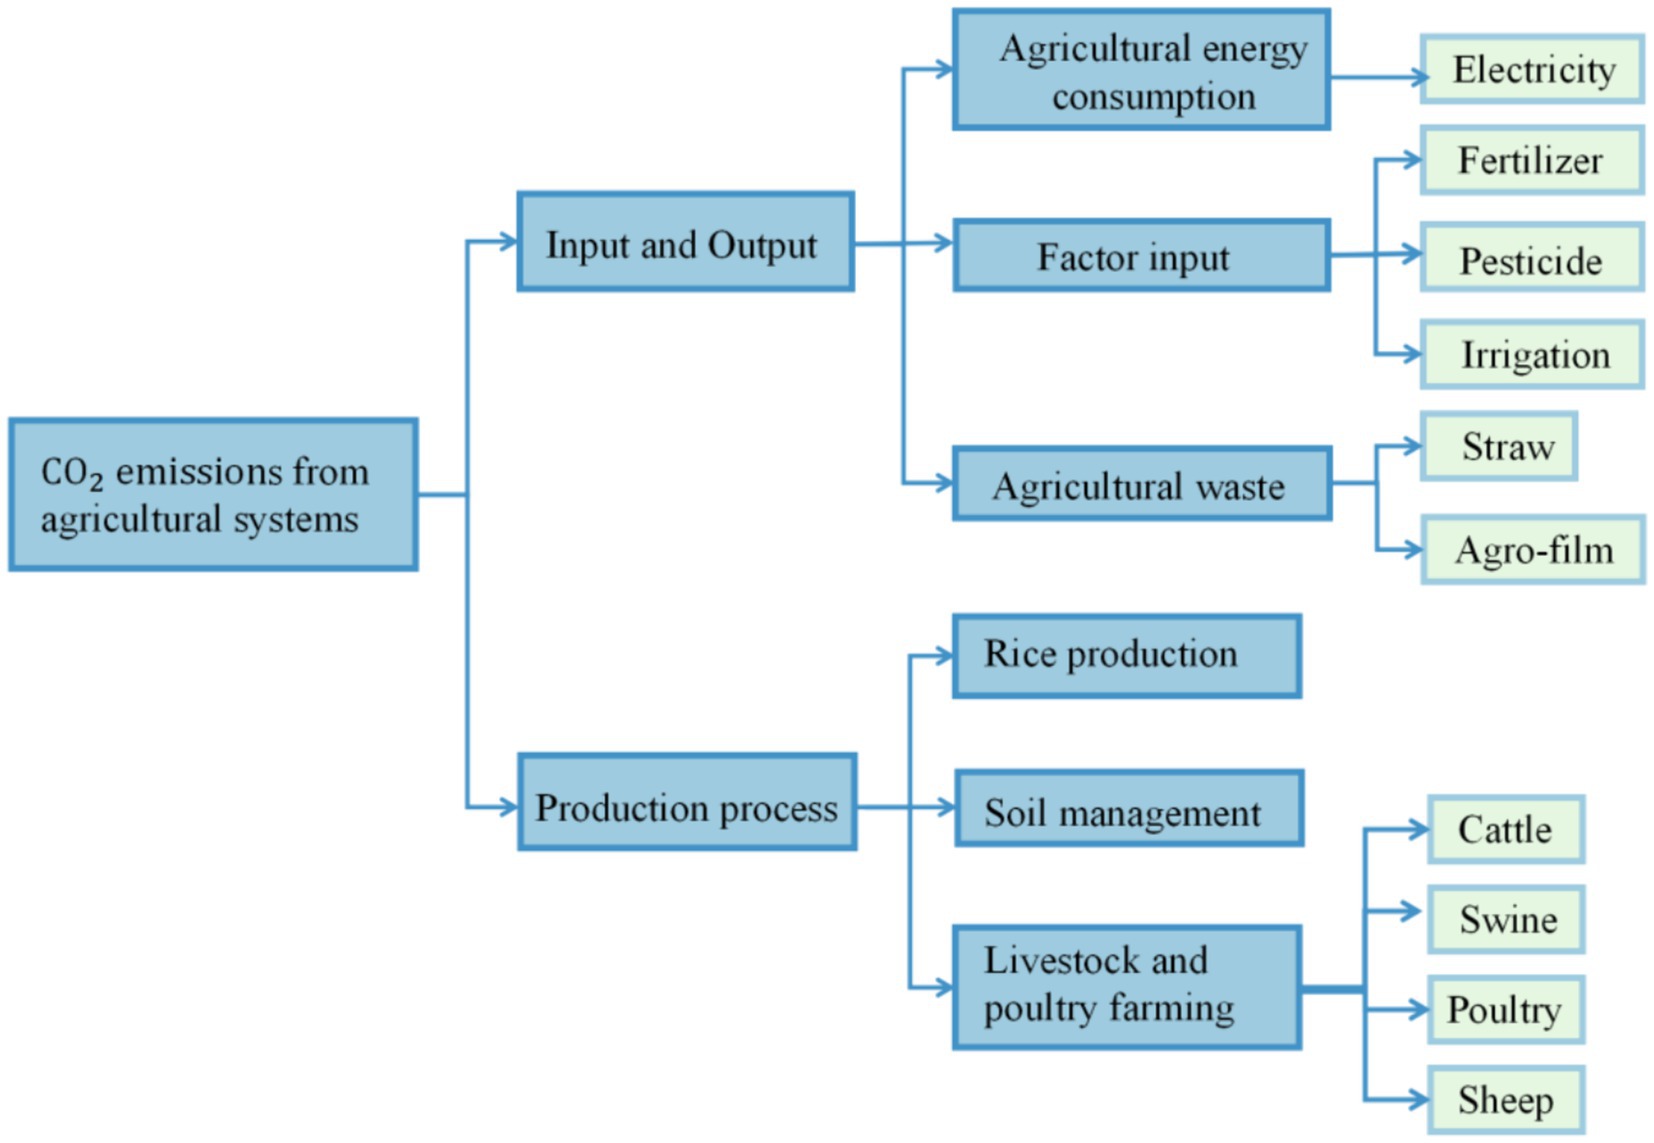
Figure 1. Six major carbon sources of agricultural carbon emissions.
Referencing the carbon emission coefficients from the Fourth Assessment Report of the IPCC, this study employs the carbon emission measurement formula to calculate the emissions from each category of carbon sources (Equation 1). The calculation formula is as follows:
Where: denotes the total amount of agricultural carbon emissions in Sichuan Province (kg); is the carbon emissions from the ith source (kg); is the number of the ith source; and is the carbon emission coefficient corresponding to the ith source. The required carbon emission coefficients and sources for each type of carbon emission source are as follows:
Due to the lack of specific annual data for straw treatment, rice production, and animal enteric fermentation, when calculating the carbon emissions generated by them, the collected data need to be processed to ensure the measurement caliber is consistent (Table 1).
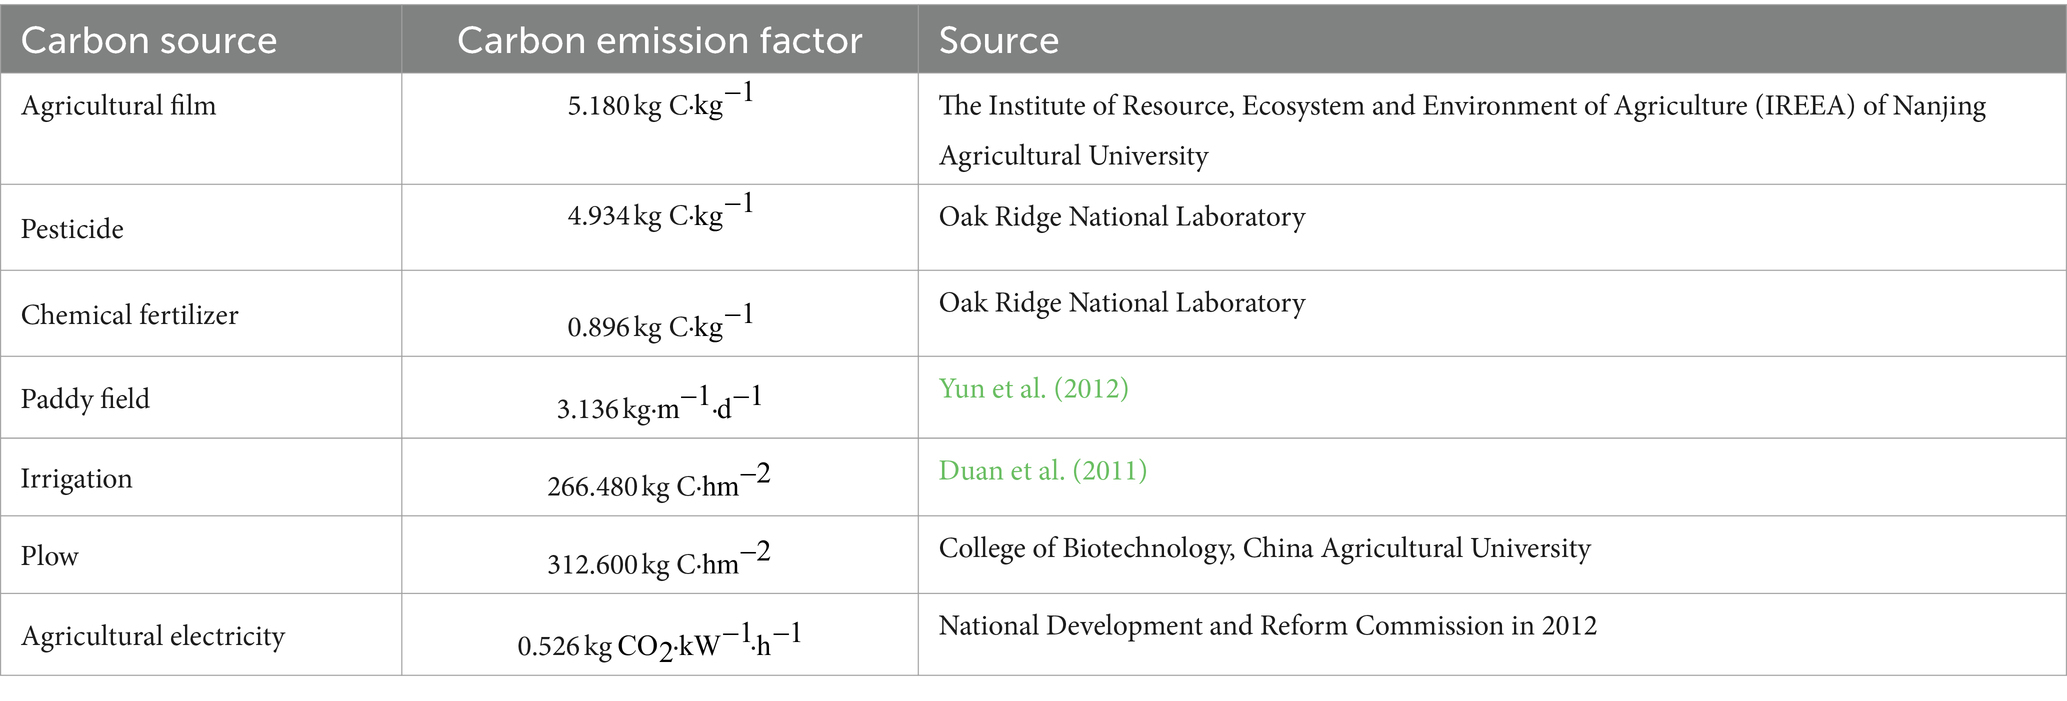
Table 1. Emission factors for major carbon sources from agricultural production activities.
In the calculation of carbon emissions generated during the growth process of rice, the carbon emission coefficients refer to the IPCC’s Fourth Assessment Report after the unification of the unit by the conclusions of Yun et al. (2012), according to the median value of the growth cycle of rice 130 d unified data.
This study next calculated the carbon emissions of animal enteric fermentation and determined the annual average feeding quantity of cattle, pigs, sheep and poultry in the calculation formula according to Zhu et al. (2023).
For pigs and poultry, the annual stockpile does not accurately reflect the current year’s stockpile because outgrowths are generated during the stockpiling process, so we adjust the amount of livestock and poultry breeding, which is based on the average rate of livestock and poultry slaughtering. It is known that the turnout rate of pigs and poultry is greater than 1, and the turnout rate of both cattle and sheep is less than 1. Therefore, the annual average feeding quantity of pigs and poultry is adjusted according to the following formula (Equation 2):
Where is the average annual rearing capacity of livestock and poultry in the ith (head/million birds); is the average life cycle of livestock and poultry in the ith (d), with the average life cycles of pigs and livestock and poultry being 200 and 55 d, respectively; and is the annual production capacity of livestock and poultry in the ith (head/million units).
For cattle and sheep with a turnout rate of less than 1, their average annual feeding capacity is adjusted according to the year-end stocking, with the formula (Equation 3):
Where and are the year-end stock of cattle and sheep in year t and year t-1. The carbon emission coefficients of each livestock are shown in Table 2.
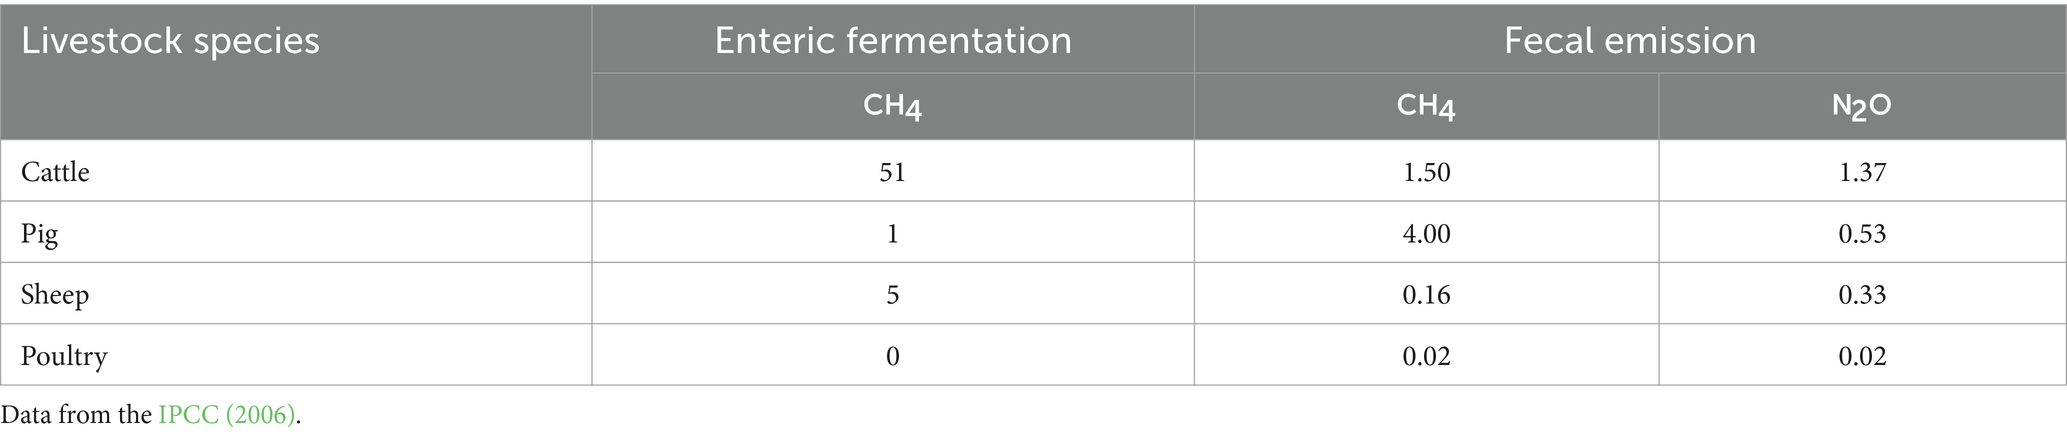
Table 2. Carbon emission factors for major livestock and poultry
In addition, due to the different types of gases emitted during the growth of livestock and poultry in the above table, the study based on the IPCC’s Fourth Assessment Report to replace the emissions and gases from livestock and poultry manure into standard carbon (C) according to the conversion factors of 6.818 and 81.273, 1 t = 6.82 t C.
The carbon emission formula for straw burning is as follows (Equation 4):
Where is the total carbon emission from straw burning (kg); is the grain production of Sichuan Province in the year i (million t); C is the average grain-to-straw ratio of grain crops (%); R is the average open burning ratio of grain crops (%), with a scale of 1; F is the combustion efficiency (%); and is the average straw open burning emission factor of grain crops (g· ).
This study used three-grain crops, namely, maize, wheat, and rice, as representatives to substitute into the above equation, and to simplify the arithmetic, the carbon emissions from straw burning were only considered as gas emissions, and the values applied in the process of calculations are shown in Table 3.
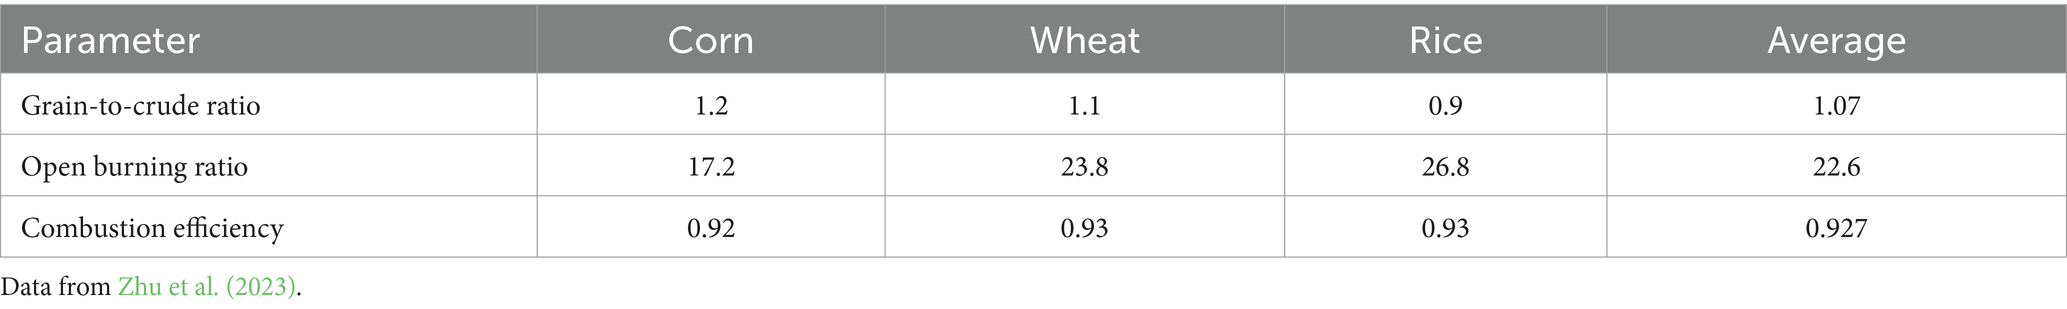
Table 3. Carbon emission indicators of straw from major food crops.
2.2 Study area
The study area is located in the inland of southwest China, in the upper reaches of the Yangtze River, with a land area of 486,000 , including 9.68 million hectares of cultivated land (Figure 2).
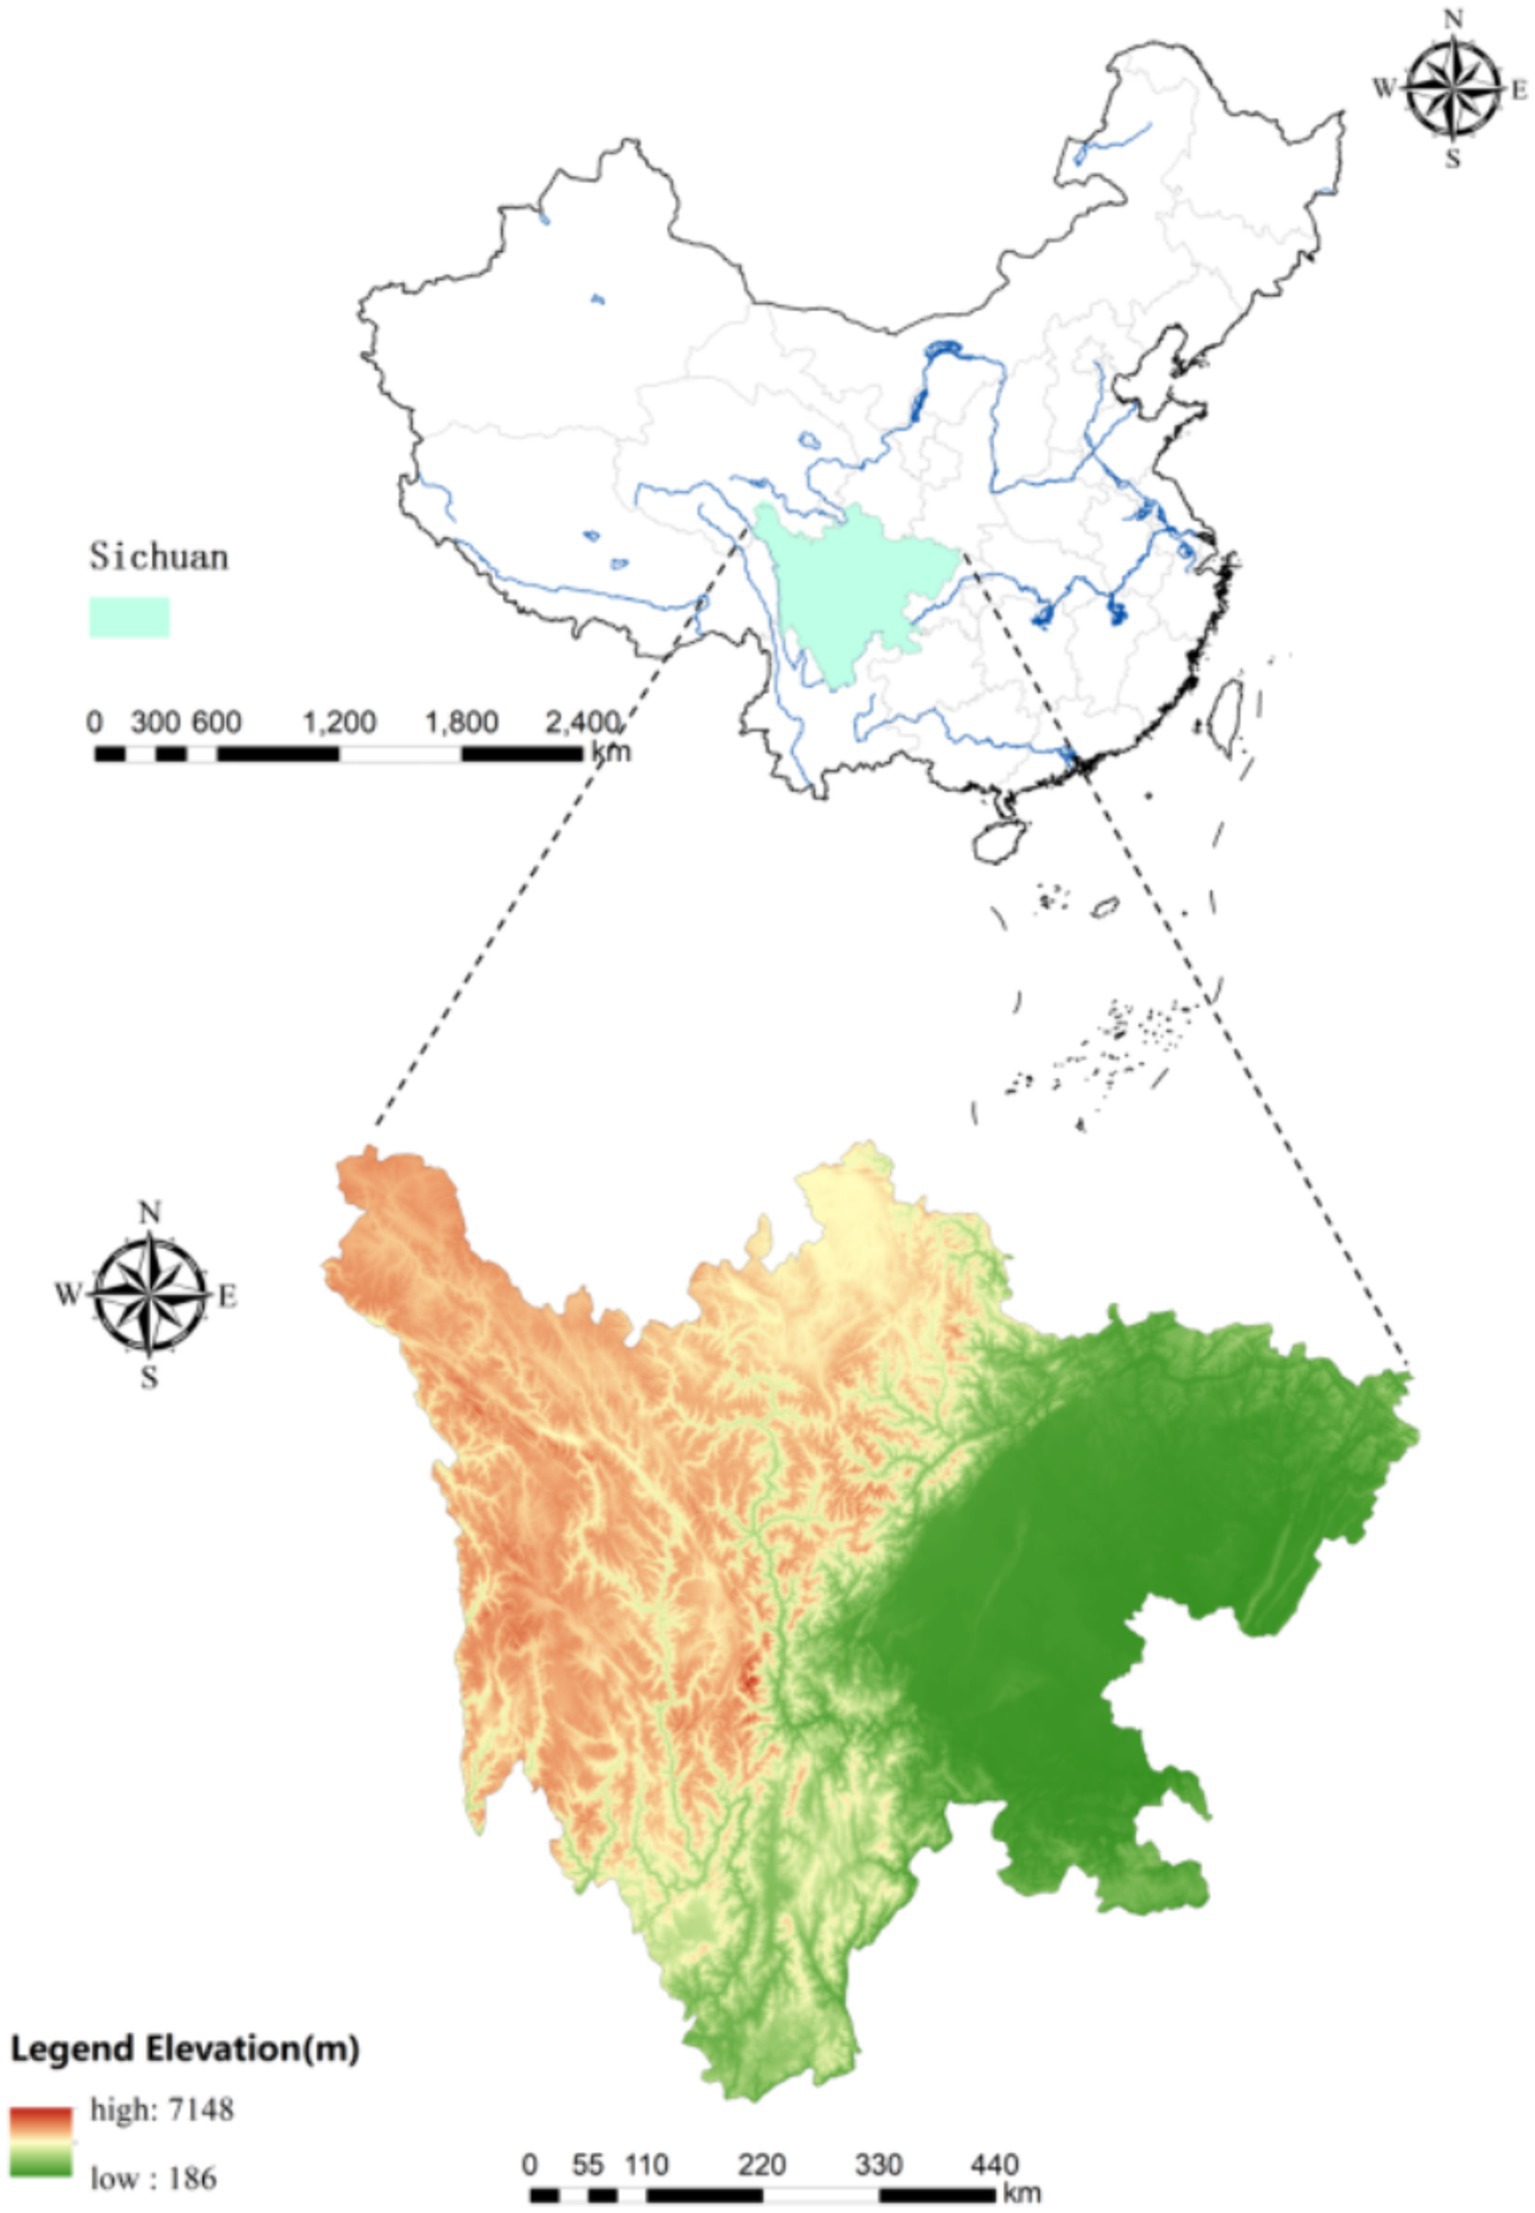
Figure 2. Location of the study area.
2.3 LMDI decomposition based on time-varying parametric C-D production function
Kaya emission constancy equation mathematically links the degree of pollution caused by total energy consumption to energy intensity, per capita income, and population density (Hasan and Chongbo, 2020). On top of the kaya constancy equation, the LMDI decomposition method proposed by Honeywell is straightforward to implement and eliminates the residual effect (Ye et al., 2022). Therefore, this paper integrates the LMDI decomposition with a time-varying parameter C-D production function to modify the constant Equation 5 (Ye et al., 2022; Zhu et al., 2023), decomposing agricultural carbon emissions into three parts: the intensity of agricultural carbon emissions, the level of agricultural economic development, and the agricultural structure:
Where: C denotes the total agricultural carbon emission (kg); , , , , denotes the total agricultural carbon emission (kg), the total output value of the plantation industry (RMB 10,000), the total output value of agriculture, forestry, animal husbandry and fishery (RMB 10,000), and the growth of the total output value of agriculture, forestry, animal husbandry and fishery (RMB 10,000), respectively, in the year t. denotes the intensity of agricultural carbon emission (kg); denotes the factor of agricultural structure; and represents the increase of agricultural unit output value (the inverse of the growth rate of agricultural output value). The above formula can be simplified by making (Equation 6):
The time-varying parametric C-D production function is introduced into the LMDI decomposition method to obtain the agricultural production function (Equations 7, 8):
Where: G denotes the amount of output; A, denote the time-varying technology, capital, and labor input factors, respectively; is the level of technology; is the capital stock; is the labor input; is the stochastic perturbation term obeying a normal distribution with an expected value of 0; are the time-varying parameters of the capital stock and the labor input factors, respectively, and satisfy the following Equations 9, 10:
Where: is the random disturbance term (obeying normal distribution, expectation value is 0).
By combining Equations 7, 8, the impact of agricultural growth on total carbon emissions can be decomposed into the effects of three major factors: labor input, capital stock, and technological progress. This analysis facilitates the LMDI decomposition of agricultural carbon emissions, leveraging the Cobb-Douglas (C-D) production function (Equation 11):
Based on the above equation, the new agricultural carbon emissions can be decomposed into carbon emissions caused by different factors: the intensity of agricultural carbon emissions the structure of agriculture the level of development of the agricultural economy technological progress the capital stock and the input of labor where is the total amount of carbon emissions in the reporting period, and is the total amount of carbon emissions in the base period, and is the difference between the two:
Deformation of Equation 12. Where: denotes the difference between carbon emissions in year t and the base year; denotes the carbon emissions in the base year (2010); and denotes the carbon emissions in year t. The carbon emissions of the six factors can be obtained from Equations 11–14:
Where: , if , then .
It can be seen that agricultural carbon emissions are influenced by six driving factors: agricultural carbon intensity agricultural structural factors agricultural economic development level technology level capital stock and labor input
2.4 Tapio decoupling model based on time-varying parametric C-D production function
The Tapio decoupling elasticity coefficient method is widely employed to assess the separation of economic growth from environmental pressures, notably the escalation of carbon emissions, within specific industries or regions. In agriculture, it means reducing or stabilizing greenhouse gas emissions while maintaining or increasing agricultural outputs. This study integrates the Tapio decoupling model with the Cobb-Douglas (C-D) production function to delve into the dynamics of carbon emissions influenced by technological advancements, capital investment, and labor contributions.
Equations 15–18 are the decoupling indices of agricultural carbon emissions from agricultural growth , capital stock , labor input , technological progress , and respectively:
Where: , respectively, is the base period and the reporting period of agricultural carbon emissions; , respectively, is the base period and the reporting period of agriculture, forestry, animal husbandry, and fisheries value added; , respectively, is the base period and the reporting period of the capital stock; , respectively, is the base period and the reporting period of the labor input.
Referring to Zha et al. (2021), the impact of each factor on the decoupling relationship between agricultural carbon emissions and economic growth is further disaggregated as follows (Equation 19):
Where: represents the contribution to the decoupling elasticity of the carbon intensity of agriculture, the structure of agriculture, the level of economic development of agriculture, the level of technology, the capital stock, and labor inputs, respectively.
2.5 Monte Carlo model construction
The Monte Carlo model, which integrates uncertainty with probability distributions, enables the estimation of total amount’s probability distribution across various factors to forecast future trends of variables. This experiment employs the Monte Carlo model alongside scenario analysis, thereby comprehensively examining the evolutionary trends of carbon emissions under diverse agricultural development structures and economic levels. This approach addresses the limitation of the Monte Carlo model, which traditionally predicts carbon emissions under a singular scenario (Bofeng et al., 2019; Dewen et al., 2024).
Based on Equation 11, it is known that the key drivers affecting carbon emissions are agricultural carbon emission intensity , agricultural structural factors , the increase in agricultural unit output value , technological progress , capital stock , and labor inputs , respectively; therefore, in order to achieve the scenario analysis, the Monte Carlo simulation in this study applies the following Equations 20–27 (Dewen et al., 2024).
a, b, c, d, e, f, and g represent the growth rate of total carbon emissions and carbon emissions from respectively.
3 Results and discussion
3.1 Characterization of agricultural carbon emissions
Figure 3 illustrates a decreasing trend in total agricultural carbon emissions in Sichuan Province from 2010 to 2020. This trend is closely linked to the value of agricultural output, which saw Sichuan’s agricultural carbon emissions decrease from 40.03 million tonnes in 2010 to 34.66 million tonnes in 2020—a 13.4% reduction or an average annual decrease of 1.2%. Concurrently, the agricultural output value in Sichuan increased 2.3-fold, from 205.9 billion Yuan to 470.2 billion Yuan. Industrial development is inevitably accompanied by energy consumption and pollution emissions; generally speaking, an increase in production value’s growth rate tends to bring about a rapid increase in carbon emissions. However, during the sample period, the value of agricultural production and agricultural carbon emissions in Sichuan showed an inverse relationship. This indicates a possible decoupling of carbon emissions from agricultural growth.
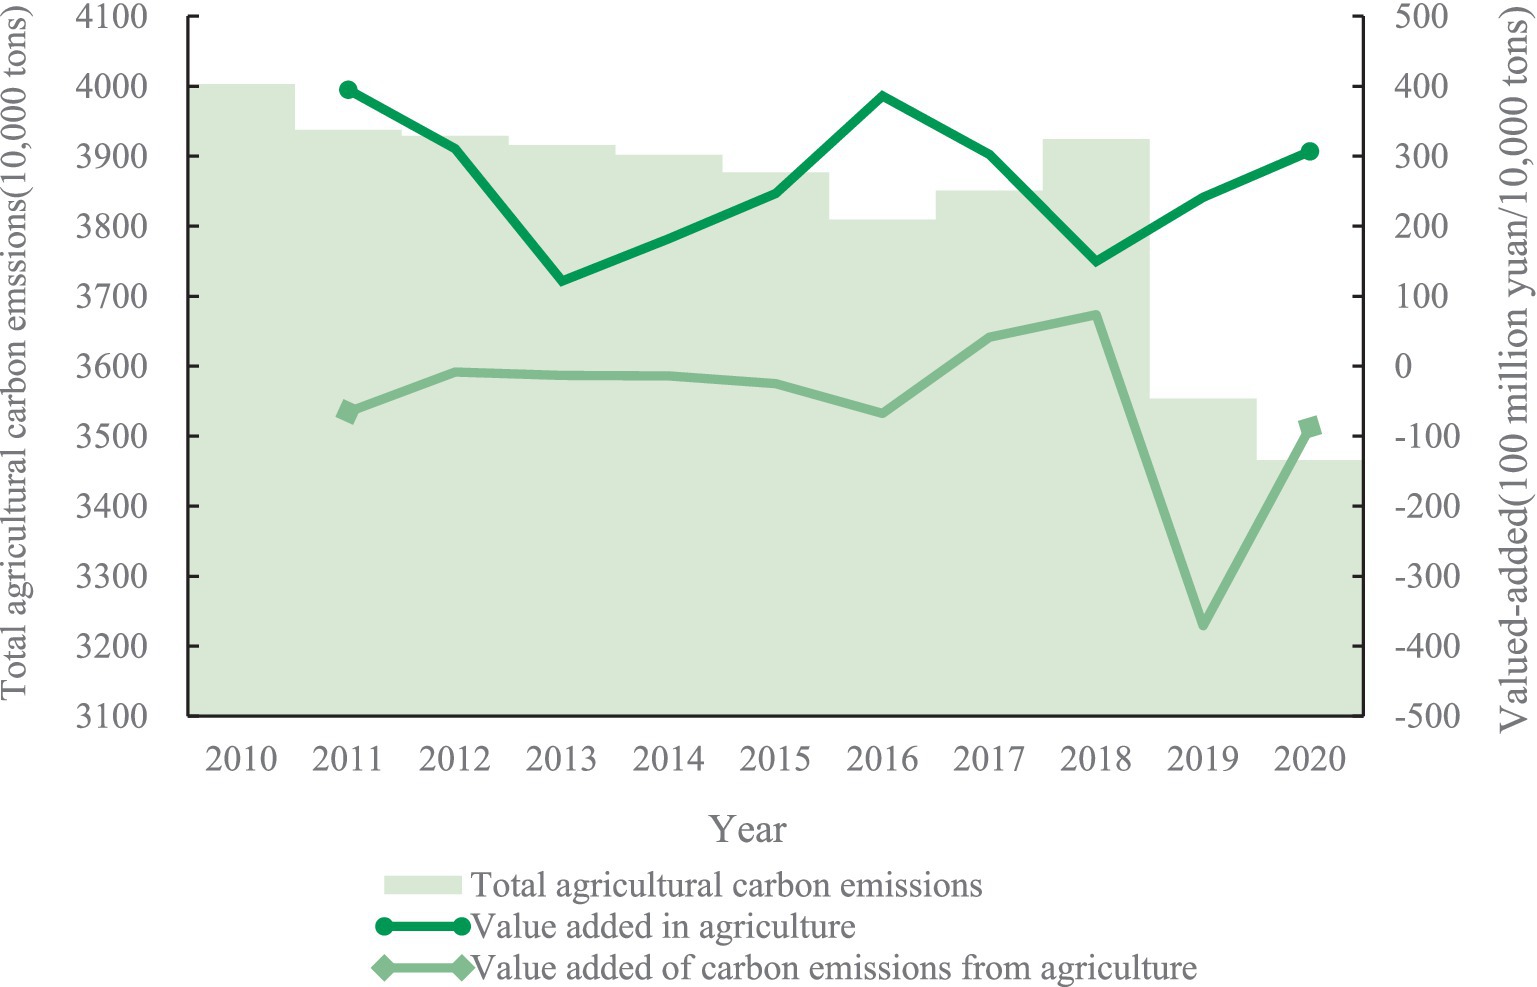
Figure 3. Total agricultural carbon emissions and value added of agricultural production.
Different sources of agricultural carbon emissions in Sichuan Province exhibit significant variations in total emissions and growth rates. According to Table 4 in Supplementary material, the largest contributors to carbon emissions are livestock (60.4%), electricity (24.2%), and fertilizer use (5.7%), with other sources combining for 9.7%. This distribution reflects Sichuan’s status as a major province for traditional livestock and poultry farming, with its pig and related industries positioned at the forefront nationally. The inefficient management and regulation of waste from livestock and poultry significantly contribute to these emissions. Figures 3, 4 indicate Livestock and poultry emissions as the primary source of carbon emissions in the sample period generally showed a downward trend, the growth rate in 2017 and 2018 briefly became positive and then became negative, the total carbon emissions in Sichuan Province in the same year from falling to rising.After 2018, pig farming plummeted due to African swine fever, resulting in the growth rate of livestock emissions turning negative again, with emissions growth approaching −20 percent in 2019. Carbon emissions from rural electricity use are the second largest source of total carbon emissions, with a growth rate of around 4%. The remaining sources of carbon emissions do not have a stable and uniform trend of change.
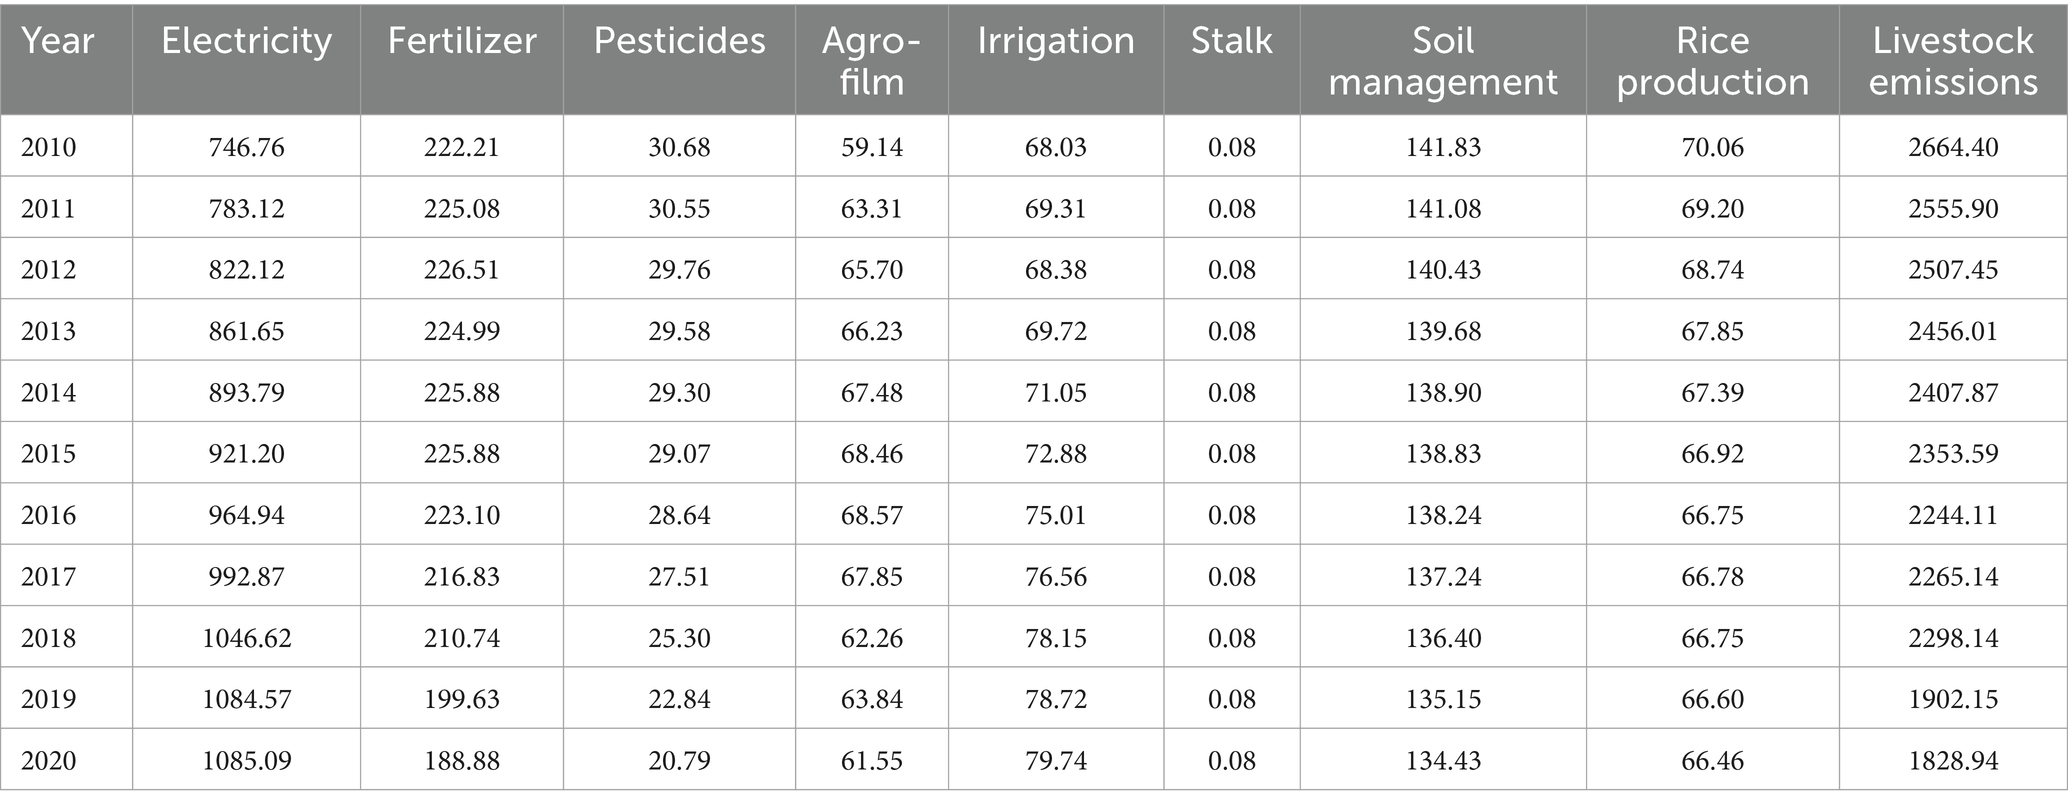
Table 4. Carbon emissions generated by various carbon sources (10,000 tons).
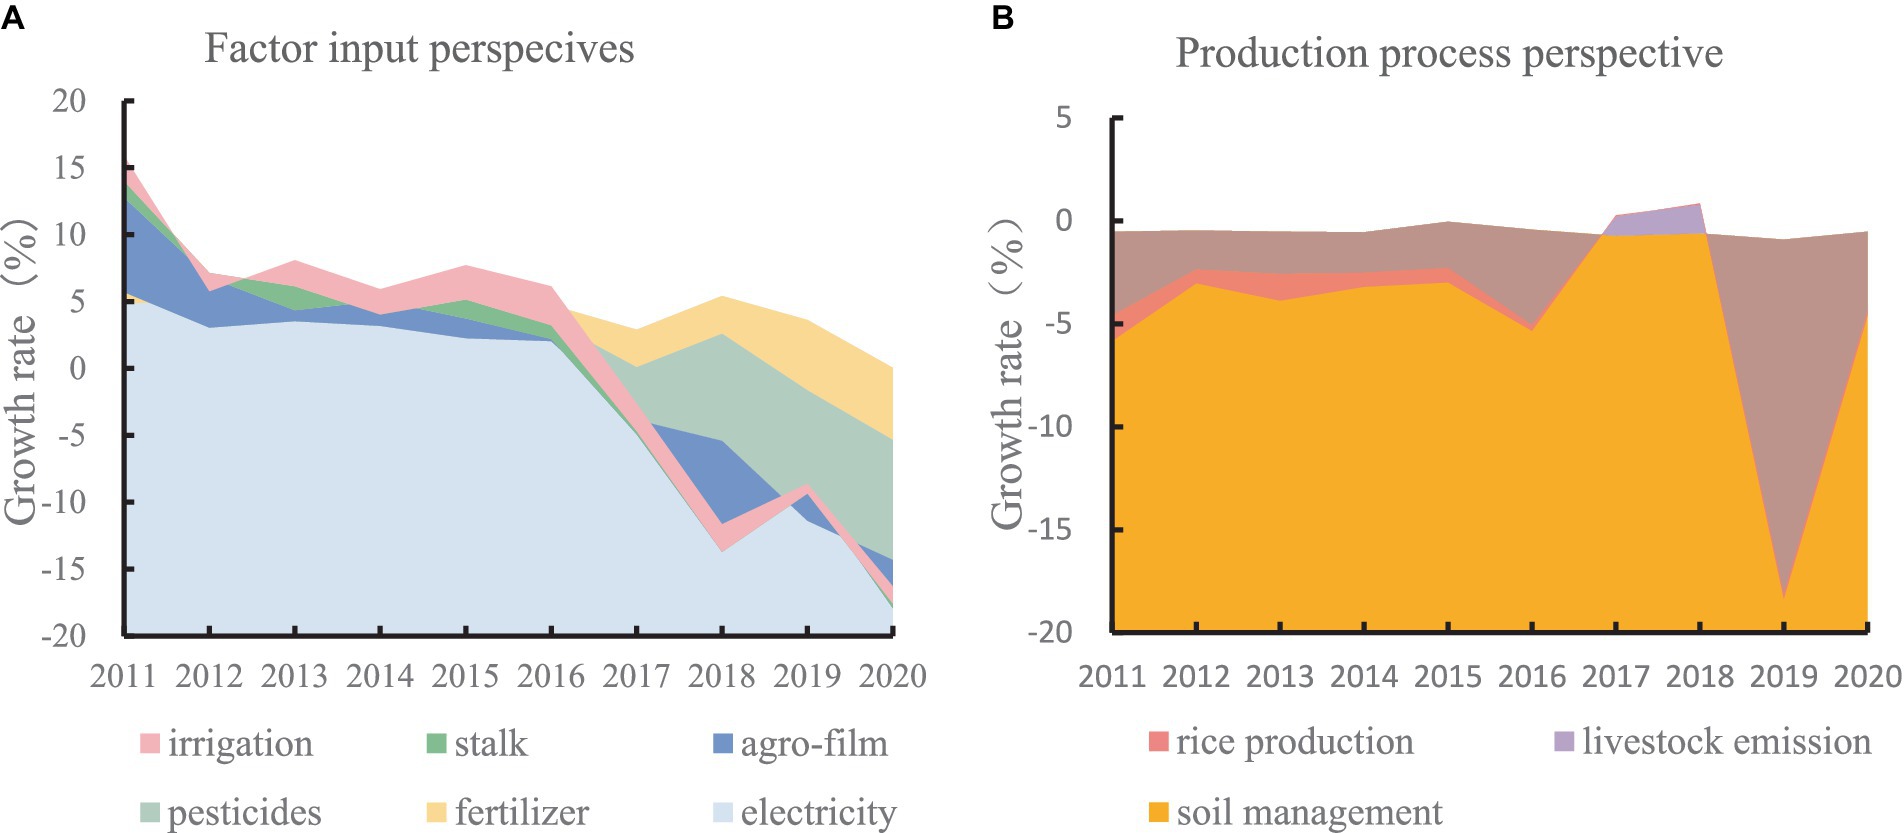
Figure 4. Growth rate of carbon emissions from various carbon sources in agriculture.
Currently, amidst efforts to ensure the supply of key agricultural products and expand livestock numbers, Sichuan faces challenges in reducing emissions and achieving carbon sequestration, given the annual production of approximately 210 million tonnes of livestock and poultry manure (Tengli et al., 2020), which poses a challenge to the achievement of agricultural emission reduction and carbon sequestration. Therefore, it is necessary to rigorously implement the ‘one control, two reductions, and three basics’ strategy within the agricultural and animal husbandry industries. This involves controlling the total volume of water used in farming and its associated pollution, while simultaneously reducing the usage of chemical fertilizers and pesticides in the production process. Efforts should also focus on the resourcing, harmlessness, and comprehensive recycling of livestock and poultry waste.
3.2 Drivers of emission
The LMDI decomposition, utilizing the time-varying parameter Cobb-Douglas (C-D) function, identifies the impact of various factors on the sources of agricultural carbon emissions in Sichuan Province from 2010 to 2020, as illustrated in Figure 5. Factors such as capital stock, energy intensity, and agricultural structure are identified as having a consistent driving influence on reducing emissions and enhancing carbon sequestration in agriculture. The contribution of other factors, however, warrants further investigation.
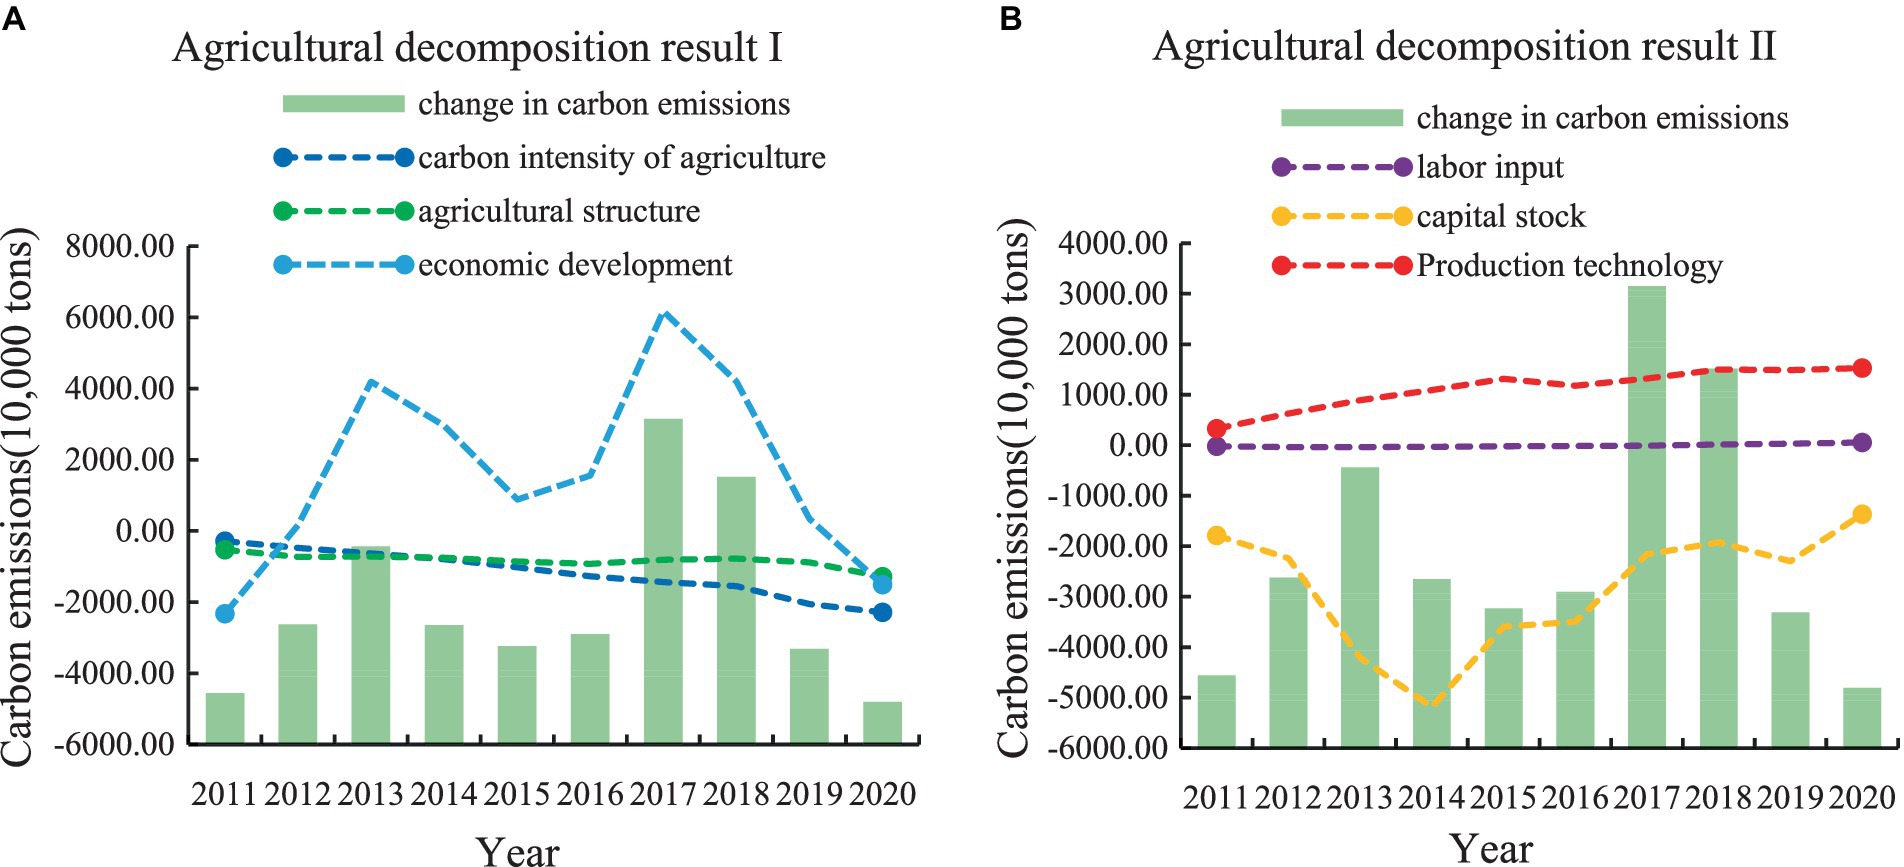
Figure 5. Decomposition results of carbon emission drivers in Sichuan Province.
Capital stock has the greatest positive impact on carbon emission reduction in agriculture, decreasing emissions by approximately 282.57 million tonnes over an 11 years. While Fixed asset investment plays a dual role in carbon emission reduction. On the one hand, investment in water conservancy projects, water-saving technology, and the elimination of high-energy-consuming equipment can promote the green transformation of the industry. Such investments can also lead to a positive spillover of technology, thereby indirectly reducing the carbon emissions per unit of output. On the other hand, fixed asset investment in agricultural infrastructure construction consumes a significant amount of energy in the early stages and increases carbon emissions (Grossman and Krueger, 1991), which hinders the goal of reducing carbon emissions. Therefore, when making fixed asset investments, it is crucial to emphasize the orientation towards green development. At the same time, efforts should be made to balance the increase in carbon emissions caused by engineering construction with the promotion of investment in agricultural infrastructure.
The positive impact of agricultural carbon emission intensity on reducing emissions has been growing annually. This metric, which excludes the effects of agricultural scale variations, offers a more objective measure of carbon emissions per unit of agricultural output in the region. Table 5 reveals that, from 2010 to 2021, Sichuan Province saw an average annual decrease in agricultural carbon emission intensity of 5.9%. This suggests a consistent improvement in resource utilization efficiency in agriculture each year. Notably, in 2019, the intensity of agricultural carbon emissions dropped to its lowest, leading to a reduction of 3.7 million tonnes in carbon emissions compared to the previous year. During the sample period, changes in agricultural structure and labor inputs were relatively stable. The proportionate contributions of the various agricultural subsectors—including agriculture, forestry, animal husbandry, and fisheries—are adjusting gradually in Sichuan Province, with an overall increase in the share of factor inputs. Based on this, facilitating cross-sectoral mobility of production factors and enhancing their utilization efficiency represents a strategic approach to further refine the agricultural structure and capitalize on carbon emission reduction benefits.
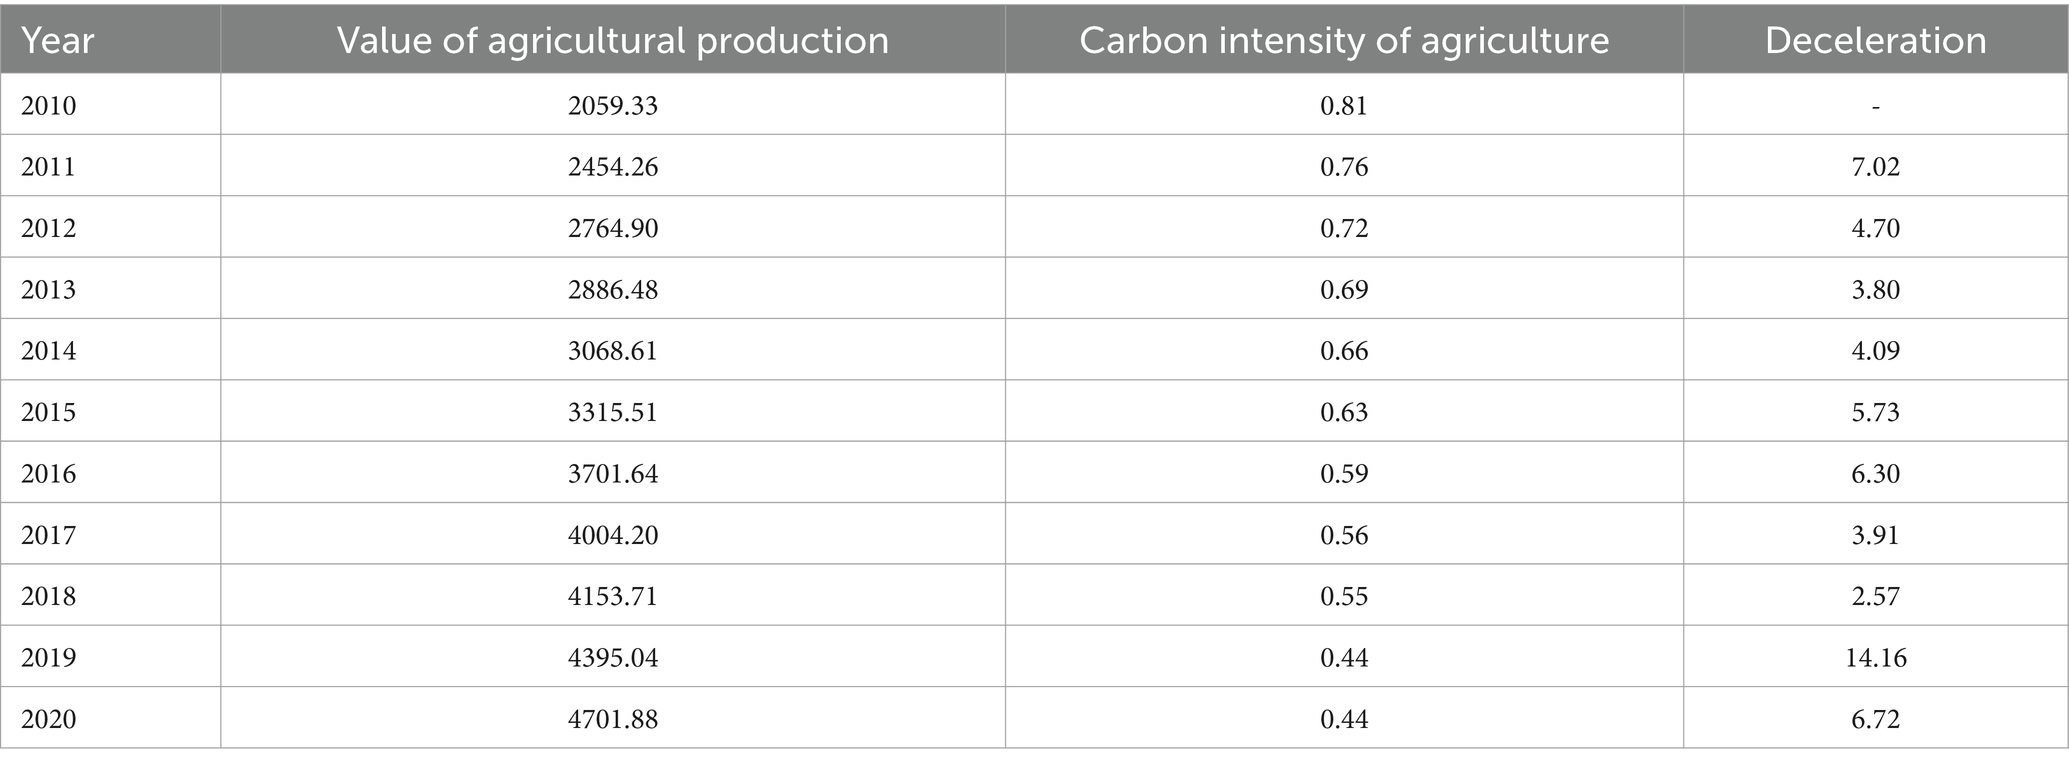
Table 5. Carbon emission intensity and rate of reduction from 2010 to 2020.
The increase in agricultural carbon emissions is primarily attributed to the levels of economic development and technological inputs, which is consistent with the findings of previous studies (Qian et al., 2024). From 2011 to 2021, these factors contributed 59.6% (166.16 million tonnes) and 40.4% (112.71 million tonnes) to the total agricultural carbon emissions, respectively, compared to 2010. Specifically, as China pursues its “peak carbon” goal, the rapid economic expansion plays a crucial role in escalating total carbon emissions. Variations in economic growth strategies significantly impact emission fluctuations, underscoring the need for a development path that harmonizes carbon emission reduction with agricultural economic progress. The impact of technological inputs on increasing emissions is also notable, potentially exacerbated by the rebound effect of technological advancement. The widespread mechanization and modernization of agricultural production have boosted overall production capacity. However, the extensive deployment of large agricultural machinery and the development of modern agricultural parks have led to higher emissions. Moreover, “non-clean” agricultural technologies contribute to greater carbon release compared to “clean” technologies. Consequently, steering agricultural production towards a low-carbon, recyclable direction necessitates active research and development of eco-friendly, green technologies that enhance carbon sequestration. Emphasizing the broad-scale energy efficiency and emission reduction of agricultural machinery, alongside hastening the retirement of outdated equipment, is crucial.
3.3 Decoupling dynamics and reasons
Table 6 shows the results of the degree of decoupling of carbon emissions from the growth of each industry in Sichuan Province in 2010–2020. Collectively, the province experienced oscillation between states of strong decoupling and weak negative decoupling regarding carbon emissions and industrial growth. Periods of strong decoupling were observed in 2011–2012, 2015–2016, and 2019, characterized by a substantial increase in agricultural value added and a minor difference in carbon emissions value added. Essentially, these periods saw enhanced economic growth accompanied by a reduction in carbon emissions. Conversely, the years 2013–2014, 2017–2018, and 2020 were marked by weak negative decoupling, attributed mainly to the deceleration in agricultural value added, which did not curb the rise in carbon emissions in 2017–2018, despite the pronounced carbon reduction impact of technological advancements. Throughout the analysis period, capital stock exhibited a consistent pattern of weak negative decoupling. This trend may be attributed to the provincial focus in recent years on developing high-standard farmland and water-saving initiatives. Specifically, the strategy aimed for the cumulative achievement of 44.3 million mu of high-standard farmland in Sichuan by 2020. The extensive scale of these construction projects contributed to elevated carbon emissions during the period under review.
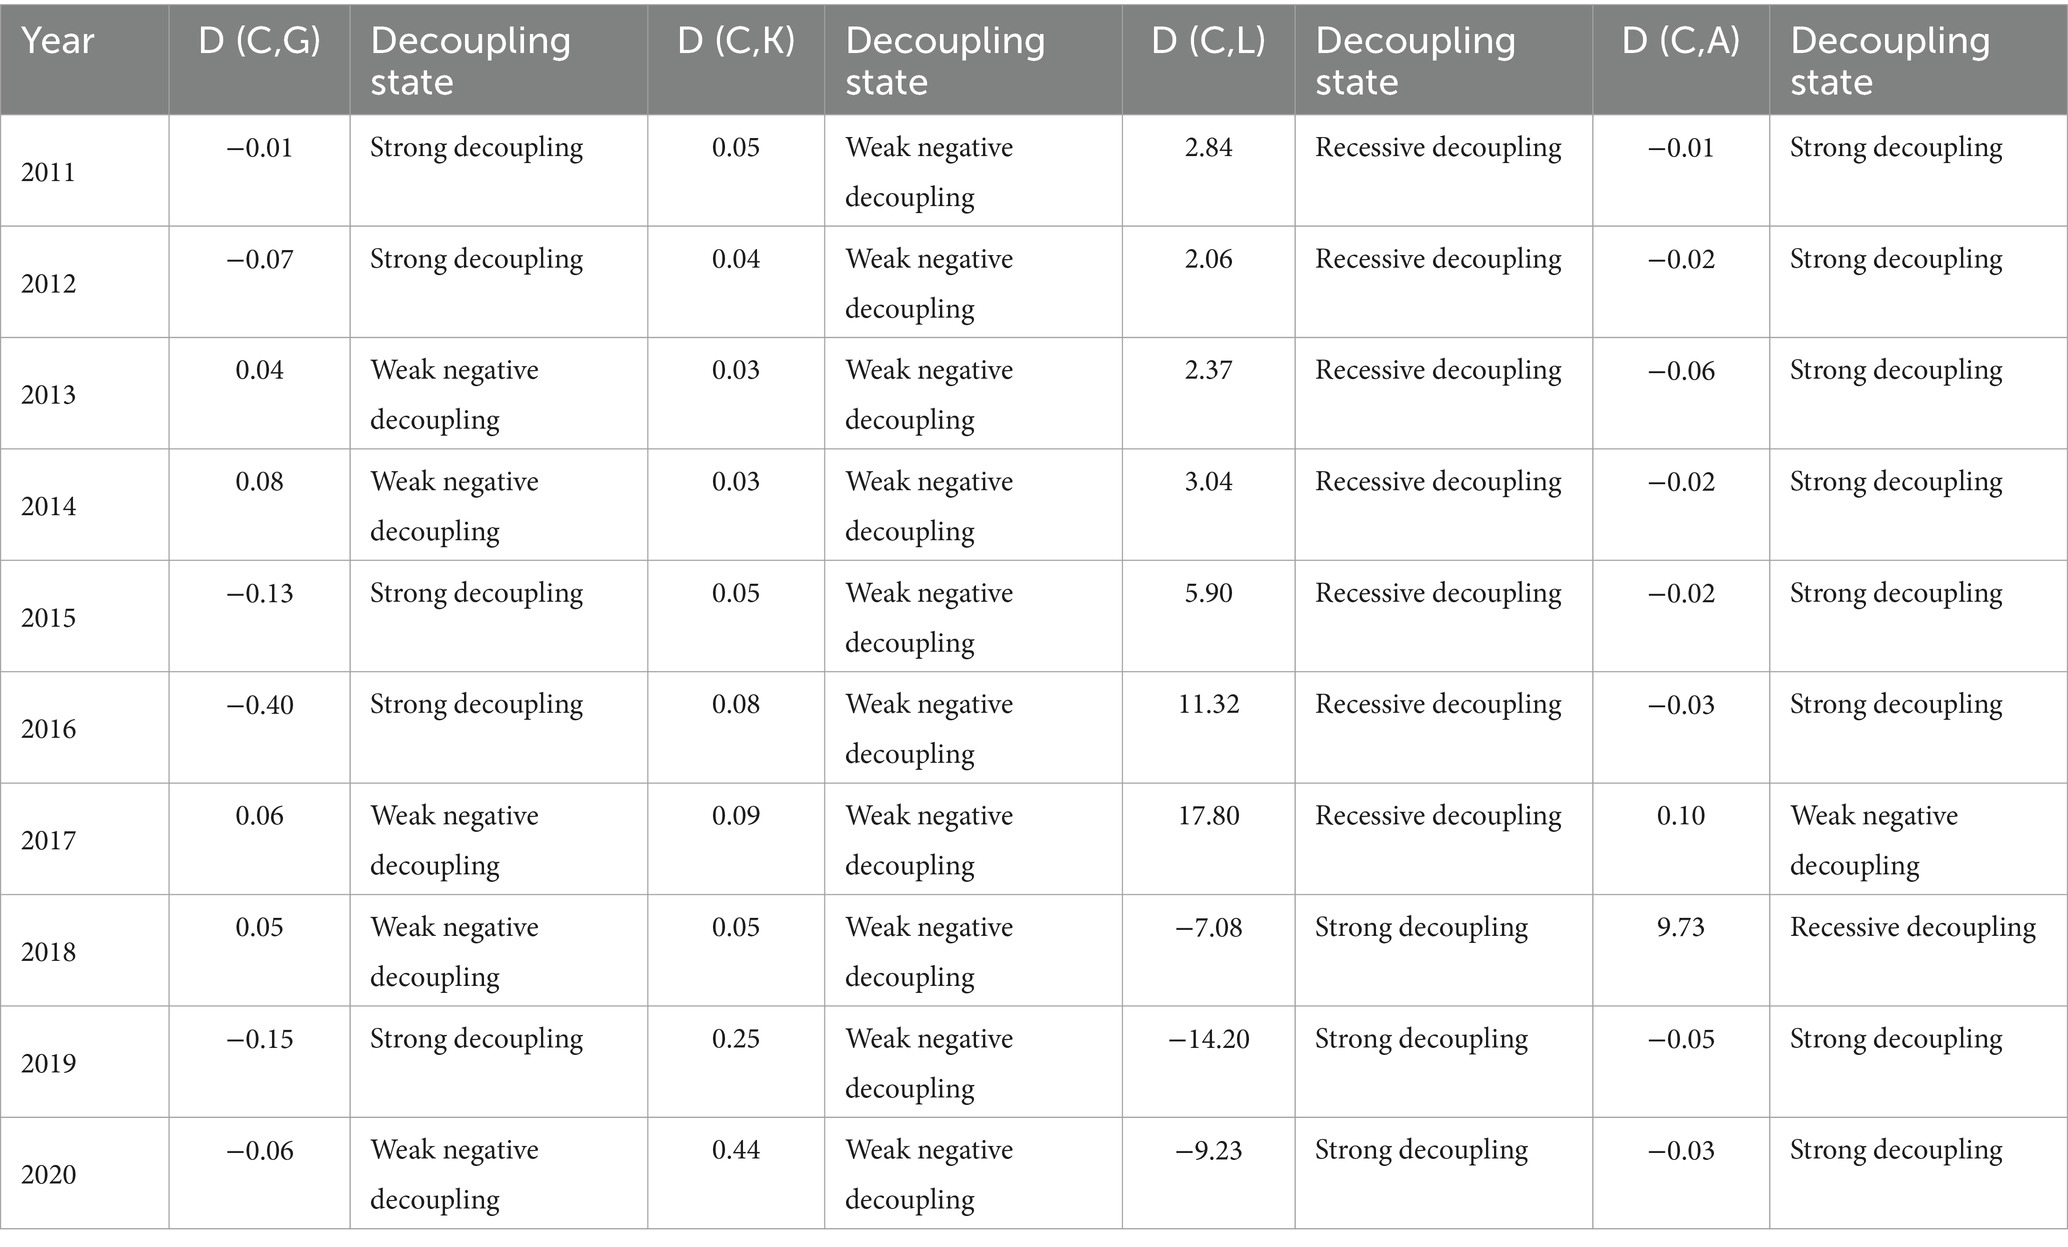
Table 6. Decoupling index values and decoupling dynamics by factors from 2010 to 2020.
Severely curtailing carbon emissions at the cost of impeding economic growth could adversely affect the agricultural sector’s development in Sichuan. Hence, it is imperative to establish a dynamic equilibrium between economic advancement and the pursuit of energy conservation and emission mitigation. As delineated in Table 7, capital stock, carbon intensity, and the structure of agriculture significantly contribute to the decoupling between carbon emissions and the development of the agricultural industry. Recent trends indicate that economic development is shifting from hindering to facilitating decoupling, where capital stock has been the main facilitator of decoupling. An in-depth analysis reveals that, during the observed period, investments in agricultural fixed assets in Sichuan Province remained below baseline levels, thus sustaining a state of weak negative decoupling. However, its comparative effectiveness in curbing carbon emission increases is particularly notable, suggesting considerable potential to enhance the decoupling of economic development from carbon emissions. This potential is likely due to Sichuan’s transition from traditional to modern agriculture, with a yearly increasing proportion of investments directed towards agro-ecological energy-saving initiatives. Such investments mitigate the adverse effects of energy consumption, amplify carbon emission reduction impacts, and facilitate the modernization of agricultural development. Conversely, the technological level has detracted from the decoupling contribution during the same period, primarily because agricultural technological inputs in Sichuan Province have surged compared to the baseline period. The dual nature of technological advancement has precipitated a carbon emission rebound effect (Brännlund et al., 2007). Technological progress has both improved agricultural output and increased carbon emissions by lowering the price of factor inputs. This price reduction causes producers to change their input strategies and expand factor inputs, leading to further carbon emissions. Therefore, in the short term, relying solely on technological progress may not significantly reduce carbon emissions in agriculture.
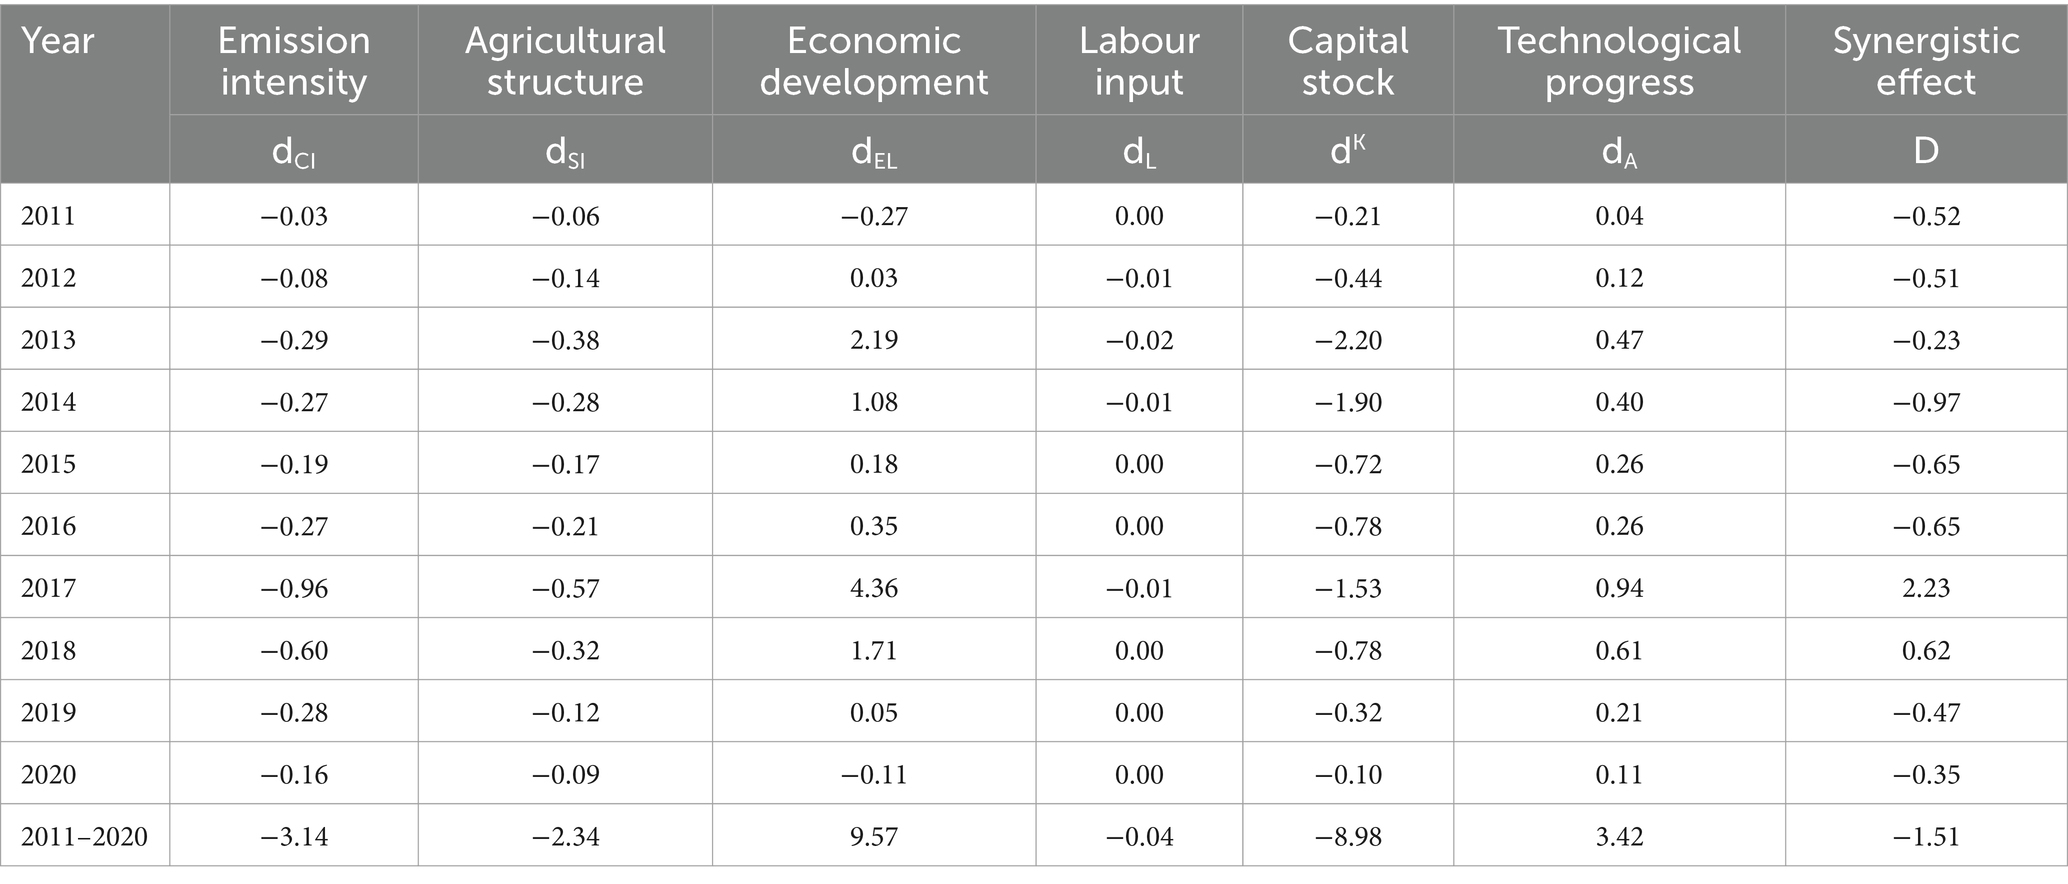
Table 7. Contribution of carbon emission factors to decoupling elasticity from 2010 to 2020.
3.4 Monte Carlo analysis and Monte Carlo result discussion
Based on the current status of agricultural carbon emissions in Sichuan Province from 2010 to 2020, and in light of previous studies (Dewen et al., 2024), we have developed four scenarios to predict greenhouse gas emissions from 2021 to 2035, after categorizing the factors influencing carbon emissions: the Baseline scenario, the Regulatory scenario, the Loose scenario, and the Special scenario. The Baseline scenario reflects the carbon emissions trends observed in Sichuan Province over the recent decade, incorporating variables such as carbon intensity, agricultural structure, economic development, labor input, capital stock, and technology level. The Regulatory scenario, building upon the baseline, aims to reduce agricultural carbon emissions by decreasing the growth rate of the influencing factors by 2%. Conversely, the Loose scenario increases the growth rates of these factors by 2%, differing from the Regulatory approach. The Special scenario, informed by prior analysis, targets the factors most effective in reducing carbon emissions. It proposes a 5% decrease in carbon emissions intensity compared to the baseline scenario, alongside a 2% increase in the growth rates of other influencing factors.
Utilizing predetermined scenarios for the average annual rate of change, we performed 500,000 simulations via Python to generate stochastic data and establish probability distributions, as illustrated in Figure 6. The results indicate that under the Baseline scenario, carbon emissions are expected to reach approximately 20 million tons by 2030, aligning with the historical trend of agricultural carbon emissions in Sichuan Province. In contrast, the Regulatory scenario predicts a more rapid reduction in carbon emissions by 2025, with emissions anticipated to decrease to 10 million tons by 2030. Conversely, the Loose scenario demonstrates an accelerated increase in carbon emissions. In the Special scenario, carbon emissions exhibit a rise followed by a decline, peaking in 2025 at an estimated 45 million tons, and subsequently decreasing more swiftly. When comparing the Special scenario to the Loose Scenario, it becomes evident that reducing carbon emission intensity offers significant potential for carbon emission mitigation. This finding corroborates earlier analyses and underscores the crucial importance of controlling carbon emission intensity to optimize carbon emission reduction efforts.
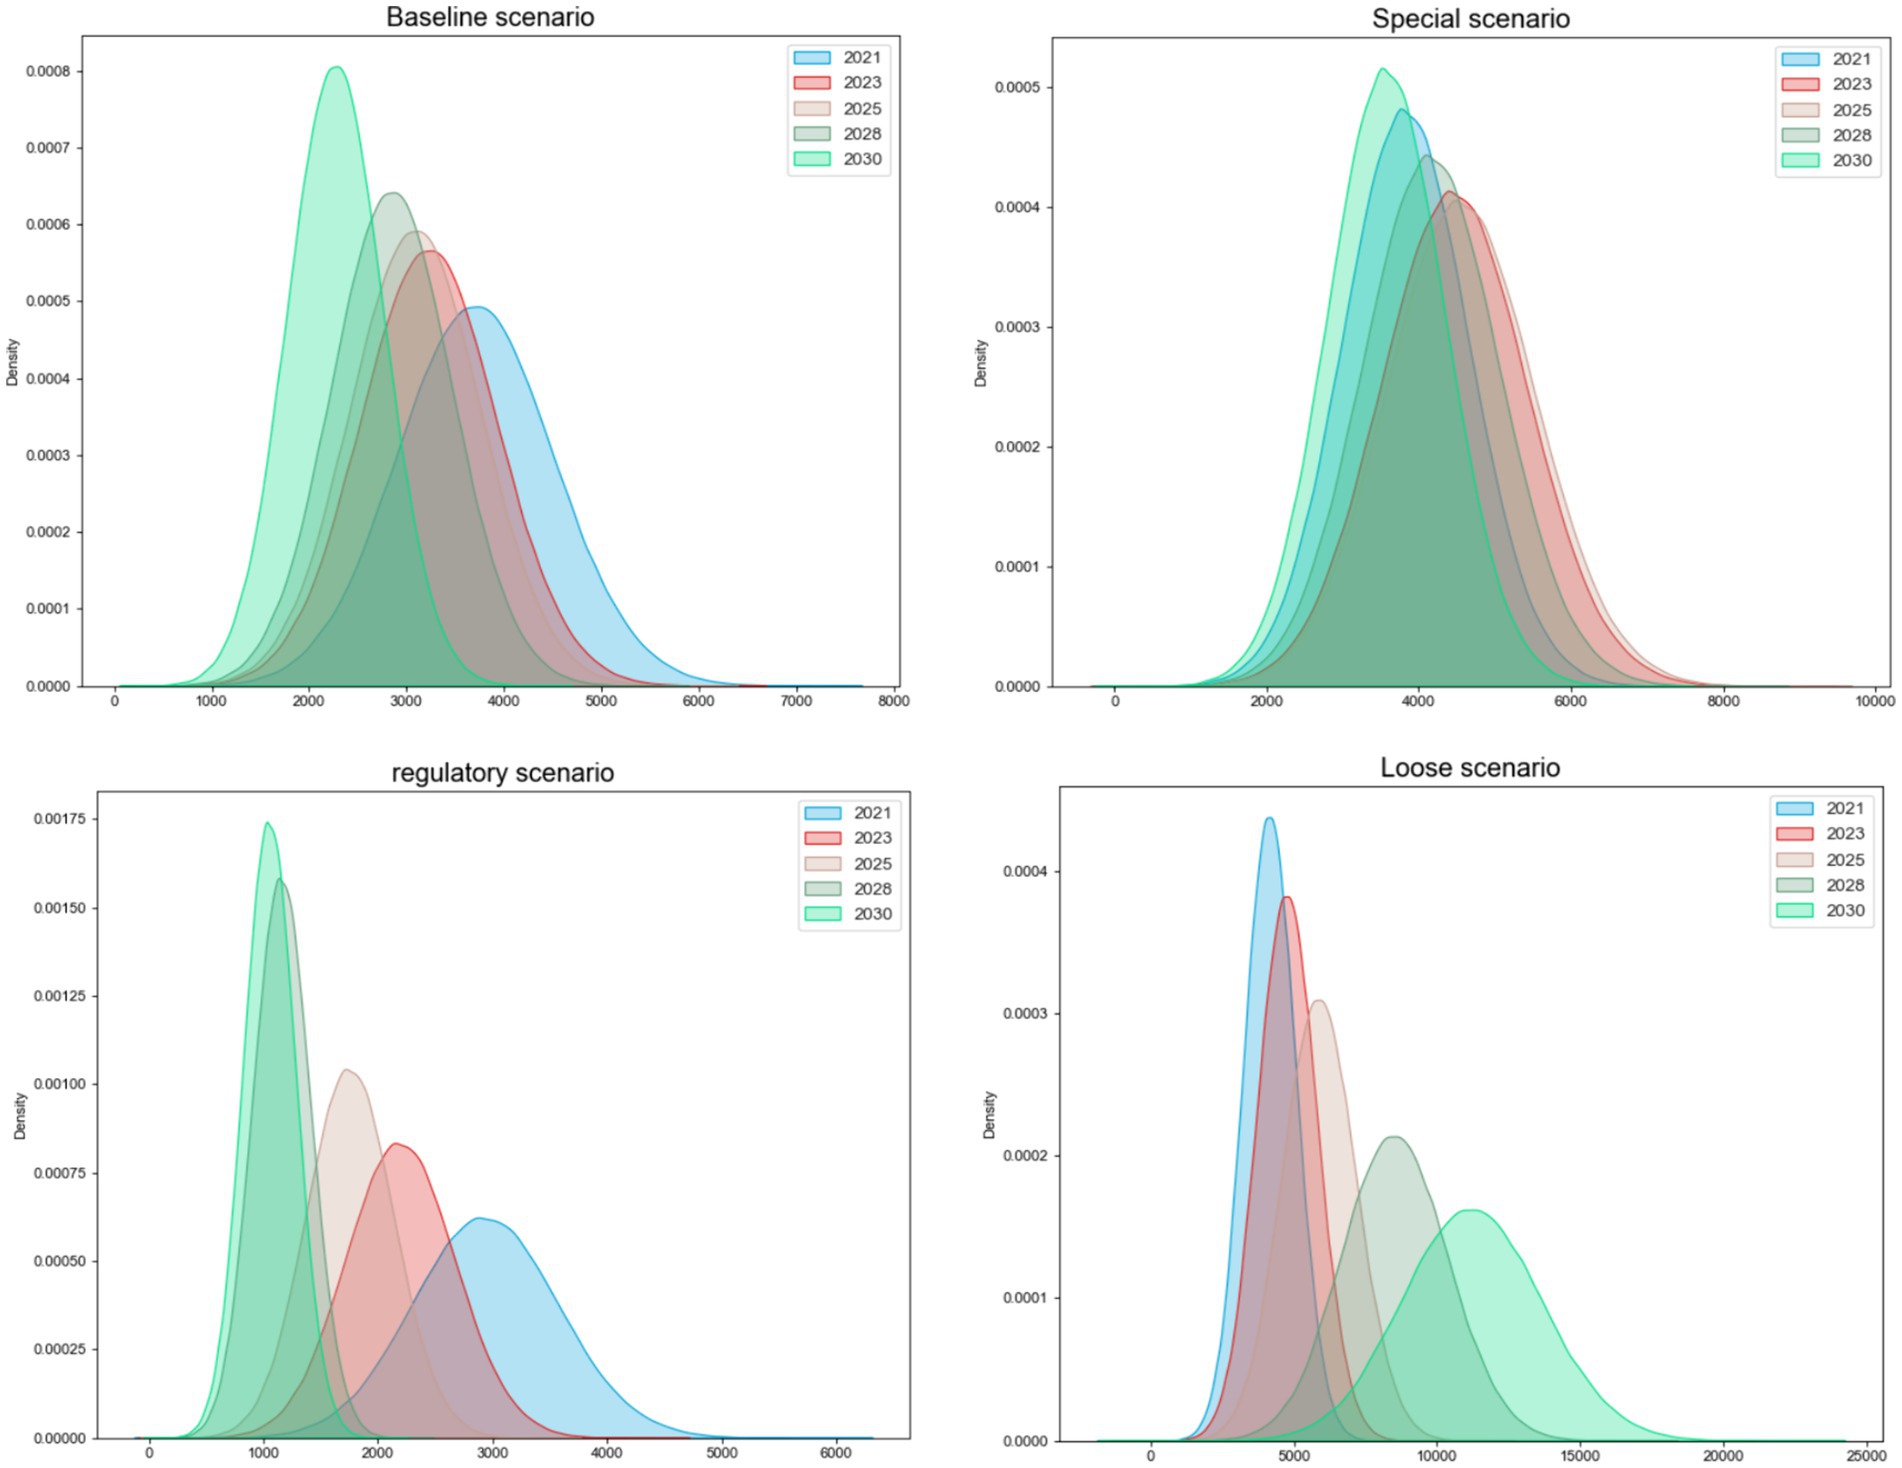
Figure 6. Projected agricultural carbon emission scenarios for Sichuan Province from 2021 to 2030.
4 Conclusions and recommendations
This study analyses the dynamics of agricultural carbon emissions in Sichuan Province, China, from 2010 to 2020 using panel data combined with an improved LMDI model and Tapio decoupling based on a time-varying C-D production function. The conclusions of the study are as follows:
1. The overall total agricultural carbon emissions show a decreasing trend, with livestock and poultry emissions as the main source. In terms of numerical size, agricultural carbon emissions in Sichuan Province decreased from 40.03 million tonnes to 34.66 million tonnes between 2010 and 2020, a reduction of 13.4%, with livestock and poultry emissions (60.4%), electricity use (24.2%) and fertilizers (5.7%) contributing to a larger portion of the carbon emissions; in terms of the overall trend, the total amount of livestock and poultry emissions has declined in recent years, while emissions from electricity use have shown a sustained upward trend, and the remaining carbon emission sources have unstable changes.
2. Disparities are evident in the influence exerted by various sources of agricultural carbon emissions on the mitigation of carbon emissions. From a horizontal perspective, capital stock, emission intensity, and agricultural structure manifest as the most significant suppressors of agricultural carbon emissions, collectively accounting for a reduction of 282.57 million tonnes, 118.07 million tonnes, and 82.69 million tonnes in carbon emissions, respectively. Moreover, the efficacy of carbon emission reduction continues to intensify. Conversely, the level of economic development in agriculture and technological investments predominantly enhance agricultural carbon emissions, though recent measures have begun to curb this trend. Analyzing the situation vertically, there is a general decline in the total volume of carbon emissions, alongside a reduction in carbon emission intensity. Within this context, the share of carbon emission reduction attributable to capital stock has experienced a decrease. In contrast, the contributions of emission intensity and agricultural structure to carbon emission reduction have seen considerable expansion.
3. In Sichuan Province, the relationship between carbon emissions and industrial development manifests in two distinct states: strong decoupling and weak negative decoupling. These states were observed during the periods of 2011–2012, 2015–2016, and 2019 for strong decoupling, and 2013–2014, 2017–2018, and 2020 for weak negative decoupling. The facilitation of decoupling is primarily attributed to elements such as capital stock, the intensity of carbon emissions, and the configuration of the agricultural sector, whereas the advancement of technology primarily hinders this decoupling process. Notably, the reduction of carbon emissions through capital stock emerges as the most potent factor, offering substantial contributions towards the disassociation of economic growth from carbon emissions.
4. The level of agricultural carbon emissions in Sichuan Province was modeled under four different scenario settings. Under the baseline scenario, carbon emissions are expected to continue their decreasing trend over the next decade. In a particular scenario that emphasizes the reduction of carbon intensity, total carbon emissions are projected to peak in 2025, with a continuous downward trend thereafter. Consequently, it is crucial to focus on controlling carbon intensity to prevent its increase and support the ongoing reduction in emissions.
Based on the above conclusions, the following policy recommendations are put forward:
1. Enhanced Management of Livestock and Poultry Manure to Facilitate Green Agricultural Practices: Given that emissions from livestock and poultry represent the predominant contributors to agricultural carbon emissions within Sichuan Province, it is crucial to refine the layout and structure of livestock and poultry farming across the region. This entails advancing towards scaled, standardized, and industrialized farming practices. It is recommended to adapt pollutant treatment infrastructures to local conditions, amplify regulatory oversight, and bolster prevention and control measures. Moreover, there is a call for the enforcement of corporate ecological stewardship responsibilities, alongside incentivizing farmers to adopt green, scalable farming methodologies. Such strategies should incorporate the resourceful utilization of fecal waste and transition towards a model where farmers are motivated to proactively engage in fecal waste management, shifting from a predominantly government-led approach to a farmer-initiated one.
2. To foster sustainable growth in fixed assets and optimize the returns on investment, decisive measures are essential from our government. These measures encompass the enactment of structural reforms within the agricultural sector’s supply side, aimed at facilitating economic and technological spillovers resulting from fixed investments. Furthermore, it is imperative for the government to regulate both the aggregate and the intensity of agricultural carbon emissions, to establish platforms that innovate and nurture entrepreneurship in low-carbon initiatives, and to deter the proliferation of agricultural projects characterized by high energy consumption, significant emissions, and minimal innovation. Conversely, the promotion of investments should be directed towards the construction of large to medium-sized biogas facilities, the standardization of breeding practices, and the advancement of the low-carbon seed industry, among similar ventures. To realize these objectives, it is advisable to strategically allocate existing funds to steer investments toward these prioritized areas.
3. Maximize the Constructive Impact of Technological Advancements and Enhance Resource Utilization Efficiency. The quest for agricultural carbon emission mitigation extends beyond mere reliance on technological advancements. It is crucial to harness the full potential of technological progress in bolstering carbon emission reduction efforts by enhancing resource utilization efficiency, thereby diminishing carbon emission intensity. On one hand, systemic and mechanistic reforms in agriculture should pave the way for innovating management mechanisms dedicated to the development of clean technologies. This involves fostering a competitive and integrated market system for clean technologies and establishing a low-carbon technology innovation consortium encompassing enterprises, academic institutions, and research organizations within the province. Such initiatives aim to stimulate the research and development of economically viable low-carbon technologies applicable to agriculture and forestry, alongside showcasing the centralized application of these technologies. On the other hand, technological advancements should be leveraged to judiciously refine the energy utilization structure and augment energy efficiency. This entails broadening the adoption of clean energy, phasing out outdated and energy-intensive agricultural machinery, and ultimately curtailing carbon emission intensity.
Data availability statement
The original contributions presented in the study are included in the article/Supplementary material, further inquiries can be directed to the corresponding author.
Author contributions
YM: Conceptualization, Data curation, Formal analysis, Funding acquisition, Investigation, Methodology, Project administration, Resources, Software, Supervision, Validation, Visualization, Writing – original draft, Writing – review & editing. YS: Conceptualization, Data curation, Formal analysis, Methodology, Resources, Software, Validation, Visualization, Writing – original draft, Writing – review & editing. WW: Conceptualization, Data curation, Formal analysis, Investigation, Methodology, Software, Validation, Visualization, Writing – original draft, Writing – review & editing. YL: Data curation, Formal analysis, Methodology, Visualization, Writing – review & editing. FW: Resources, Visualization, Writing – review & editing. HW: Conceptualization, Data curation, Formal analysis, Investigation, Methodology, Software, Validation, Visualization, Writing – original draft, Writing – review & editing.
Funding
The author(s) declare that financial support was received for the research, authorship, and/or publication of this article. This work was supported by the National Natural Science Foundation of China (Grant no. 72103152), Soft Science Project of Sichuan Provincial Science and Technology Department:[No.2023JDR0346], Tuojiang River Basin High-quality Development Research Center:[No.TJGZL2024-03] and The Sichuan Provincial Research Center for Philosophy and Social Sciences—Sichuan Rural Development Research Center: [No.CR2115].
Acknowledgments
Thanks to the government staff who helped the researchers and to the farmers who accepted the questionnaire.
Conflict of interest
The authors declare that the research was conducted in the absence of any commercial or financial relationships that could be construed as a potential conflict of interest.
Publisher’s note
All claims expressed in this article are solely those of the authors and do not necessarily represent those of their affiliated organizations, or those of the publisher, the editors and the reviewers. Any product that may be evaluated in this article, or claim that may be made by its manufacturer, is not guaranteed or endorsed by the publisher.
Supplementary material
The Supplementary material for this article can be found online at: https://www.frontiersin.org/articles/10.3389/fsufs.2024.1441118/full#supplementary-material
Footnotes
References
Alhashim, R., Deepa, R., and Anandhi, A. (2021). Environmental impact assessment of agricultural production using LCA: a review. Climate 9:164. doi: 10.3390/cli9110164
Bhuvaneshwari, S., Hettiarachchi, H., and Meegoda, J. N. (2019). Crop residue burning in India: policy challenges and potential solutions. Int. J. Environ. Res. Public Health 16:832. doi: 10.3390/ijerph16050832
Bofeng, C., Cui, C., Zhang, D., Cao, L., Pengcheng, W., Pang, L., et al. (2019). China city-level greenhouse gas emissions inventory in 2015 and uncertainty analysis. Appl. Energy 253:113579. doi: 10.1016/j.apenergy.2019.113579
Botong, X., Xu, Y., Chen, W., Wang, Y., and Qiu, L. (2024). Co-benefits of policies to reduce air pollution and carbon emissions in China. Environ. Impact Assess. Rev. 104:107301. doi: 10.1016/j.eiar.2023.107301
Brännlund, R., Ghalwash, T., and Nordström, J. (2007). Increased energy efficiency and the rebound effect: effects on consumption and emissions. Energy Econ. 29, 1–17. doi: 10.1016/j.eneco.2005.09.003
Carla, S., Bacciu, V., Ascoli, D., Costa-Saura, J. M., Salis, M., Sirca, C., et al. (2024). Estimating annual GHG and particulate matter emissions from rural and forest fires based on an integrated modelling approach. Sci. Total Environ. 907:167960. doi: 10.1016/j.scitotenv.2023.167960
Charlotte, H., Vigne, M., and Aubron, C. (2023). Agricultural greenhouse gas emissionsof an Indian village - Who's to blame: crops or livestock? Sci. Total Environ. 856:159145. doi: 10.1016/j.scitotenv.2022.159145
Chen, X., Chenyang Shuai, Y., and Zhang, Y. W. (2020). Decomposition of energy consumption and its decoupling with economic growth in the global agricultural industry. Environ. Impact Assess. Rev. 81:106364. doi: 10.1016/j.eiar.2019.106364
Cheng-shi, T. I. A. N., and Yu, C. H. E. N. (2021). China's provincial agricultural carbon emissions measurement and low carbonization level evaluation: based on the application of derivative indicators and TOPSIS. J. Nat. Resour. 36, 395–410. doi: 10.31497/zrzyxb.20210210
Dewen, Q., Luo, Y., Chu, Y., Zhang, H., and Zhao, F. (2024). Decomposition of agriculture-related non-CO2 greenhouse gas emissions in Chengdu: 1995-2020. J. Clean. Prod. 434:140125. doi: 10.1016/j.jclepro.2023.140125
Dharmasena, P. B., and Gunasena, C. (2024). Development of a strategic plan to reduce GHG emission in Sri Lankan agriculture. J. Environ. Anal. Toxicol. 14:5. doi: 10.37421/2161-0525.2024.14.746
Duan, H., Zhang, R., Zhao, J., Bian, X., et al. (2011). Carbon footprint analysis of farmland ecosystem in China. J. Soil Water Conserv. 25, 203–208. (In Chinese).
FAO (2023). UNFCCC COP26 [EB/OL]. Available at: http://www.fao.org/ (Accessed December 22, 2023).
Grossman, Gene, and Krueger, Alan, (1991), Environmental impacts of a north American free trade agreement, no 3914, NBER working papers, National Bureau of economic research, Inc, Available at: https://econpapers.repec.org/RePEc:nbr:nberwo:3914 (Accessed February 10, 2024).
Hasan, M. M., and Chongbo, W. (2020). Estimating energy-related CO2 emission growth in Bangladesh: the LMDI decomposition method approach. Energ. Strat. Rev. 32:100565. doi: 10.1016/j.esr.2020.100565
Idroes, G. M., Hardi, I., Noviandy, T. R., Sasmita, N. R., Hilal, I. S., Kusumo, F., et al. (2023). A deep dive into Indonesia’s CO2 emissions: the role of energy consumption, economic growth and natural disasters. Ekonomikalia J. Econ. 1, 69–81. doi: 10.60084/eje.v1i2.115
IPCC (2006). IPCC guidelines for National Greenhouse gas Inventories 4: Agriculture, Forestry and Other Land Use [Online]. Available at: https://www.ipcc-nggip.iges.or.jp/public/2006gl/chinese/index.html (Accessed September 18, 2023).
Jebari, A., Pereyra-Goday, F., Kumar, A., Collins, A. L., Rivero, M. J., and McAuliffe, G. A. (2024). Feasibility of mitigation measures for agricultural greenhouse gas emissions in the UK. A systematic review. Agron. Sustain. Dev. 44:2. doi: 10.1007/s13593-023-00938-0
Jia, L., Wang, M., Yang, S., Zhang, F., Wang, Y., Li, P., et al. (2024). Analysis of agricultural carbon emissions and carbon sinks in the Yellow River Basin based on LMDI and Tapio decoupling models. Sustain. For. 16:468. doi: 10.3390/su16010468
Kamarposhti, M. S., Ng, K.-W., Yadollahi, M., Kamyab, H., Cheng, J., and Khorami, M. (2024). Cultivating a sustainable future in the artificial intelligence era: a comprehensive assessment of greenhouse gas emissions and removals in agriculture. Environ. Res. 250:118528. doi: 10.1016/j.envres.2024.118528
Lauk, C., Magerl, A., le Noë, J., Theurl, M. C., and Gingrich, S. (2024). Analyzing long-term dynamics of agricultural greenhouse gas emissions in Austria, 1830-2018. Sci. Total Environ. 911:168667. doi: 10.1016/j.scitotenv.2023.168667
Liu, Y., and Feng, C. (2021). What drives the decoupling between economic growth and energy-related CO2 emissions in China’s agricultural sector? Environ. Sci. Pollut. Res. 28, 44165–44182. doi: 10.1007/s11356-021-13508-2
Mac Leod, M., Eory, V., Gruère, G., Lankoski, J., et al. (2015). Cost-effectiveness of greenhouse gas mitigation measures for agriculture: A literature review, OECD Food, Agriculture and Fisheries Papers, No. 89. Paris: OECD Publishing.
Maulidar, P., Fitriyani, F., Sasmita, N. R., Hardi, I., and Idroes, G. M. (2024). Exploring Indonesia’s CO2 emissions: the impact of agriculture, economic growth, capital and labor. Grimsa J. Bus. Econ. Stud. 1, 43–55. doi: 10.61975/gjbes.v1i1.22
Ming, J., Li, J., and Zhang, M. (2024). What drives the agricultural carbon emissions for low-carbon transition? Evidence from China. Environ. Impact Assess. Rev. 105:107440. doi: 10.1016/j.eiar.2024.107440
Moon, J., Yun, E., and Lee, J. (2020). Identifying the sustainable industry by input–output analysis combined with CO2 emissions: a time series study from 2005 to 2015 in South Korea. Sustain. For. 12:6043. doi: 10.3390/su12156043
Müller, L. J., Kätelhön, A., Bachmann, M., Zimmermann, A., Sternberg, A., and Bardow, A. (2020). A guideline for life cycle assessment of carbon capture and utilization. Front. Energy Res. 8:15. doi: 10.3389/fenrg.2020.00015
Nemecek, T., Roesch, A., Bystricky, M., Jeanneret, P., Lansche, J., Stüssi, M., et al. (2024). Swiss agricultural life cycle assessment: a method to assess the emissions and environmental impacts of agricultural systems and products. Int. J. Life Cycle Assess. 29, 433–455. doi: 10.1007/s11367-023-02255-w
Ojo, T. O., and Baiyegunhi, L. J. S. (2021). Climate change perception and its impact on net farm income of smallholder rice farmers in South-West, Nigeria. J. Clean. Prod. 310:127373. doi: 10.1016/j.jclepro.2021.127373
Peng, B., Streimikiene, D., Agnusdei, G. P., and Balezentis, T. (2024). Is sustainable energy development ensured in the EU agriculture? Structural shifts and the energy-related greenhouse gas emission intensity. J. Clean. Prod. 445:141325. doi: 10.1016/j.jclepro.2024.141325
Qian, F. K., Wang, X. G., Gu, H. L., Wang, D. P., and Li, P. F. (2024). Spatial-temporal differentiation characteristics and key driving factors of agricultural carbon emissions in the three northeastern provinces of China. Chin. J. Eco-Agric. 32, 30–40. doi: 10.12357/cjea.20230225
Qiang, X., Dai, L., Zhou, Y., Dou, Z., Gao, W., Yuan, X., et al. (2023). Effect of nitrogen application on greenhouse gas emissions and nitrogen uptake by plants in integrated rice-crayfish farming. Sci. Total Environ. 905:167629. doi: 10.1016/j.scitotenv.2023.167629
Raza, M. Y., Wu, R., and Boqiang Lin, A. (2023). Decoupling process of Pakistan's agriculture sector: insights from energy and economic perspectives. Energy 263:125658. doi: 10.1016/j.energy.2022.125658
Seungman, H., Jeong, B., Jang, H., Park, C., and Byungchurl, K. (2023). A framework for determining the life cycle GHG emissions of fossil marine fuels in countries relianton imported energy through maritime transportation: a case study of South Korea. Sci. Total Environ. 897:165366. doi: 10.1016/j.scitotenv.2023.165366
Solow, R. M. (1957). Technical change and the aggregate production function. Rev. Econ. Stat. 39, 312–320. doi: 10.2307/1926047
Sus, O., Williams, M., Bernhofer, C., Béziat, P., Buchmann, N., Ceschia, E., et al. (2010). A linked carbon cycle and crop developmental model: description and evaluation against measurements of carbon fluxes and carbon stocks at several European agricultural sites. Agric. Ecosyst. Environ. 139, 402–418. doi: 10.1016/j.agee.2010.06.012
Tengli, Z., Li, Y., and Daming, W. (2020). Characteristic distribution of livestock manure and warning analysis of environmental carrying capacity based on the consumption of cultivated land in China. Chin. J. Eco-Agric. 28, 745–755. doi: 10.13930/j.cnki.cjea.190853
Ye, S., Zhong, L., Cuicui, D., Di, W., et al. (2022). Analysis of low-carbonization drivers and decoupling paths in the industrial sector —— take Anhui Province as an example. Resour. Environ. Yangtze River Basin 31, 2597–2607. Available at: https://link.cnki.net/urlid/42.1320.X.20220822.1649.002
Yuan, R., Xu, C., and Kong, F. (2023). Decoupling agriculture pollution and carbon reduction fromeconomic growth in the Yangtze River Delta, China. PLoS One 18:e0280268. doi: 10.1371/journal.pone.0280268
Yulin, Y., Ryu, Y., Li, B., Dechant, B., Zaheer, S. A., and Kang, M. (2024). A multi-objective optimization approach to simultaneously halve water consumption, CH4, and N2O emissions while maintaining rice yield. Agric. For. Meteorol. 344:109785. doi: 10.1016/j.agrformet.2023.109785
Yun, T. I. A. N., Junbiao, Z. H. A. N. G., and Bo, L. I. (2012). Agricultural carbon emissions in China: measurement, spatial and temporal comparison, and decoupling effects. Resour. Sci. 34, 2097–2105. Available at: https://kns.cnki.net/kcms2/article/abstract?v=ZODoBDhYdpdb-4TOgrtS85lHLLePaIJEnNUVsIi_Um1nDlxY6_RbCcWwNN3FL1whhmrXWRoMoQ2H3pyz8W5m86Vbzzy0t1geXjsRfFZuT4CRgzk9XgIPSDFjv6daVg-cqHR7nX1KviC2F3JoRIFJzjIvhJkqg5RL-6W3c22gFp_dvDPsnLJtgrCjd4jPpZ_s&uniplatform=NZKPT&language=CHS
Zha, J., Dai, J., Ma, S., Chen, Y., and Wang, X. (2021). How to decouple tourism growth from carbon emissions? A case study of Chengdu, China. Tour. Manag. Perspect. 39:100849. doi: 10.1016/j.tmp.2021.100849
Keywords: agricultural carbon emissions, logarithmic mean divisia index model, Tapio decoupling model, scenario analysis, carbon peak and carbon neutrality
Citation: Meng Y, Shen Y, Wang W, Liu Y, Wang F and Wang H (2024) Who affects carbon emissions? Drivers and decoupling effects of agricultural carbon emissions—evidence from Sichuan, China. Front. Sustain. Food Syst. 8:1441118. doi: 10.3389/fsufs.2024.1441118
Edited by:
Athula Naranpanawa, Griffith University, AustraliaCopyright © 2024 Meng, Shen, Wang, Liu, Wang and Wang. This is an open-access article distributed under the terms of the Creative Commons Attribution License (CC BY). The use, distribution or reproduction in other forums is permitted, provided the original author(s) and the copyright owner(s) are credited and that the original publication in this journal is cited, in accordance with accepted academic practice. No use, distribution or reproduction is permitted which does not comply with these terms.
*Correspondence: Huan Wang, d2FuZ2h1YW5Ac2ljYXUuZWR1LmNu