- 1School of Surveying and Land Information Engineering, Henan Polytechnic University, Jiaozuo, China
- 2Key Laboratory of Mine Spatio-Temporal Information and Ecological Restoration, Henan Polytechnic University Ministry of Natural Resources, Jiaozuo, China
Accurate instance segmentation of individual crops is crucial for field management and crop monitoring in smart agriculture. To address the limitations of traditional remote sensing methods in individual crop analysis, this study proposes a novel instance segmentation approach combining UAVs with the YOLOv8-Seg model. The YOLOv8-Seg model supports independent segmentation masks and detection at different scales, utilizing Path Aggregation Feature Pyramid Networks (PAFPN) for multi-scale feature integration and optimizing sample matching through the Task-Aligned Assigner. We collected multispectral data of Chinese cabbage using UAVs and constructed a high-quality dataset via semi-automatic annotation with the Segment Anything Model (SAM). Using mAP as the evaluation metric, we compared YOLO series algorithms with other mainstream instance segmentation methods and analyzed model performance under different spectral band combinations and spatial resolutions. The results show that YOLOv8-Seg achieved 86.3% mAP under the RGB band and maintained high segmentation accuracy at lower spatial resolutions (1.33 ~ 1.14 cm/pixel), successfully extracting key metrics such as cabbage count and average leaf area. These findings highlight the potential of integrating UAV technology with advanced segmentation models for individual crop monitoring, supporting precision agriculture applications.
1 Introduction
With continuous advancements in information and digital technologies, remote sensing has become a key tool for data acquisition in precision agriculture (Liu et al., 2021). Traditional manual crop monitoring methods provide high accuracy and detailed information about individual crops. However, these methods are labor-intensive, time-consuming, and prone to human error, making them unsuitable for monitoring large areas efficiently (Kimmelshue et al., 2022). Satellite remote sensing enables periodic monitoring of large agricultural areas (Sara Tokhi Arab et al., 2021), offering valuable data for calculating planting areas, identifying crop species, and assessing crop growth (Liu et al., 2021). However, its relatively low spatial resolution limits its ability to accurately monitor individual crops. In recent years, the development of unmanned aerial vehicle (UAV) technology has facilitated the collection of high-resolution and high-frequency spectral data, providing an ideal solution for large-scale monitoring of individual crop growth. The introduction of multispectral sensors offers agricultural professionals a new way to gather vegetation information, delivering essential technical support for precision agriculture (Schoofs et al., 2020).
UAVs equipped with multispectral imaging devices can efficiently capture crop spectral information across different wavelengths, providing valuable references for analyzing physiological parameters such as crop density and chlorophyll content (Sylvain Jay et al., 2017). In recent years, multispectral images obtained by UAVs have been used to estimate the biomass of corn in the Huailai region of China. The results demonstrate that UAV-based multispectral imagery significantly improves the accuracy of biomass predictions (Li et al., 2016). Similarly, UAV imagery has been employed at the Campus Klein-Altendorf agricultural research station (50°37′N, 6°59′E), affiliated with the Faculty of Agriculture at the University of Bonn, to accurately calculate the plant density of barley and wheat. By establishing a linear relationship model with manual field counts, the researchers not only confirmed the accuracy of these estimates but also provided an efficient approach to crop monitoring (Wilke et al., 2021). This technological advancement contributes to the optimization of planting management and offers essential data support for crop breeding research. Wang et al. further utilized high-resolution UAV imagery to extract spectral, textural, and structural information and developed estimation models using algorithms such as Decision Tree Regression (DTR), Random Forest Regression (RFR), and Extreme Gradient Boosting (XGBoost) (Wang R. et al., 2024). Their results demonstrated that combining spectral, textural, and structural information effectively improves estimation accuracy, with XGBoost achieving the best overall performance. This study highlights that leveraging the spatial information from UAV multispectral imagery can significantly enhance the accuracy of monitoring crop physiological parameters, offering a feasible and reliable method for estimating chlorophyll content in walnut leaves. However, the processing of UAV multispectral imagery often relies on complex algorithms and high-resolution data, which may limit its scalability. Nevertheless, with ongoing advancements in computer vision algorithms, it has become possible to extract high-precision crop morphology from smaller datasets and even from lower-resolution RGB bands.
Deep learning has become increasingly important in remote sensing image processing, particularly for crop yield prediction, growth monitoring, and trait analysis (Maimaitijiang et al., 2020; Santana et al., 2021). With its end-to-end feature extraction capability, deep learning can automatically integrate relevant data, making it a powerful tool for addressing the complexities of agricultural monitoring (Liu M. et al., 2024; Xiao et al., 2024). In the field of computer vision, deep learning-based instance segmentation has achieved significant advancements. It enables the identification and segmentation of individual objects within an image, providing more detailed and actionable insights compared to semantic segmentation (Julien et al., 2020; Lu et al., 2023). These algorithms play a key role in agricultural applications, where precise monitoring of individual plants is essential for optimizing crop management and improving decision-making. Among these models, Mask R-CNN has been widely adopted for object detection and instance segmentation. By incorporating a Region Proposal Network (RPN), it enables simultaneous detection and segmentation, handling multiple instances even in complex scenarios with overlapping objects (Thenmozhi and Reddy, 2023; Yangyang et al., 2023). For example, Gao et al. applied a fine-tuned Mask R-CNN to monitor corn seedlings, achieving 97.78% accuracy in emergence rate prediction across different varieties and developmental stages (Xiang et al., 2023). PointRend further improves segmentation precision by introducing finer boundary processing, particularly in high-resolution edge areas, to avoid the coarse boundary handling typical of traditional methods (Fen et al., 2023; Jidong et al., 2023). Zhang et al. integrated PointRend into the Mask R-CNN framework, using PAFPN as the backbone, to extract canopy features of apple trees, achieving 8.96 and 8.37% improvements in AP_seg and AP_box scores, respectively (Zhang et al., 2022). The YOLO series models have also gained prominence in agricultural applications due to their speed and efficiency in processing large numbers of instances (Li et al., 2023). Su et al. enhanced YOLOv5 with BiFPN and SE modules, significantly improving the detection accuracy of kidney bean brown spot disease, with mAP increasing by 25.6% (Su et al., 2023). Similarly, Guan et al. integrated deformable convolution and dual-layer routing attention mechanisms into YOLOv8, achieving a 12% improvement in mAP for corn canopy organ detection, demonstrating the potential of these models in real-world agricultural environments (Guan et al., 2024). These advancements underscore the growing potential of deep learning for large-scale agricultural monitoring. However, the application of these methods to more complex crops, such as Chinese cabbage, requires further exploration and optimization, as addressed in this study.
Currently, despite significant progress in crop instance segmentation using drone-based multispectral technology, several challenges and limitations remain. Most existing methods rely on image processing algorithms and machine learning models to detect crop features, but there is a lack of dedicated instance segmentation datasets specifically designed for crops using drone multispectral imagery (Arun et al., 2023). While segmentation algorithms have shown maturity in studies on crops like corn and wheat, they still struggle with Chinese cabbage, which exhibits diverse morphologies and significant individual variability (Herrera et al., 2024). The morphological diversity and individual differences of Chinese cabbage increase the complexity of segmentation tasks, requiring more sophisticated models and larger training datasets to accurately identify and segment Chinese cabbage plants of varying shapes and sizes. Additionally, the overlapping and contact between Chinese cabbage leaves make it challenging for algorithms to accurately delineate leaf boundaries, which is crucial for the study of fine-grained crop features (Huang et al., 2024). Despite numerous studies on crops like corn and wheat (Chivasa et al., 2021; Sun et al., 2022), research on Chinese cabbage instance segmentation remains limited. The absence of dedicated studies and datasets for Chinese cabbage highlights the need for further research. Therefore, this study aims to fill this gap by developing a robust segmentation framework tailored for Chinese cabbage using UAV multispectral imagery, contributing to improved crop monitoring and management.
Addressing the limitations of current crop monitoring techniques, this study leverages deep learning methodologies and unmanned aerial vehicle (UAV) multispectral imagery to conduct high-fidelity instance segmentation of Chinese cabbage. Existing methods often struggle with accurately capturing detailed instance-level data in complex agricultural environments, limiting their applicability in precision agriculture. By combining the advanced feature extraction capabilities of deep learning with rich, high-dimensional multispectral data, this study aims to enhance the precision and efficiency of Chinese cabbage monitoring. The study’s pivotal contributions are outlined as follows:
1. Construction of the UAV-based multispectral dataset: We used UAV to collect multispectral images containing 5 spectral bands, segmtioned these images using SAM models, combined with manual correction, and finally created a comprehensive dataset specifically for the segmentation of Chinese cabbage instances.
2. Comparative analysis of segmentation algorithms: We evaluated various instance segmentation algorithms tailored for Chinese cabbage, analyzing their performance and the influence of different spectral band combinations.
3. Impact of model variants and spatial resolutions: We investigated how different model sizes and image spatial resolutions affect segmentation accuracy for Chinese cabbage.
4. Application of YOLOv8-Seg for growth monitoring: We applied YOLOv8-Seg to extract key growth metrics, including the number of plants and average leaf area, to assess the growth conditions of Chinese cabbage in the study area.
The remainder of this manuscript is organized as follows: Section 2 introduces the materials and methods used in this study, including the study area, data acquisition process, and the detailed procedures for dataset construction. Additionally, it describes the instance segmentation models applied in the study, including their components and supporting formulas. Section 3 presents the experimental results and analysis, beginning with the evaluation metrics used for the models, followed by a performance comparison of instance segmentation across different models and spectral band combinations. It also provides an in-depth analysis of the segmentation results and the growth conditions of Chinese cabbage based on the visual outputs. Section 4 offers a detailed discussion of the findings, highlighting the advantages of the proposed approach and the limitations of other methods through the comparison of model performance at different scales and spatial resolutions. Finally, Section 5 summarizes the main results of the study, provides a more detailed comparison of each approach, and outlines future research directions.
2 Materials and methods
2.1 Study area overview and data acquisition
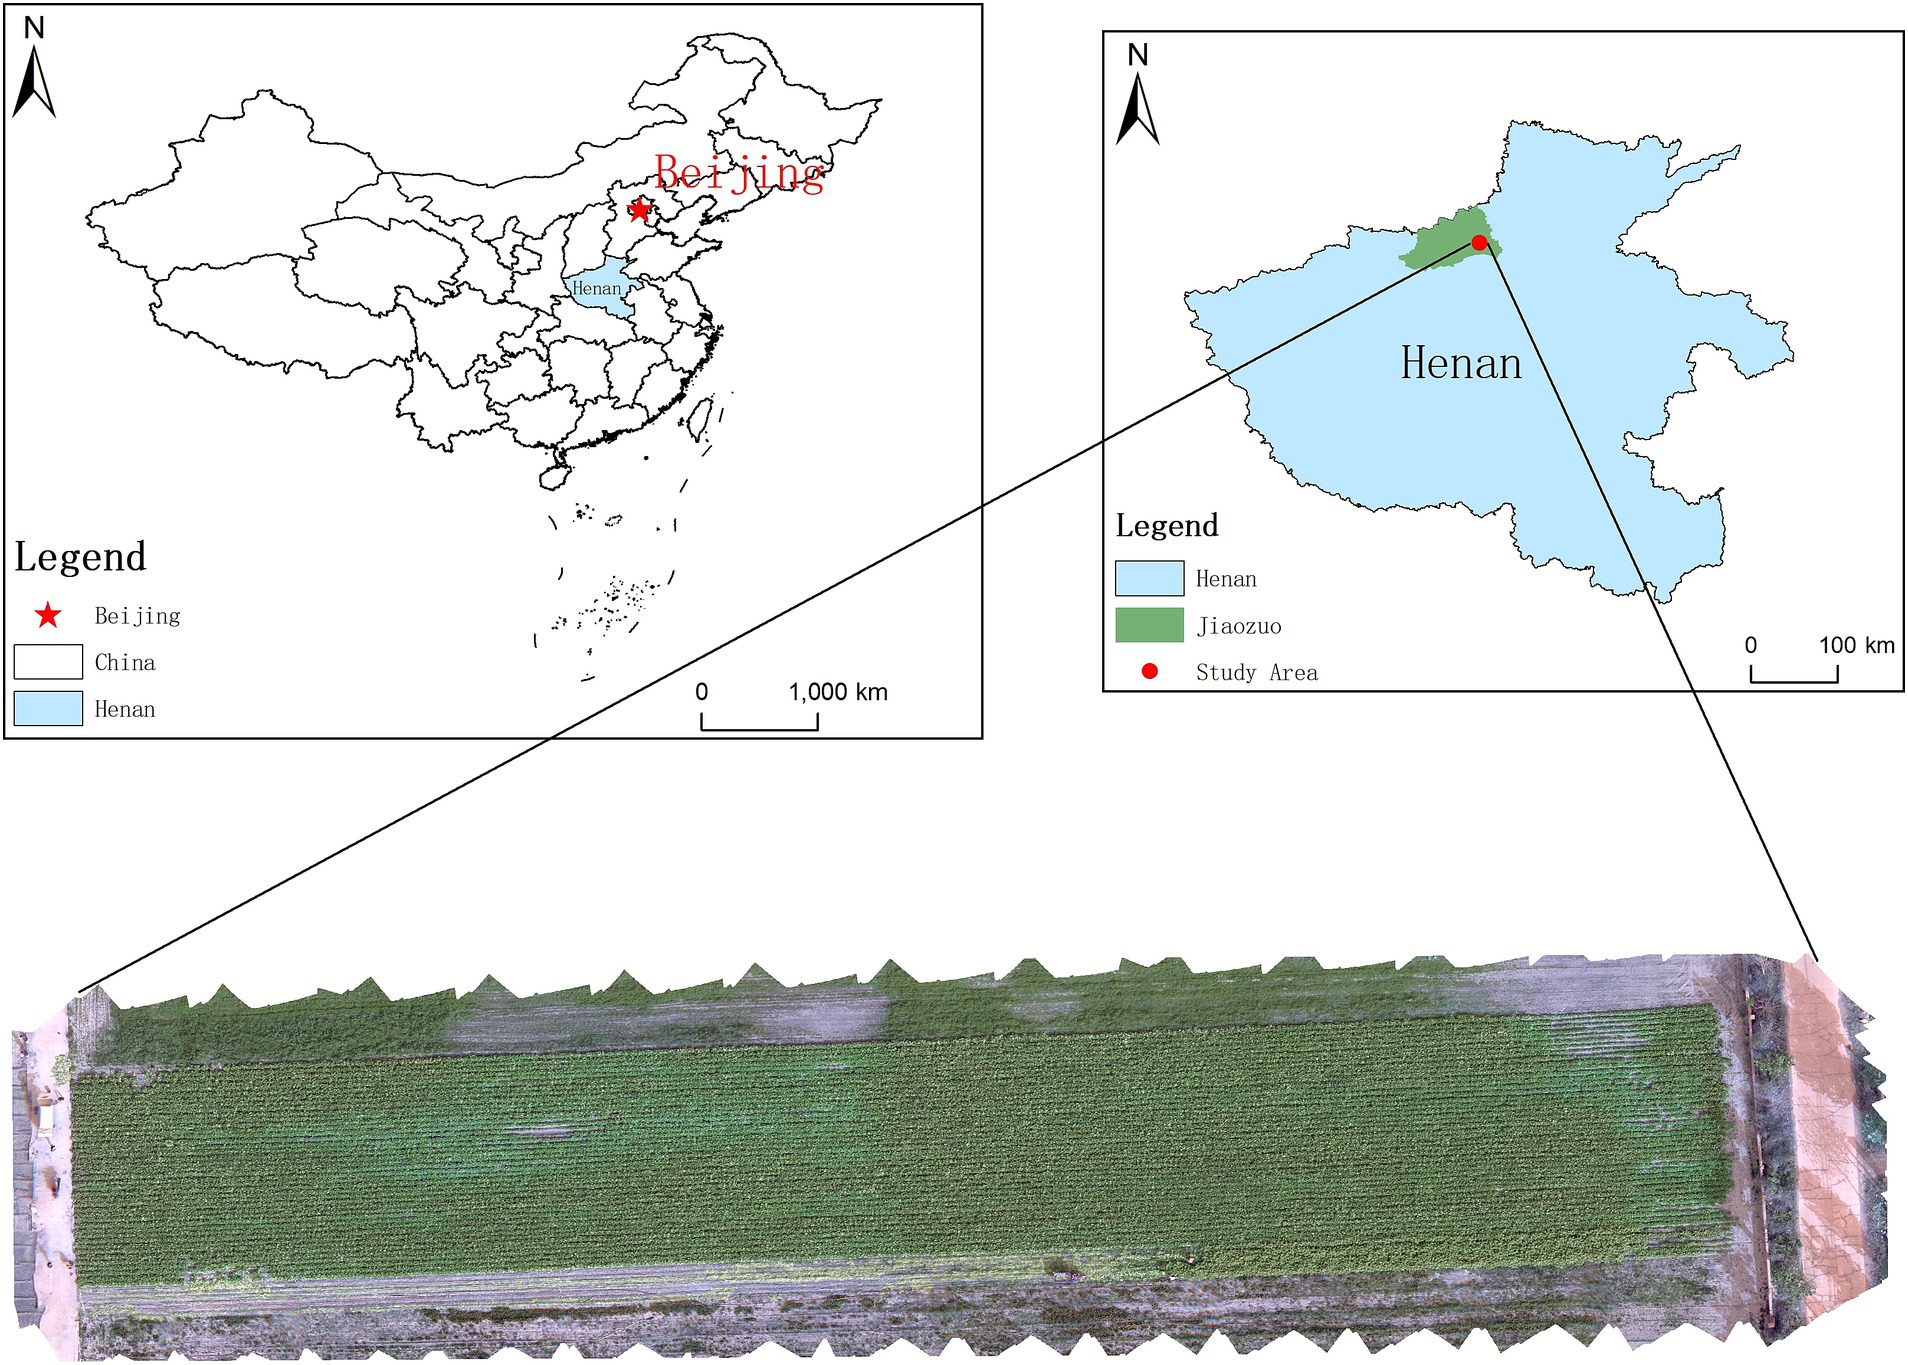
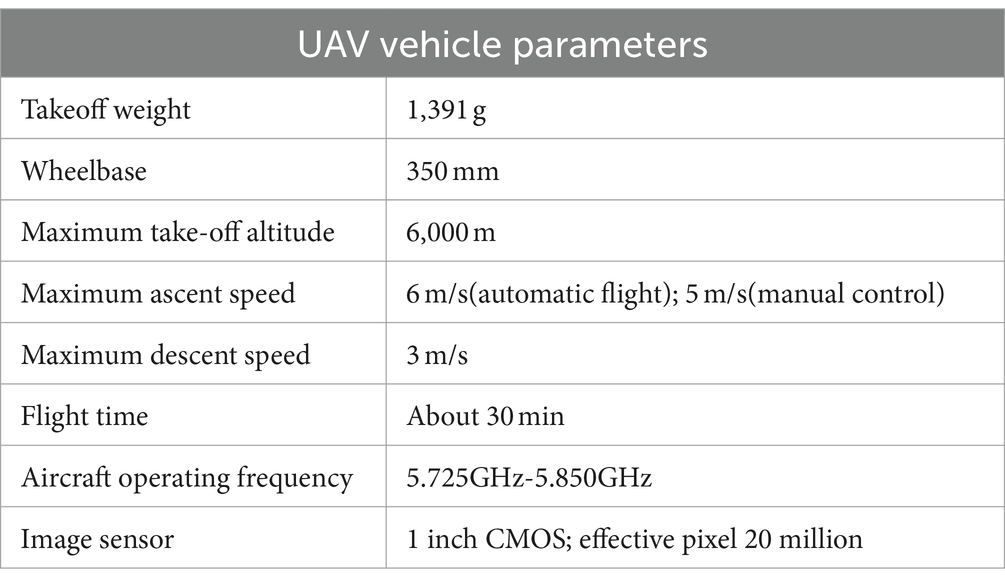
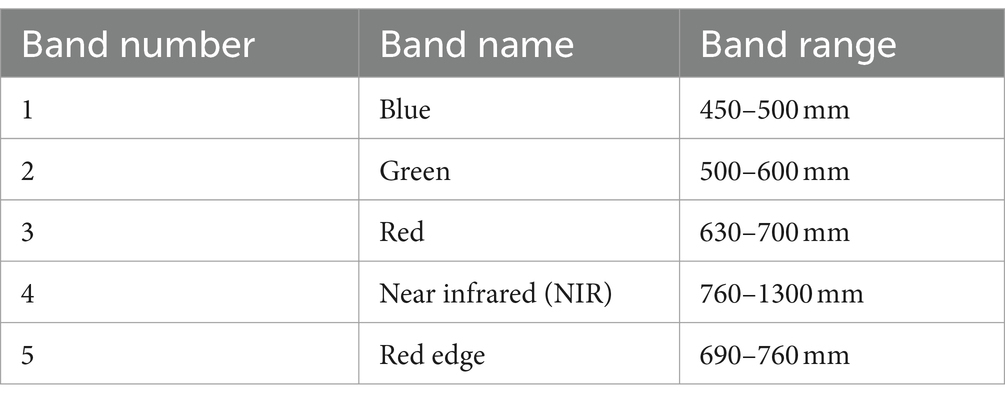
Situated in the northwest of Henan Province, China, Wuzhi County boasts a landscape characterized by its vast flatness, complemented by a temperate continental monsoon climate that cycles through four distinct seasons. With an average annual temperature of 14.4°C and precipitation totaling 575.1 millimeters, the region presents an ideal environment for cultivating Chinese cabbage, thereby being designated as the focal area for this research, as shown in Figure 1. The study area covers an area of 4,305 square meters. For the purposes of data collection, this study employs the DJI Phantom 4 RTK, a sophisticated multispectral drone. This quadcopter is outfitted with a color sensor dedicated to visible light imaging, alongside five monochrome sensors designed for capturing multispectral data. Imagery is archived in JPEG format for visible light captures and TIFF format for multispectral data, boasting a resolution of 1,600 × 1,300 (aspect ratio of 4:3.5). Detailed specifications and parameters of the drone and its imaging capabilities are systematically outlined in Tables 1, 2.
This study executed the acquisition of image data from Chinese cabbage crops, which were sown in early September and subsequently imaged on October 1, 2023. The growth period of Chinese cabbage lasts approximately two and a half months, with the first month after sowing being crucial for its development. During this period, the Chinese cabbage plants undergo rapid growth, providing valuable growth-related information for this study. Therefore, this study chose this specific period for data collection to gather comprehensive growth-related information. Data collection comprised three UAV flights, resulting in a total of 6,102 images. This collection comprised 1,017 visible light images alongside 5,089 images captured in single spectral bands. The imagery was systematically collected at uniform intervals along the UAV’s flight path, maintaining a velocity of 1.0 m/s at an altitude of 8.5 meters, ensuring a high-resolution capture of 0.4 cm per pixel. The drone images were acquired with a side overlap of 65% and an end overlap of 65%.
2.2 Construction of Chinese cabbage instance segmentation multispectral dataset
2.2.1 Preprocessing of multispectral images
This study leverages the Structure from Motion (SFM) technique for the preprocessing of multispectral images captured by unmanned aerial vehicles (UAVs), facilitating the generation of registered orthophoto images of the research area (Arruda Huggins de Sá Leitão et al., 2023). The SFM approach requires only the sequence of images captured, automating essential steps such as feature extraction. This eliminates the need for manual intervention or additional hardware like depth sensors or laser scanners, significantly enhancing cost-efficiency and operational flexibility (Jayathunga et al., 2023).
Initially, reflectance values are calibrated and applied across the image data, using known reflectance values from reference board images. This crucial step mitigates variations in image brightness due to changes in lighting conditions and camera settings, ensuring uniform and accurate reflectance across the dataset (Dietenberger et al., 2023). Subsequently, a feature-based matching algorithm identifies shared feature points among the images, determining their relative positions and orientations. This alignment establishes a spatial reference among the images, creating a solid foundation for precise geometric analyses essential for 3D reconstruction and measurement.
The optimization of camera parameters is then undertaken on the aligned images. This includes adjusting external parameters (such as camera position and orientation) and internal parameters (like focal length and distortion), based on known control points or ground control points. The goal is to minimize reprojection errors or maximize geometric consistency observed, thereby enhancing the accuracy of subsequent analyses. Through feature matching across aligned images, three-dimensional point cloud data is generated, which, via interpolation calculations on raster grids, leads to the creation of a Digital Elevation Model (DEM) with detailed elevation information.
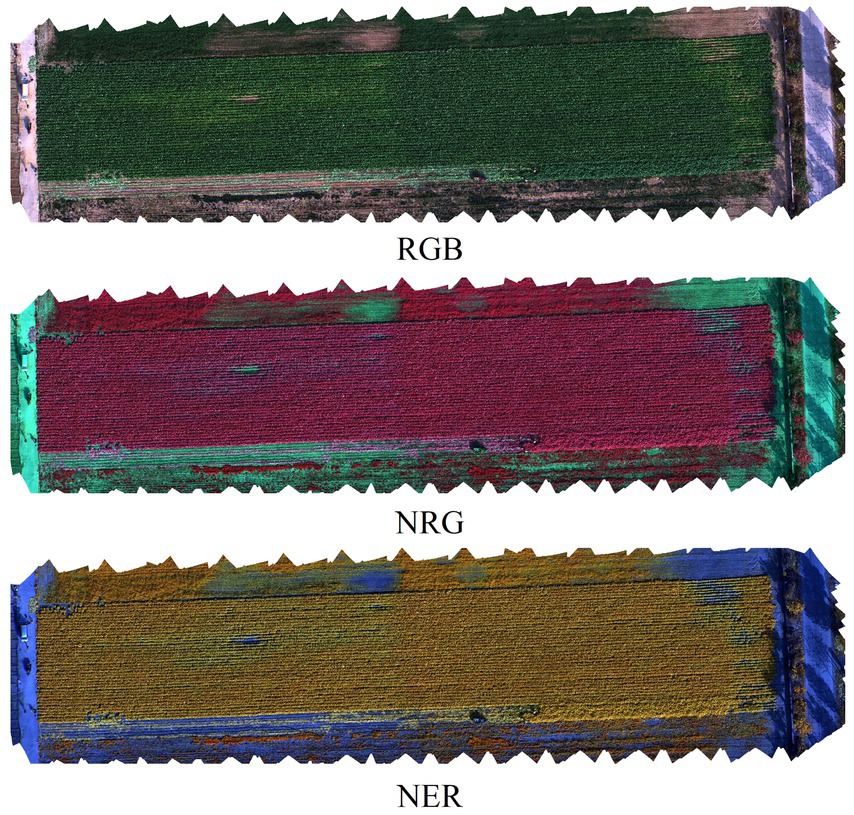
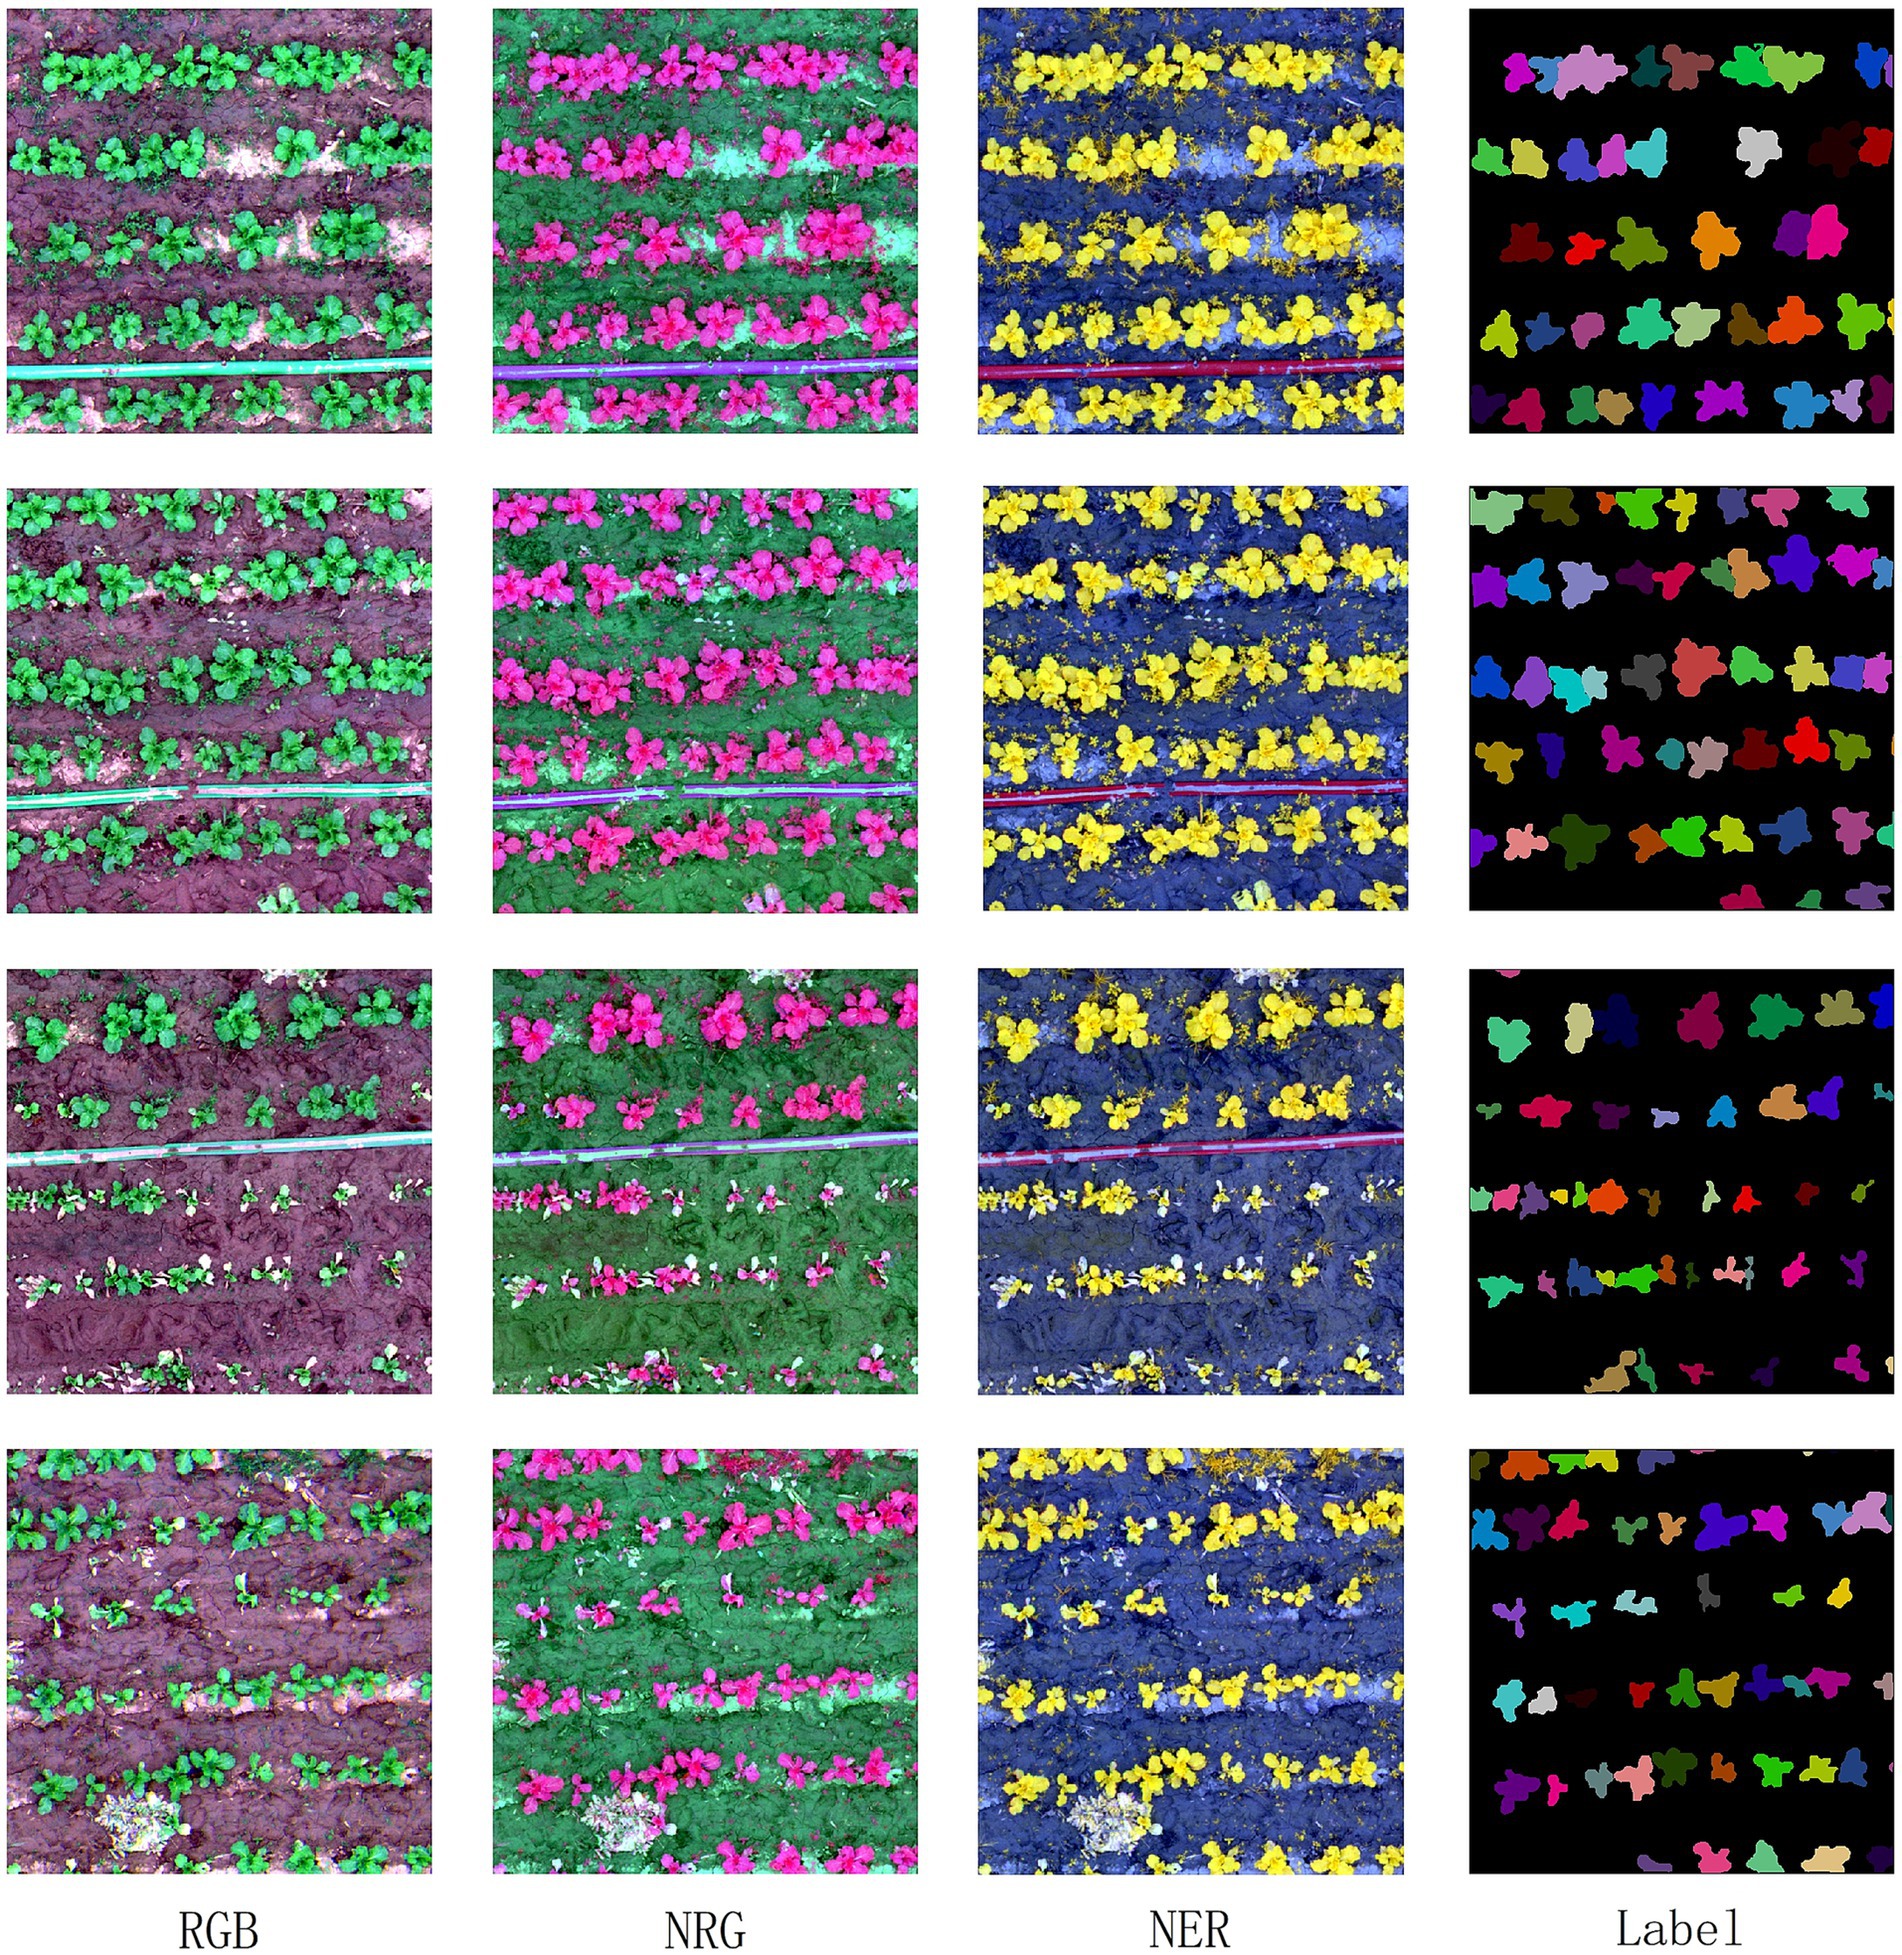
Finally, using the DEM and image data, orthorectification transformation is performed, accurately aligning image pixels to their true geospatial locations and producing orthomosaic images. Additionally, various spectral band data are merged to derive RGB (Red-Green-Blue), NER (Near Infrared-Red Edge-Red), and NRG (Near Infrared-Red-Green) images. Orthomosaic images emerging from different band combinations are illustrated in Figure 2, demonstrating the effectiveness of the preprocessing workflow and setting the stage for detailed multispectral analysis.
2.2.2 Construction of multispectral instance segmentation dataset based on SAM
In this study, the Segment Anything Model (SAM) is utilized for the semi-automatic annotation of preprocessed multispectral images, streamlining the segmentation process. SAM uniquely integrates features across multiple scales, automatically identifying the most salient features for precise segmentation (Ying et al., 2023). It incorporates a spatial attention mechanism within convolutional neural networks (CNN), enhancing the model’s ability to pinpoint critical features scattered across various image locales by adapting feature weights accordingly (Soylu et al., 2023). This methodology not only emphasizes local details but also assimilates global context, fostering a holistic comprehension of the image content and consequently bolstering the efficacy of image processing tasks (Gui et al., 2024).
Employing SAM for segmentation, followed by meticulous manual adjustments to refine the polygon masks of individual Chinese cabbages, resulted in the generation of 24,774 distinct Chinese cabbage segmentation instances. Furthermore, through the application of specialized cropping tools, orthomosaic images derived from assorted band combinations were segmented into 640 × 640 pixel frames, culminating in a collection of 923 images. Eighty percent of the image slices were randomly selected as the training set, while the remaining 20% were designated as the validation set. Figure 3 showcases a segment of the constructed Chinese cabbage instance segmentation multispectral dataset, featuring an array of cropped images in RGB, NRG, and NER formats alongside labels denoting Chinese cabbage segmentation instances, thereby illustrating the comprehensive scope and precision of the dataset compiled through this innovative approach.
2.3 Instance segmentation model
2.3.1 YOLOv8
YOLO (You Only Look Once) is a widely adopted algorithm for real-time object detection. It predicts the class and location of objects in an image through a single forward pass, without the need for multiple passes through a Region Proposal Network (RPN) to generate candidate regions (Zhu et al., 2023). The YOLO series has evolved continuously to accommodate diverse application scenarios. Compared to its predecessors, YOLOv8 introduces deeper network architectures and additional convolutional layers, enhancing feature perception and improving detection accuracy.
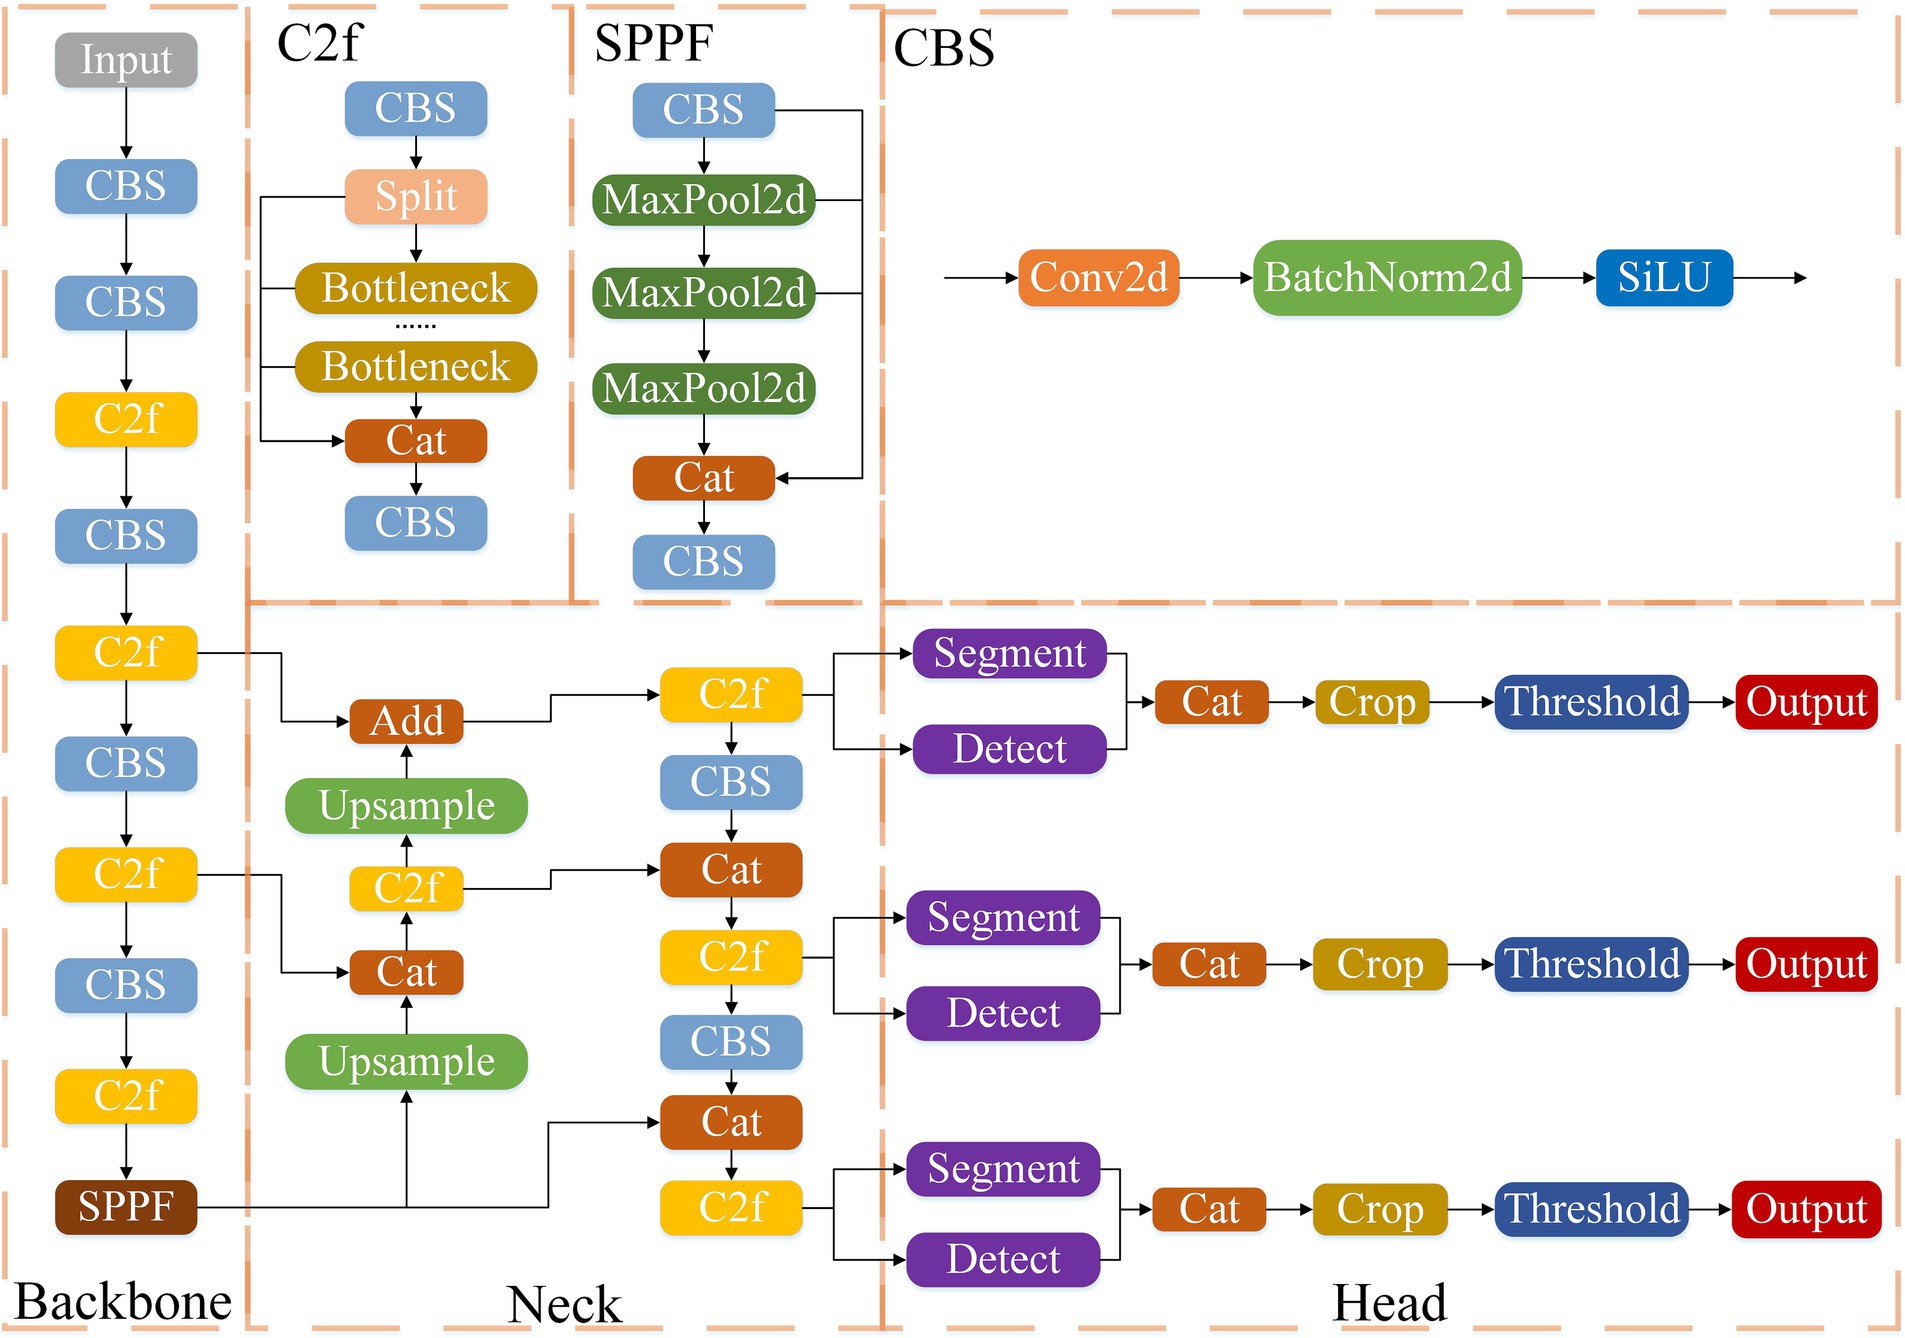
YOLOv8-Seg is an extension of YOLOv8, specifically optimized and enhanced for instance segmentation tasks. It retains the core architecture of YOLOv8, which consists of three main components: the Backbone, Neck, and Head networks. In the Backbone, YOLOv8-Seg draws on the ELAN structural design from YOLOv7 and replaces the C3 module from YOLOv5 with the C2f module, which improves gradient flow. Additionally, the number of channels is adjusted across models of different scales to achieve better performance (Liu G. et al., 2024). For the Neck, the model incorporates Path Aggregation Feature Pyramid Networks (PAFPN) to facilitate multi-scale feature integration. It combines both the Feature Pyramid Network (FPN) and the Panoptic Feature Pyramid (PFP), enhancing the model’s ability to detect objects of varying sizes (Xie et al., 2024; Yue et al., 2023). In the Head, YOLOv8-Seg adopts a Decoupled-Head architecture, generating both segmentation and detection outputs at each scale. The model creates independent segmentation masks for each target and applies different thresholds to fine-tune the final output. Moreover, it introduces the Task-Aligned Assigner for positive and negative sample matching, improving the stability of the training process (Wang and Liu, 2024). The architecture of YOLOv8-Seg is illustrated in Figure 4, showing the complete framework. This model is designed to efficiently run on a variety of hardware platforms, from CPUs to GPUs, making it adaptable to different computational environments (Casas et al., 2023).
YOLOv8-Seg consists of five models of varying scales: YOLOv8n-Seg, YOLOv8s-Seg, YOLOv8m-Seg, YOLOv8l-Seg, and YOLOv8x-Seg. YOLOv8n-Seg is the most lightweight model, designed for resource-constrained environments. YOLOv8s-Seg strikes a balance between model size and detection speed, making it suitable for standard tasks. YOLOv8m-Seg offers higher detection accuracy and robustness, making it well-suited for small to medium-sized tasks that demand greater precision. YOLOv8l-Seg, as a larger model, delivers excellent accuracy and robustness, ideal for applications requiring high performance. YOLOv8x-Seg is the largest and most complex model, providing the highest segmentation precision and robustness but requiring substantial computational resources (Wu et al., 2023). Table 3 compares the performance of these models on the COCO val2017 dataset, using single-model, single-scale testing.
2.3.2 Input
The Input layer of YOLOv8-Seg is primarily responsible for transforming the incoming images into a format that the model can effectively process. Its core functions include image preprocessing, data conversion, and data transmission. First, the input layer scales the images to a fixed size to meet the network’s input requirements and normalizes the pixel values to the [0, 1] range. This normalization mitigates the impact of varying numerical ranges, ensuring the model’s stability and accuracy during both training and inference. Additionally, YOLOv8-Seg adopts the BGR (Blue-Green-Red) channel order instead of the more common RGB (Red-Green-Blue) format. Therefore, the input layer rearranges the image’s channels into BGR format to ensure the data is correctly interpreted by the model. Next, the preprocessed images are transformed into a four-dimensional tensor with the shape (batch_size, channels, height, width). This tensor format enables efficient parallel computation on hardware devices such as GPUs. Finally, the processed tensor data is passed to subsequent layers of the network, such as convolutional and pooling layers, for further feature extraction and processing. This series of preprocessing, conversion, and transmission operations ensures the quality and consistency of the input data, thereby enhancing the model’s overall performance and inference accuracy.
2.3.3 Backbone network
The Backbone Network plays a pivotal role in extracting feature information from the input image, delineating details across various scales and semantics via a structured hierarchical representation. This network architecture is composed of five convolutional (Conv) modules, four C2f modules, and a singular SPPF (Spatial Pyramid Pooling Fusion) module, all orchestrated to refine feature extraction. The integration of residual connections and bottleneck structures is strategic, aiming to streamline the network’s size while concurrently boosting its performance (Yang et al., 2023). Residual connections are instrumental in facilitating direct information flow from the input across layers, effectively mitigating the challenges associated with vanishing and exploding gradients. This innovation significantly augments the network’s expressive capabilities and accelerates model convergence.
2.3.3.1 CBS convolutional module
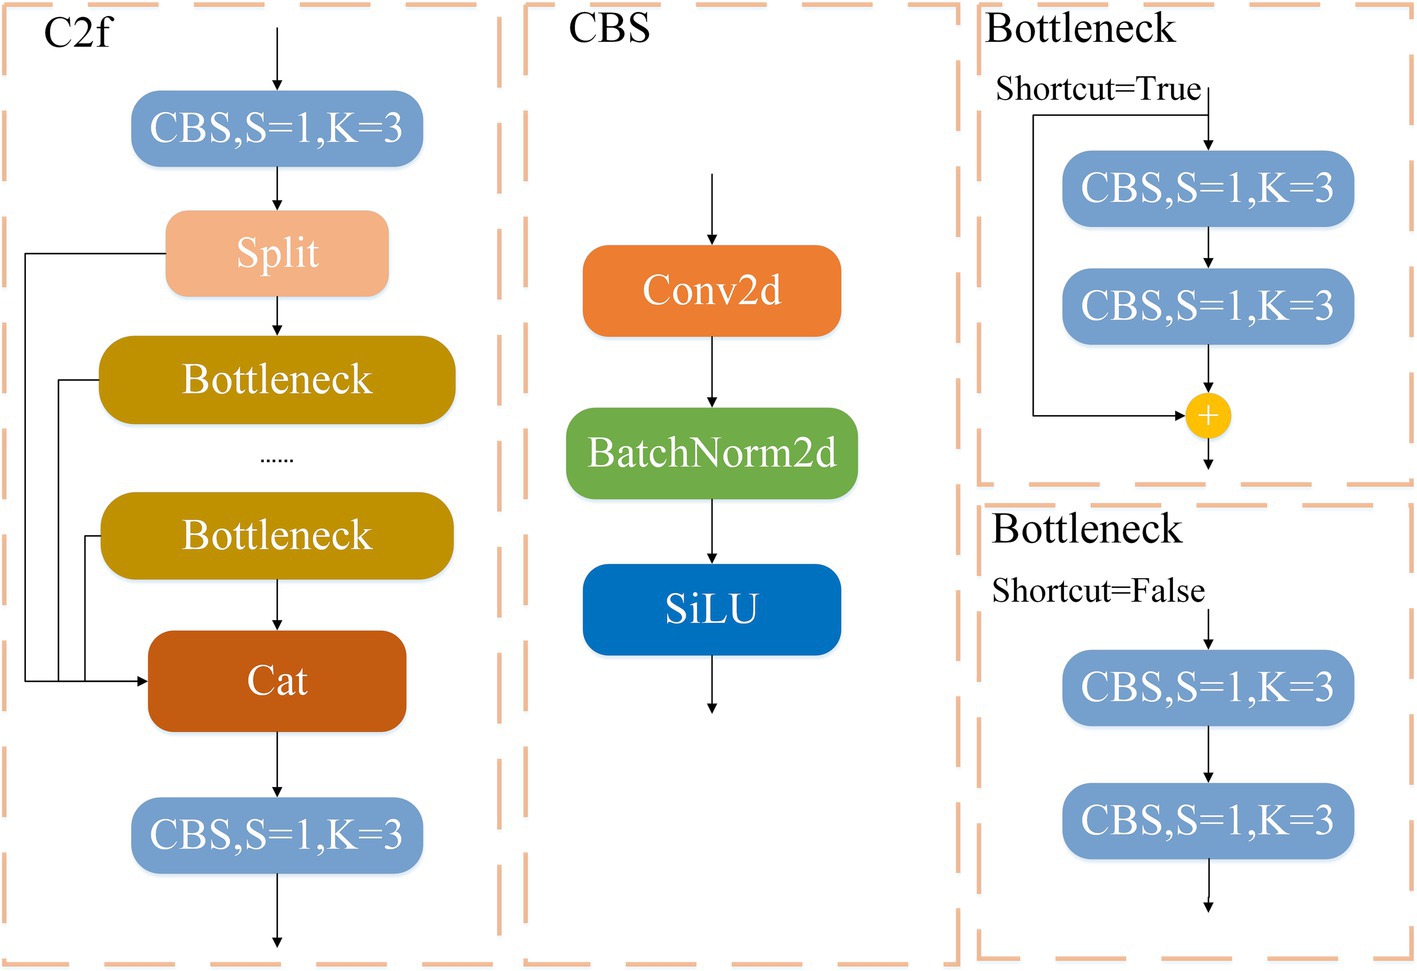
The CBS convolutional module consists of a convolutional layer (Conv2d), a batch normalization layer (BatchNorm2d), and a SiLU activation function, as shown in Figure 5. The convolutional layer slides a fixed-size kernel over the input image, performing pointwise multiplication between pixel values in local regions and the corresponding kernel weights, followed by summation to generate a feature map. Stacking multiple convolutional layers allows the network to extract increasingly abstract features, facilitating the representation of complex image information. The batch normalization layer standardizes the input by calculating the mean and variance within each batch, scaling the data to follow a standard normal distribution. This normalization accelerates model convergence and mitigates the risk of vanishing or exploding gradients during training. After batch normalization, the data undergoes a non-linear transformation through the SiLU (Sigmoid-Weighted Linear Unit) activation function. Compared to the traditional ReLU function, SiLU retains non-zero gradients for small input values, enhancing both the training dynamics and the model’s generalization ability. The inclusion of the activation function introduces non-linearity into the network, enabling it to effectively learn complex data patterns and capture high-dimensional features with greater accuracy.
2.3.3.2 C2f module
The C2f module maps image features into the feature space of each target instance through feature extraction, aggregation, and fully connected layer transformations, providing precise feature representations for instance segmentation (Wang H. et al., 2024). Its structure consists of a slicing operation, two 1 × 1 convolutions, n Bottleneck operations, and a concatenation operation. First, the initial 1 × 1 convolution facilitates cross-channel information interaction, enhancing the feature representation capability. After the slicing operation, the feature maps generated by each convolution are progressively concatenated with the original feature map. Finally, the second 1 × 1 convolution compresses the number of channels in the concatenated feature map to match the input channel size, ensuring the lightweight nature of the model. This design not only improves computational efficiency but also strengthens the model’s ability to learn and process information in complex feature spaces. The detailed structure of the C2f module is illustrated in Figure 6.
2.3.3.3 SPPF module
The SPPF (Spatial Pyramid Pooling Fusion) module performs pooling operations on input feature maps at multiple scales, generating several sub-feature maps and fusing them to extract more comprehensive and detailed information (Lu et al., 2024). Pooling operations perform local statistical operations on the input feature maps, enabling dimensionality reduction and information compression while retaining essential features. This process enhances the network’s computational efficiency and generalization ability. The mathematical expression of the pooling operation is shown in Equation (1):
The SPPF (Spatial Pyramid Pooling Fusion) module is based on the design of Spatial Pyramid Pooling (SPP). SPP utilizes three adaptive max-pooling layers of different sizes, arranged in parallel between two convolutional layers, to transform feature maps of arbitrary sizes into fixed-size feature vectors. Building on this foundation, SPPF optimizes the SPP structure by reorganizing the parallel pooling layers into a serial structure and standardizing the convolutional layers to a size of 1 × 1. This combination of serial max-pooling operations and unified convolutional layer design allows the SPPF module to extract and transform features more efficiently, significantly enhancing the model’s computational efficiency and detection accuracy. The detailed structure of the SPPF module is illustrated in Figure 7.
2.3.4 Neck module
Positioned between the Backbone network and the output Head, the Neck module leverages the Path Aggregation Feature Pyramid Network (PAFPN) for adept multi-scale feature fusion, integrating both Feature Pyramid Network (FPN) and Path Aggregation Network (PAN) structures (Wu et al., 2024). FPN boosts image feature representation by fusing deep and shallow feature maps via top-down upsampling, enhancing semantic detail transmission (Li et al., 2023). Conversely, PAN, building on FPN, employs a bottom-up approach to relay fine details like edges, colors, and positions from shallow to deep layers, ensuring comprehensive feature integration (Du et al., 2023). This sophisticated design equips the model to process features across scales precisely, enabling accurate identification and segmentation of diverse object instances.
2.3.5 Head network
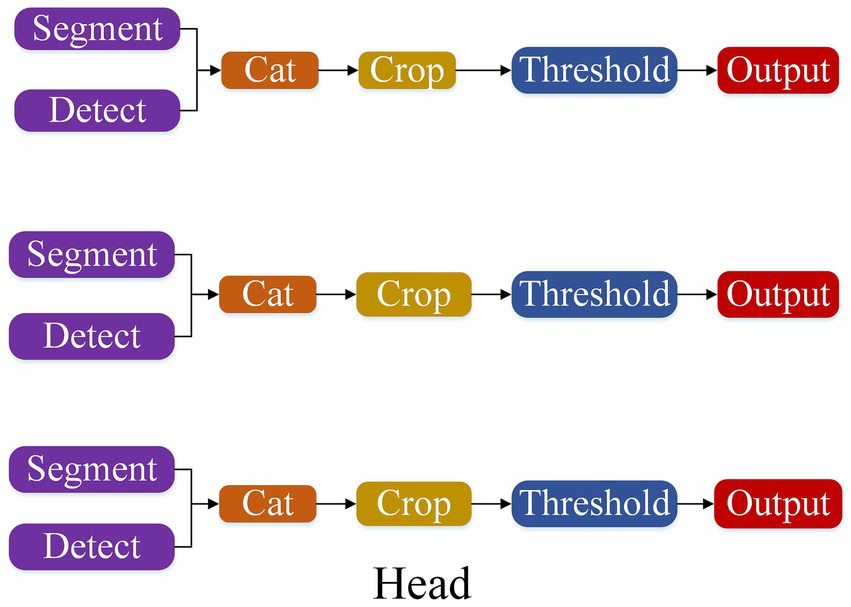
The Head module integrates both detection and segmentation tasks through a modular design, enabling efficient multi-task processing. It adopts a Decoupled-Head architecture, separating classification and localization tasks to enhance both detection and segmentation accuracy and efficiency (Cao et al., 2024). Additionally, the Head module employs the Task-Aligned Assigner strategy for positive and negative sample matching, optimizing the training process and ensuring reasonable sample assignment, further improving the model’s stability and generalization ability (Solimani et al., 2024). The detailed structure is illustrated in Figure 8. In this architecture, the Segment module generates segmentation masks for each target instance, while the Detect module predicts the target’s class and bounding box. The outputs from both modules are integrated using a Cat (concatenation) operation to ensure consistency between detection and segmentation results. Next, the Crop step precisely extracts the target regions, producing clearer instance areas to prepare for the final output. The Threshold operation is then applied to filter high-confidence instances, reducing noise interference and generating the final output. Moreover, the Head module produces multi-scale feature maps with resolutions of 80 × 80, 40 × 40, and 20 × 20, enabling the detection of objects of varying sizes. This multi-scale strategy ensures that the model maintains strong performance for both large and small objects, significantly enhancing detection accuracy and generalization.
2.3.6 Loss calculation
The loss calculation of YOLOv8-Seg consists of regression loss, classification loss, and mask loss, where the regression loss is composed of CIoU Loss and Distribution Focal Loss (DFL) (Zhang et al., 2024). The total loss value is obtained by applying proportional weighting to these four components.
2.3.6.1 CIoU loss
The Intersection over Union (IoU) metric quantifies the overlap between predicted and ground truth bounding boxes, ranging from 0 to 1. A value approaching 1 signifies a substantial overlap, indicating high accuracy of the prediction, whereas a value near 0 denotes minimal overlap. The Complete Intersection over Union (CIoU) enhances this measure by incorporating the distances between the centers, as well as the width and height differences of the predicted and actual instances, alongside their overlap. In instance segmentation, CIoU refines the model’s capability to precisely locate and identify objects. It resolves the challenge of guiding bounding box regression, even in scenarios where the predicted and ground truth boxes do not intersect, thus elevating instance segmentation accuracy (Jia et al., 2023). The calculation steps of CIoU (Complete Intersection over Union) are shown in Equations (2–4):
Among them, IoU represents the intersection over union, and denote the centroids of two bounding boxes, signifies the Euclidean distance between two bounding boxes, stands for the diagonal distance of the closed region between two bounding boxes, denotes the aspect ratio loss between the predicted and true bounding boxes, is the loss coefficient, represents the width of the predicted bounding box, indicates the height of the predicted bounding box, signifies the width of the true bounding box, and denotes the height of the true bounding box.
2.3.6.2 Varifocal loss
To tackle the challenge of imbalanced distributions between positive and negative samples, the Varifocal Loss function employs asymmetric weighting strategies. This approach adjusts the weighting of samples to balance the influence of positive and negative samples in the loss calculation, enhancing model training efficiency and accuracy. The specific computation steps for Varifocal Loss are detailed in Equation (5):
Among them, is the IoU value of the predicted and true boxes. If the predicted and true boxes intersect, then , it is a positive sample; If the predicted box and the true box do not intersect, then is a negative sample. As shown in the formula, by utilizing γ, the factor scaling loss of the Varifocal Loss function only reduces the loss contribution of negative samples (), rather than reducing the weight of positive samples () in the same way.
2.3.6.3 Distribution focal loss
The Distribution Focal Loss (DFL) leverages cross-entropy to refine the probabilities associated with the positions immediately to the left and right of the labeled position. This precision enables the network to more rapidly align with the designated target area, significantly boosting the model’s ability to generalize across intricate scenarios. The calculation formula for DFL, which supports this optimization, is provided in Equation (6):
Among them, and represent the values of two points adjacent to (≤≤), and and represent the probability output values at different positions, respectively. From the formula, it can be seen that when is closer to and the probability output value of S is larger, the DFL loss value is smaller, making the distribution closer to the center of the annotation. Therefore, DFL can make the network focus faster on the values near the target , increase its probability, and thus accelerate convergence.
2.3.6.4 Mask loss
Mask loss measures the difference between the predicted masks generated by the model and the ground truth masks. To ensure accuracy in instance segmentation tasks, Binary Cross-Entropy (BCE) is employed as the loss function. BCE is a pixel-wise loss function that quantifies the alignment between the predicted probability and the ground truth label by computing the cross-entropy for each pixel. The formula is provided in Equation (7):
In the formula, represents the predicted mask generated by the model, denotes the corresponding ground truth mask.
The loss function of the YOLOv8-Seg model is defined in Equation (8):
Where ,, , and are constants.
3 Experimental results and analysis
3.1 Experimental environment
This study’s experiments were carried out on a platform featuring a 64-bit Windows 10 operating system, powered by an AMD Ryzen 75,800× 8-Core Processor at 3.8GHz and equipped with an NVIDIA GeForce RTX 3060 GPU. The computational framework for deep learning comprised Python 3.8, PyTorch 1.12.0, and CUDA 11.3. The configuration for the experimental setup was meticulously defined as follows: the number of training epochs was established at 200, with a batch size of 2. The initial learning rate was determined to be 0.002, with the learning rate momentum adjusted to 0.937. Additionally, the weight decay coefficient was precisely set at 0.0005, and AdamW was selected as the optimizer to facilitate the training process.
3.2 Evaluation metrics
To ascertain the efficacy of the proposed method, a set of evaluation metrics has been employed, including: mAP0.5 (Mean Average Precision at an Intersection over Union (IoU) threshold of 0.5, reflecting average precision for each class), mAP0.75 (Mean Average Precision at an IoU threshold of 0.75, indicating average precision for each class), and mAP0.5:0.95 (Mean Average Precision across IoU thresholds from 0.5 to 0.95, offering a comprehensive average precision across each class). The methodologies employed to calculate these pivotal evaluation metrics are outlined as follows.
Average Precision (AP) is defined as the area under the precision-recall curve, where a higher AP value indicates better model performance. Mean Average Precision (mAP), representing the aggregate AP across all classes, is calculated using the formulas in Equations (9,10):
3.3 Model performance evaluation
3.3.1 Comparison of different model accuracies
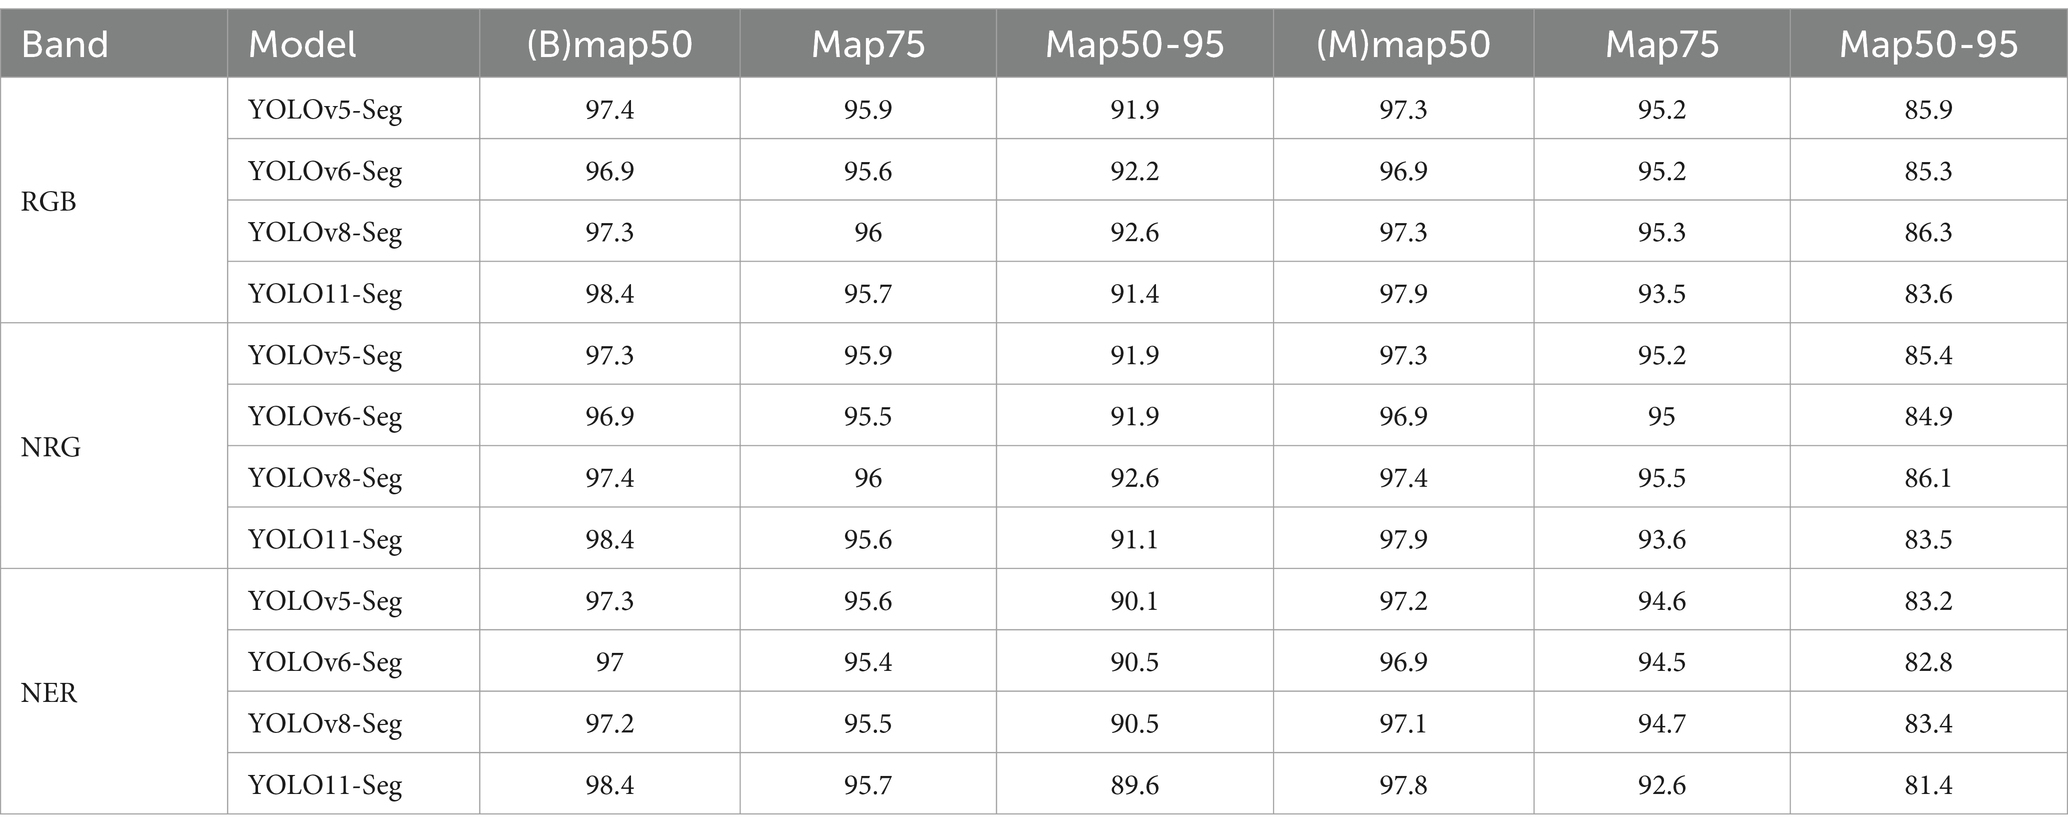
To evaluate the segmentation performance of various models on our tailored dataset, we conducted comparative experiments under the same experimental conditions, using prominent instance segmentation algorithms such as Mask R-CNN, Cascade Mask R-CNN, PointRendb, RTMDet, and the YOLO series—YOLOv5-Seg, YOLOv6-Seg, YOLOv8-Seg, and YOLO11-Seg. The outcomes of these comparisons are systematically presented in Table 4, detailing the performance metrics of the different models on the validation set. In Table 4, (B) represents the bounding box metrics, while (M) represents the segmentation masks metrics.
Mask R-CNN enhances segmentation accuracy through region-specific scanning, yet its two-stage architecture leads to extended processing times for both detection and segmentation phases. Conversely, Cascade Mask R-CNN aims to expedite segmentation compared to its predecessor at the expense of slight accuracy reductions. PointRend excels in refining segmentation along target edges by generating additional sampling points, albeit at the cost of increased computational complexity. According to the data presented in Table 4, YOLOv8-Seg outperforms its counterparts in average precision (AP) across various Intersection over Union (IoU) thresholds. Specifically, in detection, the mAP0.5:0.95 of YOLOv8-Seg surpasses that of Mask R-CNN, Cascade Mask R-CNN, PointRend, RTMDet, YOLOv5-Seg, YOLOv6-Seg, and YOLO11-Seg by margins of 6.1, 6.2, 6.0, 8.2, 0.7, 0.4, and 1.2%, respectively. In segmentation, YOLOv8-Seg similarly leads, with its mAP0.5:0.95 exceeding those of the aforementioned models by 4.1, 5.2, 2.2, 8.2, 0.4, 1.0 and 2.7%, respectively, showcasing its superior accuracy and efficiency in both detection and segmentation tasks.
3.3.2 Comparison of different band combinations
Preliminary tests have shown that the YOLO series algorithms outperform traditional segmentation methods in terms of overall accuracy. In order to delve deeper into the impact of different spectral band combinations on segmentation precision, this study conducted additional experiments focusing on the performance of YOLOv5-Seg, YOLOv6-Seg, YOLOv8-Seg and YOLO11-Seg across RGB, NRG, and NER bands. The results of these investigations are detailed in Table 5, shedding light on the efficacy of each algorithm under various spectral conditions.
As shown clearly in Table 5, YOLOv8-Seg consistently achieves the highest segmentation accuracy across most tested spectral band combinations, outperforming YOLOv5-Seg and significantly surpassing YOLOv6-Seg. In contrast, YOLO11-Seg exhibits relatively poorer performance. The series of comparative tests among the RGB, NRG, and NER bands revealed that the RGB combination emerged as the most accurate, followed by NRG, with NER registering the lowest accuracy scores. This discrepancy underscores the inherent advantages of the RGB band configuration, which encompasses the red, green, and blue bands of the visible spectrum. While RGB bands offer rich color details crucial for visual interpretation by human eyes, their significance in algorithmic interpretation may vary. Although algorithms can process information from various spectral bands, including near-infrared (NIR), the RGB bands still play a crucial role in providing contextual information and aiding in the identification of individual Chinese cabbage plants. The combination of RGB bands enables algorithms to capture subtle variations in color, which can help distinguish between different plant species or health conditions. In addition, one significant advantage of the results obtained with RGB images in our study is that Chinese cabbage segmentation can be achieved using simple RGB drones, which are a more cost-effective technology compared to multispectral drones. This highlights the practicality and accessibility of our approach for agricultural applications.
3.3.3 Visualization analysis
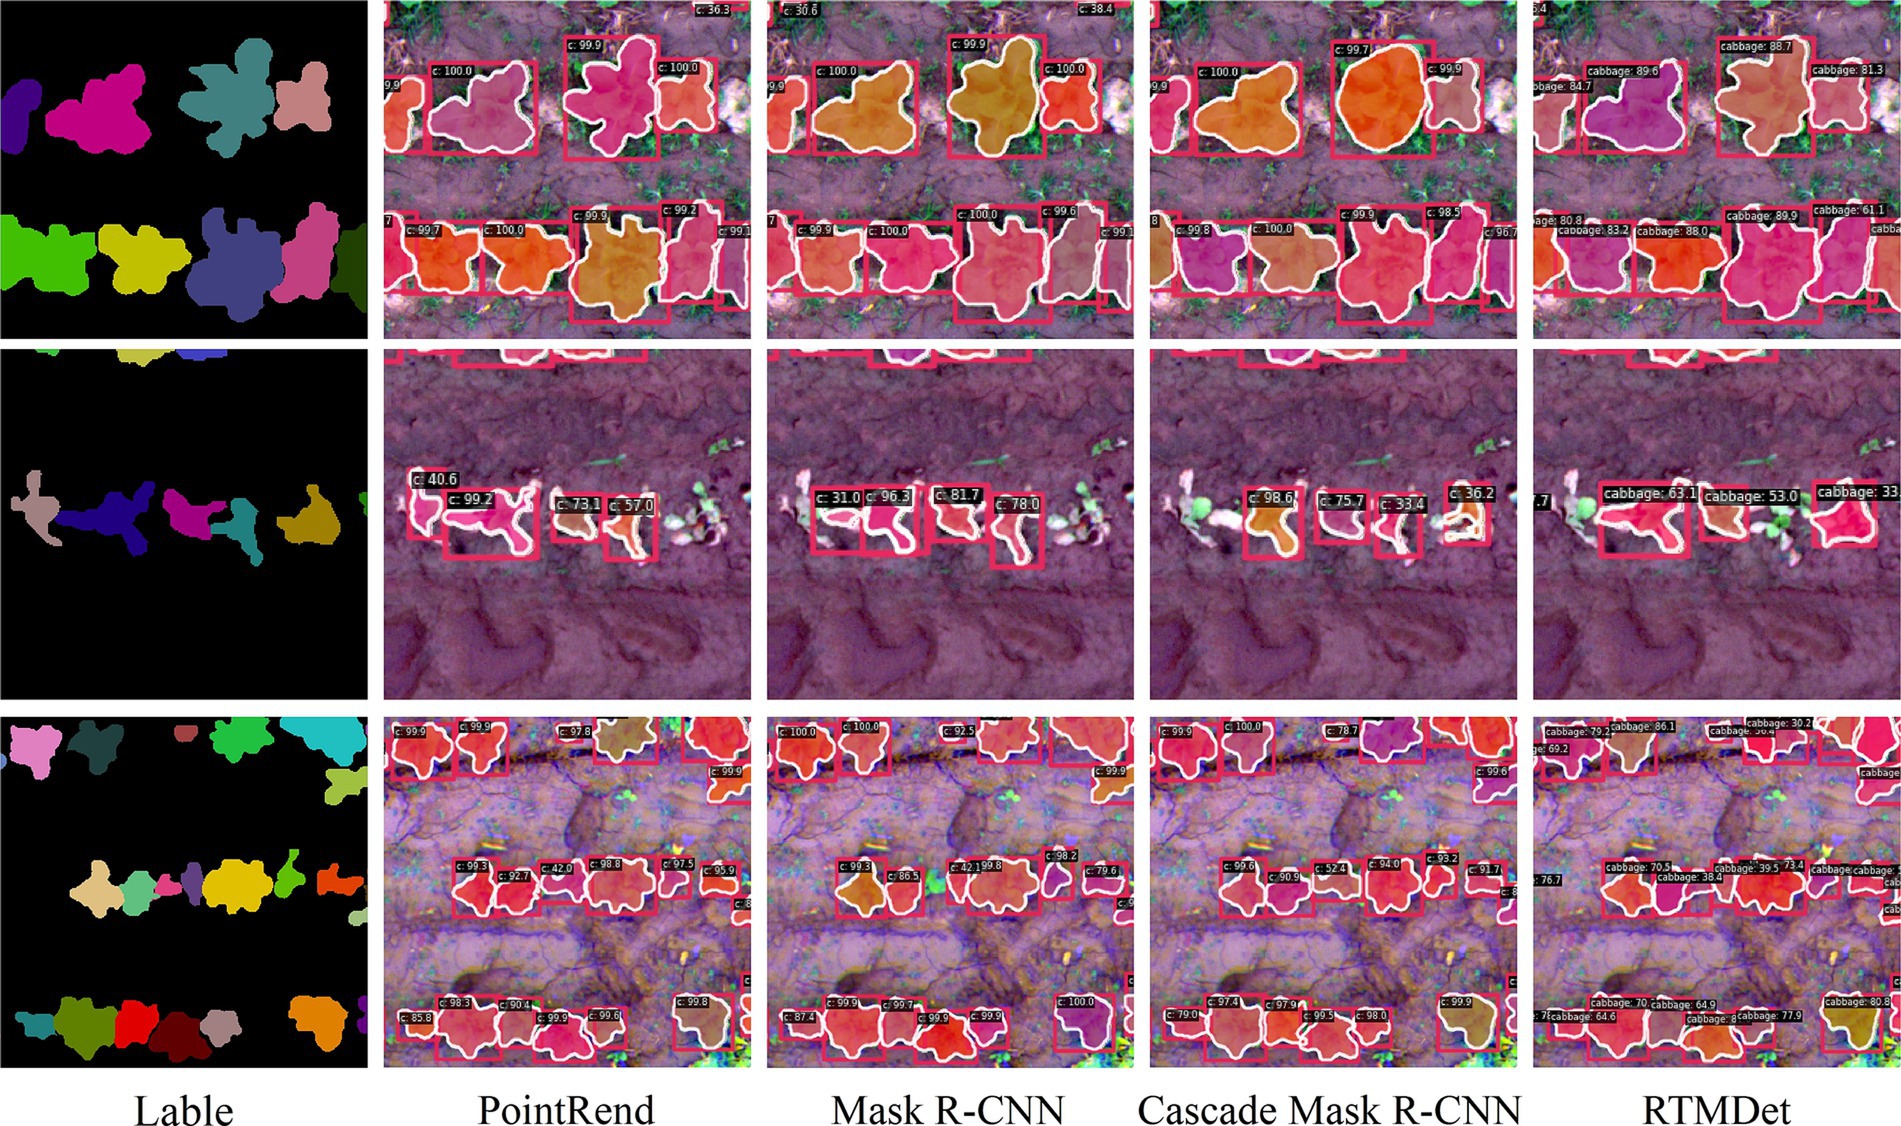
To better present the experimental results, we selected Chinese cabbage samples representing different growth statuses—optimal growth, waterlogged stress, and standard growth—from the dataset for visual analysis. Figures 9, 10 illustrate the segmentation performance of various algorithms. As shown in Figure 9, in segmenting optimally grown Chinese cabbages, the algorithms exhibited differences in boundary handling, with Mask R-CNN, Cascade Mask R-CNN, and RTMDet struggling to accurately capture complex edge regions. For Chinese cabbages under standard growth conditions, Mask R-CNN and PointRend encountered occasional missed detections. When dealing with waterlogged-stressed Chinese cabbages, all algorithms demonstrated varying degrees of missed detections, failing to fully identify all instances. These findings suggest that mainstream instance segmentation algorithms still require improvement when addressing complex growth environments and varying morphological features.
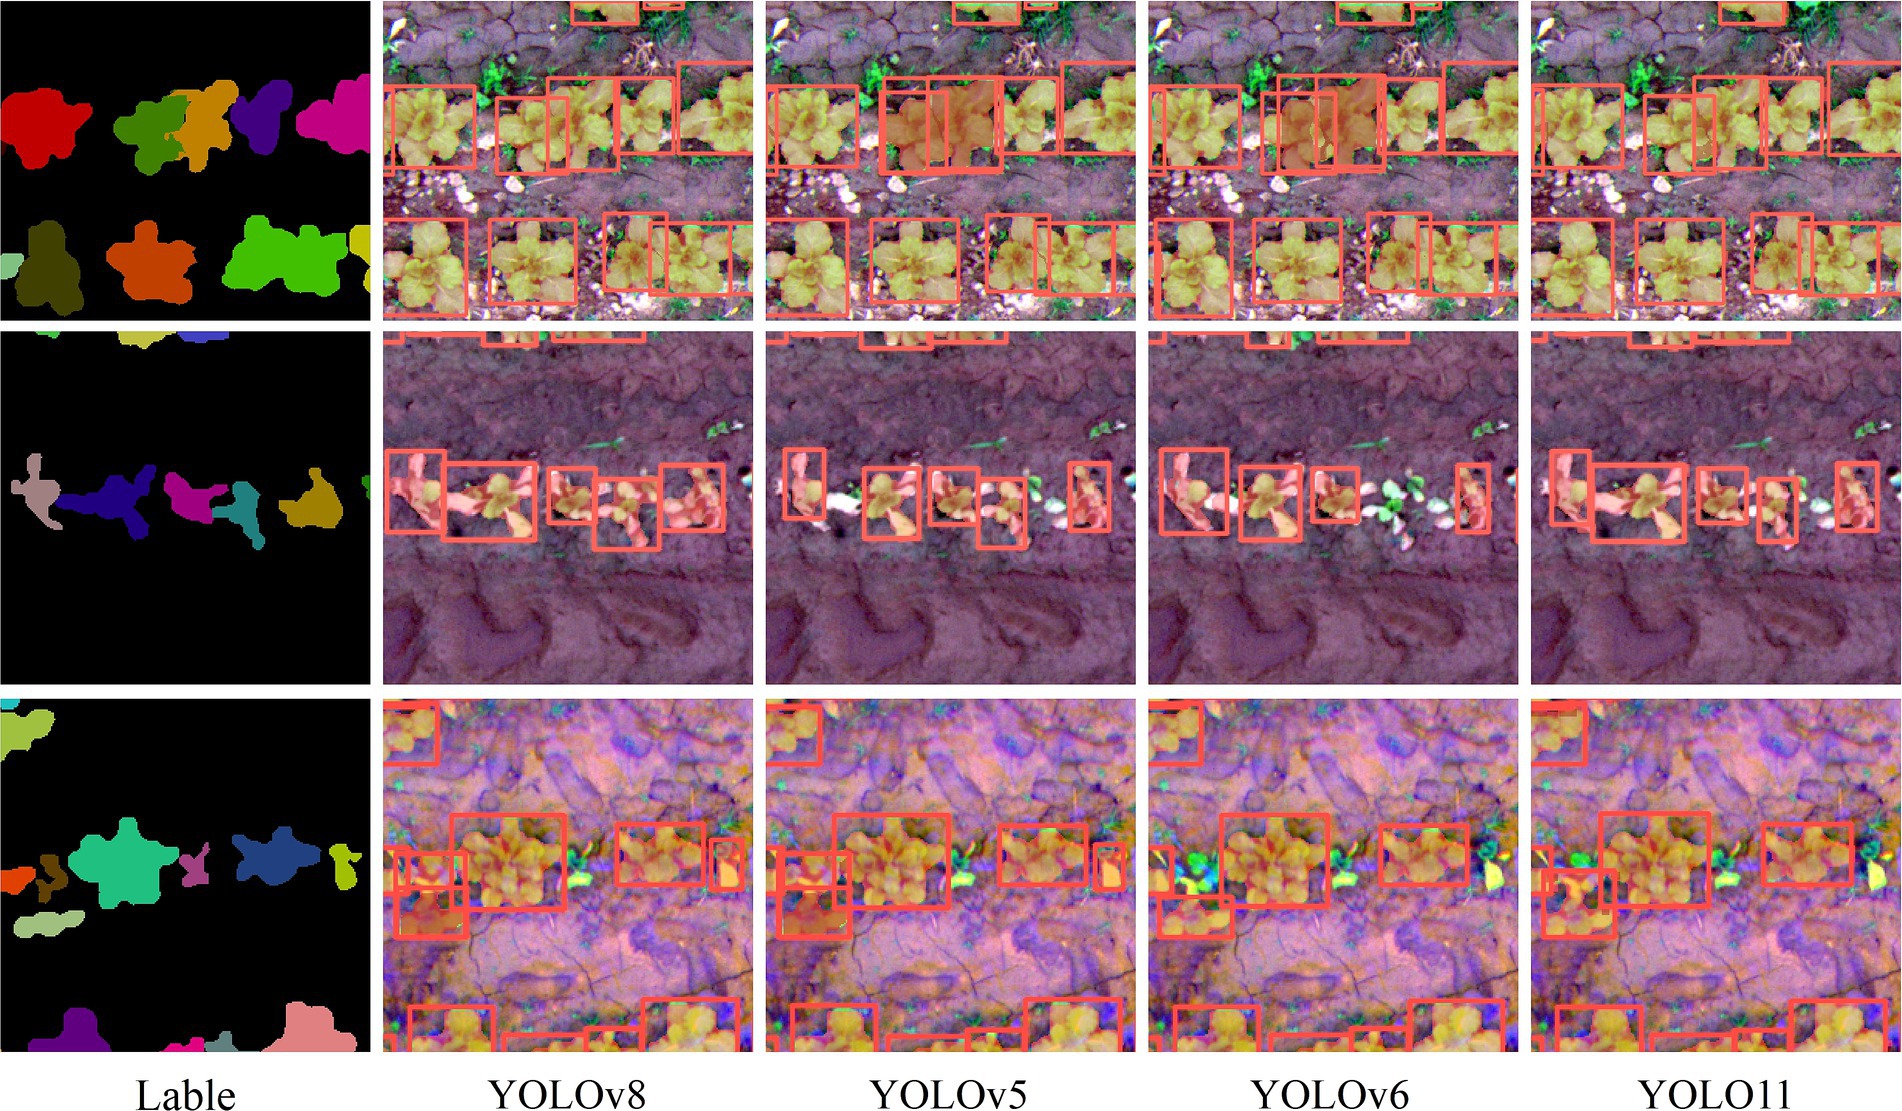
In comparison to conventional mainstream instance segmentation algorithms, as shown in Figure 10, the YOLO series consistently outperforms the others in segmentation tasks. However, there are noticeable performance differences across YOLO versions. YOLOv5-Seg and YOLOv6-Seg occasionally misidentify two adjacent, healthy Chinese cabbages as a single instance, leading to instance merging issues. Furthermore, both models demonstrate inconsistencies when handling waterlogged-stressed Chinese cabbages, frequently encountering missed detections and false positives. In contrast, YOLOv8-Seg stands out with superior segmentation accuracy, particularly excelling in preserving the morphological integrity of Chinese cabbages and significantly reducing false positives and instance merging issues. Although the newly introduced YOLO11-Seg incorporates structural updates, it does not surpass YOLOv8-Seg in segmentation performance and experiences some accuracy decline in complex scenarios. Overall, YOLOv8-Seg remains the top-performing version, consistently achieving more stable detection results across diverse growth conditions.
3.3.4 Analysis of Chinese cabbage growth status
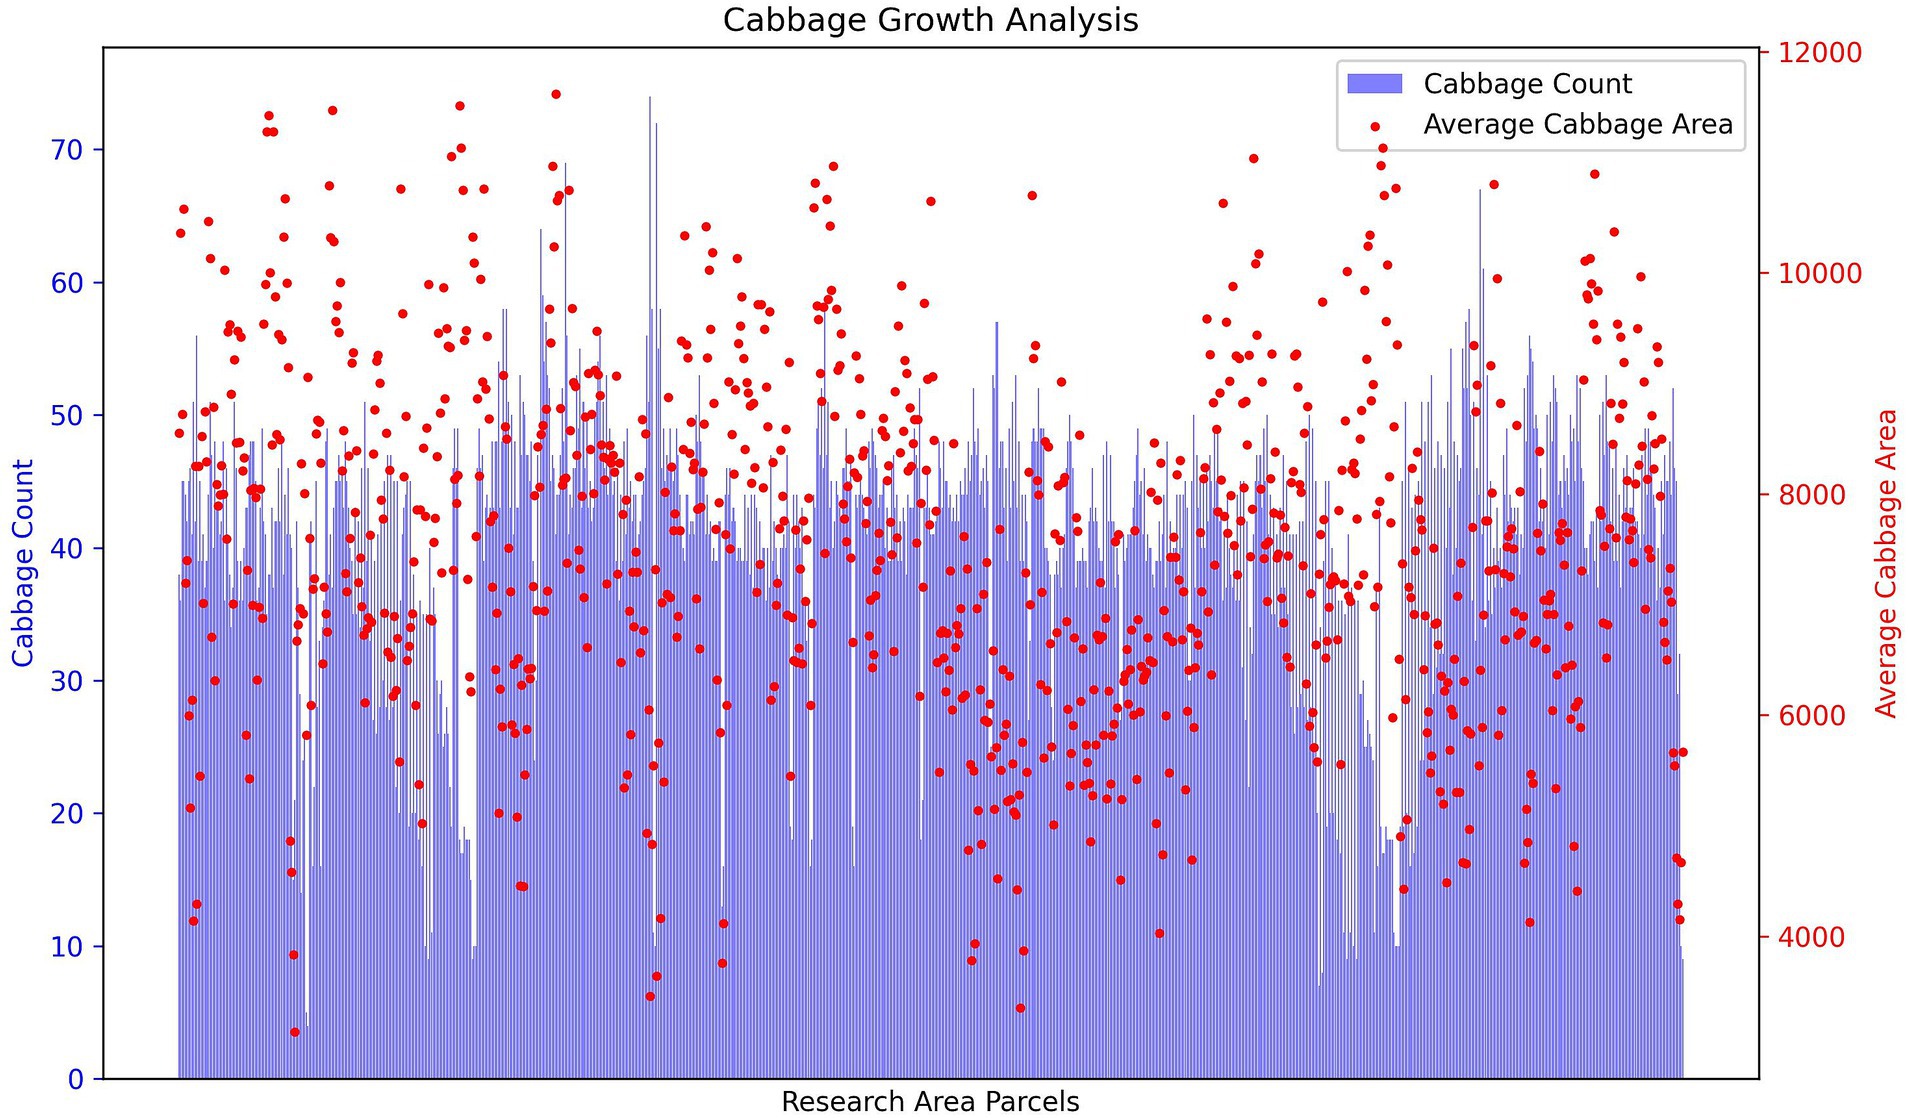
Analyzing plant growth status is crucial for a holistic assessment of crop development. In this study, the YOLOv8-Seg model is deployed for instance segmentation of Chinese cabbage plants within the research area, facilitating the acquisition of detailed growth data for individual plants and subsequent statistical analyses. The dataset comprises 640 × 640 pixel image patches derived from the original imagery, with Figure 11 depicting the distribution of Chinese cabbage quantities and their average leaf areas across various image patches.
The horizontal axis of Figure 11 delineates different plots, while the vertical axis quantifies both the number of Chinese cabbages and their average leaf area per plot. The data indicates a consistent planting density, with most plots hosting between 40 to 50 Chinese cabbages. Nevertheless, a pronounced variability in average leaf area, ranging from 400 to 10,000, points to diverse growth conditions across the area. A smaller leaf area might signal suboptimal growth, potentially due to adverse environmental conditions or insufficient nutrients, whereas a larger leaf area suggests robust growth, likely a result of favorable conditions and adequate nutrient availability.
This methodical examination and quantification of Chinese cabbage growth enable informed adjustments to farming practices, such as fine-tuning fertilization and irrigation strategies. By tailoring these practices to the precise needs of the crops, based on observed growth patterns, it’s possible to optimize nutrient and water distribution, thereby bolstering the efficiency of crop growth and increasing yields.
Delayed plant growth not only compromises crop yield and quality but also elevates the risk of pest invasion. Thus, the swift identification and remediation of growth issues are critical for improving both yield and quality. To examine the diversity in plant growth within the research area more closely, this study curated Chinese cabbage images from the dataset that exemplify conditions of optimal growth, waterlogging effects, and average growth for in-depth analysis. Utilizing instance segmentation, we measured individual Chinese cabbage leaf sizes to compute the average leaf area per plant across different plots. This average leaf area then serves as a benchmark to identify plants experiencing stunted growth, which are subsequently highlighted in the visual presentations. These observations reveal that the affected plants display signs of inhibited growth and reduced leaf size, with a noticeable concentration in areas suffering from waterlogging or insufficient soil nutrients, as shown in Figure 12.
The findings underscore the significant impact of environmental conditions on plant growth, particularly affecting those with hindered development. Accordingly, we propose the implementation of targeted improvement strategies for specific plots. Measures such as enhancing drainage systems and fine-tuning fertilization practices are suggested to foster plant health and vitality. By addressing the distinct needs of each plot based on observed growth patterns, these interventions aim to boost overall crop yield and quality, ensuring healthier and more resilient plant development.
4 Discussion
4.1 Performance analysis of different model scales
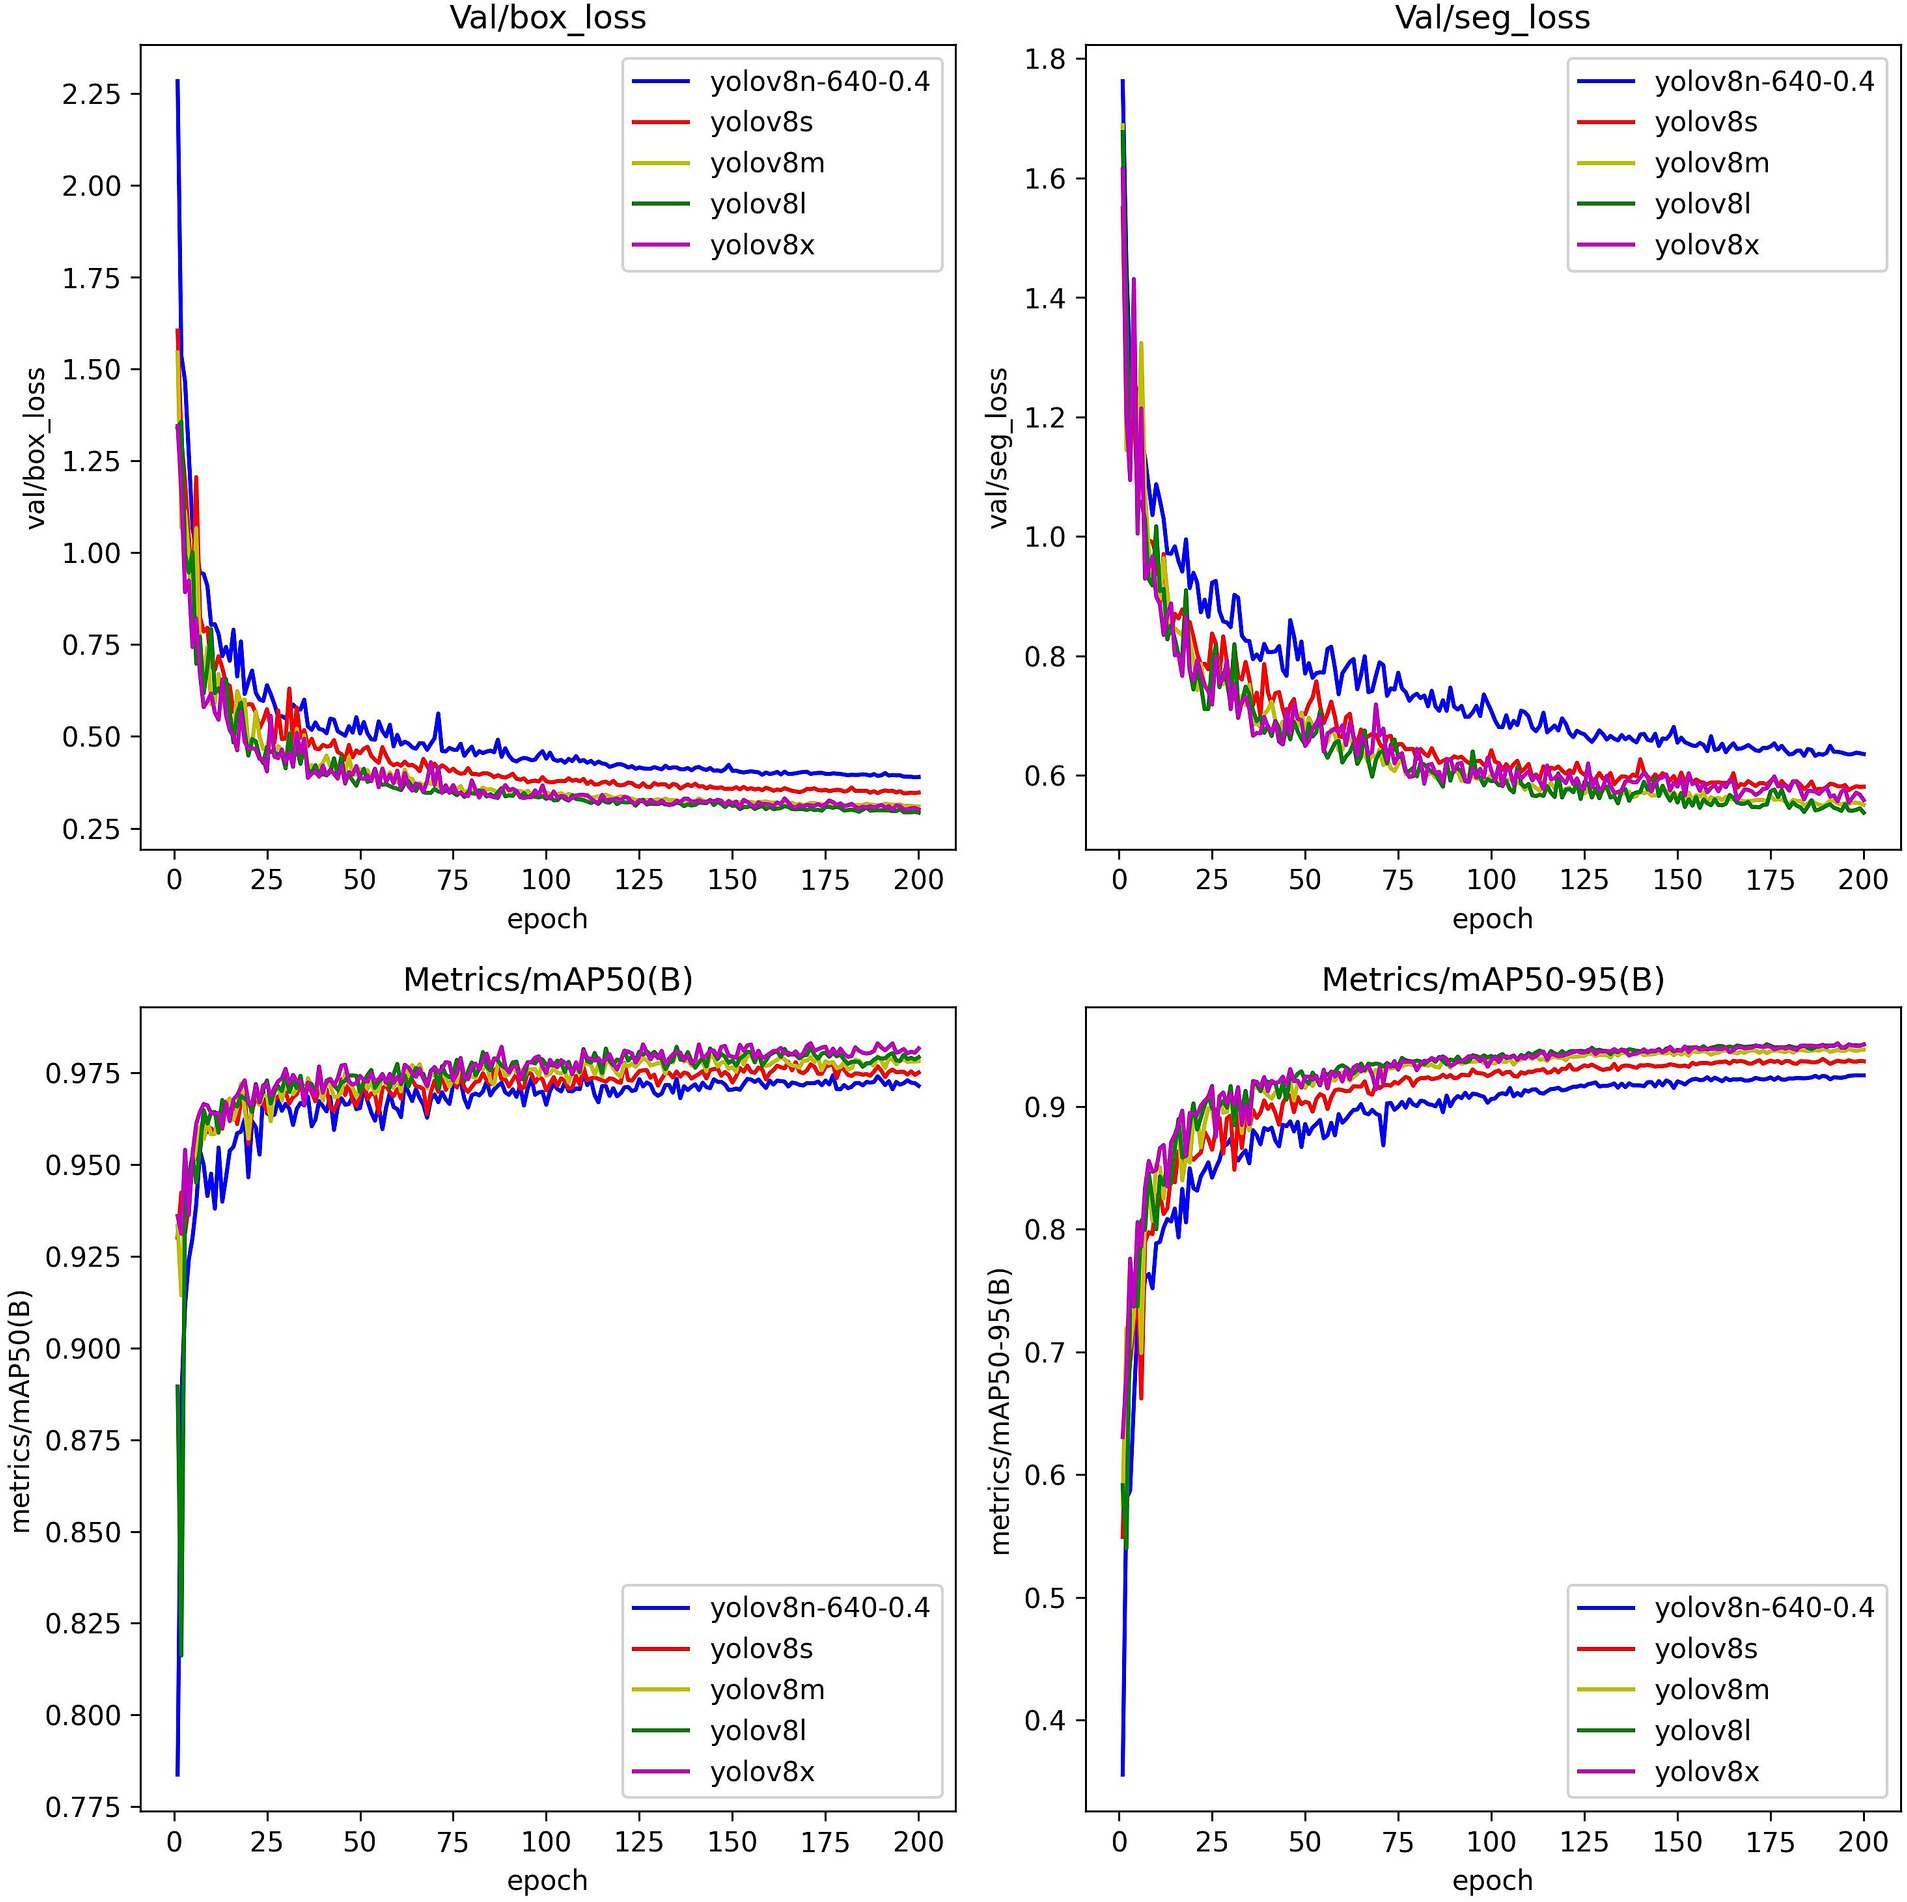
Based on the current experimental outcomes, the YOLOv8-Seg model emerges as the top performer in segmentation accuracy across all spectral band combinations, showcasing its peak effectiveness particularly within the RGB spectrum. This model is designed with five distinct scale variations—n, s, m, l, x—to cater to a diverse range of detection, segmentation, and classification demands across different classes. To delve deeper into the capabilities of YOLOv8-Seg, this study undertook a comparative evaluation of its five scale models against the tailored dataset. The findings from this detailed analysis are systematically compiled in Table 6, providing a comprehensive overview of each model’s segmentation prowess.
Within the array of YOLOv8-Seg configurations, the ‘n’ model distinguishes itself by having the minimal parameter count, positioning it as the streamlined option ideal for high-speed processing in scenarios where computational resources are limited. Despite this, its segmentation precision is slightly diminished compared to its counterparts. On the other hand, the ‘x’ model stands at the apex of complexity, boasting the highest parameter tally, engineered for deep and comprehensive segmentation tasks, albeit with significant computational demands.
The ‘s’ variant strikes a balance, enhancing segmentation accuracy beyond the ‘n’ model, tailored for moderately complex, real-time segmentation tasks. The ‘m’ model, of intermediate size, caters well to standard computing setups but might lag behind the more elaborate models in handling intricate segmentation challenges.
Models ‘l’ and ‘x’ excel in delivering meticulous segmentation accuracy but do so at the expense of processing speed, necessitating robust computational support. Such requirements render them less viable for environments with stringent resource limitations.
Figure 13 provides a visual juxtaposition of the loss functions and accuracies for these models, highlighting the practicality and efficiency of the ‘n’ model. It adeptly navigates the demands of accurate, real-time segmentation within our custom dataset, proving to be a cost-effective solution that minimizes training overhead while maintaining performance integrity.
4.2 Performance analysis of different spatial resolutions
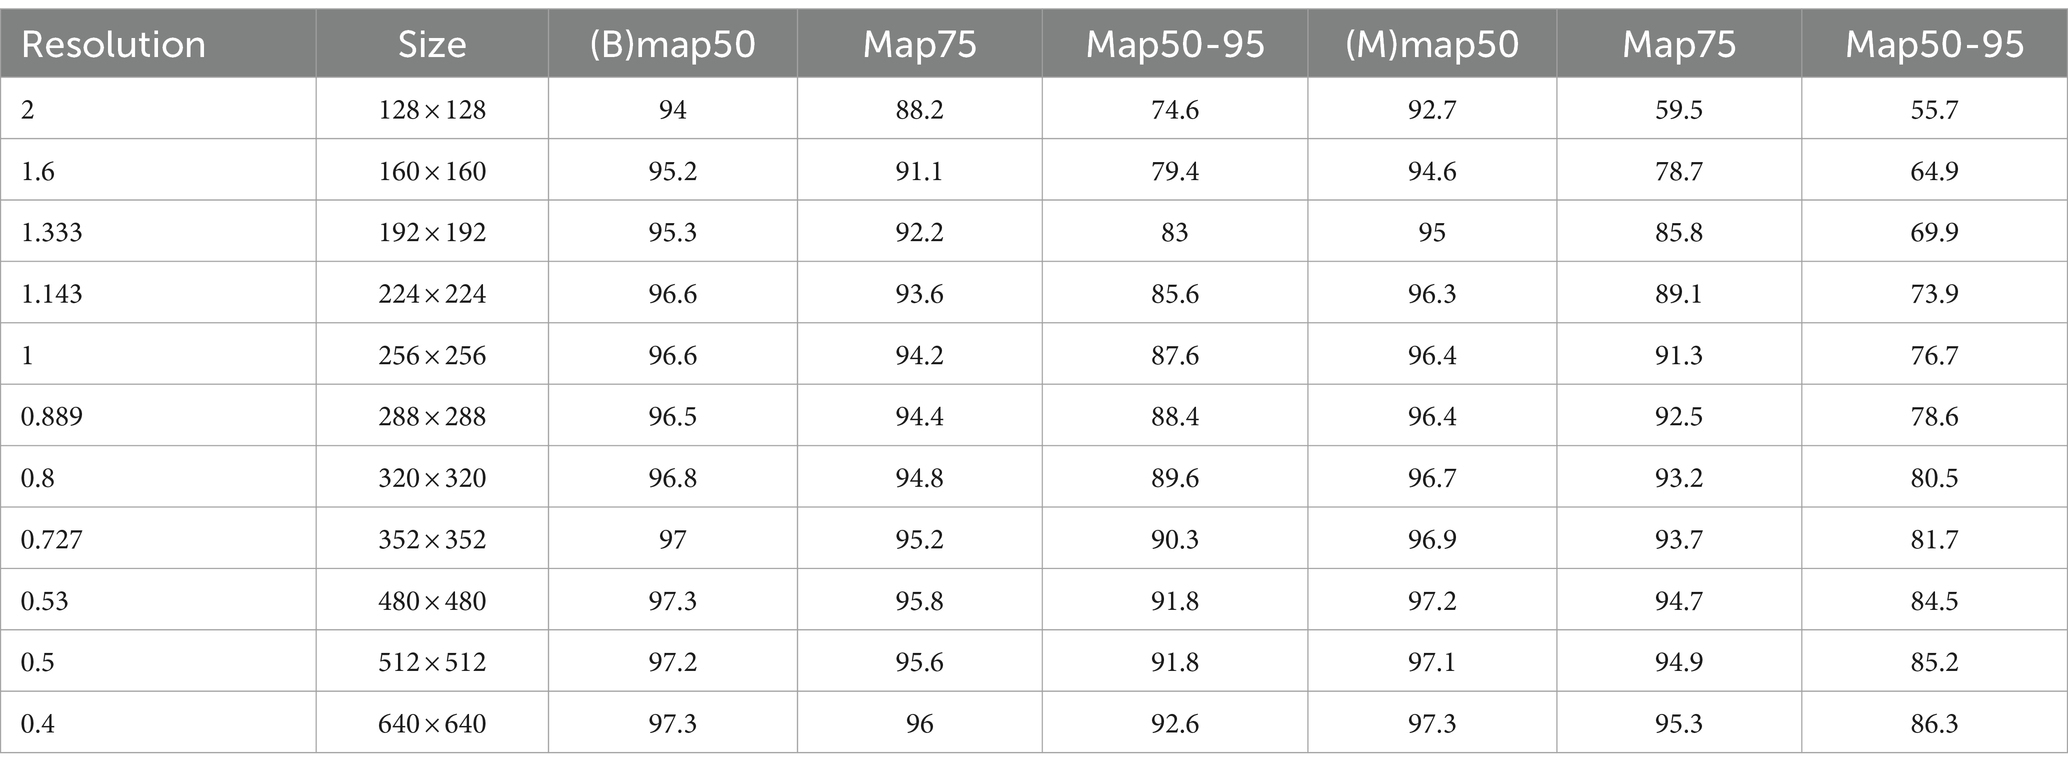
This study employs a resolution of 640 × 640 pixels for image processing. Given the potential impact of resolution on the model’s segmentation capability, an extensive evaluation was conducted to ascertain the YOLOv8n-Seg model’s performance across a spectrum of spatial resolutions within the RGB band. This approach aimed to discern how varying spatial resolutions affect the model’s precision and efficacy. To achieve this, the study meticulously examined segmentation outcomes at 11 distinct resolution levels. The comprehensive results of these experiments, offering a granular view of the model’s adaptability to different image spatial resolutions, are detailed in Table 7.
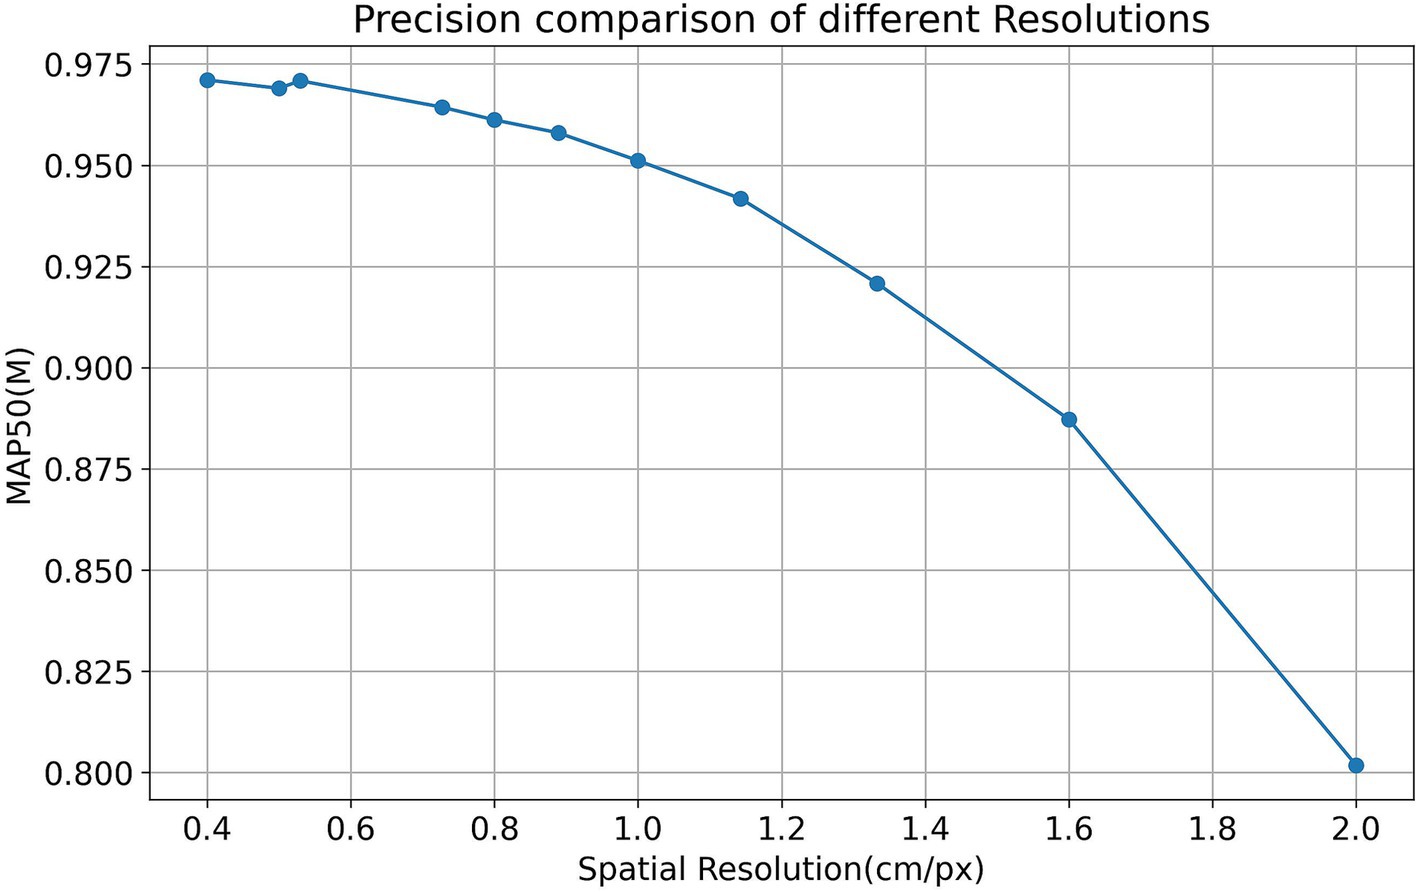
The experiments reveal that images of higher resolution are imbued with more detailed information, facilitating the model’s ability to precisely represent and capture object features. Conversely, lower-resolution images may lack essential details, posing challenges to effective segmentation. According to the data in Table 7, there’s a clear trend where the YOLOv8n-Seg model’s segmentation accuracy diminishes as image spatial resolution decreases, particularly noticeable when the resolution is reduced to 2 cm/px. In contrast, the model’s performance enhances in tandem with the improvement in image resolution.
Figure 14 illustrates the model’s accuracy across various spatial resolutions, indicating that the YOLOv8n-Seg model sustains commendable segmentation accuracy even at reduced spatial resolutions, especially within the range of 1.333 to 1.143 cm/px. This suggests an optimal balance between resolution and segmentation performance, highlighting the model’s robustness in handling images with varying levels of detail.
5 Conclusion
This study focuses on the YOLOv8-Seg algorithm, comparing its performance in extracting single Chinese cabbage from UAV multispectral imagery with other instance segmentation models, including YOLOv5-Seg, YOLOv6-Seg, YOLO11-Seg, Mask R-CNN, PointRend, Cascade Mask R-CNN and RTMDet. Additionally, we evaluate the performance of YOLO series algorithms across different spectral band combinations (RGB, NRG, NER) and analyze the effects of varying model scales and spatial resolutions on segmentation accuracy and crop monitoring.
1. SAM for dataset creation: SAM leverages advanced deep learning techniques to automatically identify and generate masks for all objects within an image, significantly enhancing the efficiency of manual labeling by rapidly producing accurate labeled masks. Furthermore, SAM is applicable to a wide range of image types, including standard RGB, multispectral, and infrared, thereby effectively addressing dataset scarcity in existing instance segmentation tasks.
2. Comparison of segmentation algorithms: Comparative analysis indicates that the YOLO series consistently outperforms other mainstream segmentation algorithms. Specifically, YOLOv8-Seg achieved superior segmentation accuracy, with its mAP0.5:0.95 surpassing those of Mask R-CNN, Cascade Mask R-CNN, PointRend, RTMDet, YOLOv5-Seg, YOLOv6-Seg, and YOLO11-Seg by 4.1, 5.2, 2.2, 8.2, 0.4, 1.0, and 2.7%, respectively. Although YOLOv6-Seg performed relatively weaker within the YOLO series, it still outperformed Cascade Mask R-CNN, Mask R-CNN, and PointRend. Furthermore, visual analysis under different growth conditions showed that YOLOv8-Seg maintained superior segmentation capabilities and preserved the morphological integrity of Chinese cabbage better than other algorithms.
3. Impact of spectral band combinations: the YOLO series algorithms exhibited different levels of segmentation accuracy across various spectral band combinations in UAV multispectral data. YOLOv8-Seg consistently achieved the highest segmentation accuracy, particularly in the RGB band, reaching 86.3% on the mAP50-95 metric. The strong performance of the RGB band highlights its inherent advantage in capturing rich color information, which aids in accurately identifying individual plants. Additionally, the success of using RGB imagery demonstrates the feasibility of deploying simple RGB drones as a cost-effective alternative to multispectral drones, enhancing the practicality of this approach for agricultural applications.
4. Model Scales and spatial resolution analysis: analysis of different YOLOv8-Seg model scales and spatial resolutions reveals significant trade-offs between computational efficiency and segmentation accuracy. The ‘n’ model, characterized by minimal parameters, is ideal for scenarios with limited computational resources, while the ‘x’ model offers the highest segmentation accuracy, making it suitable for more complex tasks. Despite these differences, YOLOv8n-Seg maintains satisfactory accuracy even at lower resolutions (1.333 to 1.143 cm/px), underscoring its robustness and adaptability in various agricultural scenarios.
This study demonstrates the significant potential of YOLOv8-Seg combined with UAV technology for agricultural applications, particularly in precision agriculture and crop monitoring. The algorithm’s ability to maintain high accuracy across different spectral bands, model scales, and spatial resolutions underscores its versatility and robustness. Future work will focus on extending this approach to other crop types, such as vegetables and fruits, to broaden its applicability. Additionally, we aim to refine the model’s architecture by integrating multi-scale feature extraction, enhancing accuracy for different object sizes. We also plan to optimize the model for more efficient processing of UAV data, making it suitable for large-scale agricultural monitoring. These improvements will support more precise and efficient decision-making in agricultural production.
Data availability statement
The raw data supporting the conclusions of this article will be made available by the authors, without undue reservation.
Author contributions
XY: Conceptualization, Methodology, Validation, Visualization, Writing – original draft. HY: Conceptualization, Methodology, Supervision, Writing – review & editing. TG: Software, Writing – review & editing. RM: Software, Writing – review & editing. PL: Software, Writing – review & editing.
Funding
The author(s) declare financial support was received for the research, authorship, and/or publication of this article. This research was funded by National Natural Science Foundation of China (U1304402, 41977284) and Laboratory of Mine Spatio-Temporal Information and Ecological Restoration, MNR (no. KLM202310).
Acknowledgments
The authors extend their gratitude to the creators of the referenced works, the editorial team, and the reviewers for their insightful comments and suggestions.
Conflict of interest
The authors declare that the research was conducted in the absence of any commercial or financial relationships that could be construed as a potential conflict of interest.
Publisher’s note
All claims expressed in this article are solely those of the authors and do not necessarily represent those of their affiliated organizations, or those of the publisher, the editors and the reviewers. Any product that may be evaluated in this article, or claim that may be made by its manufacturer, is not guaranteed or endorsed by the publisher.
References
Arruda Huggins de Sá Leitão, D., Sharma, A. K., Singh, A., and Sharma, L. K. (2023). Yield and plant height predictions of irrigated maize through unmanned aerial vehicle in North Florida. Comput. Electron. Agric. 215:108374. doi: 10.1016/j.compag.2023.108374
Arun, B., Sayantan, S., Kumar, H. S., Jasdeep, S., JungJin, K., Tian, Z., et al. (2023). A support vector machine and image processing based approach for counting open cotton bolls and estimating lint yield from UAV imagery. Smart Agric. Technol. 3:100140. doi: 10.1016/j.atech.2022.100140
Cao, Y., Pang, D., Zhao, Q., Yan, Y., Jiang, Y., Tian, C., et al. (2024). Improved YOLOv8 -GD deep learning model for defect detection in electroluminescence images of solar photovoltaic modules. Eng. Appl. Artif. Intell. 131:107866. doi: 10.1016/j.engappai.2024.107866
Casas, G. G., Ismail, Z. H., Limeira, M. M. C., Silva, A. A. L. D., and Leite, H. G. (2023). Automatic detection and counting of stacked eucalypt timber using the YOLOv8 model. Forests 14:2369. doi: 10.3390/f14122369
Chivasa, W., Mutanga, O., and Burgueno, J. (2021). UAV-based high-throughput phenotyping to increase prediction and selection accuracy in maize varieties under artificial MSV inoculation. Comput. Electron. Agric. 184:106128. doi: 10.1016/j.compag.2021.106128
Dietenberger, S., Mueller, M. M., Bachmann, F., Nestler, M., Ziemer, J., Metz, F., et al. (2023). Tree stem detection and crown delineation in a structurally diverse deciduous Forest combining leaf-on and leaf-off UAV-SfM data. Remote Sens. (Basel) 15:4366. doi: 10.3390/rs15184366
Du, Y., Liu, X., Yi, Y., and Wei, K. (2023). Optimizing road safety: advancements in lightweight YOLOv8 models and GhostC2f Design for Real-Time Distracted Driving Detection. Sensors (Basel) 23:8844. doi: 10.3390/s23218844
Fen, C., Haojie, Z., Dar, R., de Voorde, V., Tim, O. B., Tao, F., et al. (2023). Mapping center pivot irrigation systems in global arid regions using instance segmentation and analyzing their spatial relationship with freshwater resources. Remote Sens. Environ. 297:113760. doi: 10.1016/j.rse.2023.113760
Guan, H., Deng, H., Ma, X., Zhang, T., Zhang, Y., Zhu, T., et al. (2024). A corn canopy organs detection method based on improved DBi-YOLOv8 network. Eur. J. Agron. 154:127076. doi: 10.1016/j.eja.2023.127076
Gui, B., Bhardwaj, A., and Sam, L. (2024). Evaluating the efficacy of segment anything model for delineating agriculture and urban green spaces in multiresolution aerial and Spaceborne remote sensing images. Remote Sens (Basel) 16:414. doi: 10.3390/rs16020414
Herrera, W. F. B., Paguay, C. A. M., Tapias, D. F. R., and Bonilla, G. A. E. (2024). Effect of mineral fertilization and microbial inoculation on cabbage yield and nutrition: a field experiment. Agronomy 14:210. doi: 10.3390/agronomy14010210
Huang, F., Li, Y., Liu, Z., Gong, L., and Liu, C. (2024). A method for calculating the leaf area of Pak Choi based on an improved mask R-CNN. Agriculture 14:101. doi: 10.3390/agriculture14010101
Jayathunga, S., Pearse, G. D., and Watt, M. S. (2023). Unsupervised methodology for large-scale tree seedling mapping in diverse forestry settings using UAV-based RGB imagery. Remote Sens. (Basel) 15:5276. doi: 10.3390/rs15225276
Jia, R., Lv, B., Chen, J., Liu, H., Cao, L., and Liu, M. (2023). Underwater object detection in marine ranching based on improved YOLOv8. J. Mar. Sci. Eng. 12:55. doi: 10.3390/jmse12010055
Jidong, L., Hao, X., Liming, X., Yuwan, G., Hailong, R., and Ling, Z. (2023). An image rendering-based identification method for apples with different growth forms. Comput. Electron. Agric. 211:108040. doi: 10.1016/j.compag.2023.108040
Julien, C., Adan, M., Hervé, G., Erick, M., Pierre, B., and Alexis, J. (2020). Instance segmentation for the fine detection of crop and weed plants by precision agricultural robots. Appl Plant Sci 8:e11373. doi: 10.1002/aps3.11373
Kimmelshue, C. L., Goggi, S., and Moore, K. J. (2022). Seed size, planting depth, and a perennial groundcover system effect on corn emergence and grain yield. Agronomy (Basel) 12. doi: 10.3390/agronomy12020437
Li, Y., Fan, Q., Huang, H., Han, Z., and Gu, Q. (2023). A modified YOLOv8 detection network for UAV aerial image recognition. Drones-Basel 7:304. doi: 10.3390/drones7050304
Li, S., Huang, H., Meng, X., Wang, M., Li, Y., and Xie, L. (2023). A glove-wearing detection algorithm based on improved YOLOv8. Sensors (Basel) 23:9906. doi: 10.3390/s23249906
Li, W., Niu, Z., Chen, H., Li, D., Wu, M., and Zhao, W. (2016). Remote estimation of canopy height and aboveground biomass of maize using high-resolution stereo images from a low-cost unmanned aerial vehicle system. Ecol. Indic. 67, 637–648. doi: 10.1016/j.ecolind.2016.03.036
Liu, M., Liu, J., and Hu, H. (2024). A novel deep learning network model for extracting Lake water bodies from remote sensing images. Appl. Sci. 14:1344. doi: 10.3390/app14041344
Liu, J., Xiang, J., Jin, Y., Liu, R., Yan, J., and Wang, L. (2021). Boost precision agriculture with unmanned aerial vehicle remote sensing and edge intelligence: a survey. Remote Sens. 13:4387. doi: 10.3390/rs13214387
Liu, G., Yan, Y., and Meng, J. (2024). Study on the detection technology for inner-wall outer surface defects of the automotive ABS brake master cylinder based on BM-YOLOv8. Meas. Sci. Technol. 35:055109. doi: 10.1088/1361-6501/ad25df
Lu, A., Ma, L., Cui, H., Liu, J., and Ma, Q. (2023). Instance segmentation of Lotus pods and stalks in unstructured planting environment based on improved YOLOv5. Agriculture 13. doi: 10.3390/agriculture13081568
Lu, J., Zhu, M., Ma, X., and Wu, K. (2024). Steel strip surface defect detection method based on improved YOLOv5s. Biomimetics (Basel) 9:28. doi: 10.3390/biomimetics9010028
Maimaitijiang, M., Sagan, V., Sidike, P., Hartling, S., Esposito, F., and Fritschi, F. B. (2020). Soybean yield prediction from UAV using multimodal data fusion and deep learning. Remote Sens. Environ. 237:111599. doi: 10.1016/j.rse.2019.111599
Santana, D. C., Cotrim, M. F., Flores, M. S., Rojo Baio, F. H., Shiratsuchi, L. S., Silva Junior, C. A. D., et al. (2021). UAV-based multispectral sensor to measure variations in corn as a function of nitrogen topdressing. Remote Sens. Appl. 23:100534. doi: 10.1016/j.rsase.2021.100534
Sara Tokhi Arab, A. B., Ryozo, N. C., Shusuke, M. C., and Tofael, A. C. (2021). Prediction of grape yields from time-series vegetation indices using satellite remote sensing and a machine-learning approach. Remote Sens. Appl. 22:100485. doi: 10.1016/j.rsase.2021.100485
Schoofs, H., Delalieux, S., Deckers, T., and Bylemans, D. (2020). Fire blight monitoring in pear orchards by unmanned airborne vehicles (UAV) systems carrying spectral sensors. Agronomy 10:615. doi: 10.3390/agronomy10050615
Solimani, F., Cardellicchio, A., Dimauro, G., Petrozza, A., Summerer, S., Cellini, F., et al. (2024). Optimizing tomato plant phenotyping detection: boosting YOLOv8 architecture to tackle data complexity. Comput. Electron. Agric. 218:108728. doi: 10.1016/j.compag.2024.108728
Soylu, B. E., Guzel, M. S., Bostanci, G. E., Ekinci, F., Asuroglu, T., and Acici, K. (2023). Deep-learning-based approaches for semantic segmentation of natural scene images: a review. Electronics 12:2730. doi: 10.3390/electronics12122730
Su, P., Li, H., Wang, X., Wang, Q., Hao, B., Feng, M., et al. (2023). Improvement of the YOLOv5 model in the optimization of the Brown spot disease recognition algorithm of kidney bean. Plants (Basel) 12:3765. doi: 10.3390/plants12213765
Sun, Z., Li, Q., Jin, S., Song, Y., Xu, S., Wang, X., et al. (2022). Simultaneous prediction of wheat yield and grain protein content using multitask deep learning from time-series proximal sensing. Plant Phenomics 2022:7948. doi: 10.34133/2022/9757948
Sylvain Jay, A. B., Nathalie, G. A., Julien, M. A., Fabienne, M. C., Ryad, B. A., Gilles, R. A., et al. (2017). Estimating leaf chlorophyll content in sugar beet canopies using millimeter- to centimeter-scale reflectance imagery. Remote Sens. Environ. 198, 173–186. doi: 10.1016/j.rse.2017.06.008
Thenmozhi, K., and Reddy, U. S. (2023). Detection of fall armyworm (spodoptera frugiperda) in field crops based on mask R-CNN. SIViP 17, 2689–2695. doi: 10.1007/s11760-023-02485-3
Wang, X., and Liu, J. (2024). Vegetable disease detection using an improved YOLOv8 algorithm in the greenhouse plant environment. Sci. Rep. 14:4261. doi: 10.1038/s41598-024-54540-9
Wang, R., Tuerxun, N., and Zheng, J. (2024). Improved estimation of SPAD values in walnut leaves by combining spectral, texture, and structural information from UAV-based multispectral image. Sci. Hortic. 328:112940. doi: 10.1016/j.scienta.2024.112940
Wang, H., Yang, H., Chen, H., Wang, J., Zhou, X., and Xu, Y. (2024). A remote sensing image target detection algorithm based on improved YOLOv8. Appl. Sci. 14:1557. doi: 10.3390/app14041557
Wilke, N., Siegmann, B., Postma, J. A., Muller, O., Krieger, V., Pude, R., et al. (2021). Assessment of plant density for barley and wheat using UAV multispectral imagery for high-throughput field phenotyping. Comput. Electron. Agric. 189:106380. doi: 10.1016/j.compag.2021.106380
Wu, Y., Han, Q., Jin, Q., Li, J., and Zhang, Y. (2023). LCA-YOLOv8-Seg: an improved lightweight YOLOv8-Seg for real-time pixel-level crack detection of dams and bridges. Appl. Sci. 13:583. doi: 10.3390/app131910583
Wu, Y., Liao, T., Chen, F., Zeng, H., Ouyang, S., and Guan, J. (2024). Overhead power line damage detection: an innovative approach using enhanced YOLOv8. Electronics 13:739. doi: 10.3390/electronics13040739
Xiang, G., Xuli, Z., Shuai, Y., Runda, Z., Shuaiming, C., Xiaodong, Z., et al. (2023). Maize seedling information extraction from UAV images based on semi-automatic sample generation and mask R-CNN model. Eur. J. Agron. 147:126845. doi: 10.1016/j.eja.2023.126845
Xiao, X., Ming, W., Luo, X., Yang, L., Li, M., Yang, P., et al. (2024). Leveraging multisource data for accurate agricultural drought monitoring: a hybrid deep learning model. Agric. Water Manag. 293:108692. doi: 10.1016/j.agwat.2024.108692
Xie, W., Sun, X., and Ma, W. (2024). A light weight multi-scale feature fusion steel surface defect detection model based on YOLOv8. Meas. Sci. Technol. 35:055017. doi: 10.1088/1361-6501/ad296d
Yang, T., Zhou, S., Xu, A., Ye, J., and Yin, J. (2023). An approach for plant leaf image segmentation based on YOLOV8 and the improved DEEPLABV3+. Plan. Theory Plants (Basel) 12:3438. doi: 10.3390/plants12193438
Yangyang, C., Zuoxi, Z., Yuan, H., Xu, L., Shuyuan, L., Borui, X., et al. (2023). Case instance segmentation of small farmland based on mask R-CNN of feature pyramid network with double attention mechanism in high resolution satellite images. Comput. Electron. Agric. 212:108073. doi: 10.1016/j.compag.2023.108073
Ying, Z., Kechen, S., Wenqi, C., Hang, R., and Yunhui, Y. (2023). MFS enhanced SAM: achieving superior performance in bimodal few-shot segmentation. J. Vis. Commun. Image Represent. 97:103946. doi: 10.1016/j.jvcir.2023.103946
Yue, X., Qi, K., Na, X., Zhang, Y., Liu, Y., and Liu, C. (2023). Improved YOLOv8-Seg network for instance segmentation of healthy and diseased tomato plants in the growth stage. Agriculture 13:1643. doi: 10.3390/agriculture13081643
Zhang, W., Chen, X., Qi, J., and Yang, S. (2022). Automatic instance segmentation of orchard canopy in unmanned aerial vehicle imagery using deep learning. Front. Plant Sci. 13:13. doi: 10.3389/fpls.2022.1041791
Zhang, Z., Tan, L., and Tiong, R. L. K. (2024). Ship-fire net: an improved YOLOv8 algorithm for ship fire detection. Sensors (Basel, Switzerland) 24:727. doi: 10.3390/s24030727
Keywords: multispectral image, deep learning, SAM, instance segmentation, UAV (unmanned aerial vehicle)
Citation: Yuan X, Yu H, Geng T, Ma R and Li P (2024) Enhancing sustainable Chinese cabbage production: a comparative analysis of multispectral image instance segmentation techniques. Front. Sustain. Food Syst. 8:1433701. doi: 10.3389/fsufs.2024.1433701
Edited by:
Pushp Sheel Shukla, Sea6 Energy Private Limited, IndiaReviewed by:
Zhenguo Zhang, Xinjiang Agricultural University, ChinaZari Farhadi, University of Tabriz, Iran
Copyright © 2024 Yuan, Yu, Geng, Ma and Li. This is an open-access article distributed under the terms of the Creative Commons Attribution License (CC BY). The use, distribution or reproduction in other forums is permitted, provided the original author(s) and the copyright owner(s) are credited and that the original publication in this journal is cited, in accordance with accepted academic practice. No use, distribution or reproduction is permitted which does not comply with these terms.
*Correspondence: Haiyang Yu, eXVoYWl5YW5nQGhwdS5lZHUuY24=
 Xinru Yuan
 Haiyang Yu
 Tingting Geng
 Ruopu Ma
 Pengao Li