 Lei Zhang†
 Yao Fan
- State Key Laboratory Breeding Base of Green Chemistry-Synthesis Technology, College of Chemical Engineering, Zhejiang University of Technology, Hangzhou, China
Introduction: The presence of excessive heavy metal content in food poses potential risks to human health.
Methods: This paper presents the fabrication of a novel type of Carbon Dots (CDs) using green tea residue as a carbon source, which can be applied for simultaneous detection of Hg2+, Pb2+, Fe3+, and Cu22+ through particle swarm optimization (PSO) based optimized variable-weighted least-squares support vector machine (VWLS-SVM) model and the partial least squares discriminant analysis (PLSDA) method.
Results and Discussion: The utilization of PSO-VWLS-SVM model discovered and verified two fluorescence enhancement markers of CDs, namely isoquercitrin and 5-methyl furfural in green tea residues. By employing PLSDA, simultaneous qualitative and quantitative determination of these four metal ions was achieved. These CDs are capable of detecting four types of metal ions at low concentrations even when there are high concentrations of other metal ions and amino acids. More importantly, the CDs were successfully applied for the detection of Hg2+, Pb2+, Fe3+, and Cu2+ in real food samples. The recovery rates of four metal ions spiked into five different matrices were found to be the range of 99.1–101.3%, while both intra-day and inter-day relative standard deviations remained below 0.5% for all samples. This study on chemometrics-assisted exploration into formation mechanisms of endogenous CDs provides theoretical guidance for enhancing their fluorescence properties and expanding their application in heavy metal detection in food.
1 Introduction
Heavy metal ions are closely linked to the increasingly severe food issues and are also recognized as significant health concerns due to their accumulation and non-biodegradability. The food safety and human health problems caused by heavy metal ions have prompted researchers to develop straightforward and sensitive methods for the simultaneous determination of these ions. Conventional detection methods for heavy metal ions include electrochemistry (Li et al., 2022a,b; Zhang C. et al., 2023; Gao et al., 2024), high-performance ion chromatograph (Li K.-F. et al., 2022), inductively coupled plasma MS spectrometry (ICPMS) (Xu et al., 2022; Jiang et al., 2023; Tanen et al., 2023) and atomic absorption spectroscopy (Danet et al., 2009). However, the majority of these techniques necessitate costly equipment, intricate pre-processing protocols, and highly-trained operators, thereby significantly limiting their practical implementation. The fluorescence spectroscopy method using carbon quantum dots as sensors is widely used for the detection of heavy metal ions, due to its fast detection speed and low detection limit. The CDs performed from aba bean seeds (Fallah et al., 2023) and pigeon manure (Baskaya et al., 2022) only had the ability to detect Hg2+. The CDs synthesized from Siberian elm seeds (Zhang et al., 2022), Natural Rubber (Phetcharee et al., 2022), bread waste (Gokul Eswaran et al., 2022), Bilimbi (Venugopalan and Vidya, 2022) could be used for the detection of Fe3+, Mg2+, Pb2+,Cu2+, respectively. However, these methods merely focus on the qualitative and quantitative characterization of one or two kinds of heavy metal ions which may lack of a wide range of applications. Consequently, it continues to be an immense task to devise a method that is both convenient and highly effective in detecting multiple heavy metal ions simultaneously in food.
As a type of newly emerging nano-materials, carbon dots (CDs) have been wildly utilized in analytical and bioanalytical chemistry, including cell imaging (Chen Y. et al., 2020; Chen H. et al., 2024; Wang Y. et al., 2024; Zhao H. et al., 2024), sensor (Chen et al., 2023; Saad et al., 2024; Tang et al., 2024), electroanalysis (Roushani et al., 2017; Hua et al., 2019; Zhan et al., 2021; Torrinha et al., 2022), and photocatalysis (Nayana and Sunitha, 2024) owing to their remarkable characteristics including minimal toxicity, favorable solubility in water, excellent photostability, and good biocompatibility (Hallaji et al., 2022; Liu H. et al., 2024). Meanwhile, significant research efforts have been dedicated to utilizing bio-resources as precursors for synthesizing CDs through hydrothermal treatment in recent years (Guo et al., 2022; Shi et al., 2022; Hou et al., 2023; Liu et al., 2023; Zhang D. et al., 2023; Chen J. et al., 2024; Liu T. et al., 2024). This is due to the cost-effectiveness, environmental friendliness, and biocompatibility of bio-resources. Bio-resources contain a high concentration of carbohydrates, such as sugar, polysaccharides, and starch, which serve as carbon sources for CD fabrication. Additionally, these carbohydrates are rich in oxygen (O), which can enhance the possess functional groups containing oxygen (Shen et al., 2017). These surface functional groups of CDs are essential for enhancing their solubility in water. Furthermore, various nitrogen and sulfur-doped compounds present in bio-resources, such as amino acids and proteins, impart high photoluminescence to CDs. Chen et al. utilized the Bird’s nest as precursors to synthesize a novel type of CDs using the hydrothermal method (Chen J. et al., 2024). Mohamed et al. synthesized CDs via manufactured milk power and methionine (Mohamed et al., 2023). Additionally, there are other bio-resource that can be used as precursors for CDs, such as Andrographis paniculata (Zhang D. et al., 2023), wild lemon (Venugopalan and Vidya, 2023), manufactured milk powder (Mohamed et al., 2023), Osmanthus leaves (Liu et al., 2023), Flammulina velutipes (Hou et al., 2023), wheat straw (Shi et al., 2022), hawthorn (Zhang et al., 2021), palm powder (Zhu et al., 2020), Passiflora edulia Sims (Wang et al., 2020), millet (Guo et al., 2022). Green tea, one of China’s most renowned teas, is abundant in active substances including compounds including encompassing chlorophyll, amino acids, tea polyphenols, and vitamins (Cheng et al., 2008; Jia et al., 2022; Wang et al., 2022; Cui et al., 2023; Li et al., 2023; Shan et al., 2023; Shaukat et al., 2023; Huang et al., 2024; Shan et al., 2024). The residual tea residue left after consumption also retains certain components and serves as an exceptional precursor for synthesizing CDs. However, there has been limited research conducted in this area thus far.
Compared with the traditional fluorescence analytical methods that solely on the measurement of one single peak, the utilization of a particle swarm optimization (PSO) based optimized variable-weighted least-squares support vector machine (VWLS-SVM) model (Fan et al., 2016) enables the extraction of all variables present in the fluorescence spectra for the achievement of more accurate quantitative results and a wider quantitative range. On the other hand, As a widely applied technique in different domains, including food analysis and pesticide residues detection (Lohumi et al., 2015; Apetrei and Apetrei, 2016; Chen H. et al., 2020), partial least squares discriminant analysis (PLSDA) model has demonstrated its effectiveness as a classical approach for pattern recognition of different kinds of trace and similar substances (Lohumi et al., 2015). However, most of the sensing methods currently available can detect only one kind of metal ions, and may not be able to realize multiplex detection of various heavy metal ions. Therefore, extensive work is urgently required to fill this research gap. The CDs derived from green tea residue, in combination with chemometrics, demonstrated significant potential for the simultaneous determination of multiple metal ions.
This study presents a novel class of CDs synthesized using green tea residue as a precursor. By employing a PSO-VWLS-SVM model, the fluorescence intensity of CDs and GC–MS/UPLC-QTOF results of green tea residue were combined to identify two fluorescence enhancement markers for the endogenous CDs. These markers were further confirmed through gain-ability reconstruction experiments. Furthermore, this type of newly prepared CDs has been successfully employed as a novel and powerful fluorescence probe for the qualitative and quantitative characterization of four common heavy metal ions, including Hg2+, Pb2+, Fe3+ and Cu2+. By employing the partial least squares discriminant analysis (PLSDA) method, these distinct heavy metal ions with varying concentrations can be accurately identified with a 100% accuracy rate. And the quantitative range of Hg2+, Pb2+, Fe3+ and Cu2+ are 2 × 10⁻⁷ to 1 × 10⁻⁴ mol L−1, 5 × 10⁻⁶ to l × 10−4 mol L−1, 1 × 10⁻⁷ to l × 10−4 mol L−1 and 1 × 10⁻⁵ to 5 × 10⁻⁴ mol L−1 in real food samples. This approach offers a fresh perspective and guidance for exploring the formation mechanisms of endogenous CDs and their more efficient applications in detecting heavy metal ions in the future.
2 Materials and methods
2.1 Materials
The detail information is listed in Table 1. The amino acids Arginine (Arg), Glutamic acid (Glu), Phenylalanine (Phe), Histidine (His), Isoleucine (Iso), Leucine (Leu), Lysine (Lys), Sarcosine (Sar), Threonine (Thr), Glycine (Gly), Tyrosine (Tyr), Proline (Pro), Valine (Val) and Aspartic acid (Asp) were procured from Yuanye Biological Technology Co., Ltd., along with dialysis bags having a molecular weight cutoff of 3500D. The Green tea samples were supplied by Tea Research Institute of Hangzhou, National Federation of Supply and Marketing Cooperative of China. AgNO3, Pb(NO3)2, CdCl2, FeCl3, CaCl2, Hg(NO3)2, KCl, MgCl2, NaCl, CuCl2, ZnCl2, H2SO4, and quinine sulfate were acquired from Sinopharm Chemical Reagent Co., Ltd.
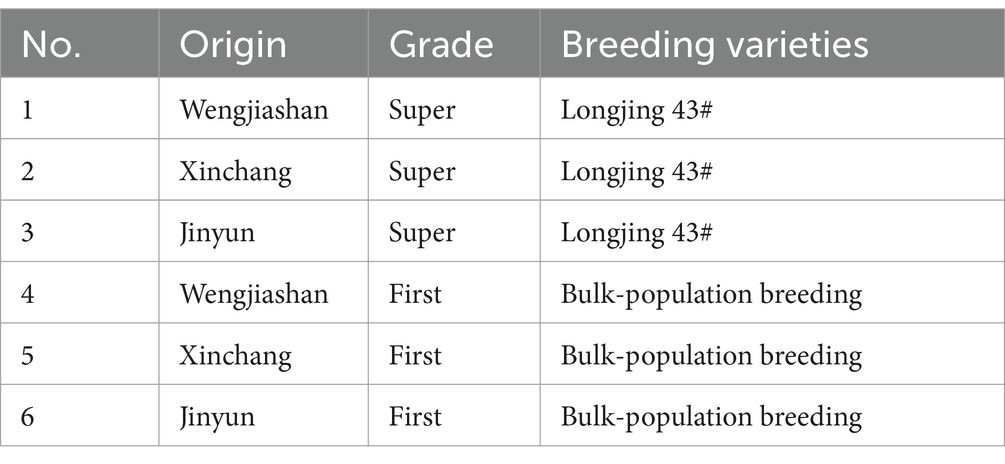
Table 1. A detail information for green tea samples.
2.2 Characterizations
The UV–visible absorption spectra were obtained using a U-3900 UV–visible spectrophotometer (Hitachi). The FL-7000 fluorescence spectrometer (Hitachi) was utilized to analyze the fluorescence spectra. The high-resolution transmission electron microscopy (HRTEM) analysis was conducted on a Tecnai G2 F30 S-Twin microscope (Philips-FEI), operating at 300 kV. The X-ray photoelectron spectroscopy (XPS) analysis was performed on conducted using a VG Thermo ESCALAB 250 spectrometer (VG Scientific) at an operating power of 120 W. The analysis of Fourier-transformed infrared spectroscopy (FTIR) was performed on catalyst samples weighing 10 mg, using the KBr wafer technique with a NICOLET Is10 FTIR instrument. The calibration of binding energy was performed by referencing it to the carbon 1s line. All solutions utilized in this paper were formulated using ultrapure water provided by a high-purity water gauge manufactured by Mole Company, exhibiting a resistivity of 18.25 MΩ cm. An UPLC system, provided by Agilent Company, was utilized for the purpose of separation and detection using a C18 column (1.7 μm × 4.6 mm × 100 mm). The FLSP920 spectrometer (Edinburgh Instruments) was utilized to obtain fluorescence decay curves. Data acquisition was facilitated using time-correlated single-photon counting (TCSPC) detection techniques, allowing for measurements of both steady-state and lifetime.
2.3 Gas chromatography-MS spectrometry
The green tea residues were analyzed using a GC/MS system (Agilent 7890A & Agilent 5975C; Agilent Technologies Inc.) equipped with a DB-INNOWAX column (60 m × 2.25 mm × 0.25 μm, Agilent Technologies Inc.). The oven’s temperature was set to incrementally rise starting from an initial value of 40°C (maintained for a duration of 6 min) to reach a final temperature of 100°C at a rate of heating equal to 4°C per minute. Subsequently, the temperature was further increased from 100°C to reach a maximum value of 230°C at an accelerated rate of heating equal to 5°C. To obtain the MS spectra, electron-impact ionization technique was employed under specific conditions including an ionization voltage set at 70 eV and maintaining the ion source temperature at precisely measured value of 230°C. The SCAN mode was utilized as the analysis mode for acquiring the MS spectra.
2.4 Ultrahigh-performance liquid chromatography-QTOF-MS spectrometry
The UPLC system utilized in this paper (manufactured by Agilent Company) was equipped with a C18 column measuring 1.7 μm × 4.6 mm × 100 mm. The chromatographic separation was conducted using an aqueous solution containing 0.1% formic acid as the mobile phase A, while employing a blend of acetonitrile, water, and 0.1% formic acid as the mobile phase B. A gradient program was applied over a duration of 20 min at a temperature maintained at 35°C, transitioning from an initial composition of 95% A to a final composition of only 5% A. For the analysis using MS spectrometry in positive-ion mode, the following conditions were set: The dry gas temperature was maintained at 350°C with a flow rate of dry gas set at 12 L·min−1. The curtain gas pressure was kept constant at 40 psi while maintaining the ionization voltage at 3,500V and the protective gas temperature also at 350°C with its flow rate fixed at 10 L·min−1. The scanning range for MS spectrometry covered 50–1,500.
2.5 Synthesis of endogenous CDs
The hydrothermal technique was employed to synthesize fluorescent CDs using tea residue derived from the preparation of green tea. Initially, 0.50 g of green tea was brewed with hot water at 80°C for 30 s, and the tea infusion was discarded. This process was repeated three times. Subsequently, the acquired tea residue was placed in a high-pressure reactor containing 20 mL ultrapure water. The mixture underwent a reaction at a temperature of 200°C for 3 h. After cooling the reaction vessel to room temperature, the liquid present on top was decanted and centrifuged at a rate of 5,000 r·min−1 for 15 min. The upper clear liquid obtained was later transferred into a dialysis bag (3,500 D) and subjected to an extended dialysis process lasting up to 24 h. Finally, CDs were obtained through freeze-drying and stored in a low-temperature refrigerator.
2.6 Measurement of quantum yield
The determination of the quantum yields (QYs) of the CDs involved a comparison between the integrated fluorescence intensity upon excitation at 320 nm and the corresponding absorbance measurement at 320 nm. Quinine sulfate was used as a reference compound for this comparison. The calculation of QY was performed using the subsequent formula:
I was responsible for presenting the overall fluorescence intensity; A represents the quantification of light absorption; η denotes the refractive index of the solvent, which remains consistent at 1.33 for both cases; The subscript ‘X’ represented CDs, whereas the abbreviation ‘ST’ indicated quinine sulfate. The QYST was found to be 54%, with Quinidine sulfate being dissolved in a solution of 0.1 mol·L−1 H2SO4. To mitigate the impact of absorption, it was necessary to ensure the absorbance value remained at or below 0.1.
2.7 Detection of heavy metal ion
The as-prepared CDs (0.5 μg·mL−1) were diluted to a volume of 1.0 mL with ultrapure water in a 1.5 mL quartz cuvette, and different concentrations of heavy metal ions were conducted. The fluorescence spectra were recorded under identical conditions as described above.
2.8 Method of chemometrics
The Matlab 2010a software (Math Works, Natick, MA, United States) was utilized to run the PLSDA and PSO-OWLS-SVM programs.
The PLSDA (Wang S. Y. et al., 2024) algorithm employs a method that simultaneously decompose the response matrix and extracts factors from the class matrix. Virtual vectors are encoded to represent various classes by organizing extraction factors based on their correlation. In this encoding scheme, the virtual vector fj representing the jth element is assigned a value of 1, while all other components for that class are set to 0. Each specific class corresponds to a column in the response matrix.
The PSO-VWLS-SVM model (Fan et al., 2023) follows the following procedure:
1. A total of 100 viable solutions for determining the weighting vector of variables were considered in LS-SVM, while also considering two hyperparameters related to kernel widths and the relative weight assigned to the error term. The LS-SVM model was developed to establish a correlation between the predictor matrix and the target variable under consideration.
2. The PSO algorithm was employed to explore various weighting vectors and optimize two hyperparameters in order to minimize the prediction error, which was assessed utilizing the root square mean. The optimal combination of weights for component of fingerprint variables was consequently determined.
3. Utilizing the optimally fine-tuned variable weighting vector and hyperparameters determined in the second step, we constructed an LS-SVM model which was subsequently applied to unfamiliar samples.
3 Results and discussion
3.1 Characterization of the CDs
UV–vis absorption spectra are presented in Figure 1A, revealing a single absorbance band centered at approximately 280 nm. This band is formed due to the capture of energy from an excited state by the surface states of N-doped CDs for fluorescence spectroscopy. Upon UV irradiation at a wavelength of 365 nm (inset, Figure 1A), the CDs exhibit intense blue light emission. The CDs exhibit a noticeable relationship between the excitation wavelength and their fluorescence emission spectra, as shown in Figure 1B. The emission trend gradually increases from 280 to 520 nm. The observed phenomenon suggests that the variability in fluorescence properties of the CDs can be ascribed to variations in their size or presence of unique emissive sites on their surfaces (Lim et al., 2015; Zhu et al., 2015).
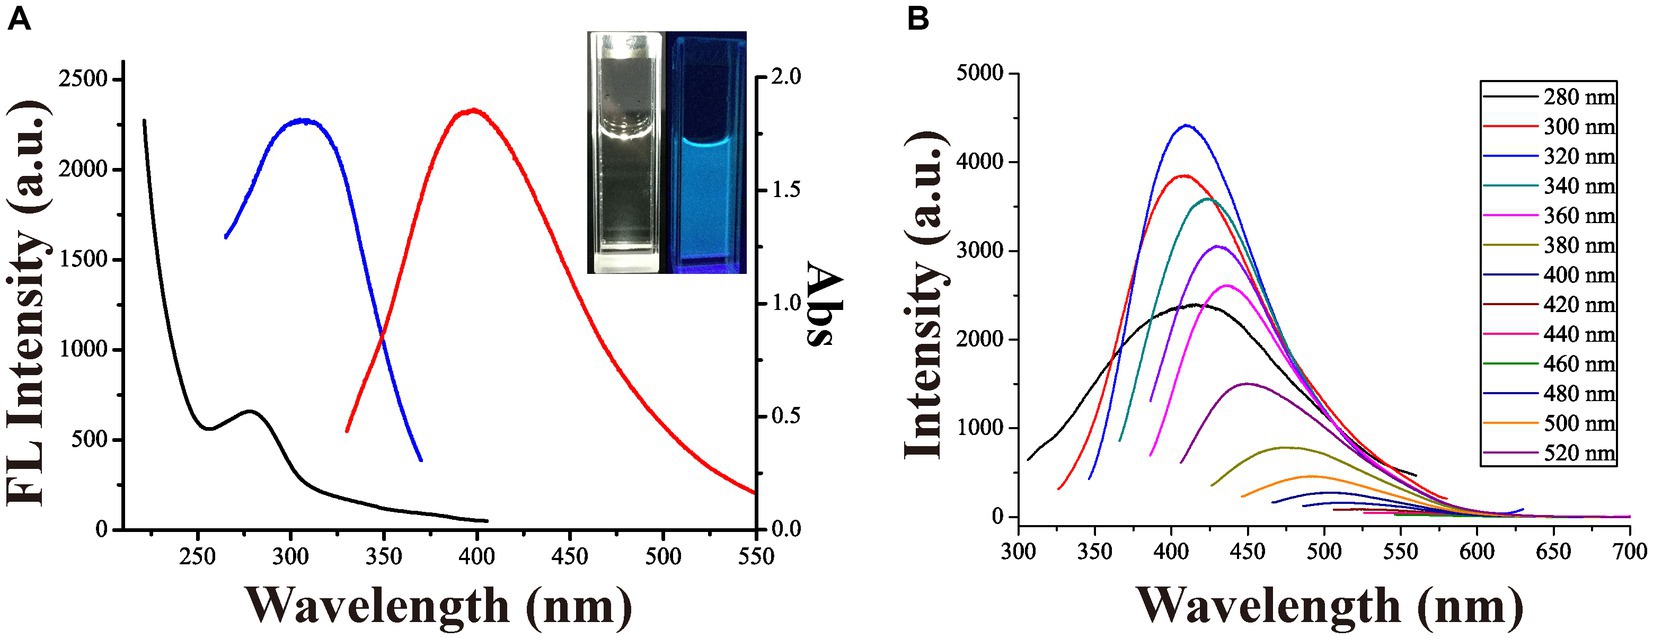
Figure 1. (A) The UV spectrum (represented by the black line), fluorescence excitation spectrum (represented by the blue line, λex = 320 nm), and emission spectrum (represented by the red line, λem = 400) of the aqueous solution containing CDs at room temperature. The photograph of the CDs in visible light (left) and in 365 nm UV light (right) were displayed in the insets. (B) Fluorescent emission spectra of the CDs were measured under various excitation wavelengths spanning from 280 to 520 nm.
As depicted in Figure 2A, the peaks observed at 3,408, 1,663, 1,595, 1,300, 1,240 and 1,110 cm−1 were due to the stretching vibration with the O-H, C=O, C=C, C-N, C-OH and C-O-C, respectively. The peak observed at 1,400 cm−1 is due to the bending vibration with the C-H bond. The XPS examination yielded significant findings regarding the elemental composition and chemical bonding present in CDs. The composition analysis using XPS revealed that high-resolution C1s spectrum shown in Figure 2B could be separated into four separate peaks, which were approximately located at different binding energies of 284.6, 285.7, 288.1, and 292.5 eV. The four separate peaks were attributed to different functional groups: C-C/C=C, C-N, C=O/C-N and C-H, respectively. As shown in Figure 2C, the peaks observed at 399.8 and 400.7 eV in the high-resolution N1s spectrum can be attributed to O=C–N and C-N groups, respectively. The examination of the O1s spectrum illustrated in Figure 2D revealed three distinct peaks at 531.3, 532.4, and 535.1eV, which were identified as carbonyl groups C=O, C–OH/C–O–C, and –C–O– groups correspondingly. The XPS analysis detected a variety of oxygenated and nitrous functional groups on the surface of the CDs. Referred to quinine sulfate, the QY of the CDs was determined as 10.40% using Equation 1. As shown in Figure 2E, the CDs possess a spherical morphology and exhibit an average diameter of 2.2 nm. The TEM image (Figure 2E) indicated that CDs are exhibited with well-resolved lattice fringes, and the spacing between the lattices was approximately 0.30 nm, and the presence of graphitic structures is indicated by the observed lattice fringes.
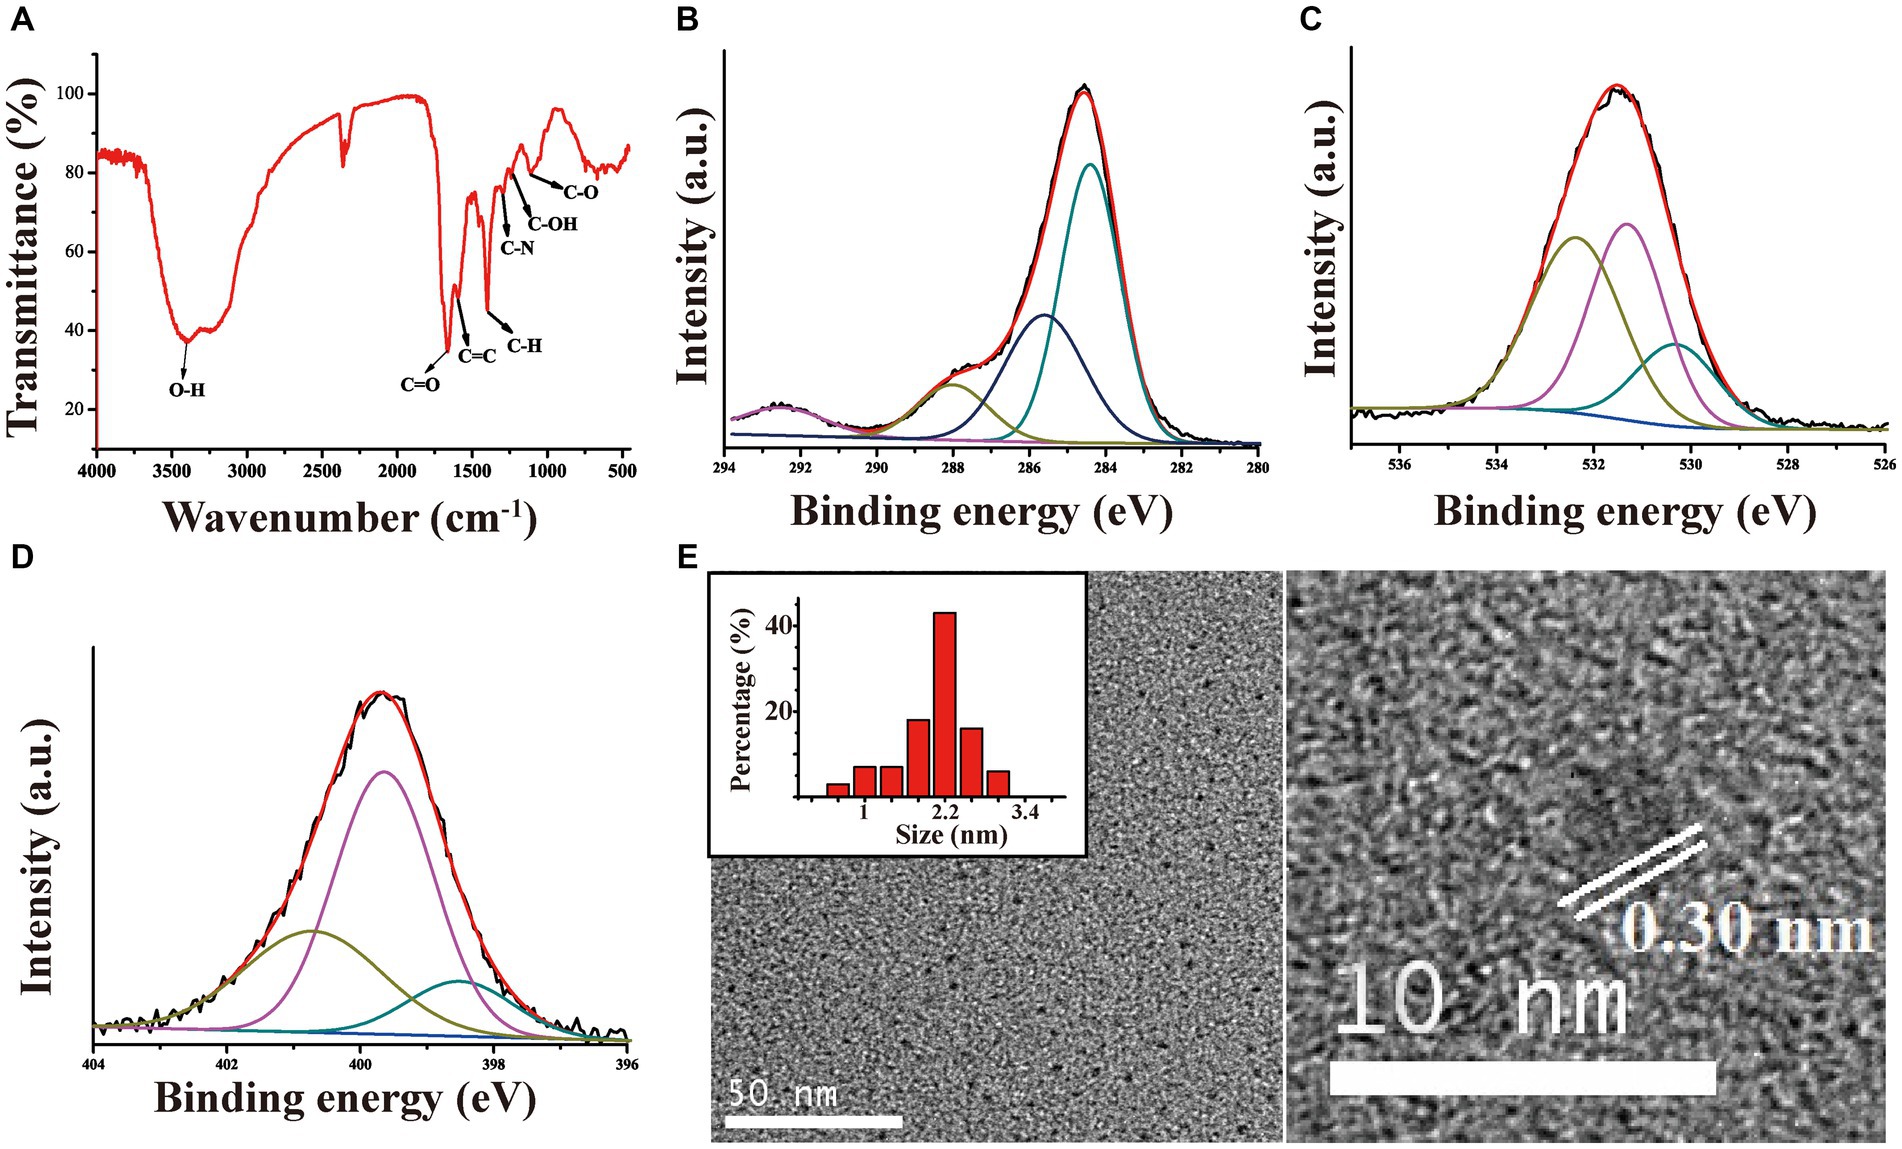
Figure 2. Infrared spectroscopy (A); C1s (B), O1s (C), and N1s high-resolution XPS spectra (D); TEM images (E) of the CDs.
3.2 Identification and validation of fluorescence enhancement markers in CDs
The fluorescence spectra of six different CDs derived from green tea residues with varying origins are presented in Figure 3A. The excitation peak is observed at approximately 430 nm, and the intensities exhibit significant variations among different species. Notably, sample No.2 exhibits the highest fluorescence intensity, while sample No.3 displays the lowest signal strength. This discrepancy may be attributed to the diversities in the material composition of different green tea residues, which encompass a multitude of organic constituents influenced by various factors such as origin (Figure 3B). XPS analysis reveals that the as-prepared CDs predominantly consist of three elements: C, O, and N; their binding energies correspond to peaks at 284.64 eV (C1s), 399.67 eV (N1s), and 531.53 eV (O1s). It can be inferred from these results that all synthesized CDs primarily contain carbon, oxygen, and nitrogen but with differing concentrations depending on their precursor derived from green tea residues.
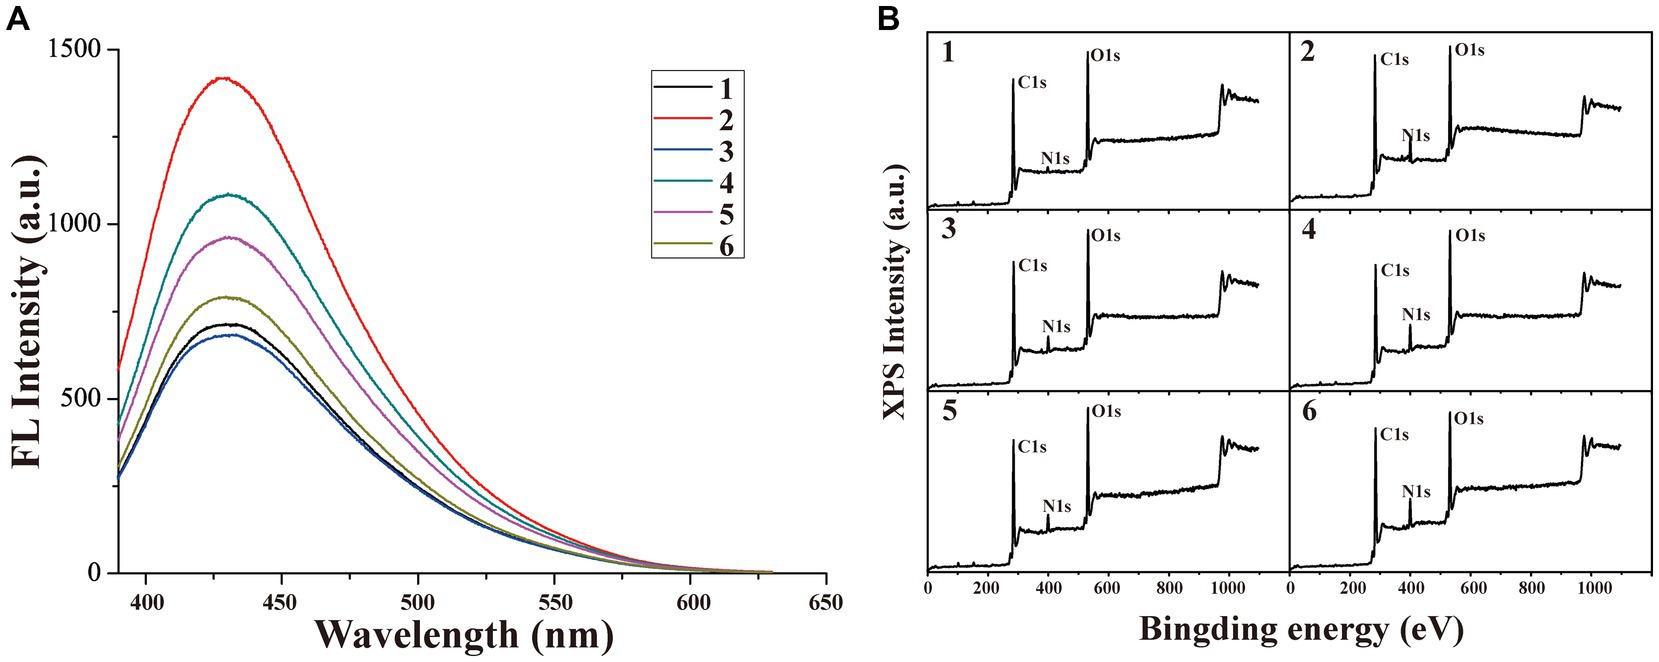
Figure 3. (A) The fluorescence spectra of six different CDs derived from green tea residues with different origins and (B) the XPS spectrum of green tea residues 1–6.
To comprehensively investigate the formation mechanism of CDs and discover fluorescence enhancement markers indicators in CDs obtained from various residues of green tea residues for enhancing their fluorescence capabilities, the PSO-VWLS-SVM approach was employed to establish a correlation between the fluorescence characteristics of six CDs with corresponding UPLC-QTOF and GC–MS data of green tea residues for characteristic marker screening. By integrating GC–MS and UPLC-QTOF analyses, the quantitative results of 68 volatile compounds and 2011 non-volatile compounds in teas were, respectively, combined with the original fluorescence intensity of CDs using PSO-VWLS-SVM. Each compound was assigned a weightage by the PSO-VWLS-SVM, which represents the relevance of the compound to the original fluorescence intensity. Thus, components in tea residue that contribute significantly to the changes in the fluorescence properties of CDs can be selected based on their weightage. The weightage assigned to both volatile compounds and non-volatile compounds is illustrated in Figures 4A,B, and the compound with the highest weightage in the volatile compounds is 5-methyl furfural, while the compound with the highest weightage in the non-volatile compounds is isoquercitrin. Finally, isoquercitrin was selected using liquid chromatography data, while 5-methyl furfural was selected using gas chromatography data, as illustrated in Figure 4C. These two components were added during the preparation of carbon dots (CDs). The reconstruction result is shown in Figure 4D, where the addition of these two components according to their concentrations in green tea residues resulted in an increase in fluorescence intensity of CDs with varying degrees.
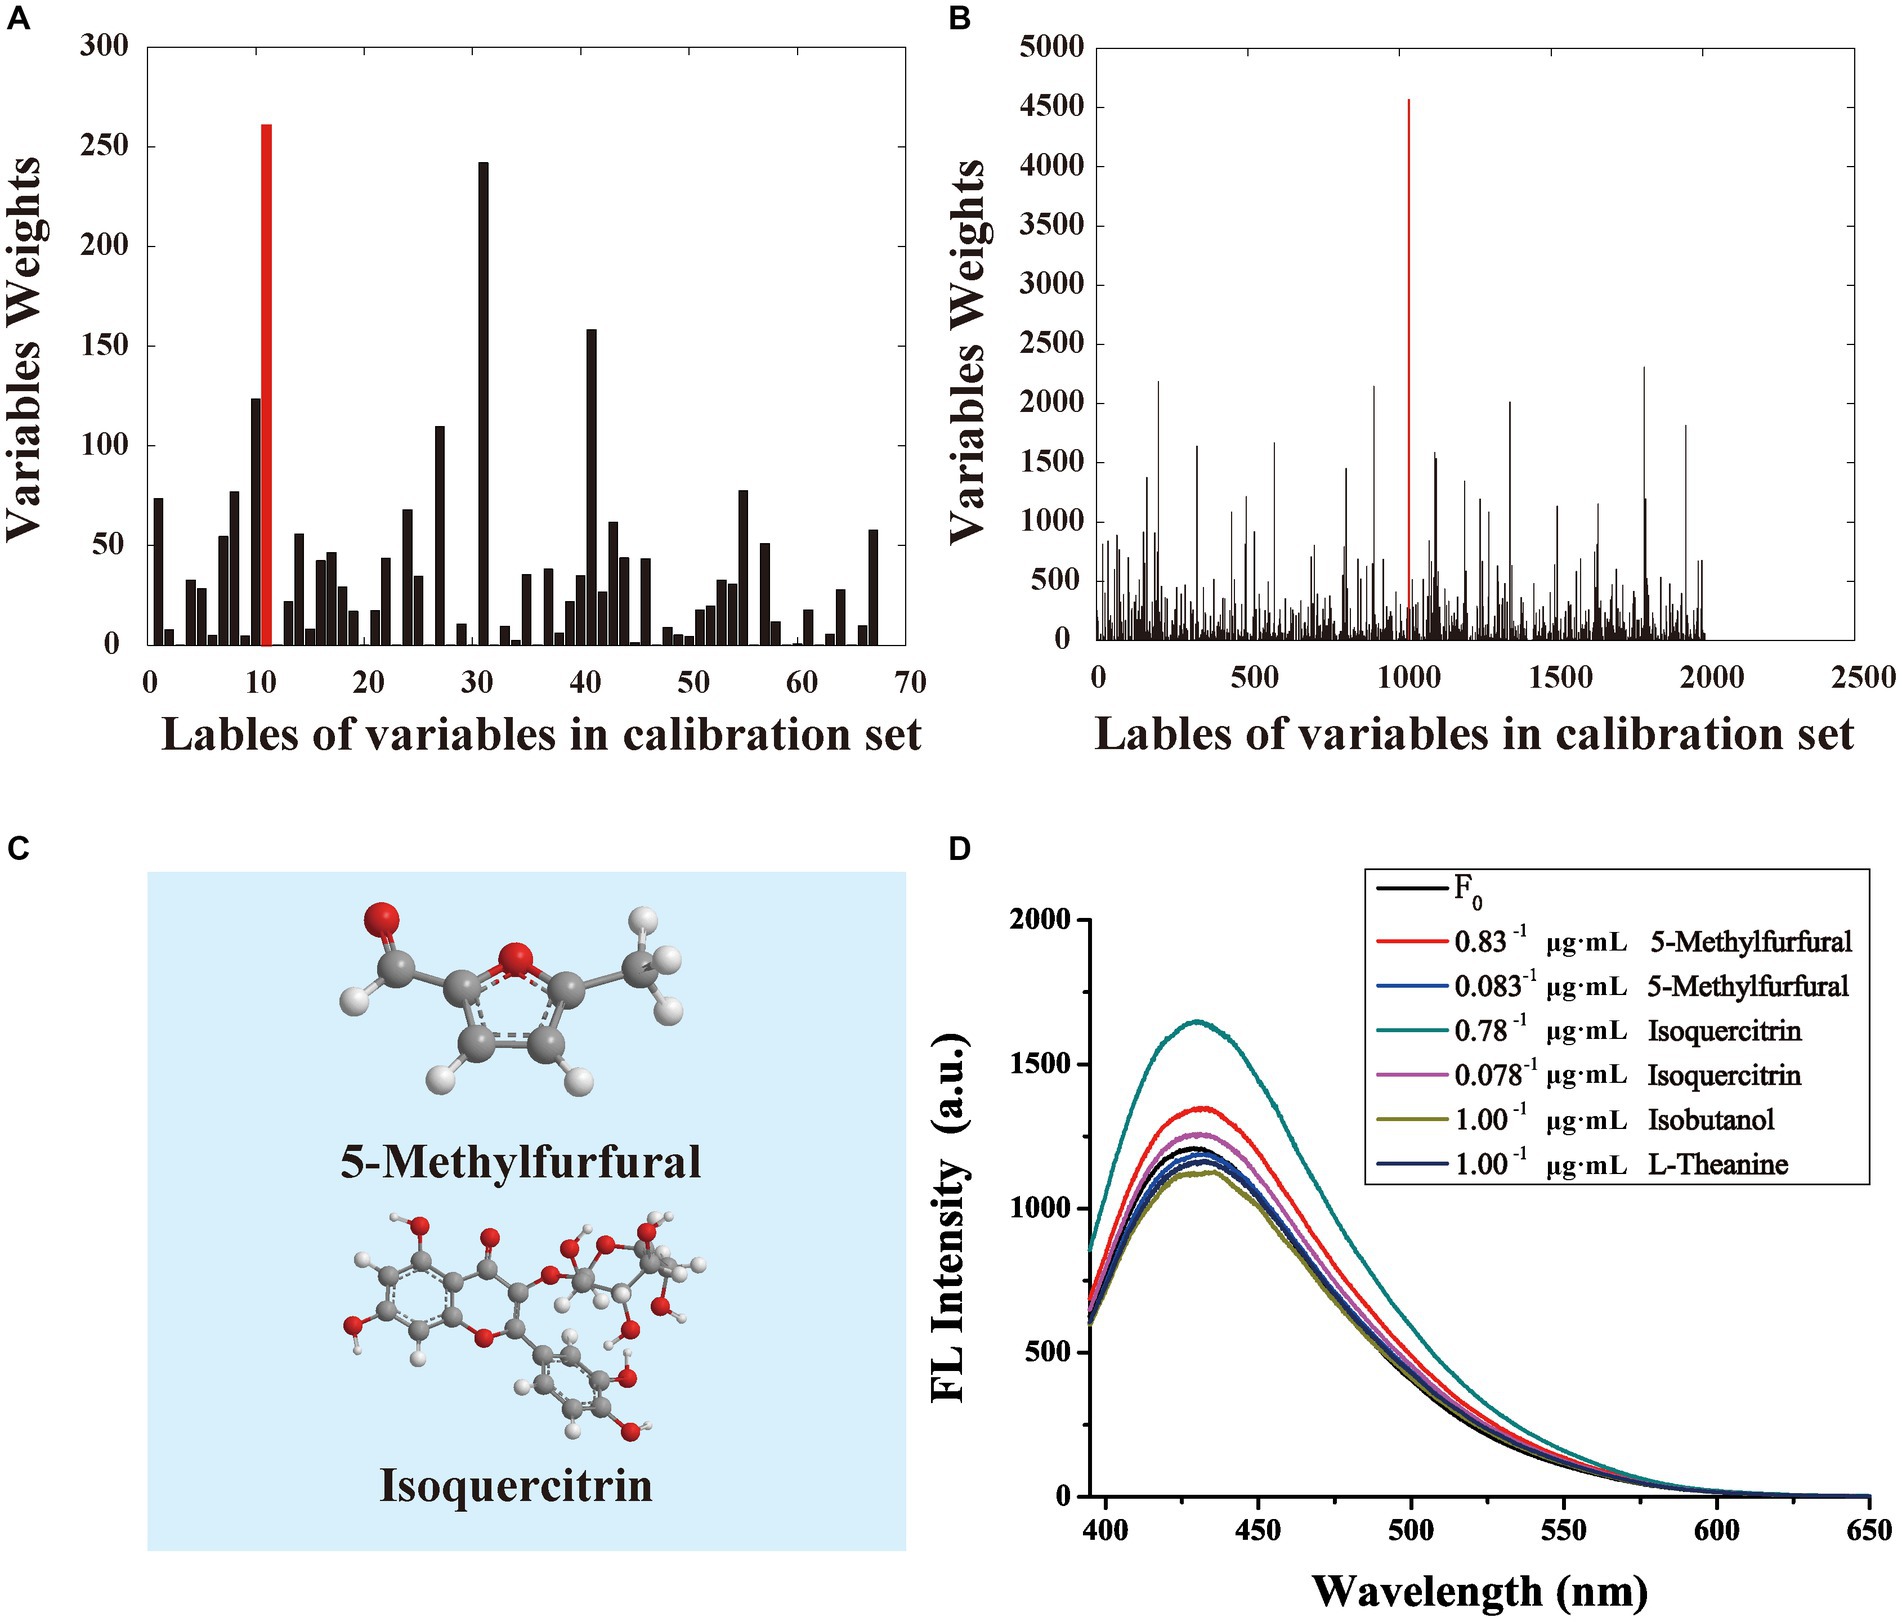
Figure 4. (A) The weight of vapor phase compositions. (B) The weight of liquid phase compositions. (C) The chemical structures of potential fluorescent markers. (D) The fluorescence intensity undergoes changes upon the addition of different concentrates of 5-methylfurfural and isoquercitrin.
Moreover, when similar concentrations of both components were added, isoquercitrin in the liquid phase exhibited a higher FL intensity compared to 5-methyl furfural in the vapor phase. This difference may be attributed to the disparities in their structures. The presence of eight hydroxyl groups in isoquercitrin renders it more susceptible to reacting with other compounds in tea residue. On the other hand, 5-methylfurfural has only one carbonyl group and two carbon–carbon double bonds, which makes it less reactive compared to quercetin. Hence, isoquercitrin exhibits better fluorescence enhancement property in the process of CDs preparation.
3.3 Sensitivity of the sensor for four heavy metal ions detection
The fluorescent quenching effects of Hg2+, Pb2+, Cu2+ and Fe3+ were clearly observed, as demonstrated in Figure 5 and Supplementary Figures S1–S3. Furthermore, the relationship between the fluorescent quenching ratio and ion concentrations was investigated. It was observed fluorescent intensity of CDs experienced a notable decrease with an elevation in ion concentration. The correlation between the fluorescent quenching ratio and Hg2+ ion concentration was demonstrated in Figure 5. Hg2+ exhibited a low limit of detection (LOD) at 0.2 μmol·L−1 and a favorable linear range spanning from 10 to 80 μmol·L−1, exhibiting a high correlation coefficient square (R2) value of 0.991. However, the traditional methods for quantitative analysis are not suitable for accurately characterizing Hg2+ due to the limited information available in fluorescence spectra of CDs and the loss of information caused by quantification using single peak values. The complete fluorescence spectra of CDs were analyzed using the PSO-VWLS-SVM model. A total of 96 samples with varying concentrations (2 × 10⁻⁷, 2 × 10⁻⁶, 1 × 10⁻⁵, 2 × 10⁻⁵, 4 × 10⁻⁵, 6 × 10⁻⁵, 8 × 10⁻⁵, 1 × 10⁻⁴ mol·L−1, each concentration measured 12 times resulting in a total of 96 spectra), resulting in obtaining a total of 96 spectra were divided into three sets using the DUPLEX method: a calibration set, a monitoring set and a prediction set contain 48, 24 and 24 samples, respectively. The PSO algorithm, which serves as a global optimization technique for effectively optimizing sample weights and hyperparameters, is employed to train the calibration set and predict the independent monitoring set. Table 2 presents significantly improved quantitative results obtained from this analysis. After adopting the PSO-VWLS-SVM method, the LOD of Hg was 0.0401 μg·g−1, which was lower than the method reported in the references (Baskaya et al., 2022; Singh et al., 2022). The good regression outcome achieved in our study can be attributed to the utilization of a fingerprint variable weight combination in the quantitative analysis of each component facilitated by the PSO-VWLS-SVM model. The presence of carboxyl groups on the surface of carbon dots (CDs) facilitates a strong interaction with Hg2+ ions, leading to electron or energy transfer and subsequent quenching of CDs’ fluorescence (Zhao W. et al., 2024).
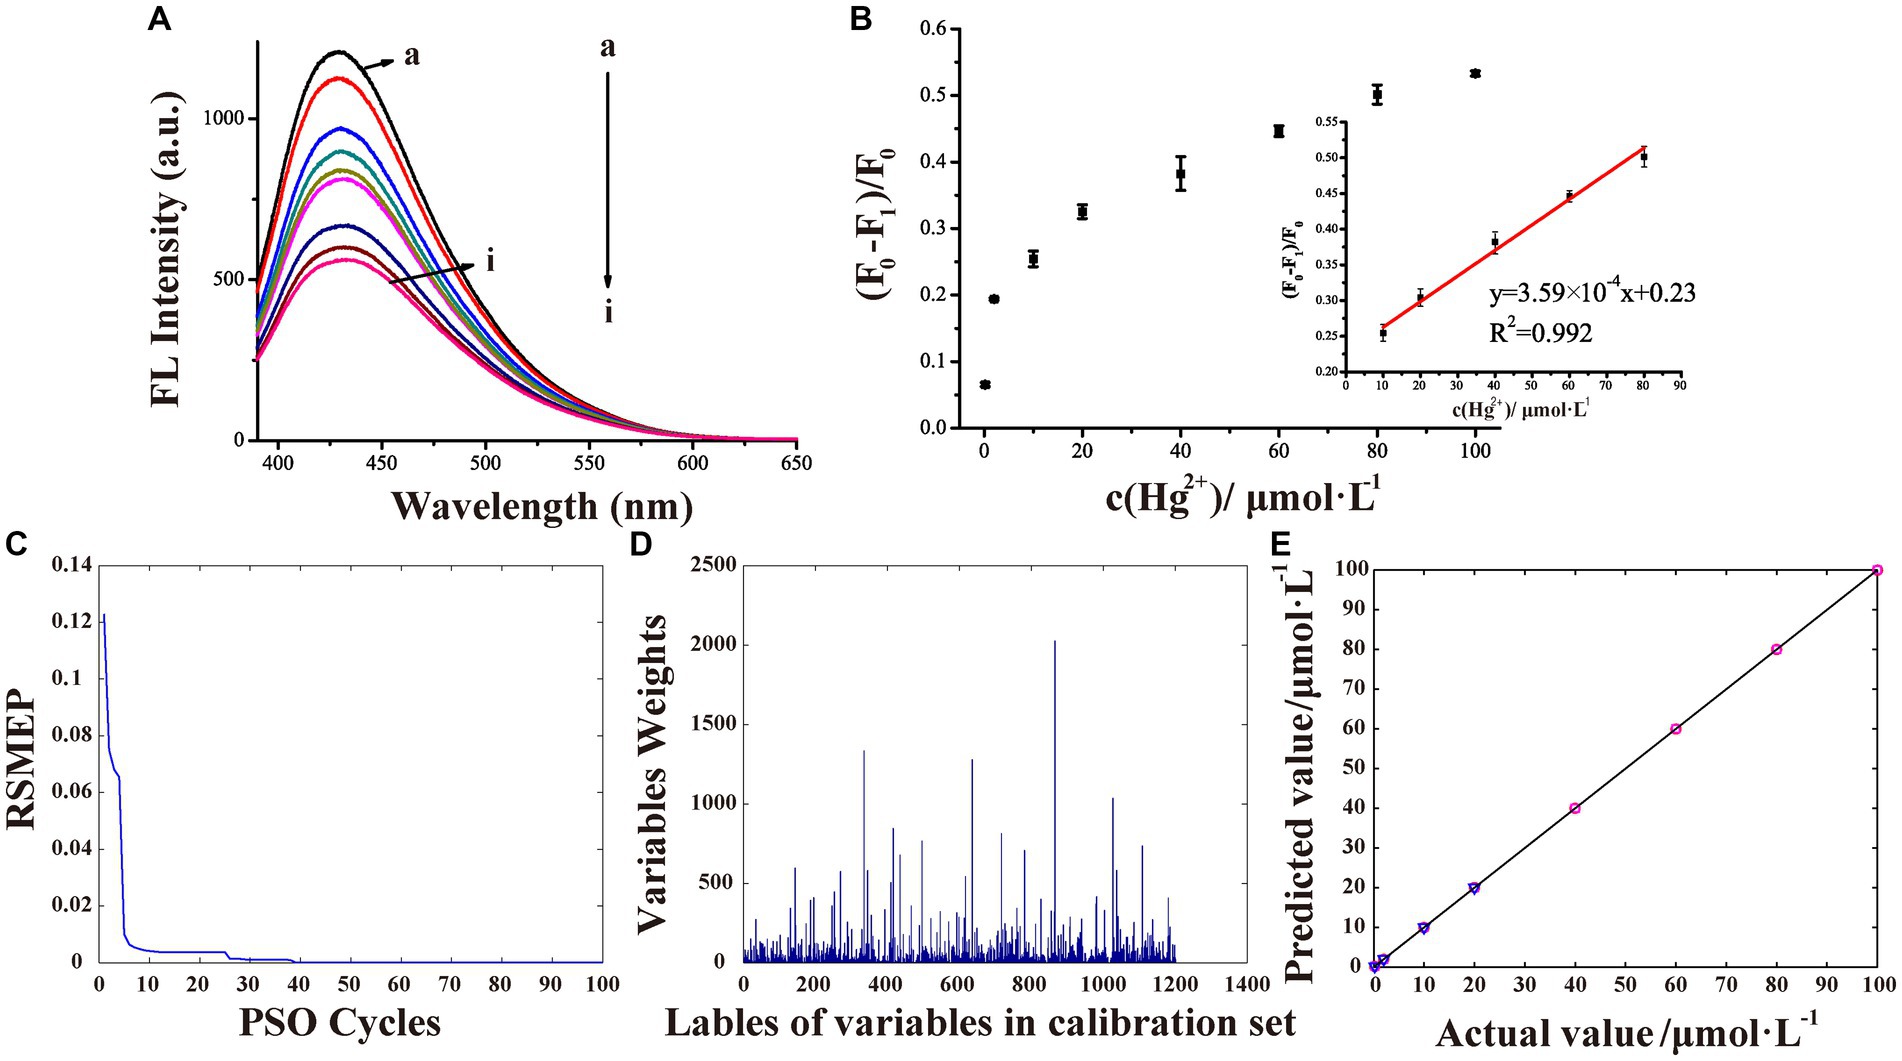
Figure 5. (A) The fluorescence response of CDs towards addition of varying concentrations of Hg2+. (B) The correlation between the ratio of (F0-F1)/F0 and the concentration of Hg2+, inset: the concentration of Hg2+ exhibited a linear correlation within the range of 10 to 80 μmol·L−1. (C) The relationship between RSMEP value and PSO cycles. (D) Variable weight plot of potential characteristic variable for Hg2+ optimized by PSO-VWLS-SVM. (E) The correlation plot between actual concentrations and predicted concentrations estimated by PSO-VWLS-SVM.
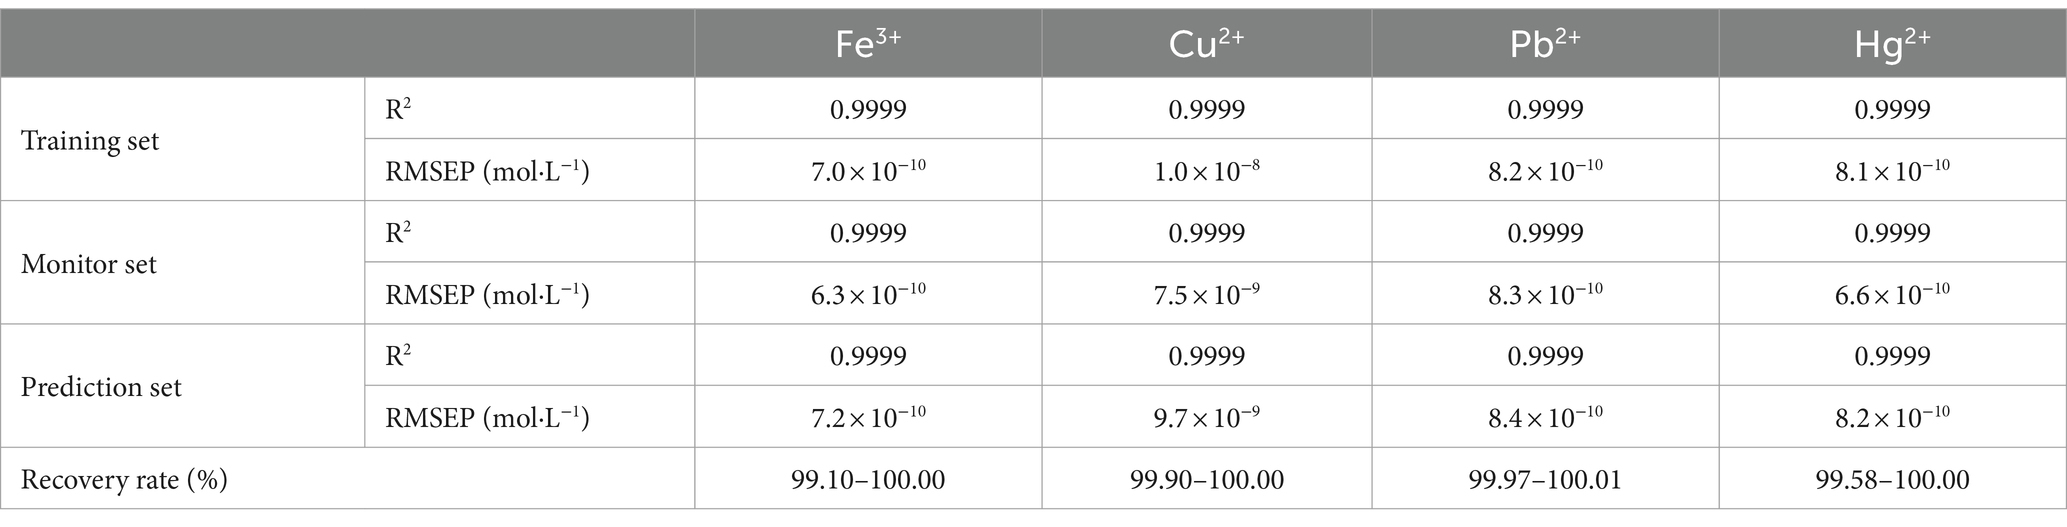
Table 2. Quantitative analysis results of four heavy metal ions by PSO-VWLS-SVM model.
For Fe3+ (Supplementary Figure S1), a strong linear relationship (with a R2 of 0.991) was established between the quenching ratio and ion concentration ranging from 50 to 700 μmol·L−1. The LOD was found to be approximately 1 μmol·L−1. The presence of carboxyl, hydroxyl, and amino functional groups in the CDs results in a decrease in fluorescence when exposed to Fe3+, indicating a turn-off response. This response is attributed to electron transfer and restricted excitation recombination (Ge et al., 2022). In green tea residues, various compounds such as amino acids and catechins contain carboxyl or hydroxyl groups that can effectively modify the surface of CDs. Through the PSO-VWLS-SVM model, a total of 96 samples with varying concentrations (1 × 10⁻⁷, 1 × 10⁻⁶, 5 × 10⁻⁶, 1 × 10⁻⁵, 3 × 10⁻⁵, 5 × 10⁻⁵, 7 × 10⁻⁵, and l × 10−4 mol·L−l, each concentration measured 12 times resulting in a total of 96 spectra) were segregated into three sets using the DUPLEX method: a calibration set, a monitoring set and a prediction set consist of 48, 24 and 24 samples, respectively. Table 2 presents improved quantitative results obtained from this analysis. The PSO-OWLS-SVM, which utilizes the entire spectral information instead of relying on single peak values like traditional methods, offers a wider linear range of quantitative analysis and a lower LOD. Its LOD is 0.0558 μg·g−1, which was lower than the method reported in the references (Chen Y. et al., 2020; Shinde et al., 2023).
The correlation between the quenching ratio of fluorescent and various concentrations of Pb2+ ions was demonstrated in Supplementary Figure S2. The linear range of Pb2+ was observed to be 5–70 μmol·L−1, showing a high correlation coefficient (R2 = 0.998). Furthermore, the LOD for Pb2+ was found to be 5 μmol·L−1. Through the PSO-VWLS-SVM model, a total of 72 samples with varying concentrations (5 × 10⁻⁶, 1 × 10⁻⁵, 3 × 10⁻⁵, 5 × 10⁻⁵, 7 × 10⁻⁵, and 1 × 10⁻⁴ mol·L−1; each concentration measured 12 times resulting in a total of 72 spectra) were divided into three sets using the DUPLEX method: a calibration set, a monitoring set and a prediction set consist of 36, 18 and 18 samples, respectively. Table 2 presents improved quantitative results obtained from this analysis. After adopting the PSO-VWLS-SVM method, the LOD of Hg was 1.04 μg·g−1, which was similar to the method reported in the reference (Gokul Eswaran et al., 2022). The reported mechanism suggests that electron transfer is likely responsible for the effective quenching of fluorescence by Pb2+ ions, as it facilitates recombination between excited electrons in the conduction band and valence band holes (Apetrei and Apetrei, 2016).
The relationship between the fluorescent quenching ratio and Cu2+ ion concentrations was demonstrated in Supplementary Figure S3. Although Cu2+ exhibited a significant quenching effect on CDs, with a LOD of 10 μmol·L−1, it failed to exhibit linear quantification, making accurate and rapid analysis challenging. Therefore, the PSO-VWLS-SVM model was used for quantitative characterization. A total of 60 samples with varying concentration (1 × 10⁻⁵, 5 × 10⁻⁵, 1 × 10⁻⁴, 3 × 10⁻⁴, and 5 × 10⁻⁴ mol·L−1; each concentration measured 12 times resulting in a total of 60 spectra) were divided into three sets using the DUPLEX method: a calibration set, a monitoring set and a prediction set were composed of 30, 15 and 15 samples, respectively. Table 2 presents the improved results obtained from this approach. After adopting the PSO-VWLS-SVM method, Cu2+ could be quantitatively detected, with a LOD of 0.635 μg·g−1 which was similar to the method reported in the reference (Shinde et al., 2023). Previous research has indicated that copper ions can cause fluorescence quenching in amine-functionalized nanoparticles containing CDs, primarily through the inner-filter effect and the formation of cupric amine complexes (Chen et al., 2022). The green tea residue contained amines such as alkaloids and amino acids.
To further investigate the quenching process, TCSPC experiments were performed to explore how metal ions affect both charge transfer and exciton recombination processes. Figure 6 illustrates fluorescent lifetime which demonstrates that in presence of metal ions, CDs’ lifetime remained uni-exponential with minimal shift of 6.50 ns. This observation suggests that, in this specific case, static quenching rather than dynamic quenching is involved.
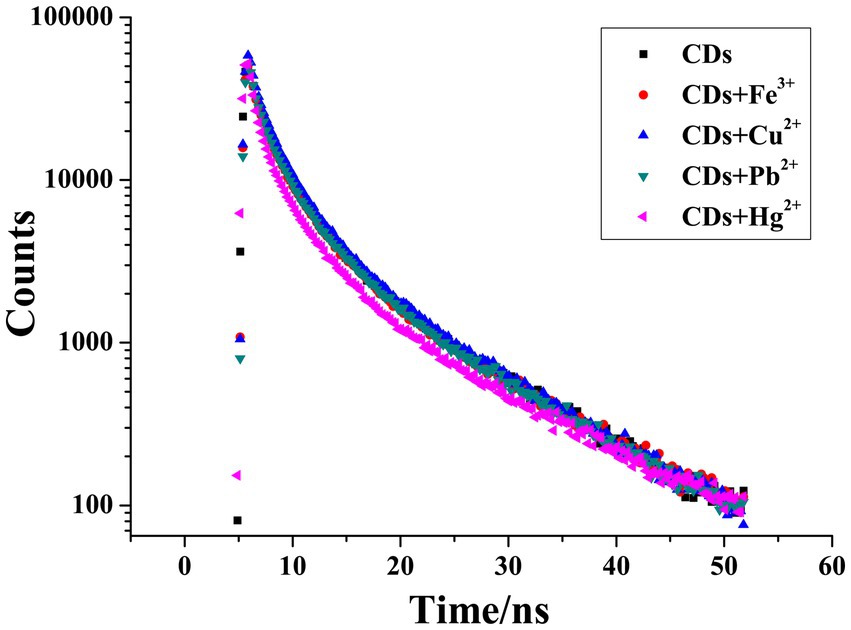
Figure 6. TCSPC analysis of the fluorescence decay curves of CDs in the presence and absence of metal ions.
3.4 The simultaneous detection of four metal ion
In order to assess the sensor’s sensitivity when exposed to different heavy metal ions, four ions with a concentration of 50 μmol·L−1 were individually introduced into the system to observe variations in fluorescence behavior (Figure 7A). The results clearly demonstrated distinguishable characteristics among the four types of heavy metal ions, with Hg2+ exhibiting superior quenching ability compared to other ions and Pb2+ showing the weakest response. However, it was challenging to simultaneously detect all four metal ions due to CDs’ response towards each ion at various concentrations (Figure 7B). Therefore, a chemometrics pattern recognition method called PLSDA was employed for data analysis. A detailed dummy code list representing information on the concentration ranges for Fe3+, Cu2+, Pb2+, and Hg2+ was provided in Table 3. By employing Leave-One-Out Cross-Validation, the number of latent variables that yielded the best results was identified as 7. A too small number of latent variables can make it difficult to achieve expected results, while a too large number can lead to overfitting of the model. Figure 7C illustrates assigned plots of dummy codes to represent unprocessed spectra in both the training set and prediction set of the PLSDA model. Each ion’s dummy code was represented by f1 (1,0,0,0), f2 (0,1,0,0), f3 (0,0,1,0), and f4 (0,0,0,1) respectively. Samples from all groups were precisely categorized by utilizing their maximal dummy code positions (Figure 7C), and the recognition rate of both training set and prediction set samples was 100%. As demonstrated in Table 4, due to its good fluorescence response and the help of effective chemometrics models, the as-prepared CDs exhibit the capability to simultaneously detect Fe3+, Cu2+, Pb2+ and Hg2+, ensuring a low LOQ, in comparison to the reported sensors.
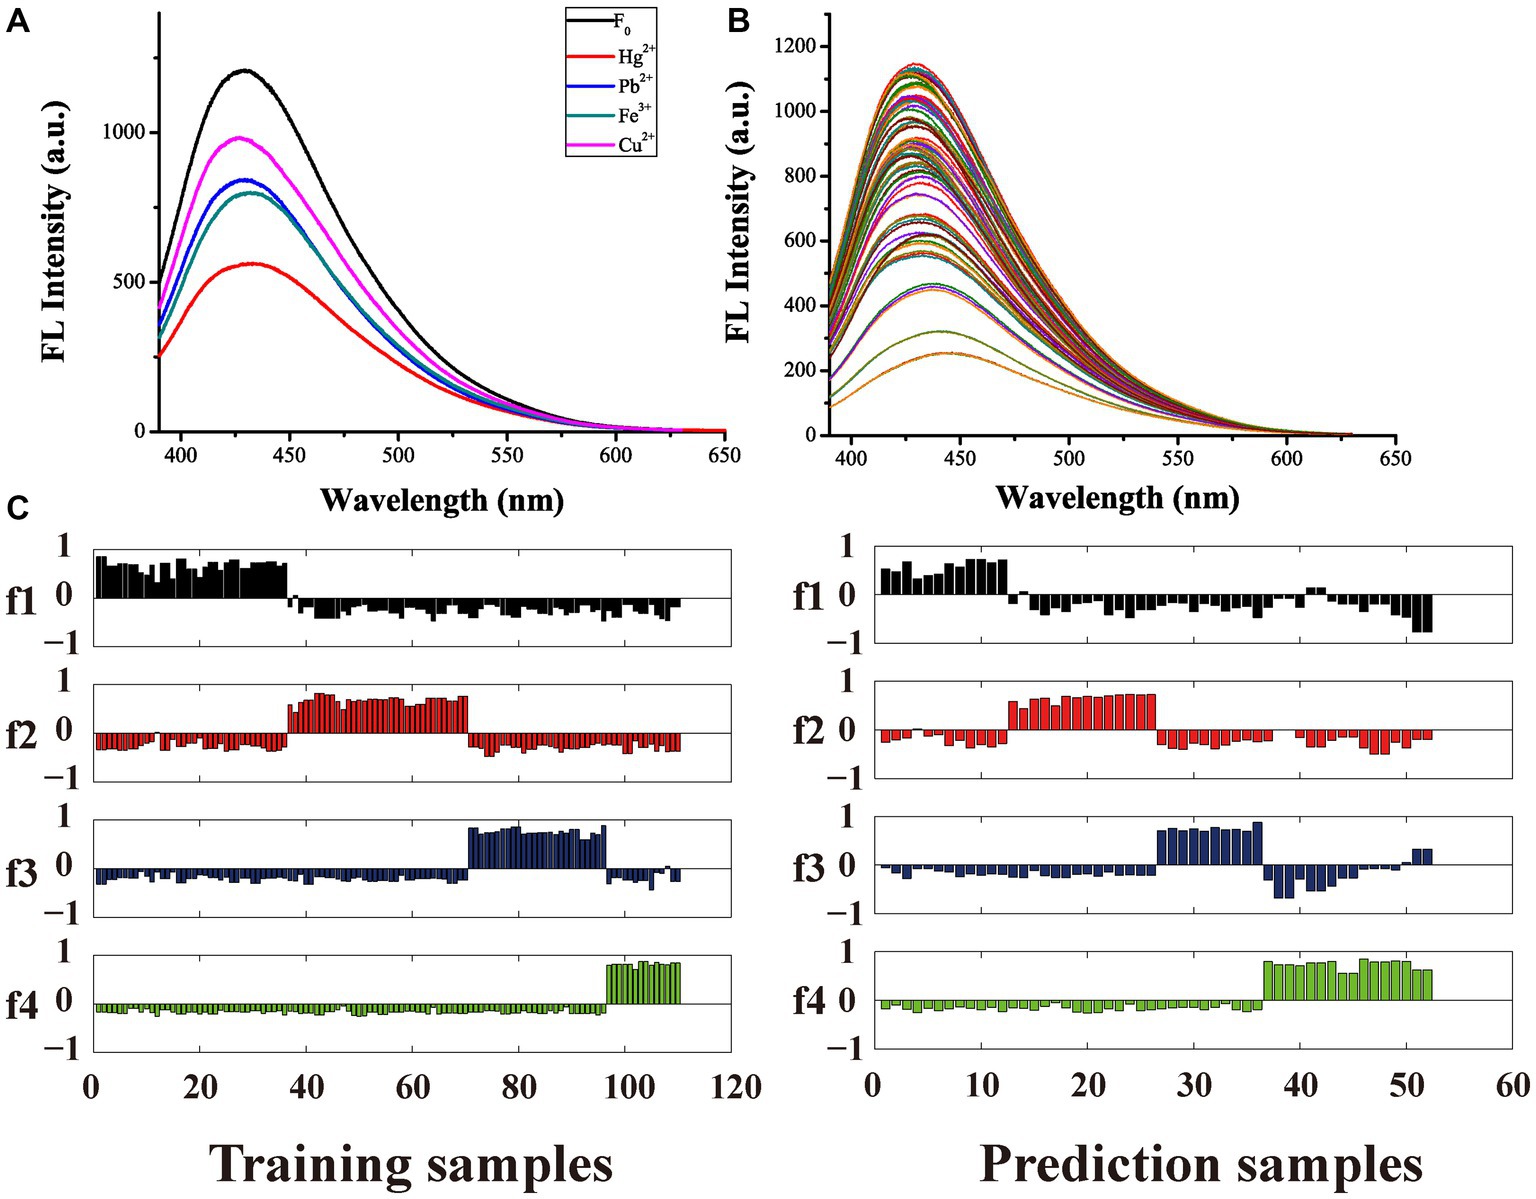
Figure 7. The fluorescence response of various metal ions at a concentration of 50 μmol·L−1 (A). The fluorescence response of diverse metal ions with various concentrations (B). The pattern recognition results of four heavy metal ions by PLSDA (C).
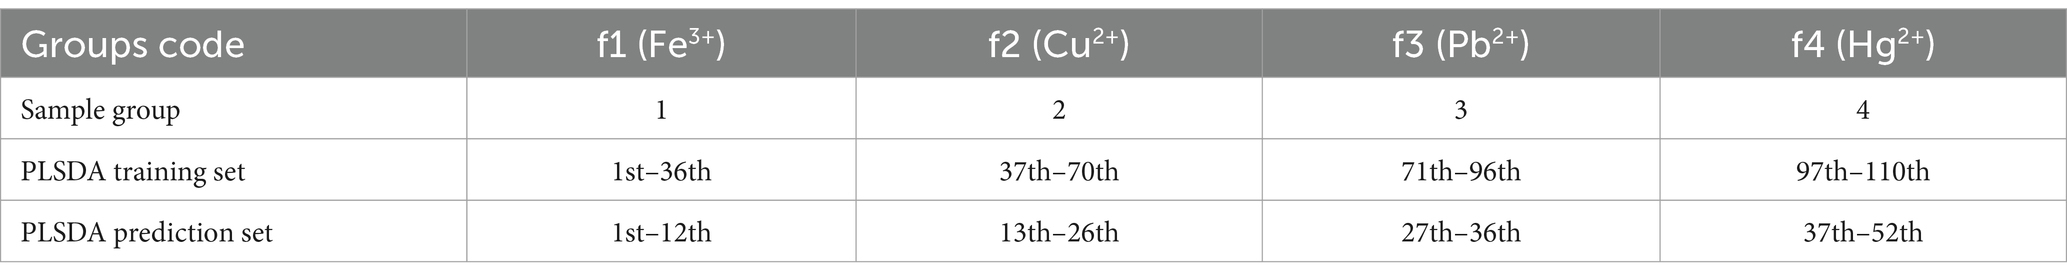
Table 3. Detailed list of all heavy metal ion samples information.
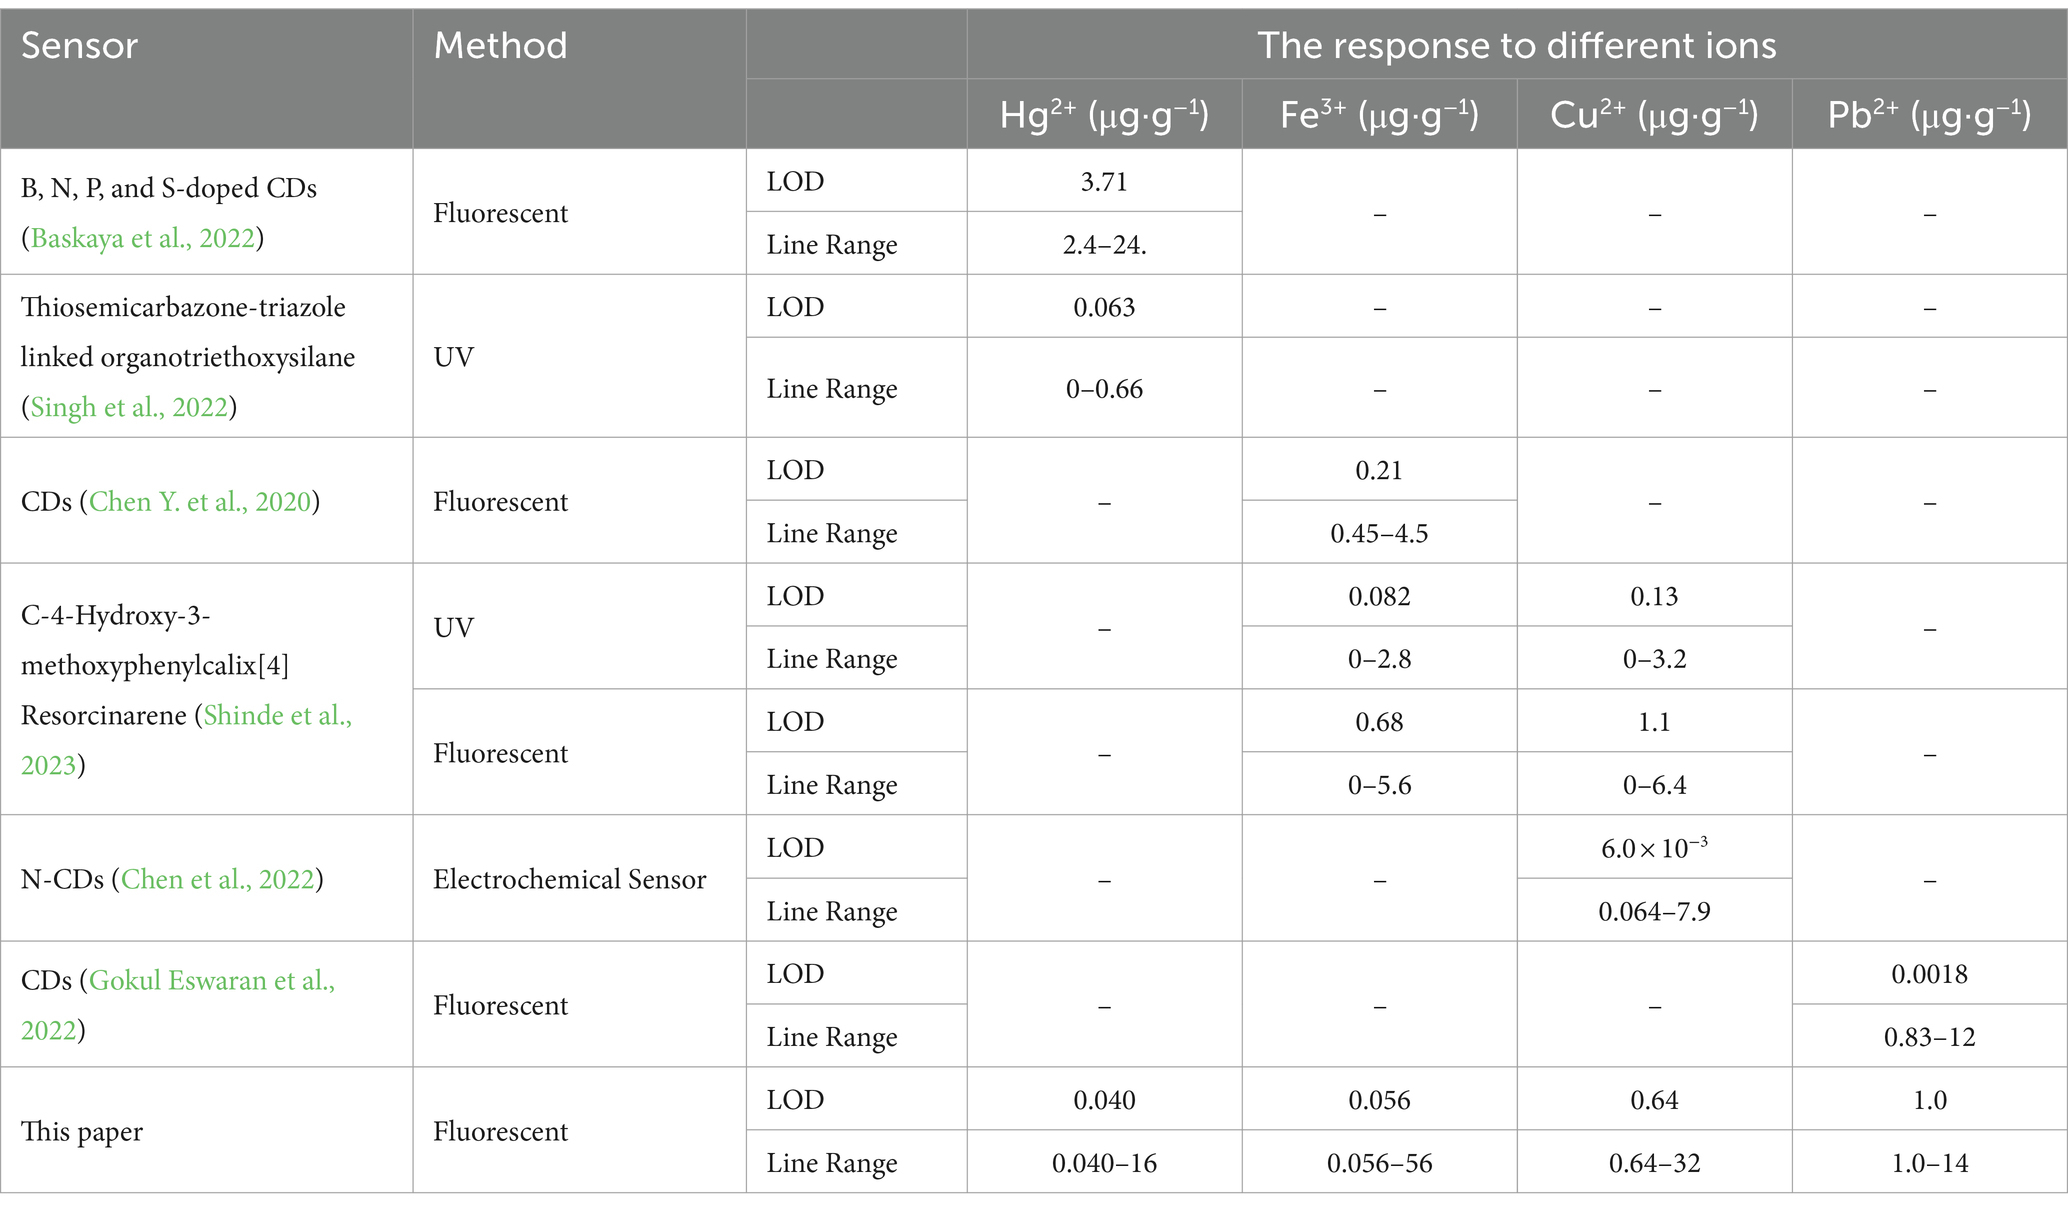
Table 4. Results of heavy metal ions detection using different sensors.
3.5 Selectivity of the sensor for four ions detection
The selectivity of the CDs sensor was evaluated by considering six metal ions that hold significance in biological and environmental contexts, namely Na+, K+, Mg2+, Ca2+, Zn2+, and Cd2+ as potential interfering ions, alongside common amino acids. The concentration of the interfering substances is 10 times that of the target ion. Figure 8 demonstrates that these non-specific ions had minimal or negligible impact on the fluorescence of CDs. Additionally, Figure 8 reveals that amino acids exhibited only a slight influence on the CDs’ fluorescence response.

Figure 8. The influence of other non-specific ion and amino acids.
3.6 The detection of four heavy metal ions in real food samples
To verify the suitability of this methodology, it was utilized for the purpose of identifying diverse heavy metal ions (300 μmol·L−1) in five real environmental and agricultural samples (such as green tea, traditional Chinese medicine extracts, wastewater, etc.). The results obtained from employing the standard addition method are presented in Table 5. According to the information provided in Table 5, it is evident that the recovery rates of four metal ions spiked into five different matrices were found to be the range of 99.1–101.3%, while both intra-day and inter-day relative standard deviations remained less than 0.5% for all samples.
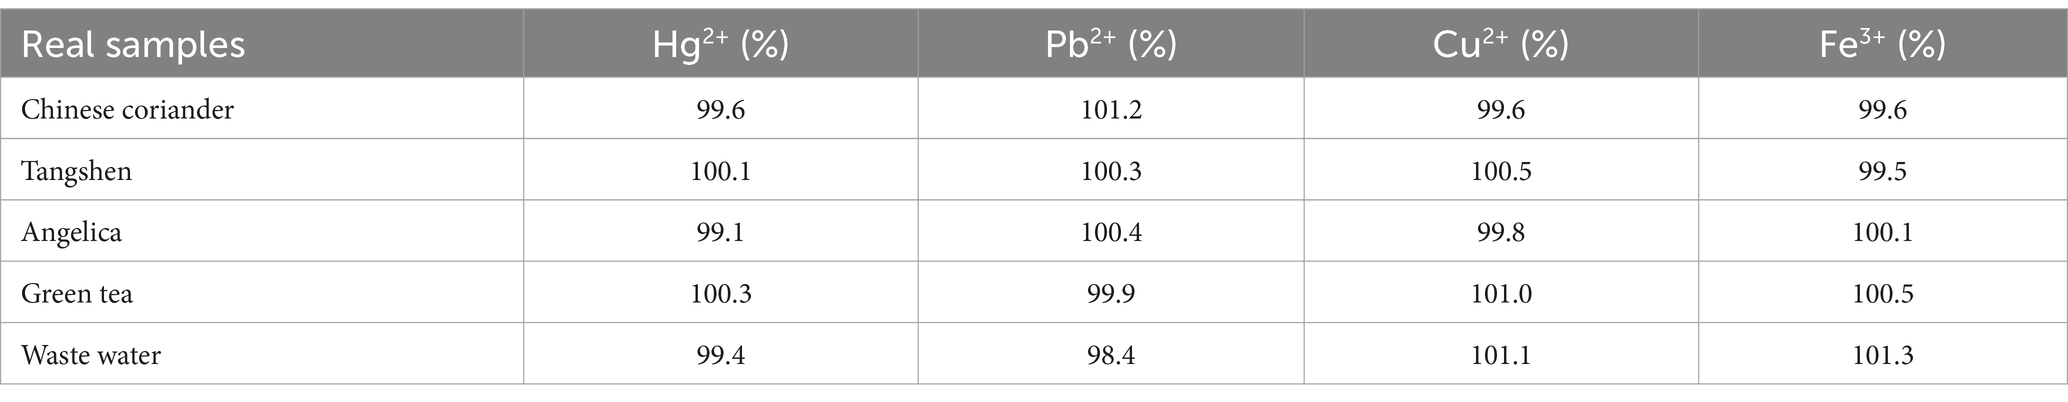
Table 5. Recovery rates of four heavy metal ions in five different samples.
4 Conclusion
In this paper, a type of carbon quantum dots (CDs) with exceptional optical properties was synthesized through hydrothermal treatment using green tea residue. The CDs exhibited a quantum yield of 10.40%. The as-prepared CDs were successfully employed as highly sensitive fluorescence indicators for the specific identification of Hg2+, Pb2+, Fe3+, and Cu2+ in food samples. By utilizing the PLSDA method, these distinct heavy metal ions with various concentrations can be accurately identified with a 100% accuracy rate. Despite interference from 10 times higher concentrations of other metal ions and amino acids, the CDs remains feasible to detect four types of heavy metal ions. The quantitative range of Hg2+, Pb2+, Fe3+ and Cu2+ are 0.0401–16.0 μg·g−1, 1.04–5-14.5 μg·g−1, 0.0558–55.8 μg·g−1, 0.635–31.8 μg·g−1. And the recovery rates of four metal ions spiked into five different matrices were found to be the range of 99.1–101.3%, while both intra-day and inter-day relative standard deviations remained less than 0.5% for food samples. Chemometrics analysis was utilized to identify the most significant substances in both volatile and nonvolatile components of tea that contribute to the formation of endogenous CDs, providing guidance for optimizing their fluorescence characteristics. Calculation results revealed two screened substances, isoquercitrin (nonvolatile component) and 5-methyl furfural (volatile component), which were confirmed by reconstruction experiments to have an impact on CD formation. Subsequent research will explore the relationship between the response level of carbon quantum dots to different metal ions and the composition and content of compounds in their raw materials, thereby achieving controlled synthesis of carbon quantum dots. Ultimately, the identification of heavy metal ions in various intricate systems will be accomplished.
Data availability statement
The raw data supporting the conclusions of this article will be made available by the authors, without undue reservation.
Author contributions
LZ: Conceptualization, Investigation, Methodology, Software, Validation, Writing – original draft. ZC: Validation, Writing – review & editing. YL: Validation, Writing – review & editing. YF: Conceptualization, Formal analysis, Funding acquisition, Methodology, Project administration, Resources, Software, Supervision, Writing – original draft, Writing – review & editing. YS: Funding acquisition, Project administration, Resources, Supervision, Writing – review & editing.
Funding
The author(s) declare financial support was received for the research, authorship, and/or publication of this article. This work was financially supported by the National Natural Science Foundation of China (No. 32302192), the Open Funds of State Key Laboratory Breeding Base of Green Chemistry-Synthesis Technology of Zhejiang University of Technology (No. GCTKF2014003).
Conflict of interest
The authors declare that the research was conducted in the absence of any commercial or financial relationships that could be construed as a potential conflict of interest.
Publisher’s note
All claims expressed in this article are solely those of the authors and do not necessarily represent those of their affiliated organizations, or those of the publisher, the editors and the reviewers. Any product that may be evaluated in this article, or claim that may be made by its manufacturer, is not guaranteed or endorsed by the publisher.
Supplementary material
The Supplementary material for this article can be found online at: https://www.frontiersin.org/articles/10.3389/fsufs.2024.1431792/full#supplementary-material
References
Apetrei, I. M., and Apetrei, C. (2016). Application of voltammetric e-tongue for the detection of ammonia and putrescine in beef products. Sens. Actuators B: Chem. 234, 371–379. doi: 10.1016/j.snb.2016.05.005
Baskaya, S. K., Tahta, B., Urus, S., Eskalen, H., Cesme, M., and Ozgan, S. (2022). Multifunctional B, N, P, and S-doped fluorescent carbon quantum dot synthesis from pigeon manure: highly effective hg (II) sensor and fluorescent ink properties. Biomass Convers. Biorefinery 14, 1089–1103. doi: 10.1007/s13399-022-03017-8
Chen, J., Han, S., Li, H., Niu, X., and Wang, K. (2022). An electrochemical sensor for selective detection of cu2+ by using a self-assembled Cu coordinated β-cyclodextrin-nitrogen-doped carbon quantum dots composite. J. Electrochem. Soc. 169:117508. doi: 10.1149/1945-7111/aca0c7
Chen, Z.-J., Huang, A.-J., Dong, X.-X., Zhang, Y.-F., Zhu, L., Luo, L., et al. (2023). A simple and sensitive fluoroimmunoassay based on the nanobody-alkaline phosphatase fusion protein for the rapid detection of fenitrothion. Front. Sustain. Food Syst. 7:1320931. doi: 10.3389/fsufs.2023.1320931
Chen, H., Li, D., Zheng, Y., Wang, K., Zhang, H., Feng, Z., et al. (2024). Construction of optical dual-mode sensing platform based on green emissive carbon quantum dots for effective detection of ClO-and cellular imaging. Spectrochim Acta A Mol. Biomol. Spectrosc. 309:123733. doi: 10.1016/j.saa.2023.123733
Chen, J., Mao, C., Ye, H., Gao, X., and Zhao, L. (2024). Natural biomass carbon dots-based fluorescence sensor for high precision detection of vitamin B12 in serum. Spectrochim Acta A Mol. Biomol. Spectrosc. 305:123459. doi: 10.1016/j.saa.2023.123459
Chen, H., Shi, Q., Fu, H., Hu, O., Fan, Y., Xu, L., et al. (2020). Rapid detection of five pesticide residues using complexes of gold nanoparticle and porphyrin combined with ultraviolet visible spectrum. J. Sci. Food Agric. 100, 4464–4473. doi: 10.1002/jsfa.10487
Chen, Y., Sun, X., Pan, W., Yu, G., and Wang, J. (2020). Fe3+-sensitive carbon dots for detection of Fe3+ in aqueous solution and intracellular imaging of Fe3+ inside fungal cells. Front. Chem. 7:911. doi: 10.3389/fchem.2019.00911
Cheng, Y., Huynh-Ba, T., Blank, I., and Robert, F. (2008). Temporal changes in aroma release of Longjing tea infusion: interaction of volatile and nonvolatile tea components and formation of 2-butyl-2-octenal upon aging. J. Agric. Food Chem. 56, 2160–2169. doi: 10.1021/jf073132l
Cui, H.-N., Gu, H.-W., Li, Z.-Q., Sun, W., Ding, B., Li, Z., et al. (2023). Integration of lipidomics and metabolomics approaches for the discrimination of harvest time of green tea in spring season by using UPLC-triple-TOF/MS coupled with chemometrics. Front. Sustain. Food Syst. 7:1119314. doi: 10.3389/fsufs.2023.1119314
Danet, A. F., Bratu, M.-C., Radulescu, M.-C., and Bratuc, A. (2009). Portable minianalyzer based on cold vapor atomic absorption spectrometry at 184.9 nm for atmospheric mercury determination. Sens. Actuators B: Chem. 137, 12–16. doi: 10.1016/j.snb.2008.12.065
Fallah, S., Baharfar, R., and Samadi-Maybodi, A. (2023). Simple and green approach for photoluminescent carbon dots prepared from faba bean seeds as a luminescent probe for determination of hg+ ions and cell imaging. Luminescence 38, 1929–1937. doi: 10.1002/bio.4581
Fan, Y., Bai, X. Y., Chen, H. Y., Yang, X. L., Yang, J., She, Y. B., et al. (2023). A novel simultaneous quantitative method for differential volatile components in herbs based on combined near-infrared and mid-infrared spectroscopy. Food Chem. 407:135096. doi: 10.1016/j.foodchem.2022.135096
Fan, Y., Liu, L., Sun, D., Lan, H., Fu, H., Yang, T., et al. (2016). "turn-off" fluorescent data array sensor based on double quantum dots coupled with chemometrics for highly sensitive and selective detection of multicomponent pesticides. Anal. Chim. Acta 916, 84–91. doi: 10.1016/j.aca.2016.02.021
Gao, J., Yin, J., Wang, G., Wang, X., Zhang, J., Sun, B., et al. (2024). A novel electrode for simultaneous detection of multiple heavy metal ions without pre-enrichment in food samples. Food Chem. 448:138994. doi: 10.1016/j.foodchem.2024.138994
Ge, G., Li, L., Chen, M., Wu, X., Yang, Y., Wang, D., et al. (2022). Green synthesis of nitrogen-doped carbon dots from fresh tea leaves for selective Fe3+ ions detection and cellular imaging. Nanomaterials 12:986. doi: 10.3390/nano12060986
Gokul Eswaran, S., Thiruppathi, D., and Vasimalai, N. (2022). Synthesis of highly fluorescent carbon dots from bread waste and their nanomolar lead ions sensor application. Environ. Nanotechnol. Monit. Manag. 18:100748. doi: 10.1016/j.enmm.2022.100748
Guo, Y., Wang, H., Chen, Z., Jing, X., and Wang, X. (2022). Determination of methomyl in grain using deep eutectic solvent-based extraction combined with fluorescence-based enzyme inhibition assays. Spectrochim Acta A Mol. Biomol. Spectrosc. 266:120412. doi: 10.1016/j.saa.2021.120412
Hallaji, Z., Bagheri, Z., Oroujlo, M., Nemati, M., Tavassoli, Z., and Ranjbar, B. (2022). An insight into the potentials of carbon dots for in vitro live-cell imaging: recent progress, challenges, and prospects. Microchim. Acta 189:190. doi: 10.1007/s00604-022-05259-9
Hou, Y., Lin, J., Chen, Y., He, J., Su, Z., Zheng, Q., et al. (2023). Flammulina velutipes-derived carbon dots for fluorescence detection and imaging of hydroxyl radical. Spectrochim Acta A Mol. Biomol. Spectrosc. 291:122304. doi: 10.1016/j.saa.2022.122304
Hua, Y., Li, S., Cai, Y., Liu, H., Wan, Y., Yin, M., et al. (2019). A sensitive and selective electroanalysis strategy for histidine using the wettable well electrodes modified with graphene quantum dot-scaffolded melamine and copper nanocomposites. Nanoscale 11, 2126–2130. doi: 10.1039/C8NR08294D
Huang, D., Chen, X., Tan, R., Wang, H., Jiao, L., Tang, H., et al. (2024). A comprehensive metabolomics analysis of volatile and non-volatile compounds in matcha processed from different tea varieties. Food Chem. X 21:101234. doi: 10.1016/j.fochx.2024.101234
Jia, J., Zhou, X., Li, Y., Wang, M., Liu, Z., and Dong, C. (2022). Establishment of a rapid detection model for the sensory quality and components of Yuezhou Longjing tea using near-infrared spectroscopy. LWT Food Sci. Technol. 164:113625. doi: 10.1016/j.lwt.2022.113625
Jiang, H., Wang, Y., Tan, Z., Hu, L., Shi, J., Liu, G., et al. (2023). Dissolved metal ion removal by online hollow fiber ultrafiltration for enhanced size characterization of metal-containing nanoparticles with single-particle ICP-MS. J. Environ. Sci. 126, 494–505. doi: 10.1016/j.jes.2022.05.034
Li, G. L., Qi, X. M., Xiao, Y., Zhao, Y. C., Li, K. H., Xia, Y. H., et al. (2022a). An efficient voltammetric sensor based on graphene oxide-decorated binary transition metal oxides bi2O3/MnO2 for trace determination of lead ions. Nanomaterials 12:3317. doi: 10.3390/nano12193317
Li, G. L., Qi, X. M., Zhang, G. Q., Wang, S. L., Li, K. H., Wu, J. T., et al. (2022b). Low-cost voltammetric sensors for robust determination of toxic cd(II) and Pb(II) in environment and food based on shuttle-like a-Fe2O3 nanoparticles decorated β-bi2O3 microspheres. Microchem. J. 179:107515. doi: 10.1016/j.microc.2022.107515
Li, K.-F., Syue, P.-C., Lien, C.-Y., and Ku, K.-L. (2022). Simultaneous analysis of 16 metal ions by ion-pairing high-performance liquid chromatography-electrospray ionization tandem mass spectrometry. J. Chin. Chem. Soc. 69, 1754–1764. doi: 10.1002/jccs.202200303
Li, T., Wang, Y., Fang, Y., Jiang, H., Wei, Y., Chen, Z., et al. (2023). Longjing green tea (Camellia sinensis) extract dose-dependently influences intestinal barrier and liver inflammation in autoimmune hepatitis. J. Funct. Foods 107:105623. doi: 10.1016/j.jff.2023.105623
Lim, S. Y., Shen, W., and Gao, Z. Q. (2015). Carbon quantum dots and their applications. Chem. Soc. Rev. 44, 362–381. doi: 10.1039/C4CS00269E
Liu, T., Dong, D., Meng, Y., Chen, H., Liu, C., Qi, Z., et al. (2024). Facile and green synthesis of chlorophyll-derived multi-color fluorescent carbonized polymer dots and their use for sensitive detection of hemin. Spectrochim Acta A Mol. Biomol. Spectrosc. 310:123841. doi: 10.1016/j.saa.2024.123841
Liu, X., Tian, L., Ren, R., Wang, T., and Wang, Y. (2023). Constructing hollow ZIF-8/CDs@MIPs fluorescent sensor from Osmanthus leaves to specifically recognize bovine hemoglobin. Spectrochim Acta A Mol. Biomol. Spectrosc. 287:122121. doi: 10.1016/j.saa.2022.122121
Liu, H., Zhong, X., Pan, Q., Zhang, Y., Deng, W., Zou, G., et al. (2024). A review of carbon dots in synthesis strategy. Coord. Chem. Rev. 498:215468. doi: 10.1016/j.ccr.2023.215468
Lohumi, S., Lee, S., and Cho, B.-K. (2015). Optimal variable selection for Fourier transform infrared spectroscopic analysis of starch-adulterated garlic powder. Sens. Actuators B: Chem. 216, 622–628. doi: 10.1016/j.snb.2015.04.060
Mohamed, R. M. K., Mohamed, S. H., Asran, A. M., Alsohaimi, I. H., Hassan, H. M. A., Ibrahim, H., et al. (2023). Bifunctional ratiometric sensor based on highly fluorescent nitrogen and sulfur biomass-derived carbon nanodots fabricated from manufactured dairy product as a precursor. Spectrochim Acta A Mol. Biomol. Spectrosc. 293:122444. doi: 10.1016/j.saa.2023.122444
Nayana, K., and Sunitha, A. P. (2024). Amphi-luminescent MoS2 nanostructure for photocatalytic splitting of water and removal of methylene blue. Spectrochim. Acta A Mol. Biomol. Spectrosc. 314:124190. doi: 10.1016/j.saa.2024.124190
Phetcharee, K., Sirisit, N., Amonpattaratkit, P., Manyam, J., and Paoprasert, P. (2022). High-performance Mg2+ sensors based on natural rubber-derived, label-free carbon dots. Chemistryselect 7:e202201280. doi: 10.1002/slct.202201280
Roushani, M., Karami, M., and Dizajdizi, B. Z. (2017). Amperometric NADH sensor based on a carbon ceramic electrode modified with the natural carotenoid crocin and multi-walled carbon nanotubes. Microchim. Acta 184, 473–481. doi: 10.1007/s00604-016-2034-x
Saad, A. M., El-Deen, A. K., and Nasr, J. J. M. (2024). Carbon dots-adorned silver nanoparticles as a straightforward sustainable colorimetric sensor for the rapid detection of ketotifen in eye drops and aqueous humor. Spectrochim. Acta A Mol. Biomol. Spectrosc. 314:124204. doi: 10.1016/j.saa.2024.124204
Shan, X., Deng, Y., Niu, L., Chen, L., Zhang, S., Jiang, Y., et al. (2024). The influence of fixation temperature on Longjing tea taste profile and the underlying non-volatile metabolites changes unraveled by combined analyses of metabolomics and E-tongue. LWT Food Sci. Technol. 191:115560. doi: 10.1016/j.lwt.2023.115560
Shan, X., Yu, Q., Chen, L., Zhang, S., Zhu, J., Jiang, Y., et al. (2023). Analyzing the influence of withering degree on the dynamic changes in non-volatile metabolites and sensory quality of Longjing green tea by non-targeted metabolomics. Front. Nutr. 10:1104926. doi: 10.3389/fnut.2023.1104926
Shaukat, H., Ali, A., Zhang, Y., Ahmad, A., Riaz, S., Khan, A., et al. (2023). Tea polyphenols: extraction techniques and its potency as a nutraceutical. Front. Sustain. Food Syst. 7:1175893. doi: 10.3389/fsufs.2023.1175893
Shen, J., Shang, S., Chen, X., Wang, D., and Cai, Y. (2017). Facile synthesis of fluorescence carbon dots from sweet potato for Fe3+ sensing and cell imaging. Mater. Sci. Eng. C Mater. Biol. Appl. 76, 856–864. doi: 10.1016/j.msec.2017.03.178
Shi, J., Zhou, Y., Ning, J., Hu, G., Zhang, Q., Hou, Y., et al. (2022). Prepared carbon dots from wheat straw for detection of Cu2+ in cells and zebrafish and room temperature phosphorescent anti-counterfeiting. Spectrochim Acta A Mol. Biomol. Spectrosc. 281:121597. doi: 10.1016/j.saa.2022.121597
Shinde, A. P., Thorave, R. G., Gawhale, S. T., and Malkhede, D. D. (2023). Facile green synthesized C-4-Hydroxy-3-methoxyphenylcalix 4 Resorcinarene (CHMPCR) for photometric sensing of Fe3+ and Cu2+ions. J. Mol. Struct. 1280:135060. doi: 10.1016/j.molstruc.2023.135060
Singh, G., Sushma, P., Diksha, M., Gupta, S., Esteban, M. A., Espinosa-Ruíz, C., et al. (2022). Designing of thiosemicarbazone-triazole linked organotriethoxysilane as UV-visible and fluorescence sensor for the selective detection of hg2+ ions and their cytotoxic evaluation. J. Mol. Struct. 1255:132446. doi: 10.1016/j.molstruc.2022.132446
Tanen, J. L., White, S. R., Ha, D., and Jorabchi, K. (2023). Fluorine-selective post-plasma chemical ionization for enhanced elemental detection of fluorochemicals. J. Anal. At. Spectrom. 38, 854–864. doi: 10.1039/D2JA00430E
Tang, K., Chen, Y., Zhou, Q., Wang, X., Wang, R., and Zhang, Z. (2024). Portable tri-color ratiometric fluorescence paper sensor for intelligent visual detection of dual-antibiotics and aluminium ion. Spectrochim. Acta A Mol. Biomol. Spectrosc. 314:124221. doi: 10.1016/j.saa.2024.124221
Torrinha, A., Oliveira, T. M. B. F., Ribeiro, F. W. P., De Lima-Neto, P., Correia, A. N., and Morais, S. (2022). (Bio)sensing strategies based on ionic liquid-functionalized carbon nanocomposites for pharmaceuticals: towards greener electrochemical tools. Nanomaterials 12:2368. doi: 10.3390/nano12142368
Venugopalan, P., and Vidya, N. (2022). Bilimbi (Averrhoa bilimbi) fruit derived carbon dots for dual sensing of cu(II) and quinalphos. Int. J. Environ. Anal. Chem., 1–14. doi: 10.1080/03067319.2022.2149331
Venugopalan, P., and Vidya, N. (2023). Microwave-assisted green synthesis of carbon dots derived from wild lemon (Citrus pennivesiculata) leaves as a fluorescent probe for tetracycline sensing in water. Spectrochim Acta A Mol. Biomol. Spectrosc. 286:122024. doi: 10.1016/j.saa.2022.122024
Wang, Z., Chen, D., Gu, B., Gao, B., Wang, T., Guo, Q., et al. (2020). Biomass-derived nitrogen doped graphene quantum dots with color-tunable emission for sensing, fluorescence ink and multicolor cell imaging. Spectrochim Acta A Mol. Biomol. Spectrosc. 227:117671. doi: 10.1016/j.saa.2019.117671
Wang, B., Chen, H., Qu, F., Song, Y., Di, T., Wang, P., et al. (2022). Identification of aroma-active components in black teas produced by six Chinese tea cultivars in high-latitude region by GC-MS and GC-O analysis. Eur. Food Res. Technol. 248, 647–657. doi: 10.1007/s00217-021-03911-x
Wang, S. Y., Long, W. J., Wei, L. N., Cheng, W. Y., Chen, H. Y., Yang, J., et al. (2024). Nano effect fluorescence visual sensor based on au-AgNCs: a novel strategy to identify the origin and growth year of Lilium bulbs. Food Chem. 441:138353. doi: 10.1016/j.foodchem.2024.138353
Wang, Y., Wu, R., Zhang, Y., Cheng, S., Wang, B., Zhang, Y., et al. (2024). One-step synthesis of N, S-doped carbon dots with green emission and their application in 4-NP detection, pH sensing, and cell imaging. Spectrochim Acta A Mol. Biomol. Spectrosc. 308:123709. doi: 10.1016/j.saa.2023.123709
Xu, C., He, M., Chen, B., and Hu, B. (2022). Magnetic porous coordination networks for preconcentration of various metal ions from environmental water followed by inductively coupled plasma mass spectrometry detection. Talanta 245:123470. doi: 10.1016/j.talanta.2022.123470
Zhan, X., Hu, S., Wang, J., Chen, H., Chen, X., Yang, J., et al. (2021). One-pot electrodeposition of metal organic frameworks composite accelerated by gold nanoparticles and electroreduced carbon dots for electroanalysis of bisphenol a in real plastic samples. Sens. Actuators B: Chem. 346:130499. doi: 10.1016/j.snb.2021.130499
Zhang, C., Li, C., and Han, X. (2023). Screen printed electrode containing bismuth for the detection of cadmium ion. J. Electroanal. Chem. 933:117291. doi: 10.1016/j.jelechem.2023.117291
Zhang, D., Zhang, F., Wang, S., Hu, S., Liao, Y., Wang, F., et al. (2023). Red-to-blue colorimetric probe based on biomass carbon dots for smartphone-integrated optosensing of cu(II) and L-cysteine. Spectrochim Acta A Mol. Biomol. Spectrosc. 290:122285. doi: 10.1016/j.saa.2022.122285
Zhang, J., Zheng, G., Tian, Y., Zhang, C., Wang, Y., Liu, M., et al. (2022). Green synthesis of carbon dots from elm seeds via hydrothermal method for Fe3+ detection and cell imaging. Inorg. Chem. Commun. 144:109837. doi: 10.1016/j.inoche.2022.109837
Zhang, H., Zhou, Q., Han, X., Li, M., Yuan, J., Wei, R., et al. (2021). Nitrogen-doped carbon dots derived from hawthorn for the rapid determination of chlortetracycline in pork samples. Spectrochim Acta A Mol. Biomol. Spectrosc. 255:119736. doi: 10.1016/j.saa.2021.119736
Zhao, W., Huang, C., Guo, X., Zhu, Y., Li, Y., Duan, Y., et al. (2024). A fluorescence biosensor based on carbon quantum dots prepared from pomegranate Peel and T-Hg2+-T mismatch for Hg2+ detection. J. Fluoresc. doi: 10.1007/s10895-024-03645-5
Zhao, H., Jiang, Z., Ju, Y., and Lu, J. (2024). High-selective two-site fluorescent probe for Cys/SO2 detection and cell imaging. Spectrochim Acta A Mol. Biomol. Spectrosc. 305:123494. doi: 10.1016/j.saa.2023.123494
Zhu, S. J., Song, Y. B., Zhao, X. H., Shao, J. R., Zhang, J. H., and Yang, B. (2015). The photoluminescence mechanism in carbon dots (graphene quantum dots, carbon nanodots, and polymer dots): current state and future perspective. Nano Res. 8, 355–381. doi: 10.1007/s12274-014-0644-3
Keywords: green tea residue, carbon dots, fluorescence enhanced markers, heavy metal ions detection, chemometrics
Citation: Zhang L, Cai Z, Liu Y, Fan Y and She Y (2024) Fluorescent enhanced endogenous carbon dots derived from green tea residue for multiplex detection of heavy metal ions in food. Front. Sustain. Food Syst. 8:1431792. doi: 10.3389/fsufs.2024.1431792
Edited by:
Xiao-Hua Zhang, Hunan Institute of Science and Technology, ChinaReviewed by:
Guangli Li, Hunan University of Technology, ChinaFubing Xiao, University of South China, China
Hongyan Zou, Southwest University, China
Xiuying Liu, Wuhan Polytechnic University, China
Vinoth Kumar Ponnusamy, Kaohsiung Medical University, Taiwan
Copyright © 2024 Zhang, Cai, Liu, Fan and She. This is an open-access article distributed under the terms of the Creative Commons Attribution License (CC BY). The use, distribution or reproduction in other forums is permitted, provided the original author(s) and the copyright owner(s) are credited and that the original publication in this journal is cited, in accordance with accepted academic practice. No use, distribution or reproduction is permitted which does not comply with these terms.
*Correspondence: Yao Fan, ZmFueUB6anV0LmVkdS5jbg==; Yuanbin She, c2hleWJAemp1dC5lZHUuY24=
†These authors have contributed equally to this work and share first authorship