 Jason Shon
 Albie Miles
- 1School of GeoSciences, The University of Edinburgh, Edinburgh, United Kingdom
- 2Sustainable Community Food Systems Program, Division of Social Sciences, University of Hawaiʻi–West Oahu, Kapolei, HI, United States
A comprehensive set of regionally relevant indicators and metrics is crucial for tracking progress in transforming food systems to meet the UN Sustainable Development Goals (SDGs). Household food security, foundational to sustainable, equitable, and resilient food systems, aligns with SDG 2 (Zero Hunger). Policymakers require accurate data to guide decisions, yet a major challenge is developing scientifically sound, participatory, and reproducible approaches for sub-national food system indicators and metrics. This study addresses this need by using the Delphi research method to create a multi-indicator system of both stand-alone and complementary food security metrics specific to Hawaiʻi. Engaging 24 food security experts in Hawaiʻi, with a 58% response rate in the second round, consensus was achieved on 55 of 71 metrics (78%). The U.S. Household Food Security Survey Module (HFSSM) received the highest rating among stand-alone metrics (3.5, SD = 0.8). Complementary metrics were organized within a framework encompassing the four dimensions of food security: availability, access, utilization, and stability. Access metrics received top ratings, including the ‘rate of households below the ALICE threshold’ (4.4, SD = 0.7). ALICE stands for Asset Limited, Income Constrained, and Employed, and refers to households that earn enough to be ineligible for many public assistance programs but not enough to afford basic necessities. Results highlight the need to clarify terminology, address food (in)security misconceptions, develop new metrics for data gaps, and prioritize initiatives like the Supplementary Nutrition Assistance Program (SNAP) that address Hawaiʻi’s high living costs and enhance food access. The participatory, multidimensional metrics model presented here is adaptable to other regions, extending its impact beyond Hawaiʻi.
1 Introduction
A clear and comprehensive set of indicators and metrics is essential for measuring progress in all areas of the food system (Fanzo et al., 2021). While no single metric universally defines food system sustainability (Prosperi et al., 2016), efforts are increasingly focused on developing diverse indicators to monitor food systems or various elements of food systems holistically, often at global and national scales (Steffen et al., 2015; Chaudhary et al., 2018; Béné et al., 2019; Wang et al., 2019; Willett et al., 2019; Fanzo et al., 2020; Melesse et al., 2020; Hebinck et al., 2021; Zhou et al., 2023; FAO, 2023; Orou Sannou et al., 2023). Interest is also growing in creating metric systems that assess food system transformation at the city or sub-national level (Prosperi et al., 2015; Carey and Dubbeling, 2017; Coppo et al., 2017; Ilieva, 2017; Landert et al., 2017; WB, FAO, and RAUF, 2017; MUFPP, 2020; Blue Bird Jernigan et al., 2021; Moragues-Faus, 2021).
Food security is a fundamental component of sustainable, equitable, and resilient food systems, aligning with SDG 2 (Zero Hunger) (United Nations, 2015). Like food systems, food security is multidimensional. To capture this complexity, indices like the Global Hunger Index (GHI), Global Food Security Index (GFSI), and the Proteus composite index combine a range of metrics, reflecting various dimensions of food (in)security and enabling more comprehensive assessment (Caccavale and Giuffrida, 2020; Economist Impact, 2023; Global Hunger Index (GHI), 2023). Many of these indices utilize data from FAO’s extensive suite of metrics to establish internationally comparable benchmarks for assessing and addressing food insecurity (FAO, 2013; FAO, IFAD, and WFP, 2013).
However, many current metrics are best suited for low-income regions, limiting their applicability to sub-national contexts in developed countries. Furthermore, many multi-indicator food system dashboards are developed with limited stakeholder input, which reduces transparency and inclusivity (Béné et al., 2024). Research addressing sustainability is more impactful when “co-produced” by both academic and community stakeholders (Volkery et al., 2008; Mauser et al., 2013; Karlsson et al., 2018; Nature Editorial, 2018; Norström et al., 2020). Food security researchers face two key challenges in creating impactful metrics for decision-making: (1) creating metric dashboards that accurately reflect local conditions while remaining clear and reproducible to allow for comparisons over time and across contexts and (2) establishing participatory and inclusive processes for developing these multidimensional metric systems (Béné et al., 2024).
This study addresses these challenges by developing a multi-indicator system of currently existing stand-alone and complementary food security metrics specific to the U.S. State of Hawaiʻi, ranked by importance. It utilizes the Delphi method to model a participatory, scientifically grounded approach to select metrics for multi-dimensional food systems. Findings carry deep implications both for Hawaiʻi policymakers as well as food systems planners and researchers in other sub-national contexts seeking participatory, scientifically valid methods to assess complex food systems concepts.
At a time when power in the global food system is increasingly being critiqued as catering to corporate interests (Canfield et al., 2021; Montenegro de Wit et al., 2021; Nisbett et al., 2021), ensuring transparent and democratic participation in food systems is essential for establishing credibility when developing a process for selecting metrics (Allen et al., 2019; Behringer and Feindt, 2023). The Delphi technique offers a promising approach because it is not designed to produce a final or “correct” answer, but rather act as a useful communication tool to generate debate (Hasson et al., 2000; Powell, 2003). By adopting a similar methodology, stakeholders can create metric systems that are firmly rooted in meaningful engagement and facilitate transformative changes within food systems. This adaptability highlights the study’s relevance in tackling localized food (in)security challenges and encourages the exchange of best practices across diverse communities.
2 Background
2.1 Conceptualizing food security
Food security exist “when all people, at all times, have physical, social, economic access to sufficient safe and nutritious food that meets their dietary needs and food preferences for an active and healthy life” (WSFS, 2009). The concept has evolved over time to incorporate four dimensions, which must be fulfilled simultaneously for food security to exist: availability, access, utilization, and stability. Availability focuses on the physical presence of a sufficient quantity of food in a given location or for a population Access refers to the physical and economic ability of individuals or households to acquire food, whether it is through production, purchase, or donation. Utilization emphasizes the physiological needs and nutritional well-being of the individual, and considers how the body ingests, metabolizes, and makes use of energy and nutrients in food. The stability dimension highlights the need for the first three dimensions to be sustained across time (Gross et al., 2000; FAO, 2008; Barrett, 2010; Carletto et al., 2013; Pangaribowo et al., 2013; Qureshi et al., 2015; Hwalla et al., 2016; Bahn et al., 2021; FAO, IFAD, UNICEF, WFP, and WHO, 2022).
2.2 Food security dimensions and social levels
Dimensions of food security are often associated with various social levels. Key determinants of availability such as food production, imports, and stocks are typically associated with global, regional, or national levels (Carletto et al., 2013; Bahn et al., 2021; Hwalla et al., 2016). “Household” and “individual” are often explicitly or implicitly identified in definitions of access (Gross et al., 2000; Barrett, 2010; Carletto et al., 2013; Qureshi et al., 2015; Ogot, 2021; FAO, IFAD, UNICEF, WFP, and WHO, 2022), likely because individual or household income act a key driver of access to food. Utilization aligns closely with the individual level due to its emphasis on the physiological needs of the body and nutritional status. As a temporal dimension, stability does not fit neatly into any particular social level, but rather can apply to all levels. Conceptual frameworks designed by various authors generally follow this pattern, though there are exceptions (see Figure 1).
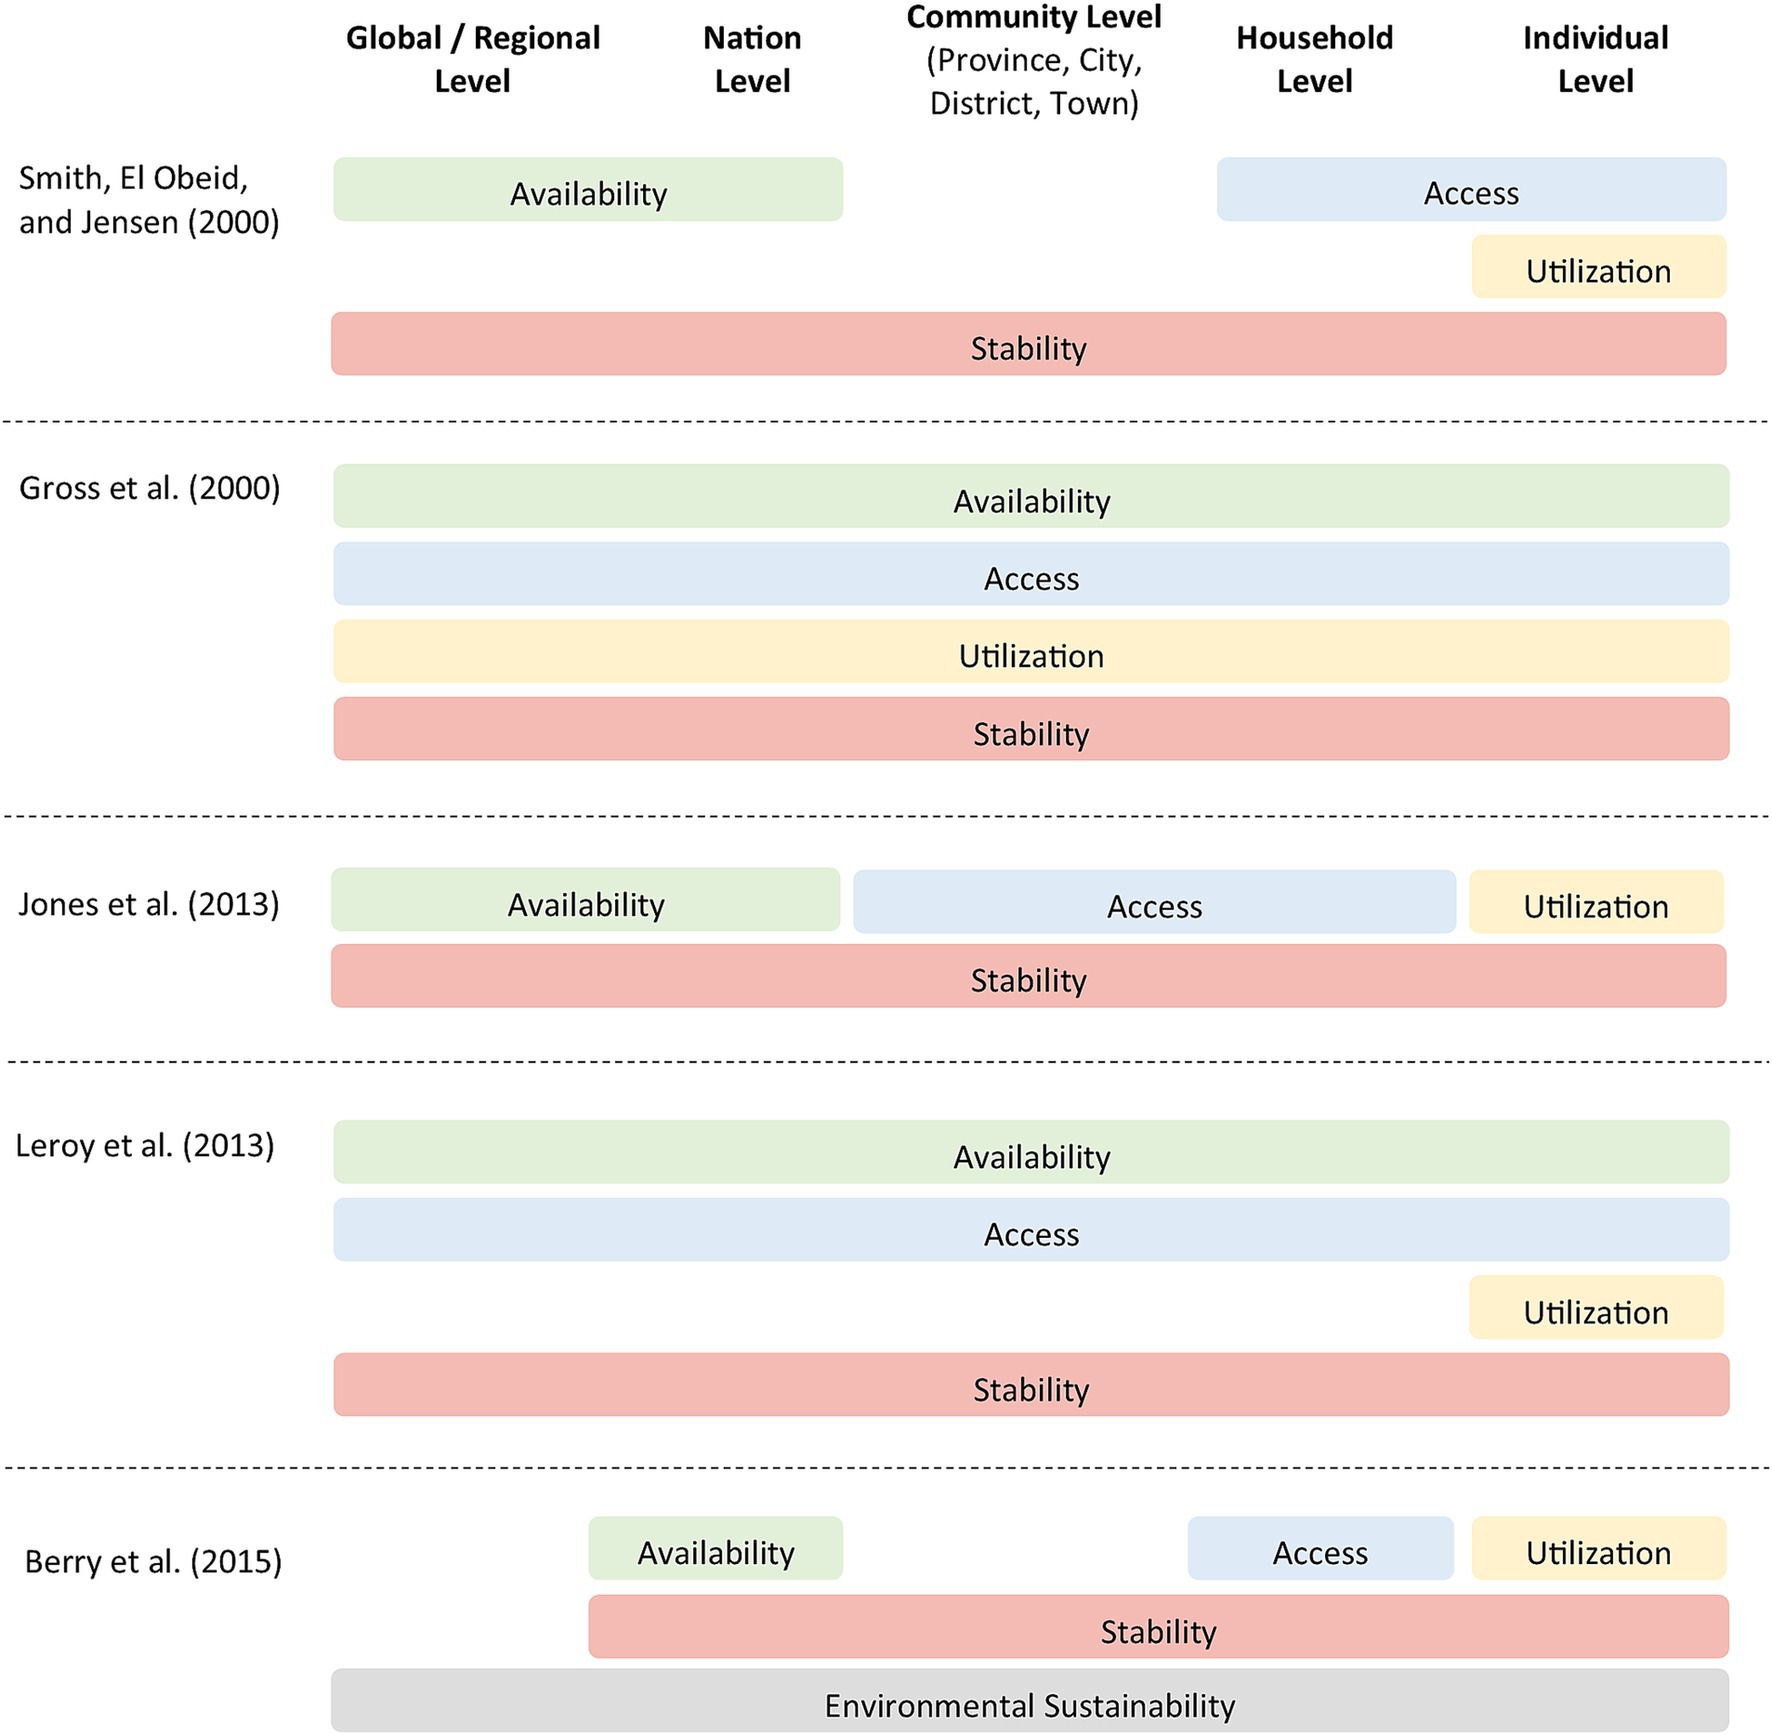
Figure 1. Food security dimensions and their associated levels, by study.
2.3 Food (in)security in Hawaiʻi
2.3.1 Risk factors
Among the many factors associated with food insecurity in Hawaiʻi, economic risk factors like low income and unemployment are key drivers. 40.2% with incomes below the poverty line did not have food security, compared to 5.3% of households with incomes over 200% of the poverty level (Juarez et al., 2023). In March 2021, 76% of families who reported very low food security had lost employment income due to COVID-19 (Pruitt et al., 2021). More recently, 49.1% of unemployed survey respondents were not food secure, compared to less than 15% of those who were employed (Juarez et al., 2023). Low educational attainment is another important risk factor; during the COVID-19 pandemic, 90% of those experiencing very low food security had a high school diploma or less (Pruitt et al., 2021). Some ethnic groups are at a higher risk: food insecurity rates for Pacific Islanders, Filipinos, and Native Hawaiians are 44, 43, and 27%, respectively – all higher than the state average of 22% (Stupplebeen et al., 2020). Food insecure individuals are also more likely to experience unstable housing, spend 50% or more of income on housing, be female, be a renter, be younger than 50 years old, experience depression, and live in a rural area (Stupplebeen et al., 2020; Pruitt et al., 2021; Juarez et al., 2023).
2.3.2 Food (in)security measurements
This study separates food (in)security metrics into two general categories: stand-alone metrics and complementary metrics. Stand-alone metrics refer to individual metrics developed specifically for measuring food (in)security. There are five stand-alone food (in)security metrics in Hawaiʻi:
(1) Current Population Survey (CPS) – Food Security Supplement (FSS)
CPS-FSS is a survey conducted annually in December via telephone by the Census Bureau and U.S. Department of Agriculture (USDA). It measures household food insecurity over the previous 12 months using the U.S. Household Food Security Survey Module (HFSSM), an experience-based survey that consists of up to 10 questions for adults and 18 questions for households with children. Recent data shows 9.1% of households were food insecure from 2019–2021 (ERS, 2023).
(2) Hawaiʻi Behavioral Risk Factor Surveillance System (BRFSS)
BRFSS is coordinated by the Centers for Disease Control and Prevention (CDC) in collaboration with the Hawaiʻi State Department of Health (DOH) (DOH, 2023). States are allowed to add questions to supplement the standard questionnaire. In 2018 and 2021, one food security question was added to the Hawaiʻi BRFSS to measure household food (in)security [Hawaiʻi Health Data Warehouse (HHDW), 2023]. The question – taken from the HFSSM – was: “The food that (I or we) bought just did not last and (I or we) did not have money to get more.” “Often true” and “sometimes true” responses were combined to estimate individual food insecurity (Stupplebeen et al., 2020). Recent data shows 14.3% of adults were food insecure in 2021 (HHDW, 2023).
(3) Map the Meal Gap (MTMG)
MTMG is an annual estimate of household food insecurity published by Feeding America, a nonprofit organization and national network of food banks, food pantries, and meal programs (Feeding America, 2023a). It is based on a statistical model that takes into consideration food insecurity, unemployment, poverty, income, homeownership, disability, and other factors (Feeding America, 2023b). Recent reports estimate 11.9% of individuals were food insecure in 2020 (Feeding America, 2023c).
(4) Household Pulse Survey (HPS)
HPS is a 20-min online survey conducted by the Census Bureau designed to collect data quickly and efficiently on the ways in which people’s lives have been impacted by the COVID-19 pandemic. HPS includes one question that measures household food insufficiency by asking respondents about their food situation in the last 7 days. Food insufficiency is more severe than food insecurity and is analogous to the CPS-FSS definition of “very low food security” (FRAC, 2021). Recent results showed 12% of adults experienced food insufficiency in April 26 – May 8, 2023 (Census Bureau, 2023).
(5) SMS Community Pulse Survey (SMS-CPS)
SMS-CPS is an independent, statewide, non-sponsored telephone survey conducted by SMS Hawaiʻi (a private company). Data collection occurred over 7 phases from May 2020 to April 2022 (SMS Hawaiʻi, 2023). Phases conducted in July 2020 and May 2021 included one question about individual food insecurity. Data published by Pirkle and Sentell (2021) showed 25% of individuals were food insecure in May 2021.
However, stand-alone metrics by themselves fail to capture the multidimensionality of food security (Discussion section details the limitations and advantages of each stand-alone metric). This study therefore identifies additional, complementary metrics that can enhance (but not replace) stand-alone metrics.
3 Methods
3.1 Conceptual approach
Figure 2 illustrates the conceptual framework of food security used in this study. Though scholars increasingly advocate for including agency and sustainability as additional food security dimensions (HLPE, 2020; Clapp et al., 2022; FAO, IFAD, UNICEF, WFP, and WHO, 2022), a four-dimensional framework is preferred because (1) six dimensions would significantly increase the burden on participants and (2) participants are likely to be more familiar with the internationally established four-dimensional approach. Like other food security frameworks, the four dimensions are associated with different social levels: availability corresponds to the national and state levels, access to the household level, and utilization to the individual level. Stability is temporal and relates to all the other dimensions.

Figure 2. Conceptual framework of the four dimensions of food security.
This study refers to the various aspects of food security as “dimensions,” but “pillars” was also used in correspondence with participants. “Pillars” was first used by the FAO (WSFS, 2009) but most experts now prefer “dimensions” (HLPE, 2020; FAO, IFAD, and WFP, 2013) because “pillars” suggests the dimensions are (1) static and separate as opposed to interrelated and interdependent and (2) of equal importance, when in fact food security challenges differ by degree and context (Berry et al., 2015).
3.2 The Delphi method
The Delphi method is a versatile technique that has been used to identify food systems indicators and metrics (Schmit et al., 2017; Allen et al., 2019; Boylan et al., 2019; Flinzberger et al., 2020; Mullender et al., 2020; Padilla-Rivera et al., 2021). No universal guidelines have been established for the proper implementation of the Delphi technique (Hasson et al., 2000). However, iteration, controlled feedback, participant anonymity, and aggregation are key building blocks for any Delphi study (von der Gracht, 2012; Saffie et al., 2016; Allen et al., 2019; Ismail and Taliep, 2023).
The Delphi technique offers many advantages. Importantly, it avoids social dynamics and political pressures, preventing any one individual from overpowering other voices (Keeney et al., 2001; Wentholt et al., 2009; Lund, 2020; Zickafoose et al., 2022). Anonymity helps to eliminate bias and allows respondents to be open and truthful about their views (Keeney et al., 2001). The Delphi approach also identifies consensus opinion when there is uncertainty or lack of empirical evidence (Powell, 2003), allows less popular ideas to be eliminated in iterative rounds rather than receiving equal weight as they might in a survey or interview, is helpful for building practical strategies (Lund, 2020), can be used with small to medium-sized sample sizes, and facilitates community input and participation in decision-making (Brady, 2015). From a practical standpoint, it gathers expert opinion without physically convening participants (Hasson et al., 2000) and utilizes low-cost questionnaires that can be sent electronically (Brady, 2015).
As for limitations, anonymity may result in a lack of accountability (Allen et al., 2019) or be compromised altogether in small communities if participants talk about the study among themselves (Brady, 2015). The focus on consensus can result in a diluted version of the best opinion, a “lowest common denominator” (Powell, 2003, p. 378). In some cases, the iterative process can also eliminate ideas because they are less popular even if those ideas are important pieces of data that represent the feelings or experience of some respondents (Lund, 2020). Additionally, bias may be associated with the prioritization of “expert” opinion. Lund (2020) notes the Delphi approach assumes (1) it is possible to identify individuals who can be considered “experts” on a subject, (2) “experts” always have the best ideas, and (3) the most popular ideas are the best ideas. Bias of the experts themselves is also an issue, as participants must try to respond impartially and reflect current knowledge even though they may be directly affected by the outcome (Keeney et al., 2001).
3.3 Conducting the study
3.3.1 Interview phase
This study consisted of two phases, an interview phase and a Delphi phase. The interview phase was conducted from May – August, 2022 and comprised of a literature review and one-on-one, semi-structured, online interviews with Hawaiʻi-based food security experts, community leaders, and other stakeholders. Interviews lasted 30–60 min. Originally, research and data collection were scheduled to end here.
3.3.2 Delphi phase: round 1
Opportunity arose to build upon this research the following year. The research question was redefined to what is articulated in this study’s Introduction, and a Delphi method was adopted. Interviews were treated as the exploratory phase of a typical Delphi study and findings were used as a foundation on which to identify metrics included in the Delphi phase, which lasted from March – August 2023. Round 1 of the Delphi phase consisted of an online survey that asked participants to rate the usefulness of (1) stand-alone metrics and (2) complementary metrics grouped under each dimension of food security. Open-ended questions were included to gain insight into participants’ reasoning. Two weeks were allotted for participants to complete the survey, but this was extended by two weeks to increase the response rate. Anonymized results – including the average group ratings and standard deviations for each metric – were compiled and shared with participants.
3.3.3 Delphi phase: round 2
Round 2 of the Delphi phase focused on establishing consensus by giving participants a chance to change their rating to align with the group more closely. If a metric did not achieve consensus in Round 1, participants were presented with their original rating and the group average and asked to re-rate the metric. Those who responded “Do not know/Unsure” or did not rate a metric in Round 1 were not asked to rate that metric in Round 2. Open-ended questions were once again included to gain insight into participants’ reasoning. Anonymized results and overall findings were shared with participants. Time constraints and diminishing participation rates prevented the implementation of a third Delphi round focused on metrics that had not yet reached the consensus threshold. Figure 3 outlines this study’s research procedure.
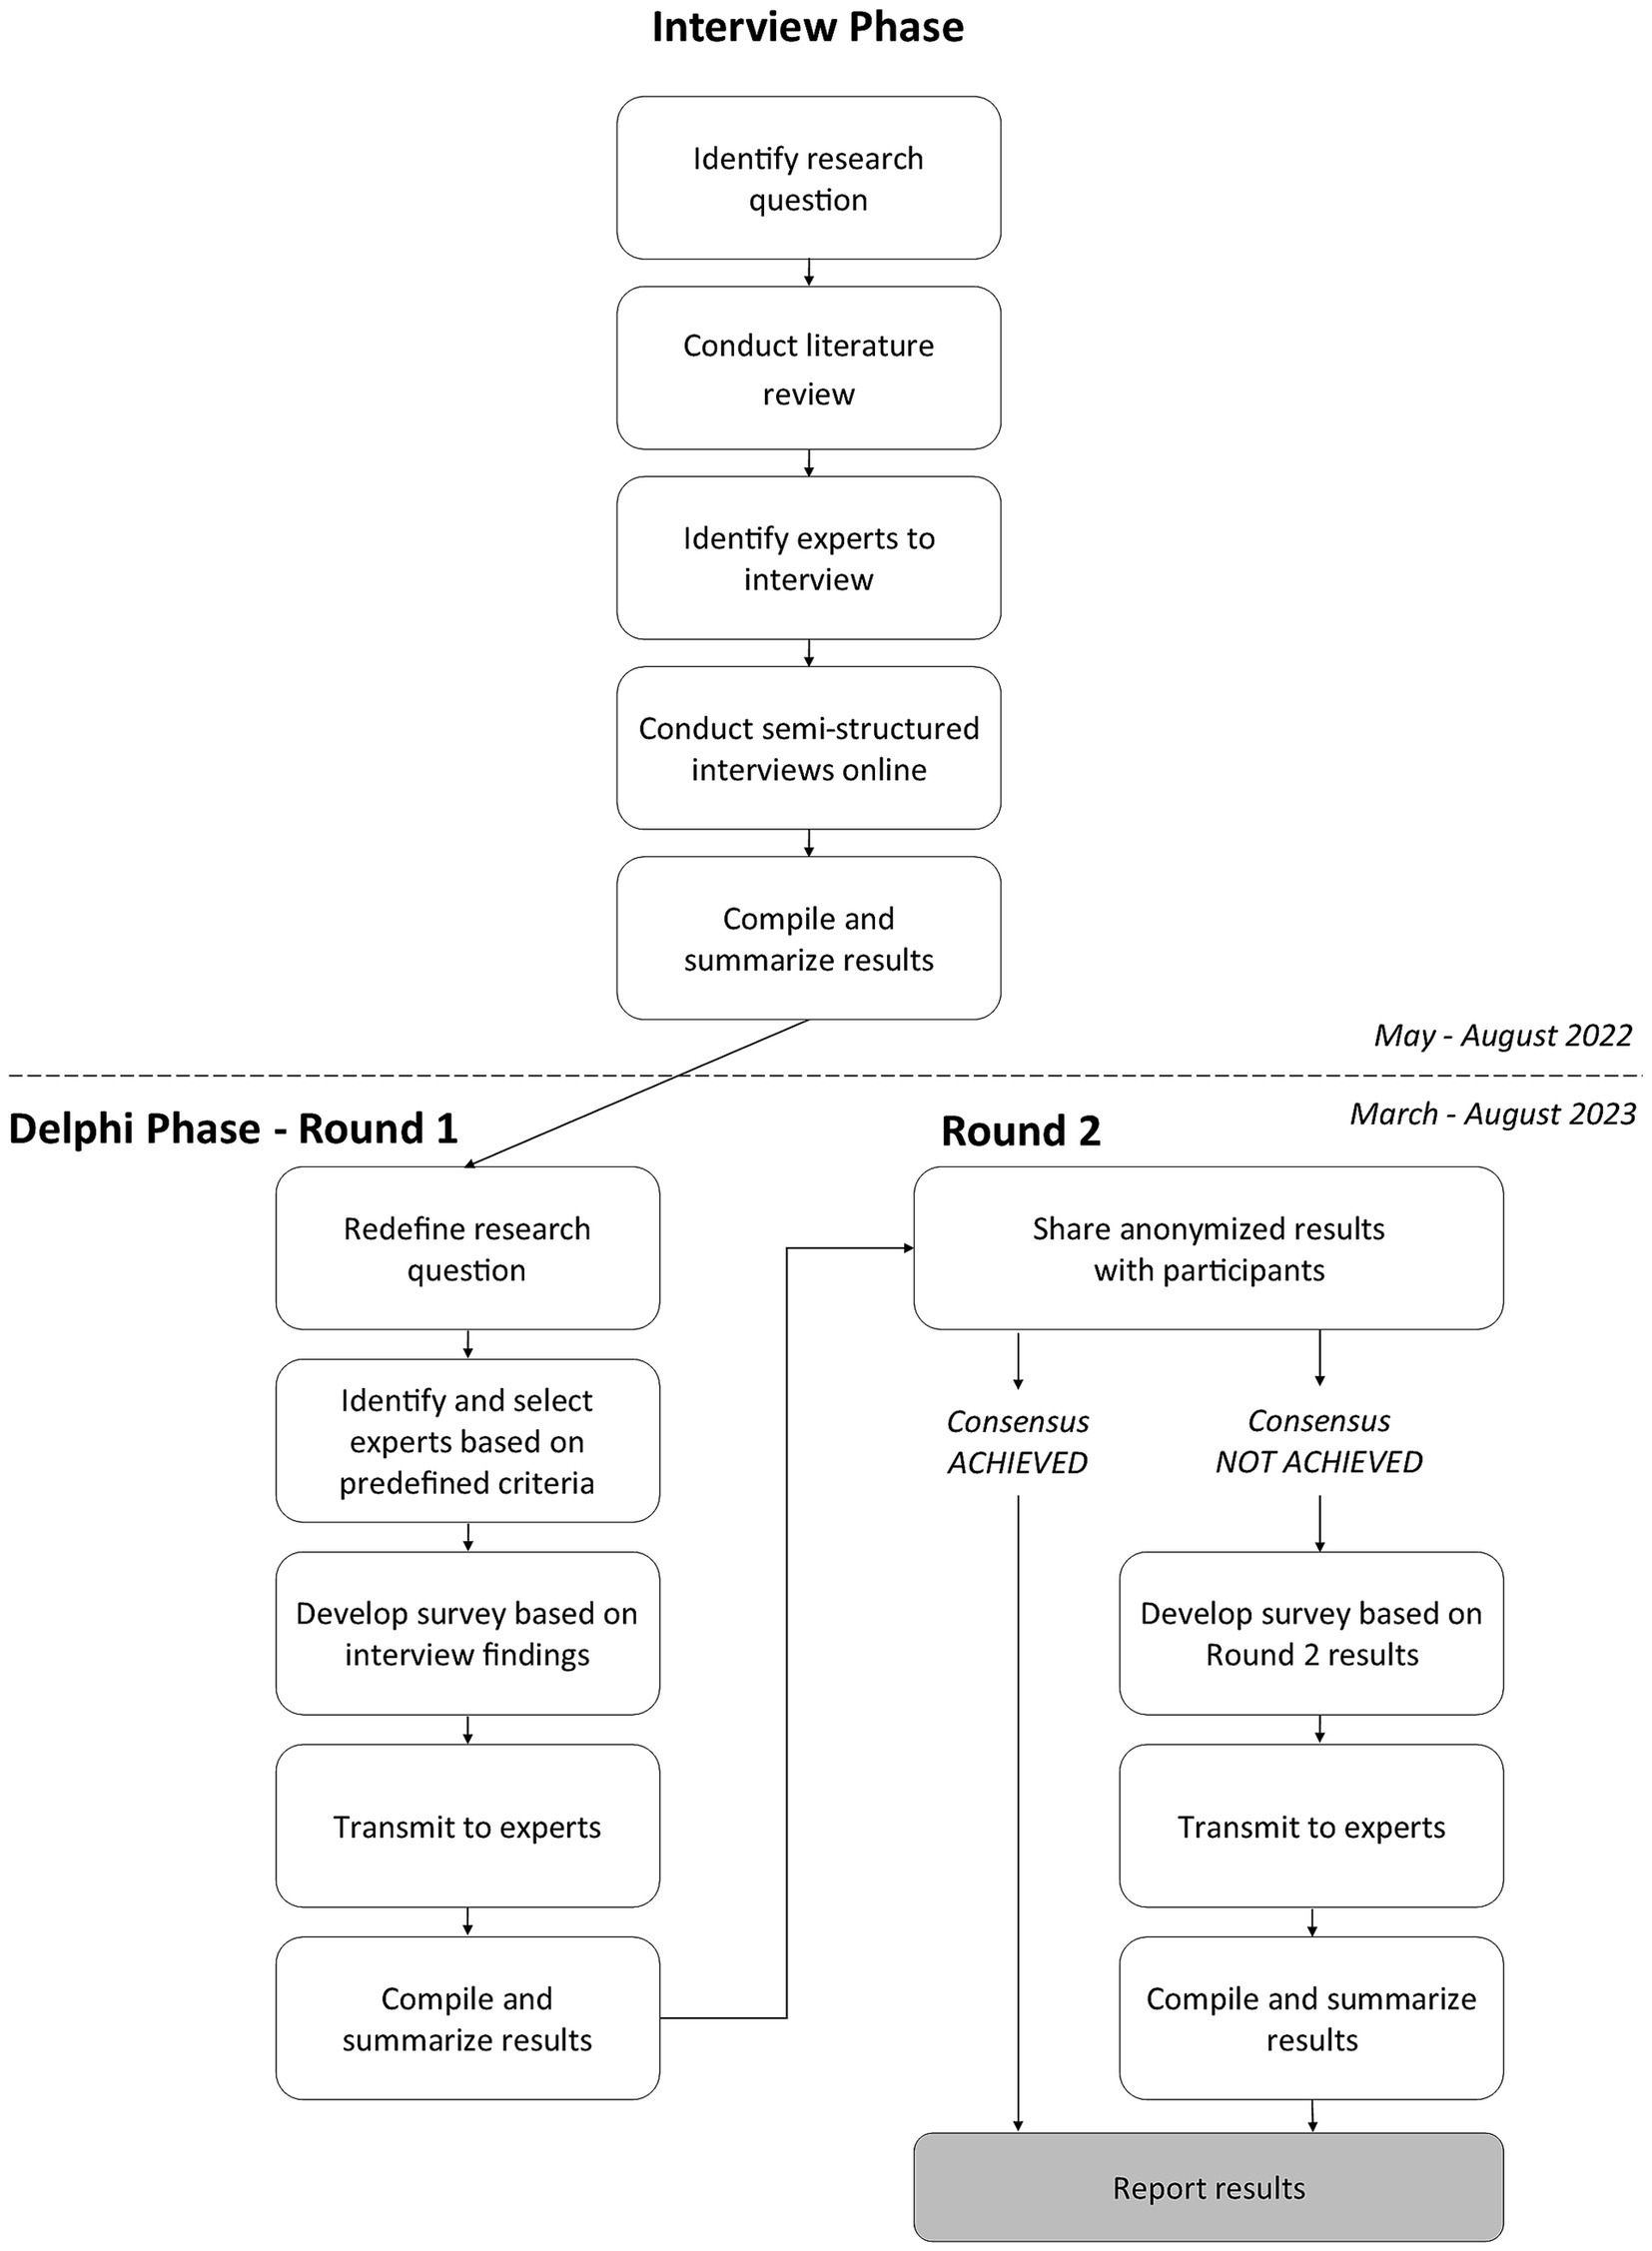
Figure 3. Research procedure.
3.3.4 Consensus
There is no agreed-upon definition of what constitutes consensus in Delphi studies (Niederberger et al., 2021). Standard deviation and mean average are one of the most common methods of determining consensus among measures of dispersion (von der Gracht, 2012). A standard deviation of <1 on a 5-point Likert scale is commonly considered to signify consensus (Musa et al., 2015; Niederberger et al., 2021) and was adopted here.
3.3.5 Participant selection
During the interview phase, participants were identified through their affiliation with anti-hunger organizations and initiatives in Hawaiʻi and word of mouth. Delphi phase participants were vetted to confirm they met at least one of the following predetermined criteria, which was adapted from Zickafoose et al. (2022) and Lund (2020):
• Held or holds a position of authority related to strengthening food security in Hawaiʻi (e.g., employment in a relevant role within a relevant organization).
• Authored or co-authored scholarly publications related to food security in Hawaiʻi.
• Are considered by an individual who meets either of the criteria above as an expert on food security in Hawaiʻi.
Participants were identified through academic literature, affiliation with organizations and initiatives engaged in food (in)security-related work, word-of-mouth, and nomination by other experts.
The number of participants in Delphi studies has ranged from 10–1,685 depending on the scope of the issue and availability of resources (Reid, 1988 via Powell, 2003). A review of 49 Delphi studies (Mukherjee et al., 2018) found a median sample size of 20 participants. A separate review of 122 Delphi studies suggested 23 is an optimum number of participants, but anywhere from 14–36 participants is appropriate for publishable research (Lund, 2020).
3.3.6 Metric criteria
To ensure maximum relevance and utility to the local context, metrics were chosen based on the following criteria:
• Statewide (e.g., not a national average or average of a smaller community or island within the state).
• Quantitatively measurable.
• Understandable and accessible to the general public at no cost.
• Available now.
• Periodically updated.
• Relevant to food security or its dimensions.
3.3.7 Rating system
Participants rated metrics on a 5-point Likert scale, one of the most commonly used rating scales in Delphi studies (Giannarou and Zervas, 2014; Jünger et al., 2017). A rating of 1 indicated the metric was “Not at all useful” and 5 indicated the metric was “Extremely useful.” A sixth option – “Do not know/Unsure” – was also provided in case participants felt they did not know enough about a metric to rate it. “Do not know/Unsure” responses were excluded from standard deviation calculations.
3.3.8 Anonymity
Complete anonymity could not be provided for participants because individualized questionnaires for Round 2 needed to be sent electronically to each person directly. Additionally, Hawaiʻi is a relatively small state and the work of many experts overlaps. Many participants were aware of other experts who were invited to participate in the study, though their responses remained anonymous. McKenna (1994) describes this relationship as “quasi-anonymity” (p. 1224).
3.3.9 Group stability
Group stability refers to “the consistency of responses between successive rounds of a study” (Dajani et al., 1979, p. 87). Dajani et al. (1979) and von der Gracht (2012) argue that Delphi rounds should only be stopped after group stability has been confirmed to ensure results have not occurred by chance. However, confirming group stability would require each participant to re-rate all metrics in all Delphi rounds, a significant time investment for participants. A review of 34 Delphi studies since 2019 found stability was almost never used as a closing criterion and was often not reported (Nasa et al., 2021). In practice, consensus and not stability is often used as the criterion for stopping further inquiry (Chu and Hwang, 2008; Aziz et al., 2015; Chen et al., 2017); this study adopts the same approach.
4 Results
4.1 Participation and participant characteristics
Fifteen online interviews were conducted during the interview phase. Of 46 invitations sent in the Delphi phase, 24 experts (52%) responded to Round 1 (including 4 partial responses) and 14 (58%) responded to Round 2 (see Table 1). Participants who provided partial responses in Round 1 were included in Round 2 but were only asked to reconsider the metrics they had rated in Round 1. Participant characteristics stayed relatively consistent throughout the study. Of 24 respondents who participated in the Delphi phase, 71% identified with civil society or non-governmental organizations (NGO) in both Round 1 (n = 17) and Round 2 (n = 10) while 21% identified with academia in Round 1 (n = 5) and Round 2 (n = 3). One person each from the private sector and government participated in Round 1 (4% each) while only the government-affiliated expert responded in Round 2 (7%). Participants were also asked to identify where their understanding of food security was grounded. Those who selected “statewide” represented 54% (n = 13) of responses in Round 1 and 50% (n = 7) in Round 2. The remaining responses were divided between the different islands. Oʻahu experts represented 29% (n = 7) of responses in Round 1 and 36% (n = 5) in Round 2. Molokaʻi, Maui, Kauaʻi and Hawaiʻi Island were represented by one expert each in Round 1. Kauaʻi and Hawaiʻi Island experts also responded to Round 2 (see Table 2).
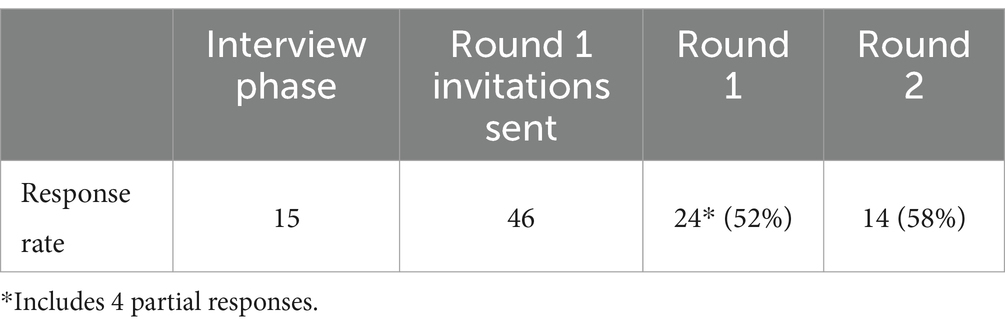
Table 1. Response and participation rates.
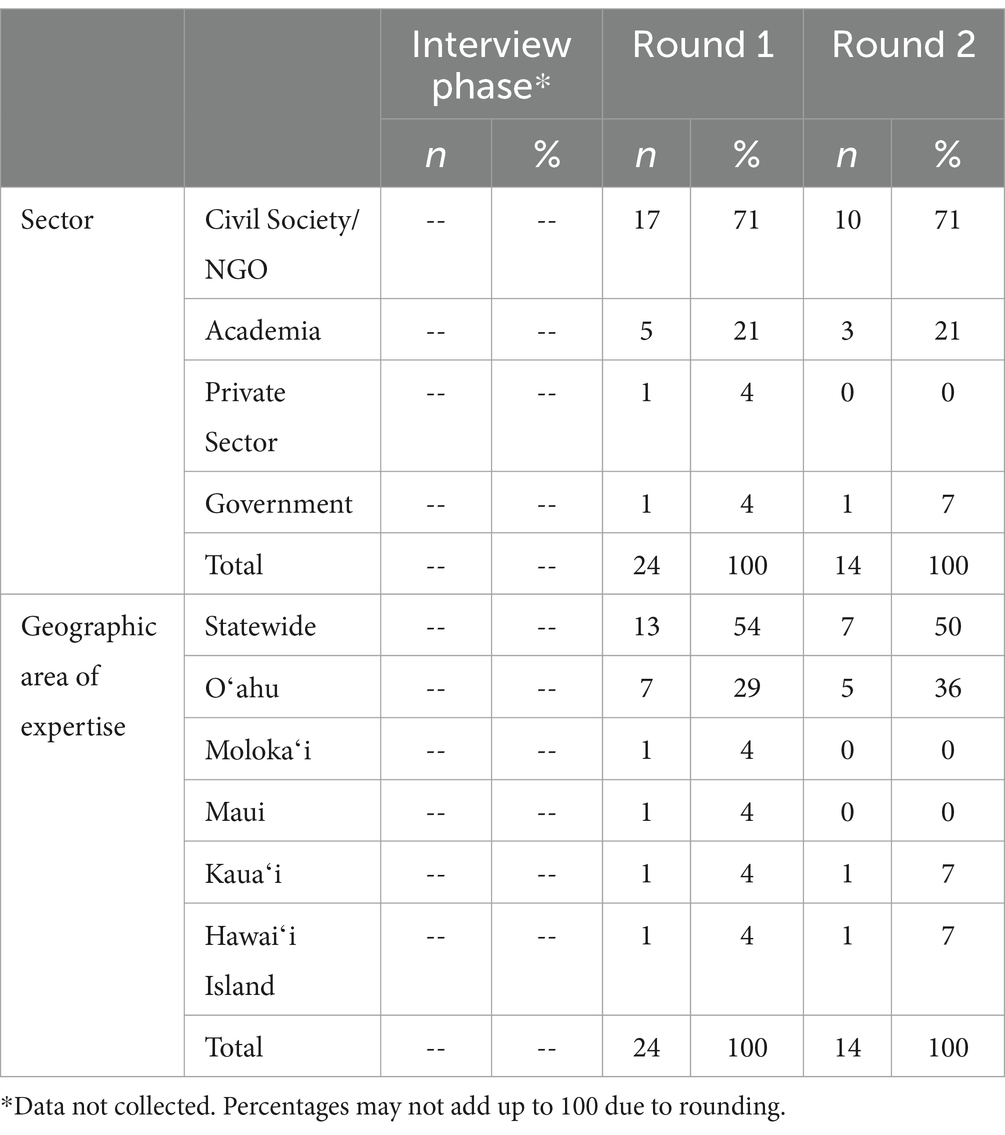
Table 2. Participant characteristics, by sector affiliation and geographic area of expertise.
4.2 Interview phase
Interviews established a knowledge base from which suitable metrics were identified for the Delphi phase. Participant views about the potential root causes and risk factors of food insecurity were particularly helpful.
4.3 Delphi phase
4.3.1 Number of metrics and progression of consensus
A total of 71 metrics were rated. Consensus increased from 18% in Round 1 (10 of 55 metrics) to 78% in Round 2 (55 of 71 metrics). All stand-alone metrics (5 of 5 metrics) and 75% of complementary metrics (50 of 66 metrics) reached consensus.
Among complementary metrics, consensus was lowest under the availability dimension at 25% (1 of 5 metrics) in Round 2. There was no progression of consensus because availability metrics were excluded from the Round 1 survey on the grounds that per capita availability of food is not an important factor in determining food (in)security status in highly developed countries like the United States. However, 64% of participants disagreed with this approach. Availability metrics were therefore included in the Round 2 survey, with metrics related to local production and farmers’ markets transferred from stability to availability. Participants were asked to re-rate these metrics (even if the metrics had achieved consensus in Round 1) to ensure ratings were based on the suitability of the metric to the availability dimension. However, Round 2 average ratings were low and the consensus rate was lower than all other food security dimensions.
The access dimension consisted of the most metrics – more than all other dimensions combined – due to the various federal nutrition programs available in Hawaiʻi. Consensus progressed from 11% in Round 1 (3 of 27 metrics) to 83% in Round 2 (39 of 47 metrics). The consensus rate was highest under the utilization dimension, progressing from 24% (4 of 17 metrics) in Round 1 to 100% (6 of 6 metrics) in Round 2. Under the stability dimension, consensus progressed from 18% in Round 1 (1 of 8 metrics) to 50% (4 of 8 metrics) in Round 2. In response to participant feedback, fourteen metrics were added in Round 2 and 19 metrics were transferred from one dimension to another (see Table 3).
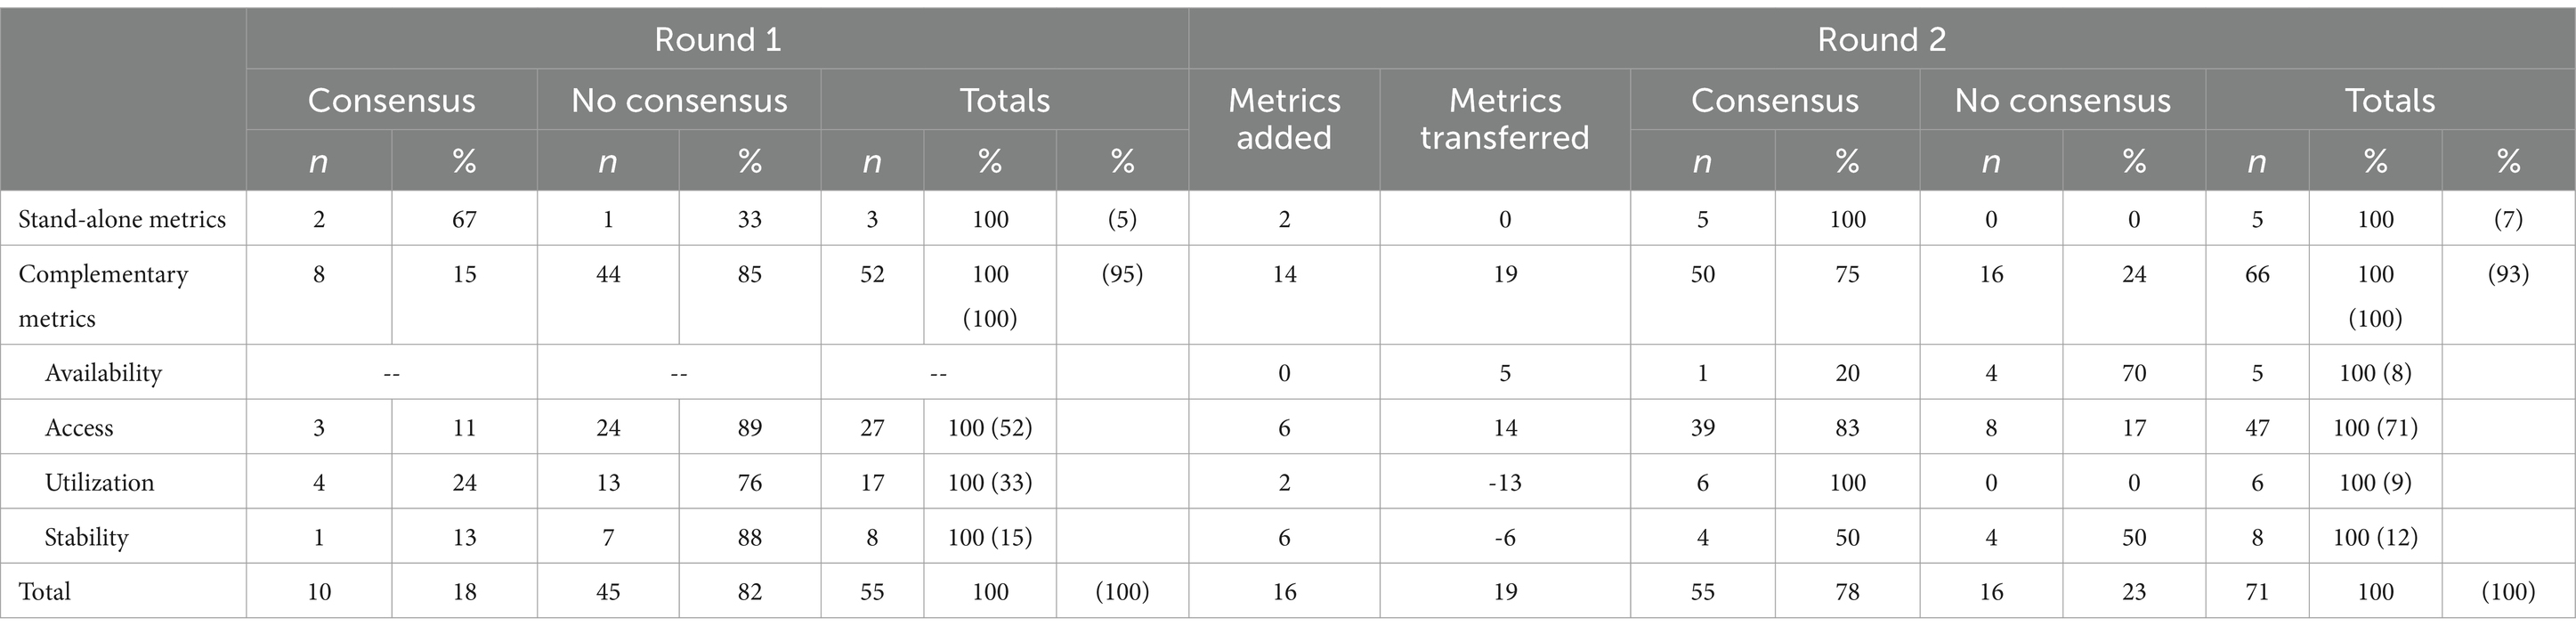
Table 3. Number of metrics and progression of consensus.
4.3.2 Average ratings
Among stand-alone metrics, CPS-FSS received the highest average rating (3.5, SD = 0.8), followed by Feeding America’s MTMG (3.4, SD = 0.9) and Hawaiʻi BRFSS (3.2, SD = 0.9). HPS and SMS-CPS were excluded in Round 1 due to their significant limitations but added in Round 2 after being proposed by participants. However, they did not receive high ratings (2.9, SD = 0.7 and 2.5, SD = 0.9, respectively).
Among complementary metrics, the access dimension accounted for the six highest-rated and 10 of the top 12 metrics. ‘Rate of households below the ALICE [Asset Limited, Income Constrained, and Employed] threshold’ (4.4, SD = 0.7) received a considerably higher average rating than the second-highest metric, ‘percentage of food insecure individuals and children ineligible for federal nutrition assistance programs, including SNAP [Supplemental Nutrition Assistance Program]’ (4.0, SD = 0.8). ‘Percentage of households with at least one child under 18 receiving SNAP or food stamps’ (3.9, SD = 0.9), ‘living wage-to-minimum wage ratio’ (3.8, SD = 0.8), ‘SNAP participation rates’ (3.7, SD = 0.6), and ‘WIC [Special Supplemental Nutrition Program for Women, Infants, and Children] coverage rates’ (3.6, SD = 0.6) rounded out the top six metrics. Six other metrics – four from the access dimension and two from the utilization dimension – tied for seventh place with an average rating of 3.5. The two utilization metrics – ‘percent of Hawaiʻi adults experiencing 14+ days of poor physical and mental health in the last 30 days’ (3.5, SD = 0.8) and ‘percentage of adults and teens who consume five or more servings of fruits and vegetables daily’ (3.5, SD = 0.9) – were the only non-access metrics to break into the top 12 (see Table 4). The highest-rated availability metric was ‘pounds of food locally produced’ (3.0, SD = 0.9) and the highest-rated stability metric was ‘monthly seasonally adjusted civilian unemployment rate’ (3.2, SD = 0.8); however, neither received high enough ratings to be included in the top 12 (See Supplementary materials for results of all complementary metrics).
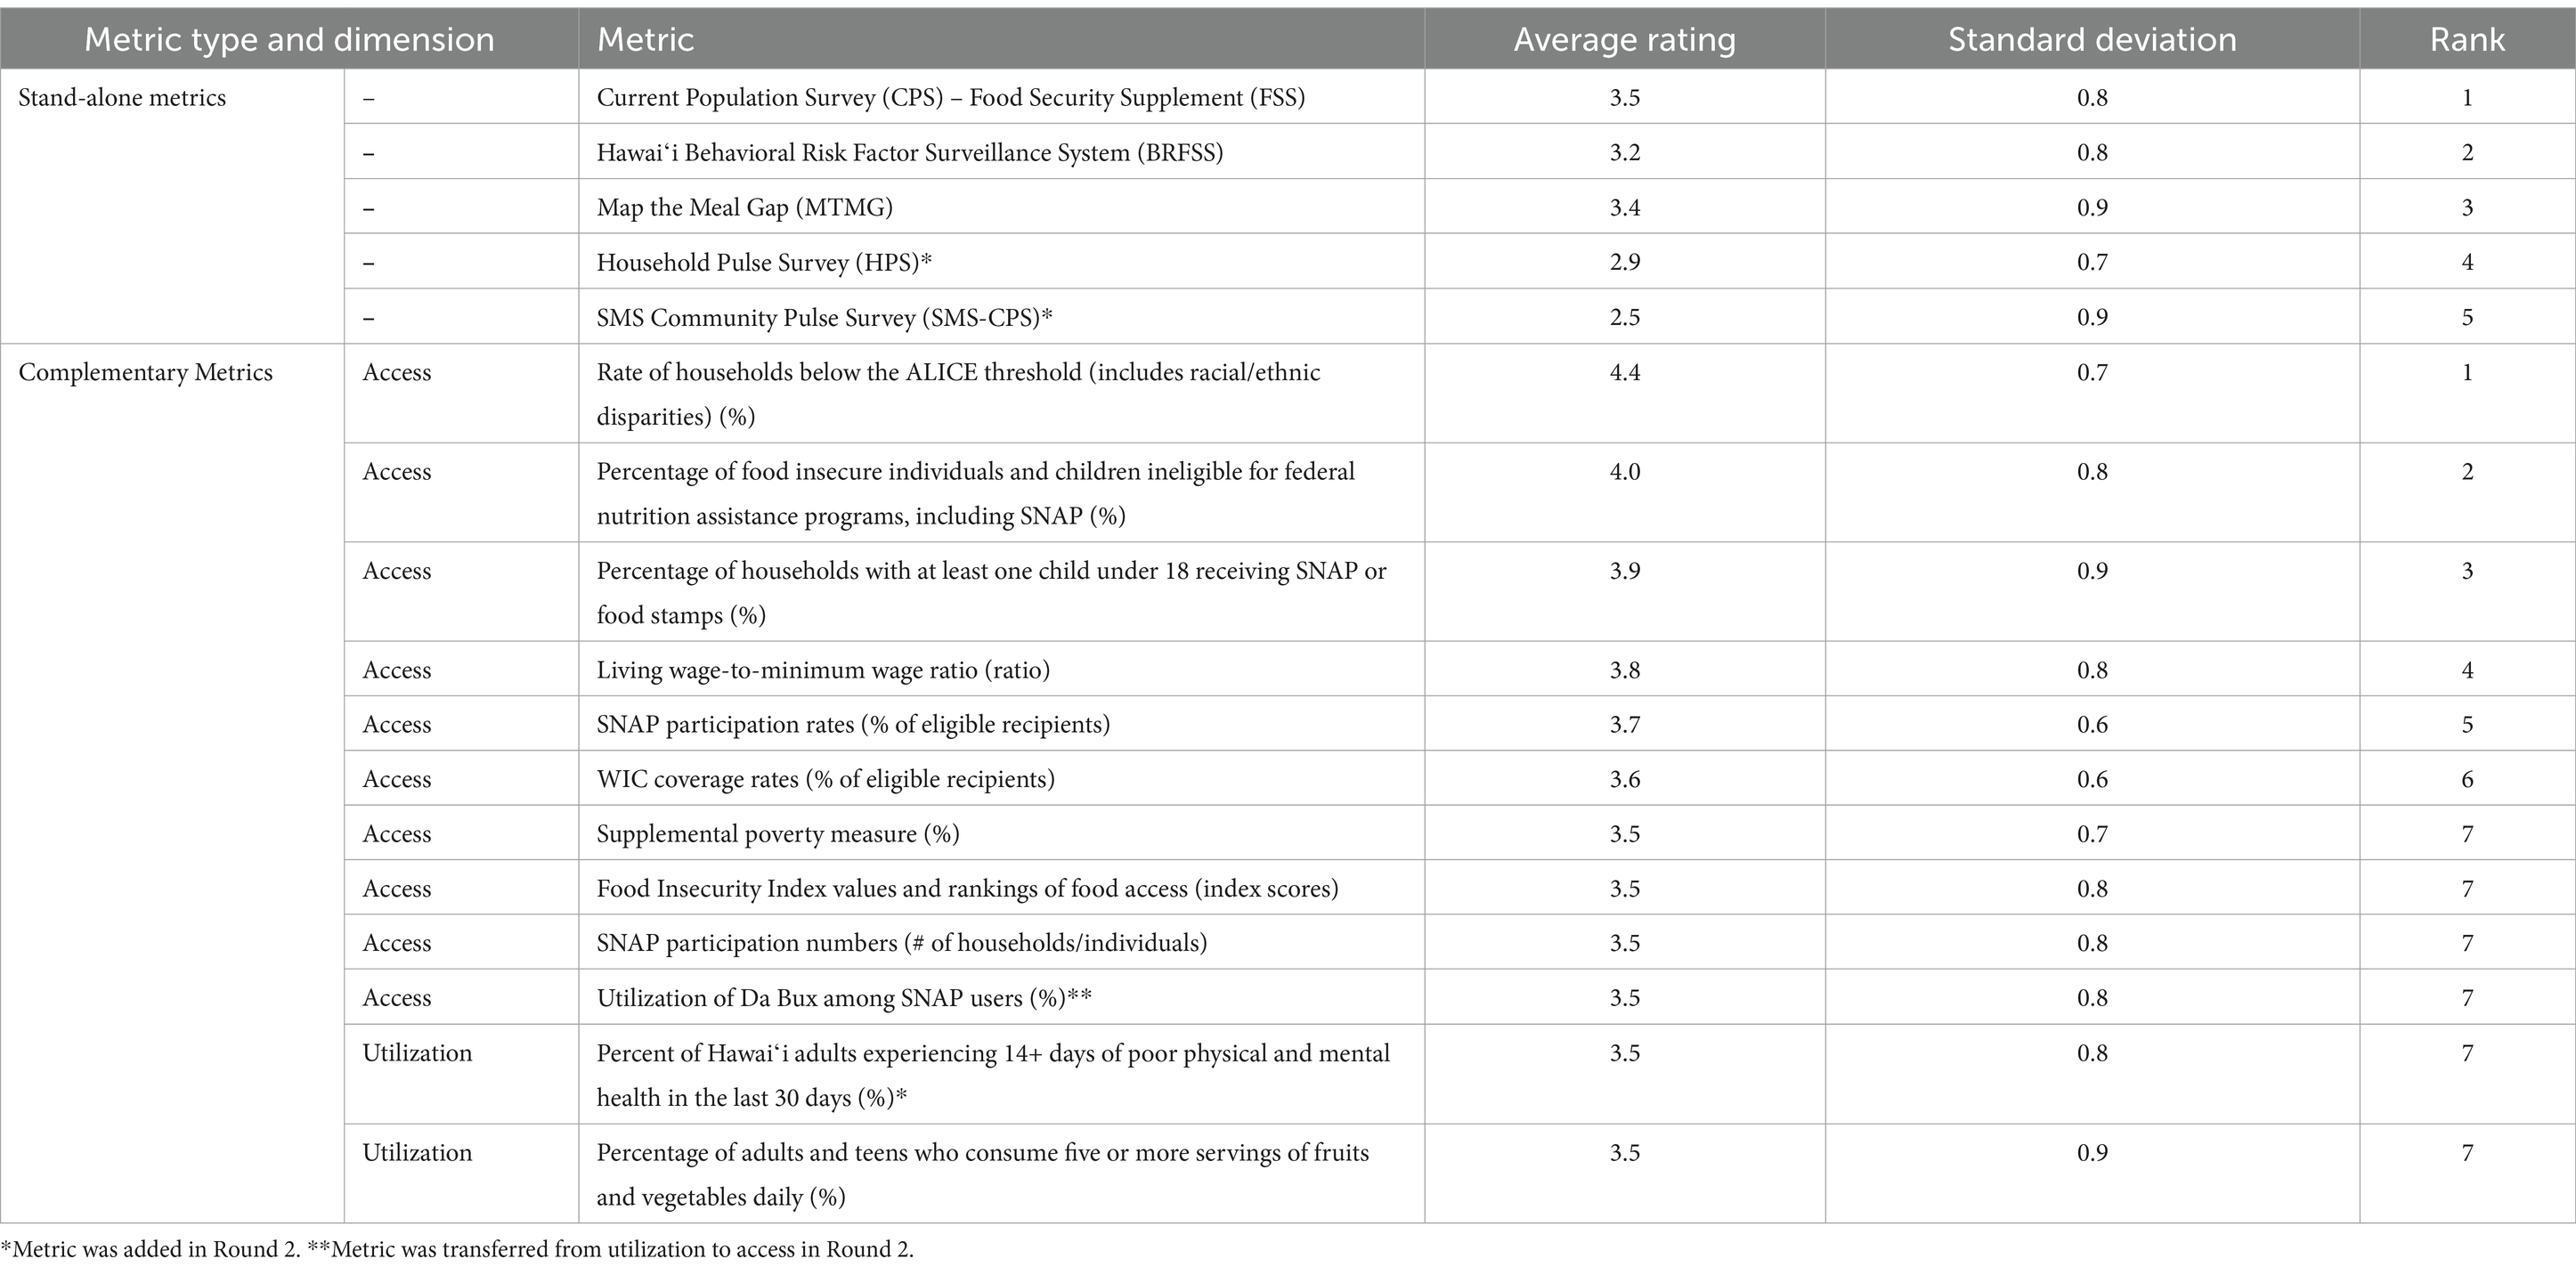
Table 4. Highest rated stand-alone and complementary metrics.
Participants’ emphasis on the access dimension was consistent even when ratings were grouped by participant characteristics. When ratings were grouped by sector affiliation, access metrics accounted for 6 of 7 of the top metrics for academia and civil society/NGO. Two metrics were common to both groups. On grouping based on whether participants’ understanding of food security was grounded (1) in one of the Hawaiian Islands or (2) at the state level, access metrics accounted for 8 of the top 9 and 9 of the top 10 metrics, respectively. Four metrics were common to both groups. ‘Rate of households below the ALICE threshold’ received the highest ratings in all groups.
5 Discussion
Several key observations, implications, and recommendations are outlined below:
5.1 The definition and scope of food (in)security dimensions require clarification
Analysis of participant comments showed “availability” was interpreted differently by different people. This study’s conceptual framework considers food to be available if it is physically present currently anywhere in the state. However, when explaining why they disagreed with the decision to exclude availability metrics in Round 1, many participants cited factors that could threaten availability in the future, such as natural disasters, labor strikes, increases in prices and transportation costs, climate impacts, and other world events. Similarly, some participants felt availability was a problem in certain areas, such as low income, immigrant, and indigenous neighborhoods. As one participant wrote, availability “may not seem relevant now, [but] it could become so quite quickly, and for some areas of the state more than others.” From the authors’ perspective, however, these concerns are not issues of availability but matters of stability and access because they relate to the potential impacts of events in the future and over time, or the inability of specific groups or communities to access food already present within Hawaiʻi. Table 5 summarizes these differences in interpretation. Whether due to confusion, disagreement, or simply a lack of clearly defined terminology, these discrepancies (1) help to explain the low rates of consensus and (2) reveal the difficulty of describing food security issues in Hawaiʻi precisely. The conceptual framework attempted to provide some degree of clarity, but findings suggest more work is required to establish a common approach for employing technical food security terms.

Table 5. Examples of different interpretations of “Availability”.
The scope of the utilization dimension also requires nuanced clarification. Metrics focused on health outcomes received high ratings but may not be appropriate proxy measures for utilization. For example, ‘percent of Hawaiʻi adults experiencing 14+ days of poor mental and physical health in the last 30 days’ (3.5, SD = 0.8) received joint-highest ratings. Research in Hawaiʻi supports the link between food insecurity and physical and mental health, including suicidal ideation, lower self-esteem, and depression (Stupplebeen et al., 2020; Juarez et al., 2023). More broadly, meta-analyses have found food insecurity is associated with common mental disorders like depression, anxiety, sleep disorders, and stress (Bruening et al., 2017; Arenas et al., 2019; Pourmotabbed et al., 2020; Tribble et al., 2020; Thomas et al., 2021), as well as negative physical health outcomes including diabetes and cardiovascular disease (Gucciardi et al., 2014; Gundersen and Ziliak, 2015; Leung et al., 2020; Thomas et al., 2021; Kantilafti et al., 2023). However, there are many potential determinants of poor mental or physical health other than food insecurity; determinants can range widely from individual attributes and genetics to broader social, cultural, economic, political and environmental factors (WHO, 2021a). An increase in these percentages may not be attributable to increased food insecurity.
The second-highest rated metric – ‘prevalence of overweight and obesity among children, teens, and adults’ (3.3, SD = 0.6) – was more controversial. The metric is based on body mass index (BMI), which one participant accepted as useful: “While it’s been trendy to stigmatize weight-focused metrics, BMI is an easy data point to collect and useful indicator of health which is strongly correlated to healthy food consumption. So I feel good about scoring prevalence of obesity as a 4.” Indeed, the association between obesity/overweight and unhealthy diets is well established (WHO, 2020; WHO, 2021b; Jakobsen et al., 2023) as are associations between overweight/obesity and food insecurity (Moradi et al., 2019; Pourmotabbed et al., 2020; Thomas et al., 2021; Eskandari et al., 2022; Zhou et al., 2023). Once again, however, food insecurity and unhealthy diets are not the only determinants of overweight/obesity. “There are a lot of other determinants from genetics, to physical activity, to stress, and even exposure to organochlorines,” one participant correctly remarked. With so many biological, environmental, and societal factors contributing to obesity (Lee et al., 2017; Blüher, 2019), adopting such a complex and challenging public health issue as a proxy measure may not be advisable because population-level changes in BMI (or lack thereof) may not be attributable to changes in food (in)security or utilization. Furthermore, there is increasing evidence that overweight itself is not bad for one’s health and can actually lower all-cause mortality, particularly for older age groups (Flegal et al., 2013; Hughes, 2013). “Being ‘overweight’ does not necessarily indicate being unhealthy,” wrote one participant. “It is extremely problematic to assume so…PLEASE do not include this measure.”
Ambiguities in the definition and scope of food security dimensions point to a need for all stakeholders to adopt a clear, standardized framework and common language for discussing food security in Hawaiʻi. Figure 4 proposes a revised conceptual framework, informed by survey results, that includes the following updates:
(1) Focuses on Availability at the State Level: By anchoring availability to the state level, this framework highlights Hawaiʻi’s unique context while still acknowledging the impact of national or global events on local food availability.
(2) Emphasizes Key Factors: The framework integrates and emphasizes factors highly rated by survey participants, ensuring that the most relevant aspects are addressed.
(3) Prioritizes Healthy Diets in Utilization: This refinement designates healthy diets as the central focus within the utilization dimension. Results suggest health metrics and other considerations like sanitation and health care – which typically fall under the purview of nutrition security (FNS, 2022) – are less well-suited for assessing utilization in Hawaiʻi’s context.
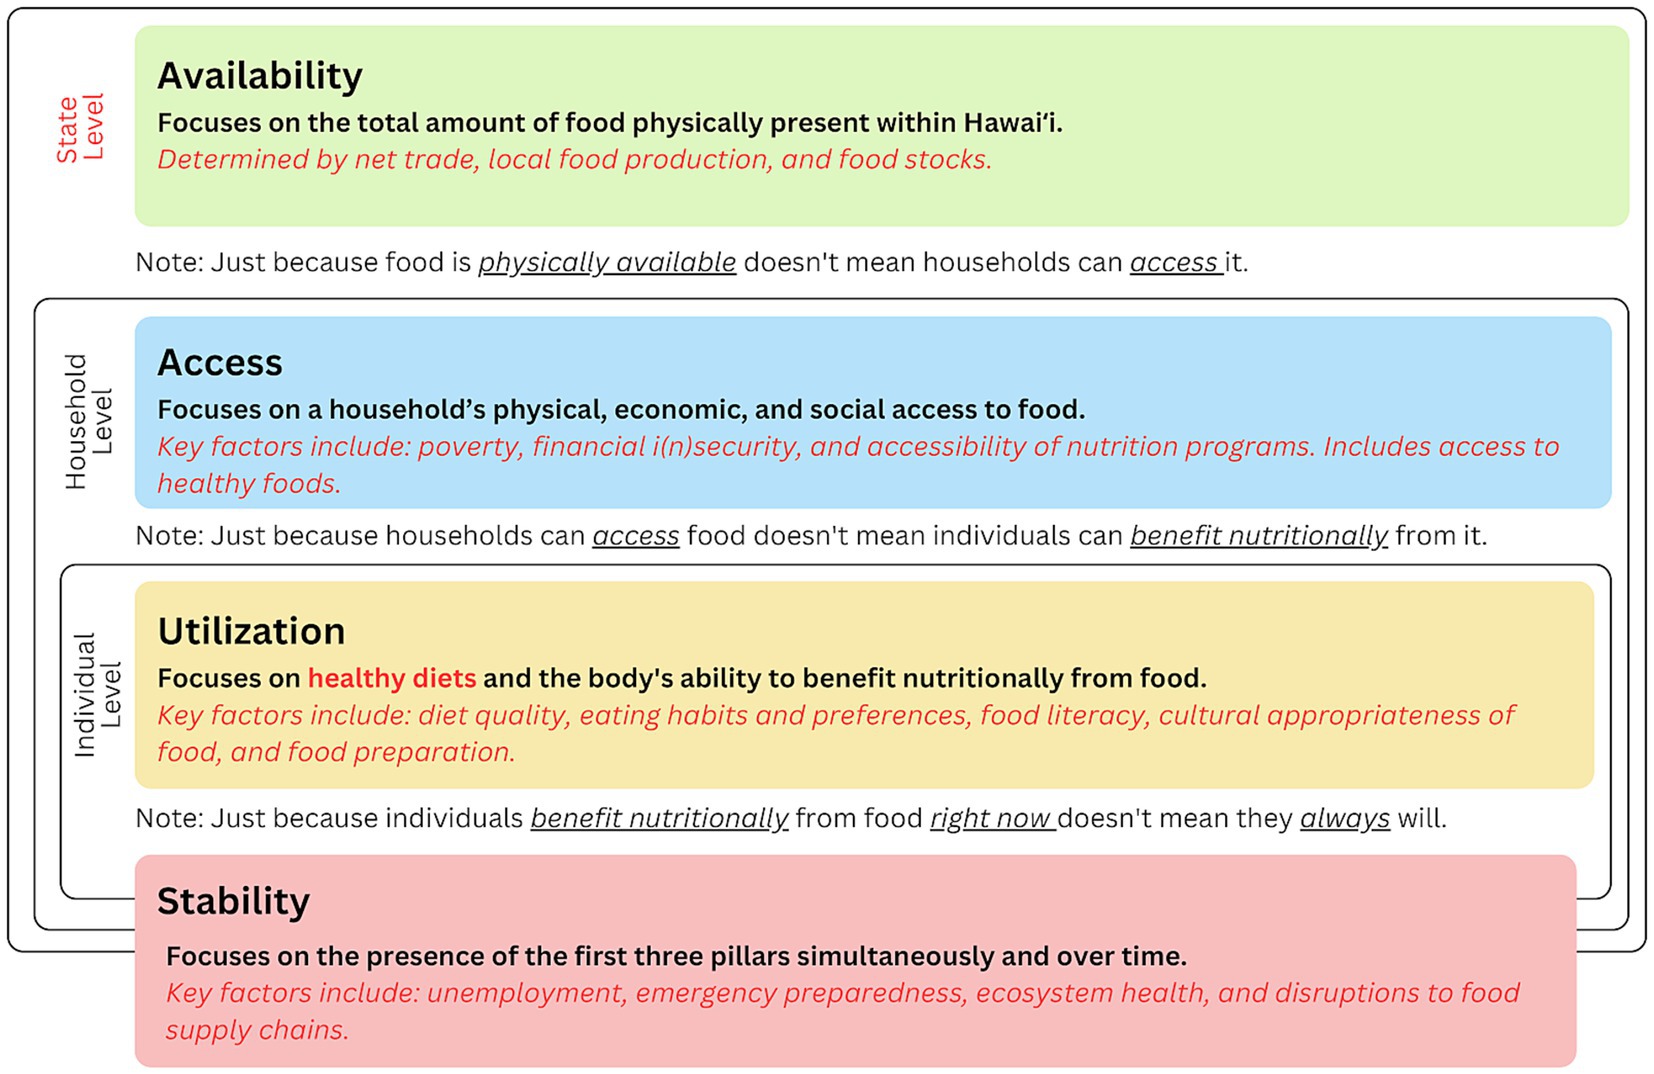
Figure 4. Revised conceptual framework of food security in Hawaiʻi. Revised sections are presented in red.
5.2 Misconceptions about food (in)security persist
Some comments revealed assumptions that do not fully align with the current understanding of the relationship between food imports, local production, and food (in)security in Hawaiʻi. The first is that transporting food long distances to Hawaiʻi leads to much higher food prices: “[Importing food for residents and the tourism and military industries] adds significantly to our food costs, exacerbating food insecurity for our most vulnerable populations,” one participant wrote. Various sources estimate ocean transport does increase the cost of goods, but only by 1.75–7.5% compared to the national average – much less than many might assume and significantly less than the 59% increase in costs attributed to rents and services (Pape, 2015). Lowering shipping costs would not translate into substantially lower food prices for Hawaiʻi.
Furthermore, it is misleading to compare the price of imported food to the price of food on the continental U.S.; a more apt comparison would be to compare the price of imported food to the price of food produced in Hawaiʻi. Here, the evidence is clear: it is expensive to grow food in Hawaiʻi. Hawaiʻi farms face higher input costs than their competitors (Parcon et al., 2011), are smaller (Naomasa et al., 2013), and are generally 15–20% less efficient than continental U.S. farms (Arita et al., 2012). Many farmers feel economic constraints – particularly relating to labor, land, or capital (Miles and Heaivilin, 2018) – make the state’s goal of doubling local production by 2030 impractical (Meter and Goldenberg, 2017). High production costs translate into higher prices for consumers, meaning imported food is typically less expensive than locally produced food (Khan et al., 2020).
The second assumption is that increasing local food production increases food security. “Availability of local food is critical to increasing food security,” remarked one participant. Indeed, food security and self-sufficiency – or the extent to which Hawaiʻi can “satisfy its food needs from its own domestic production” (DBEDT and DOA, 2012, p. 4) – are often conflated and used interchangeably (Leonard, 2021; Lyte, 2021; Terrell, 2021). However, greater self-sufficiency does not guarantee food security for several reasons. First, the higher price of locally produced food means the primary beneficiaries of increased production will likely be high-income residents and tourists, not low-income or food insecure families (Shaw et al., 2021). Second, most agricultural land is used to produce export crops like coffee and macadamia nuts (NASS, 2023); other non-food crops like seeds, biofuels, and ornamentals do not contribute to food security (Kent, 2016). Third, increasing self-sufficiency too much or in the wrong way could reduce food security by creating overdependence on one source, depleting local resources, or disproportionately disadvantaging some groups like the non-farming poor. Food security could be enhanced through the stability dimension if the state cultivated the capacity to increase self-sufficiency, when necessary, but only if this capacity did not come at the expense of existing trade connections (Kent, 2016). Increasing local production could bring economic, environmental, and cultural benefits (Bremer et al., 2018; Malachowski and Dugger, 2018; Khan et al., 2019; Hutchins and Feldman, 2021), but that is outside the scope of this study. For the purpose of this investigation, evidence does not suggest local production would necessarily lead to greater food security for households. These misconceptions underscore the need for a standardized, scientifically grounded framework and language for food (in)security that accurately reflects Hawaiʻi’s unique context.
5.3 Improved data collection and new metrics are needed
Participant comments highlighted numerous issues with current stand-alone food (in)security metrics, emphasizing the need for more accurate, timely, and context-sensitive data collection. First, data publication lags too far behind; CPS-FSS, MTMG, and Hawaiʻi BRFSS have reporting delays of 1–2 years, making it difficult to assess current food (in)security levels. Second, the data lacks detail; for example, the USDA only releases statewide averages for CPS-FSS, and the broad ethnicity/race categories used are too general to capture the diversity of Hawaiʻi (see Supplementary materials for a breakdown of demographic indicators available for each metric). Third, methodological inconsistencies can undermine data utility. During the COVID-19 pandemic in 2020, for example, Feeding America had to rely on a different data source for MTMG estimates, resulting in a sharp decline in food insecurity not reflected in CPS-FSS data. Feeding America notes that MTMG estimates are intended for comparison across regions within the same year, not for tracking trends over time (Gundersen et al., 2018a). Fourth, concerns about reliability remain. Although some evidence suggests that the single question used in Hawaiʻi BRFSS is valid (Urke et al., 2014), significant shifts in data from 2018 to 2021 do not align with other metrics (see Figure 5). As one participant put it, “This makes me question whether consistent data collection methods were used.” Additionally, there is no assurance that future Hawaiʻi BRFSS surveys will continue to include questions on food insecurity, raising concerns about long-term data continuity. Table 6 provides a summary of the main advantages and limitations of each stand-alone metric.
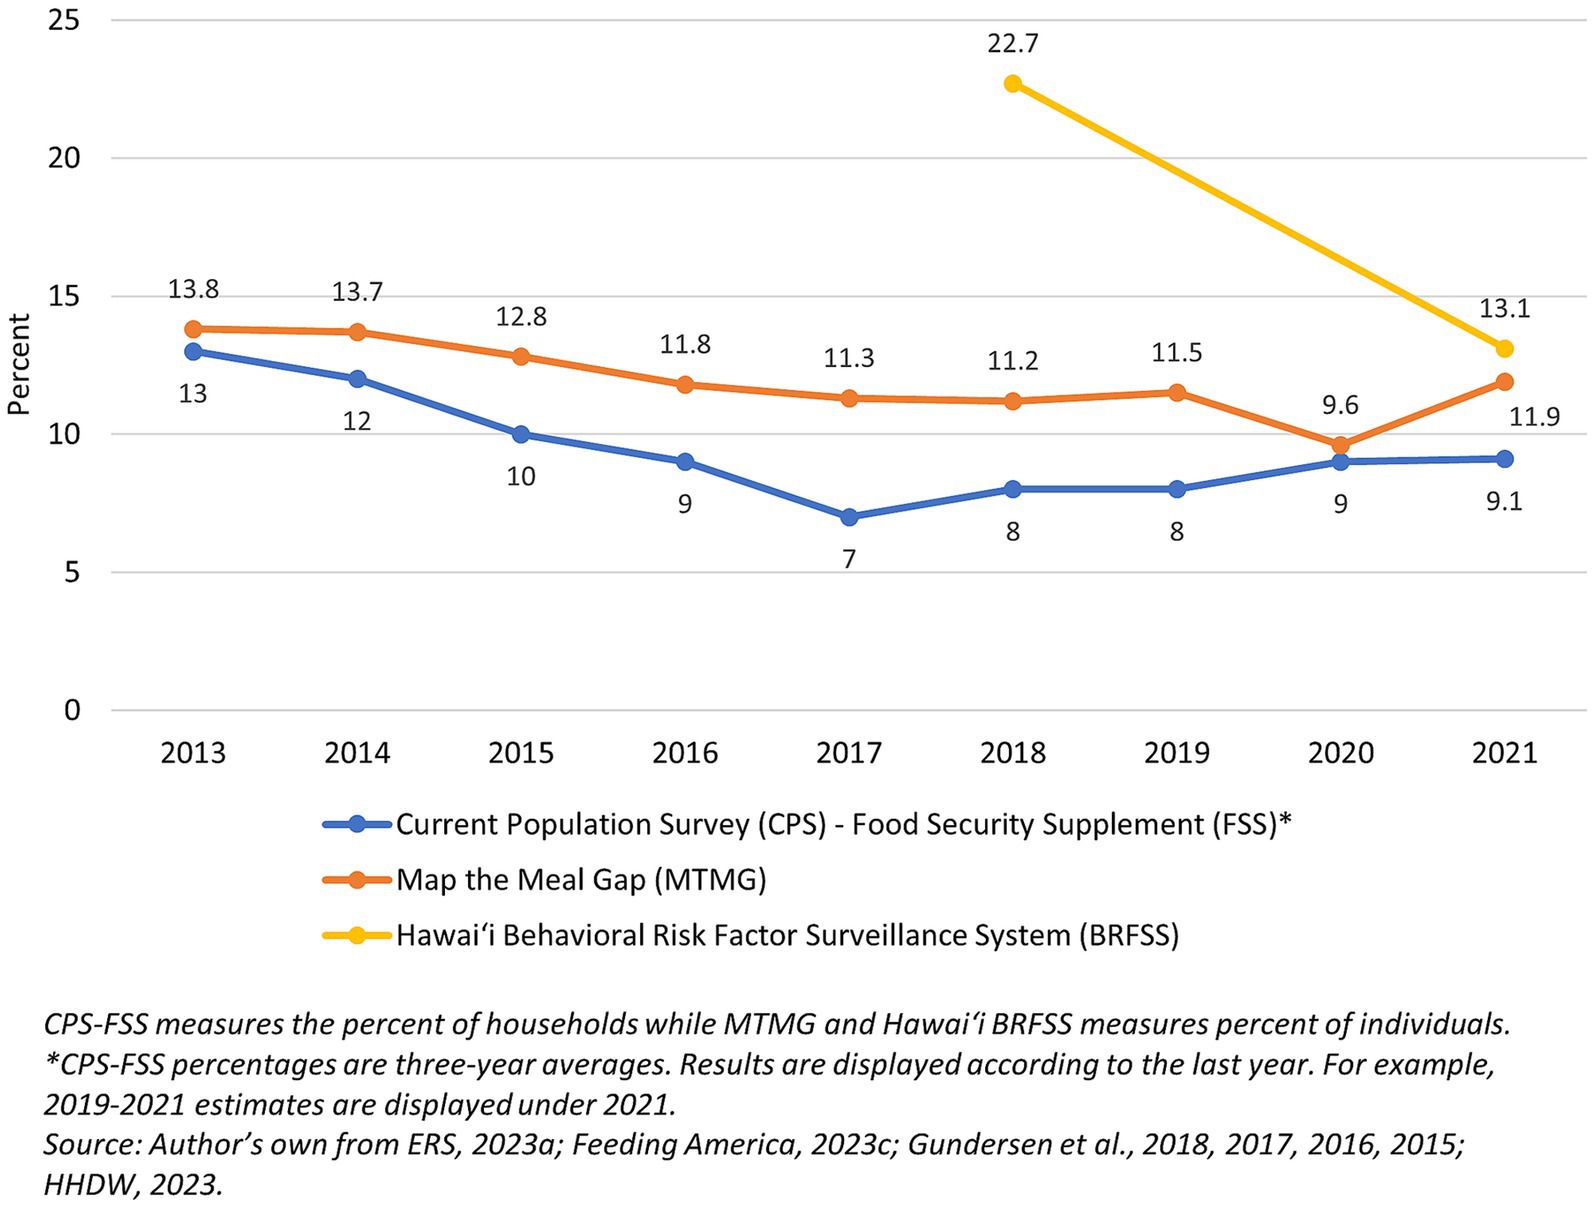
Figure 5. Food insecurity estimates from CPS-FSS, MTMG, and Hawaiʻi BRFSS, 2013–2021. CPS-FSS measures the percent of households while MTMG and Hawaiʻi BRFSS measures percent of individuals. *CPS-FSS percentages are three-year averages. Results are displayed according to the last year. For example, 2019–2021 estimates are displayed under 2021. Source: Authors own from ERS (2023), Feeding America (2023c), Gundersen et al. (2015), Gundersen et al. (2016), Gundersen et al. (2017a), Gundersen et al. (2017b), Gundersen et al. (2018a), Gundersen et al. (2018b), and Hawaiʻi Health Data Warehouse (HHDW) (2023).
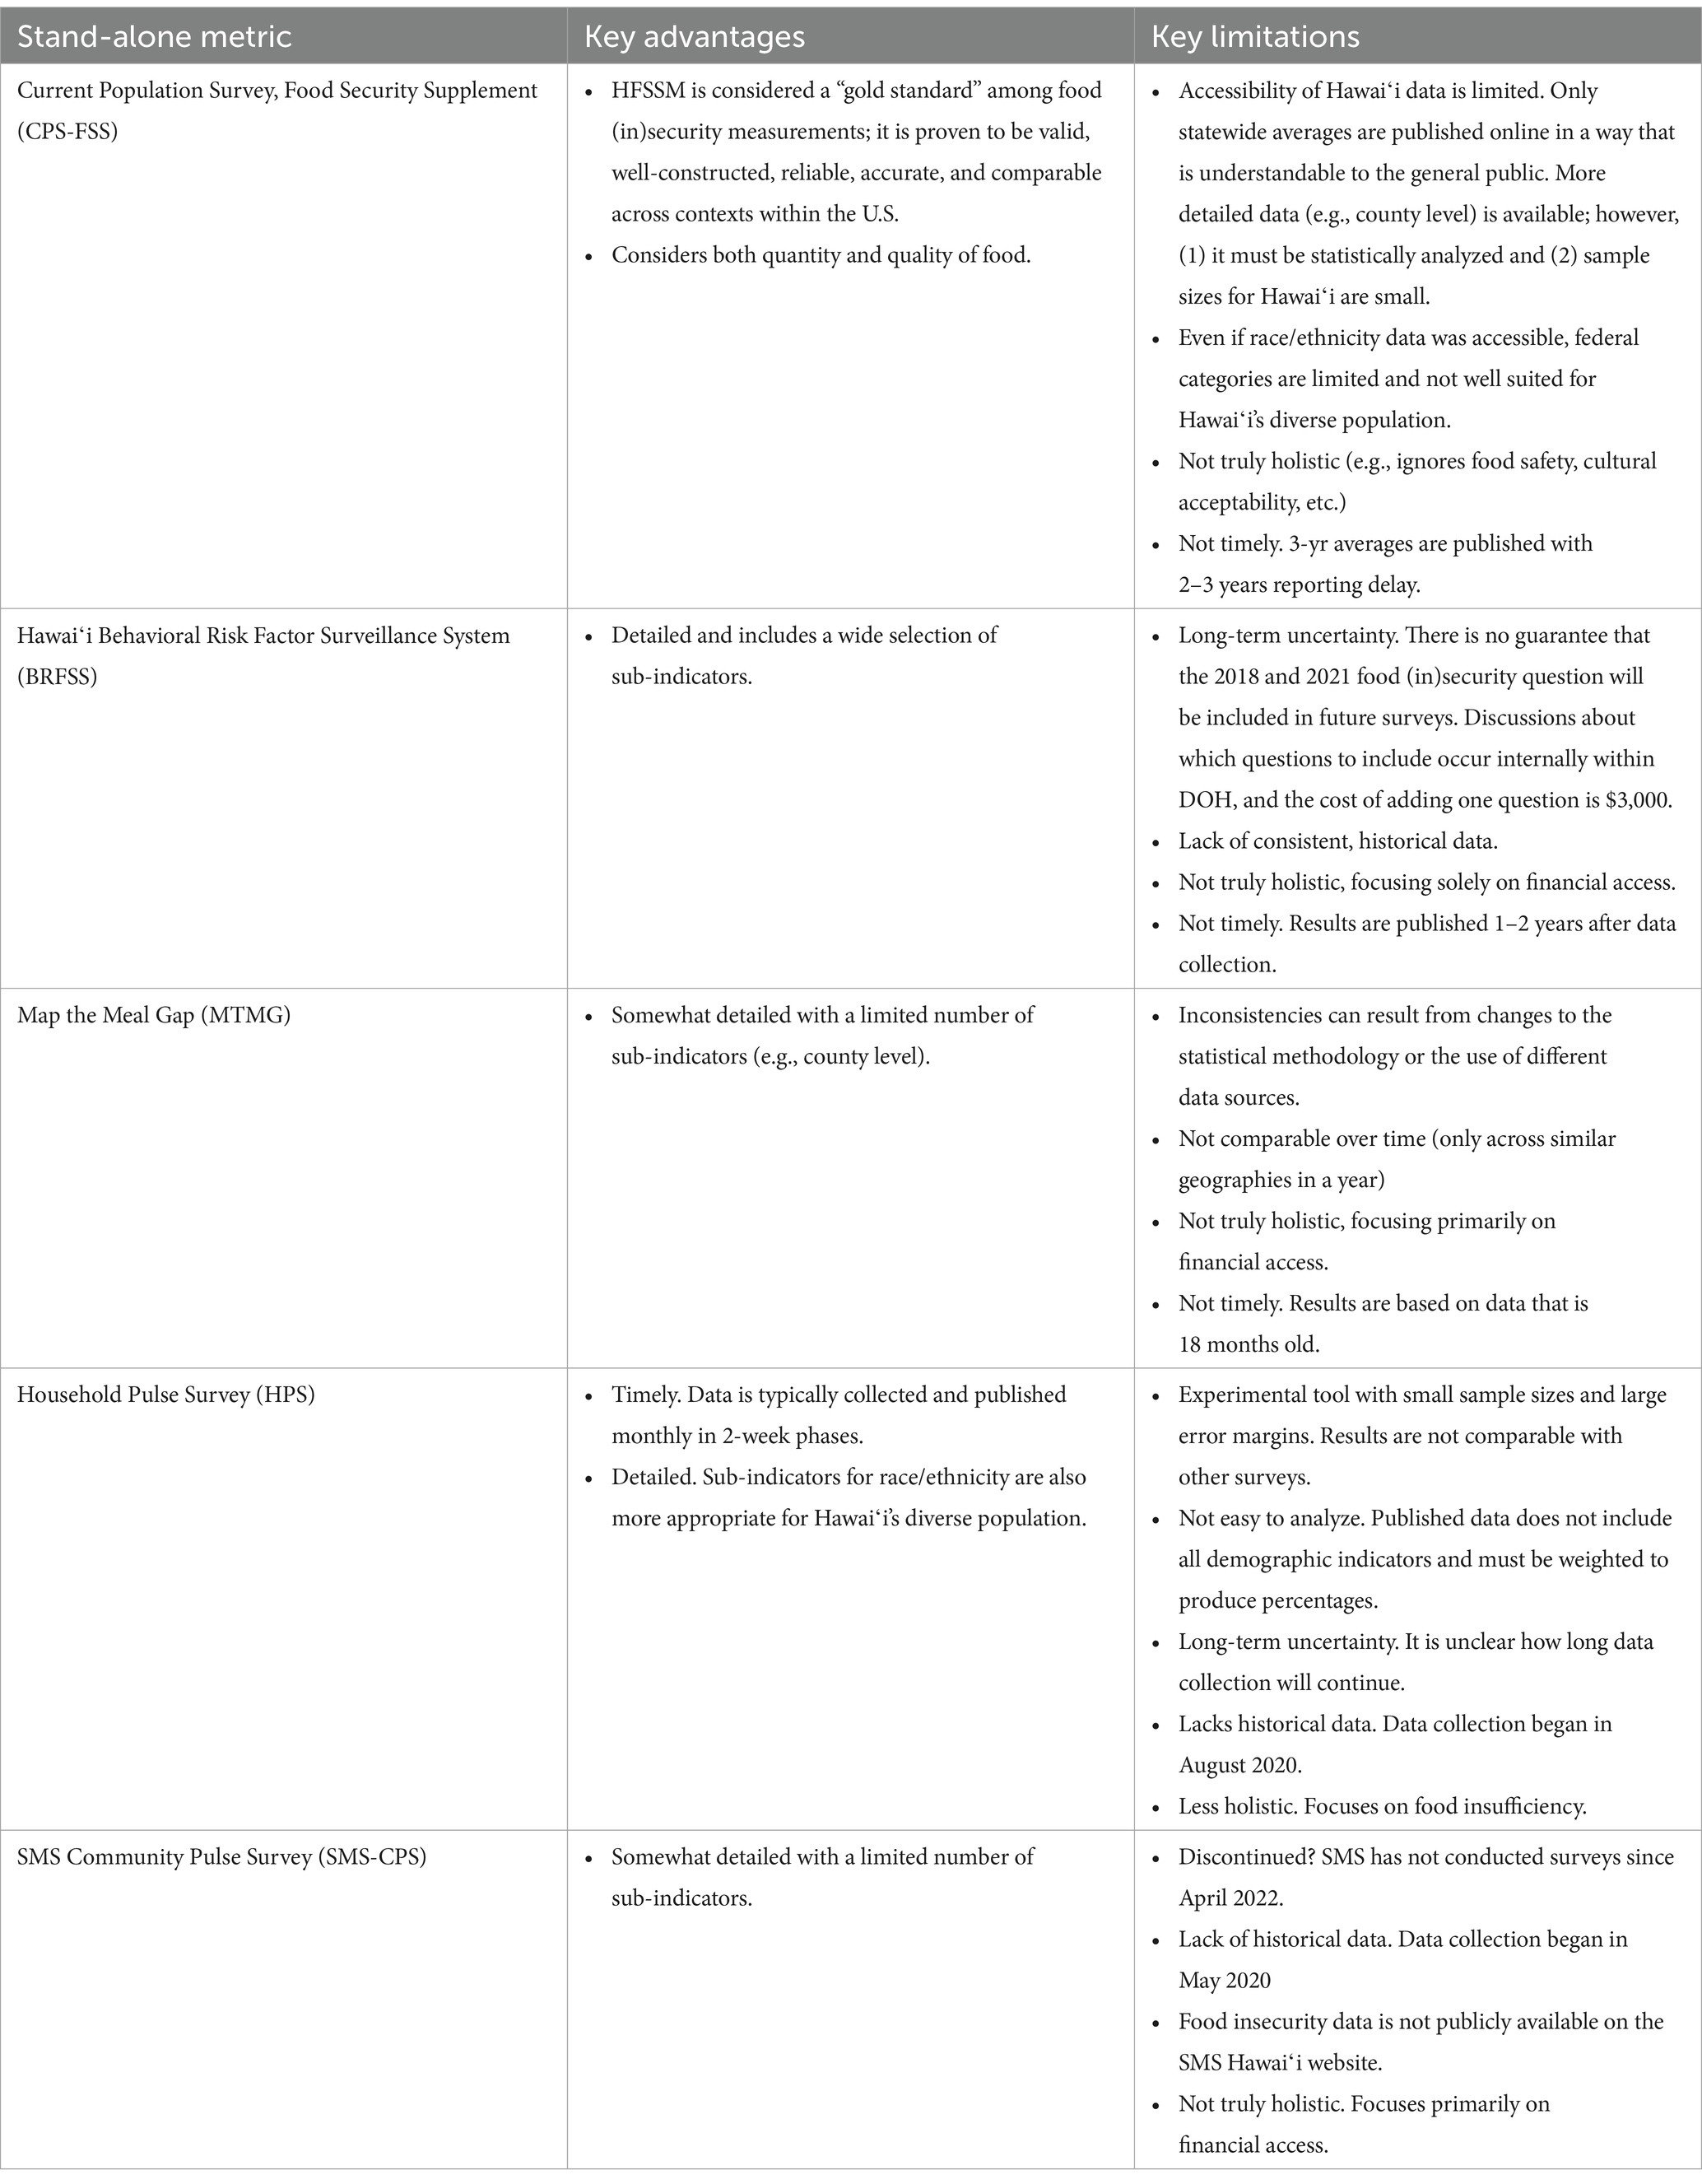
Table 6. Key advantages and limitations of stand-alone metrics.
A promising development is the Hawaiʻi Foodbank’s recent food (in)security report using the HFSSM. Unlike the CPS-FSS, this survey included a sufficiently large sample size to offer a more detailed view of food insecurity across specific ethnic and racial groups and some counties. Additionally, the study identified important correlations between food insecurity and demographic and household characteristics, the use of foodbank services and government benefits, and health indicators. Results showed 30% of Hawaiʻi residents experience food insecurity (Hawaiʻi Foodbank, 2024), a rate notably higher than those reported by other sources. This survey sets a new benchmark for measuring food (in)security in Hawaiʻi and offers a robust foundation for longitudinal studies if conducted regularly.
Among complementary metrics, current availability metrics are inadequate. In 2013, annual food availability was estimated by Loke and Leung (2013) to be 657.9 kg of food per capita, but these estimates have not been updated. Estimates in more useful units like daily calories per capita are not available. The authors are also unaware of any statewide, published, and periodically updated data on Hawaiʻi’s food stocks or net trade. This is because (1) Hawaiʻi lacks a statewide warehousing system that can quickly meet surges in demand during an emergency (HIEMA, 2022) and (2) interstate trade data is rudimentary compared to foreign import data (Loke and Leung, 2013). On the other hand, local food production metrics are available. Thus, in Round 2, only local production metrics could be included under the availability dimension. Participants were understandably concerned about this imbalance. “I do not think [local production] affects food insecurity rates…I have concerns about how accurately we are measuring availability with this level of focus on local production,” one participant wrote. Indeed, the absence of appropriate availability metrics is misleading and appears to perpetuate the misconception that increasing local food production increases food security for households.
Future studies should address current limitations and develop new, context-sensitive metrics suited to Hawaiʻi. Developing a stand-alone metric to track year-round fluctuations in food (in)security could help policymakers respond more accurately to changing needs. Updated food availability estimates calculated in units like daily calories or protein per capita, rather than weight, would better capture resource sufficiency. Participants also proposed additional metrics – such as quantifying the financial shortfall that households face when nutrition programs do not cover the full cost of an adequate, nutritious diet and implementing a statewide household food consumption survey – to yield more localized insights and improve the precision of food (in)security assessments in Hawaiʻi.
5.4 Food insecurity in Hawaiʻi is tied to financial access and the high cost of living
Analysis of access metrics suggests income plays a significant role, yet it does not fully capture the nuances of food insecurity. Not surprisingly, lower-income households are more likely to experience food insecurity: a recent survey found 40.2% of households below the poverty line did not have food security, compared to just 3% of household earning over 200% of the poverty level (Juarez et al., 2023). However, this also means 59.8% of people with incomes below the poverty line did experience food security. In other words, income alone does not determine food insecurity. “Poverty measures are useful because they proxy financial access,” one expert wrote, “but [they] miss other determinants of food insecurity.” This explains why measures of income like the official poverty measure (3.2, SD = 0.8) did not receive relatively high ratings.
Instead, participants emphasized metrics that account for Hawaiʻi’s high cost of living. With the highest cost of living in the U.S., factoring in housing, utilities, groceries, and other essentials (MERIC, 2023), many residents struggle to achieve financial health (Ohri et al., 2020). Housing security is closely linked to food security; Hawaiʻi has both the highest median home values and the fourth-highest homelessness rate nationally (Tyndall et al., 2023). A recent study found that 74% of people reporting housing instability also experienced very low food security (Juarez et al., 2023). Several highly rated metrics underscore the importance of accounting for living costs:
• ‘Rate of households below the ALICE threshold’ (4.4, SD = 0.7) (Ranked 1st in access and overall): Despite their income being above the poverty line, ALICE households (Asset Limited, Income Constrained, and Employed) are ineligible for many public assistance programs and struggle to afford modern necessities like housing, childcare, food, transportation, health care, a smartphone plan, and taxes. Approximately 44% of Hawaiʻi households live below the ALICE threshold, including 29% that live above the federal poverty line. Rates are even higher for Kanaka ʻŌiwi (Native Hawaiians) and Filipinos at 60 and 59%, respectively. ALICE rates also correlate with food insecurity: 26% of ALICE households had difficulty obtaining enough food during the COVID-19 pandemic, compared to 6% who did not [Aloha United Way (AUW), 2022].
• ‘Percentage of food insecure individuals and children ineligible for federal nutrition assistance programs, including SNAP’ (4.0, SD = 0.8) (Ranked 2nd in access and overall): This metric focuses on households who earn too much to be eligible for SNAP support but not enough to escape food insecurity. This financial shortfall is also referred to as the “resource gap” (Gundersen et al., 2018b, p. 114). Recent reports estimate the rate is 55% (Feeding America, 2023c), implying SNAP benefit amounts and eligibility thresholds are too low to help Hawaiʻi residents cope with high prices. One survey found five out of six Hawaiʻi SNAP recipients under 40 years old were considering moving to the continental U.S. because of the cost of living (Spoto et al., 2023).
• ‘Living wage-to-minimum-wage ratio’ (3.8, SD = 0.8) (Ranked 4th in access and overall): Although Hawaiʻi recently raised its minimum wage to $12/h (Lovell, 2022), this falls short of the $22.05/h living wage estimated as necessary for single adults to cover basic living expenses. Much like the ALICE threshold, a living wage measures an individual’s ability to afford essential household expenses by identifying the minimum hourly earnings required from full-time employment to cover food, childcare, insurance, housing, transportation, internet access, taxes, and other necessities (Glasmeier, 2023).
These results imply policymakers aiming to reduce food insecurity should prioritize reducing the financial burden of Hawaiʻi’s high cost of living. “Money provides food access,” one participant remarked. “Largely, if people have enough money, they have access to food.” Recent interventions – including increases to the state earned income tax credit and funding to address affordable housing, homelessness, and preschool costs (Angarone, 2023) – are welcome first steps. Other policies proposed by scholars include a living wage (Karger, 2020), a renter’s tax credit (Kimberlin et al., 2018), a minimum social security benefit plan for the elderly poor (Herd et al., 2018), and a universal per-child cash allowance of $2,000 (Bitler et al., 2018).
5.5 Supporting SNAP is critical
Among all federal nutrition programs, participants identified SNAP as the most important. Five of the top 10 highest-rated access metrics related to SNAP, including the second-, third-, and fifth highest-rated metrics overall. On average, SNAP metrics as a group were rated higher than metrics related to other nutrition programs (see Figure 6). These high ratings reflect the crucial role of SNAP in aiding households that face severe food insecurity, as SNAP participants often experience deeper financial hardship than those not receiving benefits. This disparity, where 39.9% of SNAP recipients report food insecurity compared to 24.5% of eligible non-recipients (Coleman-Jensen et al., 2022, p. 38, Table 8), reflects the severe need rather than any shortcoming of the program itself. Studies show SNAP reduces the prevalence, depth, and severity of poverty (Tiehen et al., 2012) and food insecurity in the U.S. (Kreider et al., 2012; Gundersen et al., 2017b; Swann, 2017; Gundersen et al., 2018b; Gundersen, 2021a; McKernan et al., 2021). In Hawaiʻi, SNAP recipients have confirmed the additional support helps them to pay their bills and eat healthier food that costs more (Spoto et al., 2023).
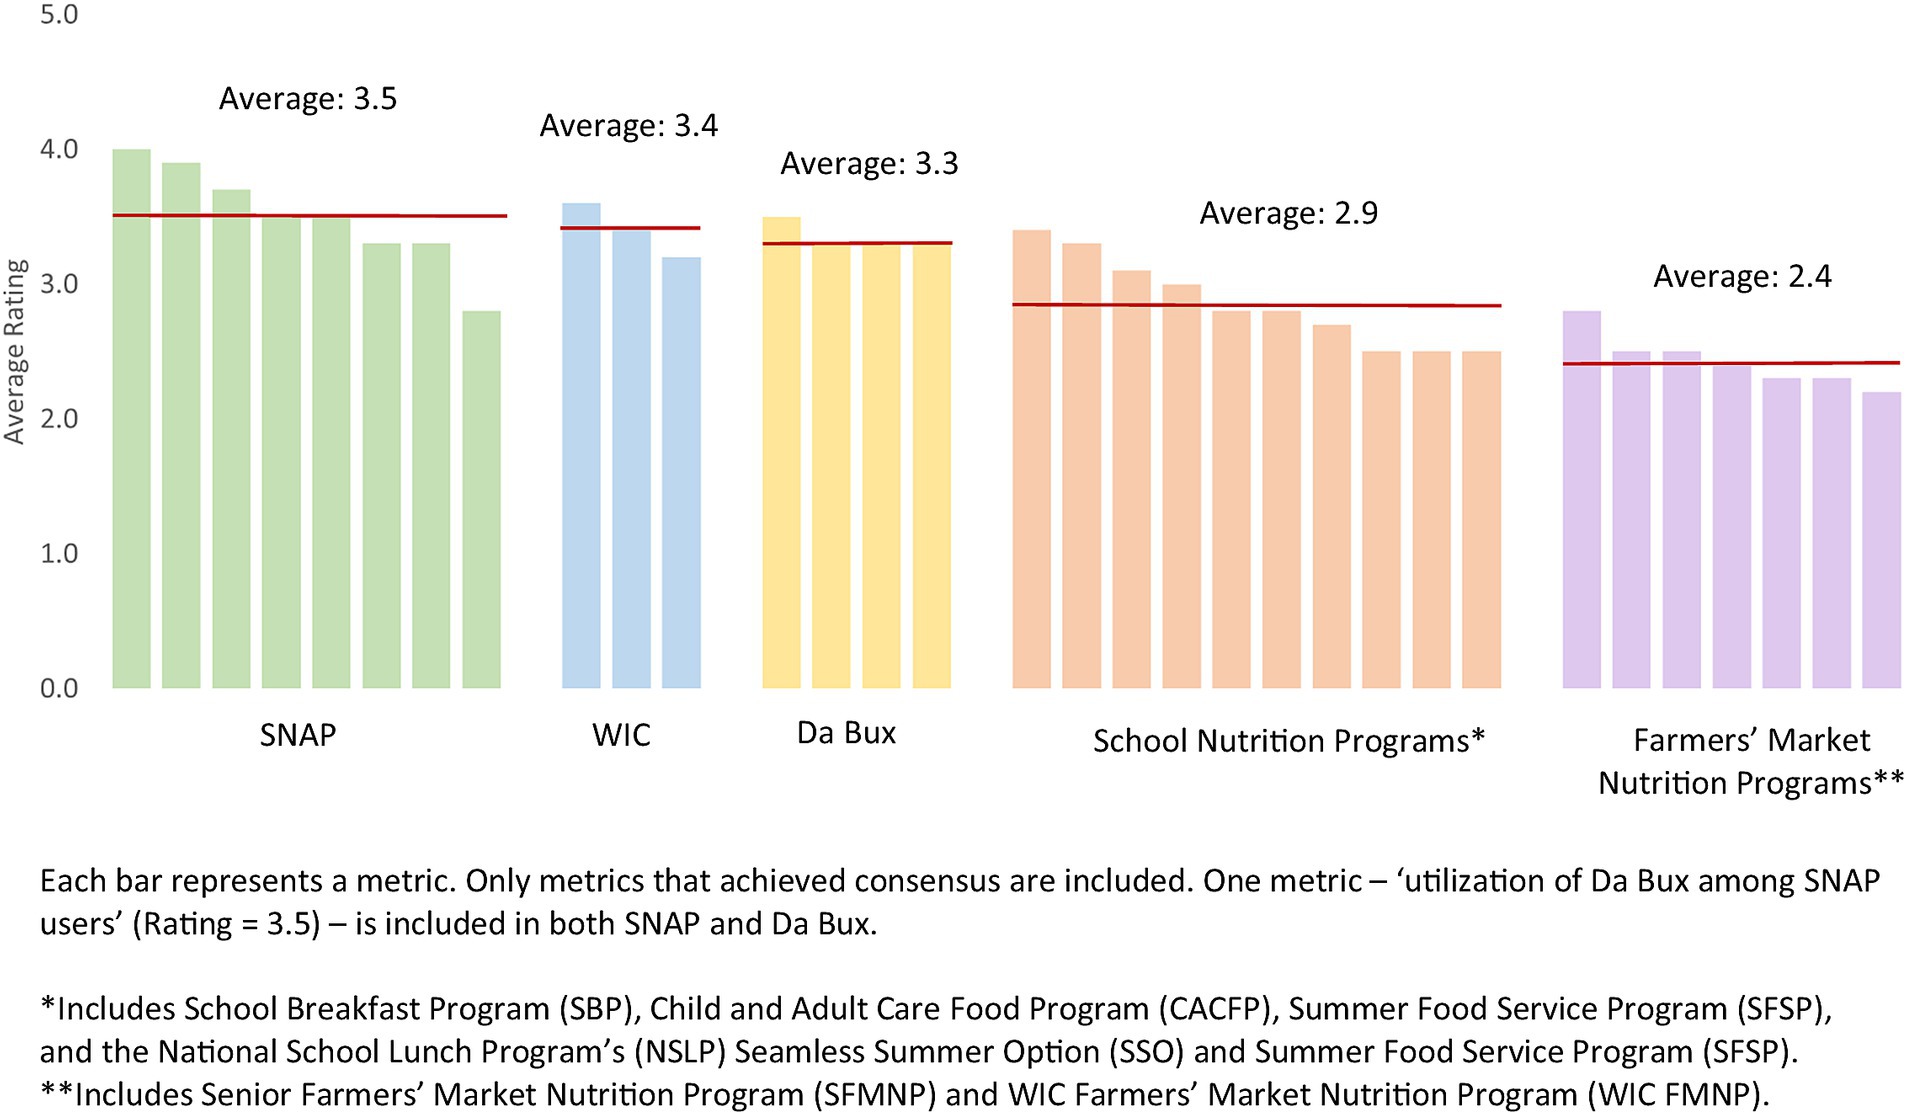
Figure 6. Average ratings of access metrics, by nutrition program. Each bar represents a metric. Only metric–‘utilization of Da Bux among SNAP users’ (Rating = 3.5)–is included in both SNAP and Da Bux. *Includes School Breakfast Program (SBP), Child and Adult Care Food Program (CACFP), Summer Food Service Program (SFSP), and the National School Lunch Program’s (NSLP), Seamless Summer Option (SSO), and Summer Food Service Program (SFSP). **Includes Senior Farmer’s Market Nutrition Program (SFMNP) and WIC Farmer’s Market Nutrition Program (WIC FMNP).
Policymakers can bolster SNAP through several impactful measures. At the federal level, these include:
• Increase the maximum benefit amount: For the first time since the 1970s, USDA recently updated the Thrifty Food Plan (FNS, 2021), which determines SNAP benefit levels, to better account for the true cost of a nutritious diet (FNS, 2023); (Waxman et al., 2021; Hartline-Grafton and Vollinger, n.d.). This alone reduced poverty by 4.7% and child poverty by 8.6% in the continental U.S. (Wheaton and Kwon, 2022). However, a more effective strategy would be to index SNAP benefits to local food prices so benefit levels are context-appropriate and sensitive to price fluctuations (Gregory and Coleman-Jensen, 2013; Fitzpatrick et al., 2021). This approach could (1) reduce food insecurity among SNAP recipients by nearly 60% (Gundersen et al., 2019), (2) reduce the need for additional emergency allotments during times of crisis, and (3) avoid subsequent “hunger cliffs” (Heaton, 2023) that occur when these additional benefits suddenly come to an end (FRAC, 2023).
• Expand the eligibility cutoff: Hawaiʻi is one of a few states that utilizes Broad-Based Categorical Eligibility (BBCE), which raises the SNAP eligibility limit to 200% of the federal poverty line (Spoto et al., 2023). While this allows more people to benefit, 48% of SNAP users are still food insecure (Stupplebeen et al., 2020). A national study estimated that expanding SNAP benefits by 25% for those with incomes under 400% of the federal poverty line would reduce food insecurity by 98.2% and cost $564.5 billion (Gundersen, 2021b).
• Expand eligibility to restricted groups: While the recent renewal of the Compacts of Free Association allows people from the Marshall Islands, Palau, and the Federated States of Micronesia to access federal benefits like SNAP (Blair, 2024), federal eligibility restrictions still prevent some groups in Hawaiʻi from benefitting from SNAP, including college students (with some exceptions) and people with felony drug convictions (Spoto et al., 2023).
• Phase out benefits more slowly: After a certain threshold, SNAP benefits decline steeply by about 30 cents for every $1 in additional income. These “benefit cliffs” cause anxiety and stress and make it difficult to escape food insecurity (Balasuriya et al., 2021).
At the state level, more can be done to maximize the positive impacts of SNAP. Ensuring all eligible recipients can benefit could boost incomes by $100 million annually (Meter and Goldenberg, 2017). State lawmakers should:
• Facilitate enrolment by adopting the Elderly Simplified Application Project (ESAP): Failing to submit an annual report is the most common reason why SNAP recipients are denied continued enrolment and must re-apply. Adopting ESAP would reduce the administrative burden on seniors by extending the recertification period from 1 to 3 years, eliminating the need for an interview to re-certify benefits, and reducing documentation requirements (Spoto et al., 2023).
• Help recipients understand and avoid benefit cliffs: Enhanced communication between state agencies, advocacy groups, and SNAP recipients could help residents understand how changes, like minimum wage increases or federal aid reductions, might impact their benefits (Spoto et al., 2023; Social Ventures LLC, 2018).
• Improve efficiency and capacity in state and county government by addressing turnover and staffing issues, lack of call center capacity, and outdated computer and processing systems (Spoto et al., 2023).
5.6 Limitations
5.6.1 Methodological limitations
This study faced many limitations related to the implementation of the Delphi method. The extended gap between the initial interview phase and the subsequent Delphi rounds, along with revisions to the research question, may have caused some confusion about the study’s aims and potentially impacted participation. Time and geographic constraints prevented the organization of online or face-to-face focus groups which could have been used to hone the conceptual framework, identify additional metrics, improve the ergonomics of the online surveys, and verify findings from interview rounds. While this study exceeded the 47–57% response rates of some Delphi studies (Boylan et al., 2019; Flinzberger et al., 2020; Mullender et al., 2020), it fell short of the 70% response rate recommended by other researchers (Hasson et al., 2000; Giannarou and Zervas, 2014). Time demands on participants likely may have impacted engagement; despite efforts to streamline each round, Round 2 took approximately 31 min to complete, compared to 29 min in Round 1, as recorded by Survey Monkey. To mitigate participant fatigue, the decision was made to conclude the Delphi rounds upon reaching consensus rather than achieving stability of responses, though the latter is considered ideal. Furthermore, this study focused solely on quantitative metrics even though, as one participant noted, qualitative insights are “important in telling our stories” and could add depth to the analysis.
5.6.2 Lack of participant diversity
The limited representation of participants from the private sector and government, alongside the dominance of civil society and NGO voices, may have introduced bias, potentially affecting the quality of the findings (Keeney et al., 2001; Powell, 2003). This imbalance may also explain instances where “food security” was used interchangeably with “self-sufficiency.” Participants working closely with communities may prioritize practical, accessible language over scientific precision, leading to nuanced terms being used more flexibly within these contexts. Increasing diversity in participant backgrounds and expanding stakeholder engagement to other groups – including food insecure people themselves – could enhance the study’s validity and ensure a broader range of perspectives.
5.6.3 Confusion about the study’s purpose
The purpose of this study could have been communicated more clearly. There appeared to be confusion among some participants about whether the purpose of availability metrics was to (1) measure food availability as thoroughly and holistically as possible (incorrect) or (2) identify the most useful availability metrics for assessing the impact of food security policies and interventions (correct). When writing about their willingness to change their ratings, one participant wrote, “I do not think [local production] affects food insecurity rates. Perhaps that wasn’t what you were trying to measure [emphasis added]. If it is simply availability – physical presence, then I can align with other respondents.” In other words, this participant increased their rating of local production metrics to align with the group average even though they felt the metrics were not important for food (in)security. If other participants were also unsure about why they were being asked to rate metrics, this may have contributed to low consensus rates.
5.6.4 Exclusion of sustainability and agency as food security dimensions
Finally, this study opted to focus on a four-dimensional framework of food security and not include sustainability and agency as additional dimensions. However, excluding agency can overlook the cultural, social, and historical aspects that shape local food preferences, traditions, and sovereignty. For instance, native Hawaiian communities have long practiced indigenous farming and fishing methods that reflect a deep connection to community and nature. Excluding agency from assessments risks imposing top-down solutions that overlook community-led initiatives and undermine local ownership and resilience. Without agency, food security assessments may miss critical insights into community empowerment, self-determination, and the role of indigenous knowledge in enhancing food security. Omitting sustainability from food security assessments overlooks the role of ecosystem health for food security. Although 85–90% of Hawaiʻi’s food is imported (Loke and Leung, 2013), policymakers are increasingly focused on finding ways to increase local food production. Many residents still depend on the land and sea for sustenance, underscoring the importance of addressing sustainability challenges such as soil degradation, water scarcity, air and water pollution, invasive species, and biodiversity loss. Omitting the dimensions of agency and sustainability from Hawaiʻi’s food security assessments limits the relevance and transferability of findings, particularly to other settings with strong local or indigenous food systems. Regions or islands with similar ecological and cultural characteristics could benefit from Hawaiʻi’s experiences, yet assessments that lack these dimensions may fall short in offering insights that resonate across contexts. Incorporating agency and sustainability into future assessments provides a more comprehensive view of food security and creates a flexible framework that can inform policy development in other areas facing similar challenges, enhancing both the relevance and impact of shared solutions.
5.7 Future studies
To further refine the Delphi method approach used in this study and align with best practices for knowledge co-production (Norström et al., 2020), future research should adapt this model to additional areas of the food system and implement it across various sub-national contexts. Researchers should also investigate links between metrics for food (in)security and other, related concepts like “food systems resilience” (Béné, 2020) and “food acceptability” (Moore et al., 2022). Finally, practical issues related to developing a localized system of food (in)security metrics merit attention. Key questions include: How many metrics should be adopted? Should metrics from the availability, utilization, or stability dimensions be included, even though access metrics were rated highest? Which SNAP metrics should be prioritized? Are the selected metrics responsive enough to policy changes? It is important to consider not only which metrics are useful, but also what combination of metrics would be most appropriate and how to combine them. Creating a food (in)security index score is one possible approach that could help to increase understanding of the multidimensionality of food security among policymakers and the public [Organization for Economic Co-Operation and Development (OECD), 2008].
6 Conclusion
Among stand-alone metrics, the U.S. Household Food Security Survey Module (HFSSM), administered as part of the Current Population Survey (CPS) Food Security Supplement (FSS), received the highest ratings. Among complementary metrics, ‘rate of households below the ALICE threshold’ received the highest rating and access metrics accounted for the six highest-rated metrics and 10 of the top 12. Implications for researchers, food systems planners, and policymakers include the importance of clarifying and standardizing the definitions and dimensions of food (in)security; substantial data gaps and the need for researchers to develop new, locally relevant metrics to better capture the nuances of food (in)security; and the significance of Hawaiʻi’s high cost of living as a primary factor impacting food (in)security, suggesting that policymakers should prioritize support for programs like SNAP to enhance financial access to food.
Data availability statement
The original contributions presented in the study are included in the article/Supplementary material, further inquiries can be directed to the corresponding author.
Ethics statement
The studies involving humans were approved by University of Edinburgh, School of GeoSciences Ethics Committee. The studies were conducted in accordance with the local legislation and institutional requirements. The participants provided their written informed consent to participate in this study.
Author contributions
JS: Conceptualization, Data curation, Formal analysis, Investigation, Methodology, Project administration, Visualization, Writing – original draft, Writing – review & editing. AM: Conceptualization, Supervision, Writing – review & editing.
Funding
The author(s) declare that no financial support was received for the research, authorship, and/or publication of this article.
Conflict of interest
The authors declare that the research was conducted in the absence of any commercial or financial relationships that could be construed as a potential conflict of interest.
The author(s) declared that they were an editorial board member of Frontiers, at the time of submission. This had no impact on the peer review process and the final decision.
Publisher’s note
All claims expressed in this article are solely those of the authors and do not necessarily represent those of their affiliated organizations, or those of the publisher, the editors and the reviewers. Any product that may be evaluated in this article, or claim that may be made by its manufacturer, is not guaranteed or endorsed by the publisher.
Supplementary material
The Supplementary material for this article can be found online at: https://www.frontiersin.org/articles/10.3389/fsufs.2024.1427270/full#supplementary-material
References
Allen, T., Prosperi, P., Cogill, B., Padilla, M., and Peri, I. (2019). A Delphi approach to develop sustainable food system metrics. Soc. Indic. Res. 141, 1307–1339. doi: 10.1007/s11205-018-1865-8
Aloha United Way (AUW) (2022) ALICE in Hawaiʻi: 2022 facts and figures. Available online at: https://www.auw.org/alice-initiative (Accessed July 25, 2023)
Angarone, B. (2023) ‘Hawaii governor signs tax relief and budget bills’, Honolulu Civil Beat. Available online at: https://www.civilbeat.org/2023/06/hawaii-governor-signs-tax-relief-and-budget-bills/ (Accessed July 26, 2023)
Arenas, D. J., Thomas, A., Wang, J. C., and DeLisser, H. M. (2019). A systematic review and Meta-analysis of depression, anxiety, and sleep disorders in US adults with food insecurity. J. Gen. Intern. Med. 34, 2874–2882. doi: 10.1007/s11606-019-05202-4
Arita, S., Naomasa, E., and Leung, P. (2012) ‘Comparison of cost structure and economic performance of Hawaii and U.S. mainland farms’, Economic Issues Series, EI-21. Honolulu, Hawaiʻi: University of Hawaiʻi. Available online at: https://scholarspace.manoa.hawaii.edu/items/8a7def6e-e5bd-4b0f-8947-66fd12f76021 (Accessed July 25, 2023)
Aziz, A., Barzekar, G., Ajuhari, Z., and Idris, N. H. (2015). Criteria & Indicators for monitoring ecotourism sustainability in a protected watershed: a Delphi consensus. IOSR J. Environ. Sci., 1–9. doi: 10.9790/2402-09310109
Bahn, R. A., Hwalla, N., and El Labban, S. (2021). “Chapter 1 – leveraging nutrition for food security: the integration of nutrition in the four pillars of food security” in Food security and nutrition. ed. C. M. Galanakis (Cambridge, MA: Academic Press), 1–32.
Balasuriya, L., Berkowitz, S. A., and Seligman, H. K. (2021). Federal Nutrition Programs after the pandemic: learning from P-EBT and SNAP to create the next generation of food safety net programs. Inquiry 58:5190. doi: 10.1177/00469580211005190
Barrett, C. B. (2010). Measuring food insecurity. Science 327, 825–828. doi: 10.1126/science.1182768
Behringer, J., and Feindt, P. H. (2023). Varieties of food democracy: a systematic literature review. Critical Policy Stud. 18, 25–51. doi: 10.1080/19460171.2023.2191859
Béné, C. (2020). Resilience of local food systems and links to food security – a review of some important concepts in the context of COVID-19 and other shocks. Food Secur. 12, 805–822. doi: 10.1007/s12571-020-01076-1
Béné, C., Chege, C. K., Even, B., Hernandez, R. A., Lundy, M., Prager, S. D., et al. (2024). Why building participatory dashboards is key for sustainable food system transformation. Front. Sustain. Food Syst. 8:1405670. doi: 10.3389/fsufs.2024.1405670
Béné, C., Prager, S. D., Achicanoy, H. A. E., Toro, P. A., Lamotte, L., Bonilla, C., et al. (2019). Global map and indicators of food system sustainability. Scientific Data 6:279. doi: 10.1038/s41597-019-0301-5
Berry, E. M., Dernini, S., Burlingame, B., Meybeck, A., and Conforti, P. (2015). Food security and sustainability: can one exist without the other? Public Health Nutr. 18, 2293–2302. doi: 10.1017/S136898001500021X
Bitler, M. P., Hines, A. L., and Page, M. (2018). ‘Cash for kids’, RSF: the Russell Sage Foundation. J. Soc. Sci. 4, 43–73. doi: 10.7758/RSF.2018.4.2.03
Blair, C. (2024) ‘Congress restores Federal Benefits to COFA migrants as part of $7.1 billion aid Deal’, Honolulu Civil Beat. Available at: https://www.civilbeat.org/2024/03/congress-restores-federal-benefits-to-cofa-migrants-as-part-of-7-1-billion-aid-deal/ (Accessed April 30, 2024)
Blue Bird Jernigan, V., Maudrie, T. L., Nikolaus, C. J., Benally, T., Johnson, S., Teague, T., et al. (2021). Food sovereignty indicators for indigenous community capacity building and health. Front. Sustain. Food Syst. 5:704750. doi: 10.3389/fsufs.2021.704750
Blüher, M. (2019). Obesity: global epidemiology and pathogenesis. Nat. Rev. Endocrinol. 15, 288–298. doi: 10.1038/s41574-019-0176-8
Boylan, S., Sainsbury, E., Thow, A. M., Degeling, C., Craven, L., Stellmach, D., et al. (2019). A healthy, sustainable and safe food system: examining the perceptions and role of the Australian policy actor using a Delphi survey. Public Health Nutr. 22, 2921–2930. doi: 10.1017/S136898001900185X
Brady, S. R. (2015). “The Delphi method” in Handbook of methodological approaches to community-based research: Qualitative, quantitative, and mixed methods. eds. L. A. Jason and D. S. Glenwick (Oxford: Oxford University Press), 61–68.
Bremer, L. L., Falinski, K., Ching, C., Wada, C. A., Burnett, K. M., Kukea-Shultz, K., et al. (2018). Biocultural restoration of traditional agriculture: cultural, environmental, and economic outcomes of Lo‘i Kalo restoration in he‘eia, O‘ahu. Sustain. For. 10:4502. doi: 10.3390/su10124502
Bruening, M., Dinour, L. M., and Chavez, J. B. R. (2017). Food insecurity and emotional health in the USA: a systematic narrative review of longitudinal research. Public Health Nutr. 20, 3200–3208. doi: 10.1017/S1368980017002221
Caccavale, O. M., and Giuffrida, V. (2020). The Proteus composite index: towards a better metric for global food security. World Dev. 126:104709. doi: 10.1016/j.worlddev.2019.104709
Canfield, M., Anderson, M. D., and McMichael, P. (2021). UN Food Systems Summit 2021: Dismantling Democracy and Resetting Corporate Control of Food Systems. Front. Sustain. Food Syst. 5:661552. doi: 10.3389/fsufs.2021.661552
Carey, J., and Dubbeling, M. (2017) City region food system Indicator framework. RUAF Foundation. Available at: https://ruaf.org/assets/2021/04/City-Region-Food-System-Indicator-Framework.pdf (Accessed June 30, 2023)
Carletto, C., Zezza, A., and Banerjee, R. (2013). Towards better measurement of household food security: harmonizing indicators and the role of household surveys. Glob. Food Sec. 2, 30–40. doi: 10.1016/j.gfs.2012.11.006
Census Bureau (2023) Household pulse survey. U.S. Census Bureau. Available at: https://www.census.gov/data-tools/demo/hhp/#/ (Accessed June 22, 2023)
Chaudhary, A., Gustafson, D., and Mathys, A. (2018). Multi-indicator sustainability assessment of global food systems. Nat. Commun. 9:848. doi: 10.1038/s41467-018-03308-7
Chen, C.-W., Su, W. J., Chiang, Y. T., Shu, Y. M., and Moons, P. (2017). Healthcare needs of adolescents with congenital heart disease transitioning into adulthood: a Delphi survey of patients, parents, and healthcare providers. Eur. J. Cardiovasc. Nurs. 16, 125–135. doi: 10.1177/1474515116643622
Chu, H.-C., and Hwang, G.-J. (2008). A Delphi-based approach to developing expert systems with the cooperation of multiple experts. Expert Syst. Appl. 34, 2826–2840. doi: 10.1016/j.eswa.2007.05.034
Clapp, J., Moseley, W. G., Burlingame, B., and Termine, P. (2022). Viewpoint: the case for a six-dimensional food security framework. Food Policy 106:102164. doi: 10.1016/j.foodpol.2021.102164
Coleman-Jensen, A., Rabbitt, M. P., Gregory, C. A., and Singh, A.. (2022) Household food security in the United States in 2021, ERR-309, U.S. Department of Agriculture, Economic Research Service. Available online at: https://www.ers.usda.gov/publications/pub-details/?pubid=104655 (Accessed July 25, 2023)
Coppo, G., Stempfle, S., and Reho, M. (2017). Urban food strategies and plans: considerations on the assessment construction. City Territ. Archit. 4:8. doi: 10.1186/s40410-017-0064-2
Dajani, J. S., Sincoff, M. Z., and Talley, W. K. (1979). Stability and agreement criteria for the termination of Delphi studies. Technol. Forecast. Soc. Chang. 13, 83–90. doi: 10.1016/0040-1625(79)90007-6
DBEDT and DOA (2012) Increased food security and food self-sufficiency strategy. Department of Business Economic Development & Tourism and Department of Agriculture, State of Hawaiʻi. Available online at: https://files.hawaii.gov/dbedt/op/spb/INCREASED_FOOD_SECURITY_AND_FOOD_SELF_SUFFICIENCY_STRATEGY.pdf (Accessed June 30, 2023)
DOH (2023) Hawaiʻi behavioral risk factor surveillance system. Hawaiʻi State Department of health. Available at: https://health.hawaii.gov/brfss/ (Accessed June 30, 2023)
Economist Impact (2023) Global food security index 2022: exploring challenges and developing solutions for food security across 113 countries. Available at: https://impact.economist.com/sustainability/project/food-security-index/ (Accessed June 30, 2023)
ERS (2023) Food security in the U.S.: interactive charts and highlights. Economic Research Service, U.S. Department of Agriculture. Available at: https://www.ers.usda.gov/topics/food-nutrition-assistance/food-security-in-the-u-s/interactive-charts-and-highlights/#childtrends (Accessed June 30, 2023)
Eskandari, F., Lake, A. A., Rose, K., Butler, M., and O'Malley, C. (2022). A mixed-method systematic review and meta-analysis of the influences of food environments and food insecurity on obesity in high-income countries. Food Sci. Nutr. 10, 3689–3723. doi: 10.1002/fsn3.2969
Fanzo, J., Haddad, L., McLaren, R., Marshall, Q., Davis, C., Herforth, A., et al. (2020). The food systems dashboard is a new tool to inform better food policy. Nature Food 1, 243–246. doi: 10.1038/s43016-020-0077-y
Fanzo, J., Haddad, L., Schneider, K. R., Béné, C., Covic, N. M., Guarin, A., et al. (2021). Viewpoint: rigorous monitoring is necessary to guide food system transformation in the countdown to the 2030 global goals. Food Policy 104:102163. doi: 10.1016/j.foodpol.2021.102163
FAO (2008) An introduction to the basic concepts of food security. Food and Agriculture Organization, Food Security Program. Available at: https://www.fao.org/3/al936e/al936e00.pdf (Accessed June 30, 2023)
FAO (2013). New approaches to the measurement of food security. Food and Agriculture Organization, AFCAS 23, 2013. Available online at: https://www.fao.org/fileadmin/templates/ess/documents/afcas23/Presentations/AFCAS_9d_New_approaches_to_the_measurement_of_food_security.pdf (Accessed July 25, 2023)
FAO (2023). The state of food and agriculture 2023 – revealing the true cost of food to transform agrifood systems. Rome: FAO.
FAO, IFAD, and WFP (2013). The state of food insecurity in the world 2013: the multiple dimensions of food security. Food and agriculture organization, International Fund for Agricultural Development, world food Programme. Rome, FAO. Available online at: https://www.fao.org/3/i3434e/i3434e00.htm (Accessed July 25, 2023)
FAO, IFAD, UNICEF, WFP, and WHO (2022). The state of food security and nutrition in the world 2022. Repurposing food and agricultural policies to make healthy diets more affordable. Food and agriculture organization, International Fund for Agricultural Development, United Nations international Children’s emergency fund, world food Programme. Rome: World Health Organization.
Feeding America (2023a) The feeding America network. Available online at: https://www.feedingamerica.org/our-work/food-bank-network (Accessed June 30, 2023)
Feeding America (2023b) Map the meal gap 2023 technical brief: an analysis of county and Congressional District food insecurity and county food cost in the United States in 2021. Available at: https://www.feedingamerica.org/sites/default/files/2023-05/Map%20the%20Meal%20Gap%202023%20Technical%20Brief.pdf?s_src=W236REFER&s_referrer=https%3A%2F%2Fmap.feedingamerica.org%2F&s_channel=https%3A%2F%2Fmap.feedingamerica.org%2F&s_subsrc=https%3A%2F%2Fwww.feedingamerica.org%2Fresearch%2Fmap-the-meal-gap%2Foverall-executive-summary (Accessed June 30, 2023)
Feeding America (2023c) Food insecurity among overall (all ages) population in Hawaii. Available online at: https://map.feedingamerica.org/district/2020/overall/hawaii (Accessed June 30, 2023)
Fitzpatrick, K. M., Harris, C., Drawve, G., and Willis, D. E. (2021). Assessing food insecurity among US adults during the COVID-19 pandemic. J. Hunger Environ. Nutr. 16, 1–18. doi: 10.1080/19320248.2020.1830221
Flegal, K. M., Kit, B. K., Orpana, H., and Graubard, B. I. (2013). Association of all-Cause Mortality with Overweight and Obesity Using Standard Body Mass Index Categories. JAMA 309, 71–82. doi: 10.1001/jama.2012.113905
Flinzberger, L., Zinngrebe, Y., and Plieninger, T. (2020). Labelling in Mediterranean agroforestry landscapes: a Delphi study on relevant sustainability indicators. Sustain. Sci. 15, 1369–1382. doi: 10.1007/s11625-020-00800-2
FNS (2021) Thrifty food plan, 2021. Food and Nutrition Service, U.S. Department of Agriculture, FNS-916. Available online at: https://www.fns.usda.gov/cnpp/usda-food-plans-cost-food-reports (Accessed July 25, 2023)
FNS (2022) USDA actions on nutrition security. Food and Nutrition Service, U.S. Department of Agriculture. Available online at: https://www.usda.gov/sites/default/files/documents/usda-actions-nutritionsecurity.pdf (Accessed July 30, 2023)
FNS (2023) Thrifty food plan cost estimate for Alaska and Hawaii. Food and Nutrition Service, U.S. Department of Agriculture. Available online at: https://data.nal.usda.gov/dataset/data-thrifty-food-plan-cost-estimates-alaska-and-hawaii (Accessed December 1, 2023)
FRAC (2021) Defining food insecurity and measuring it during COVID-19. Food Research & Action Center. Available online at: https://frac.org/wp-content/uploads/Defining-Food-Insecurity_2021.pdf (Accessed June 30, 2023)
FRAC (2023) SNAP emergency allotments: Hawaii. Food Research & Action Center. Available at: https://frac.org/research/resource-library/snap-ea-state-fact-sheets (Accessed July 25, 2023)
Giannarou, L., and Zervas, E. (2014). Using Delphi technique to build consensus in practice. Int J Bus Sci Appl Manag 9, 65–82. doi: 10.69864/ijbsam.9-2.106
Glasmeier, A. K. (2023) Massachusetts Institute of Technology (MIT). Living wage calculation for Hawaii. Available online at: https://livingwage.mit.edu/states/15 (Accessed July 25, 2023).
Global Hunger Index (GHI) (2023) Food systems transformation and local governance. Available at: https://www.globalhungerindex.org/ (Accessed June 30, 2023)
Gregory, C. A., and Coleman-Jensen, A. (2013). Do high food prices increase food insecurity in the United States? Appl. Econ. Perspect. Policy 35, 679–707. doi: 10.1093/aepp/ppt024
Gross, R., Schoeneberger, H., Pfeifer, H., and Preuss, H. (2000) ʻThe four dimensions of food and nutrition security:definitions and concepts, SCN News. p. 20–25. Available online at: http://fpmu.gov.bd/agridrupal/sites/default/files/Four_Dimension_of_FS_0.pdf (Accessed June 30, 2023)
Gucciardi, E., Vahabi, M., Norris, N., del Monte, J. P., and Farnum, C. (2014). The intersection between food insecurity and diabetes: a review. Curr. Nutr. Rep. 3, 324–332. doi: 10.1007/s13668-014-0104-4
Gundersen, C. (2021a). “How SNAP reduces food insecurity” in Families, food, and parenting: Integrating research, practice and policy. ed. L. A. Francis (Cham: Springer International Publishing), 59–73.
Gundersen, C. (2021b). Viewpoint: a proposal to reconstruct the supplemental nutrition assistance program (SNAP) into a universal basic income program for food. Food Policy 101:102096. doi: 10.1016/j.foodpol.2021.102096
Gundersen, C., Kreider, B., and Pepper, J. V. (2017b). Partial identification methods for evaluating food assistance programs: a case study of the causal impact of SNAP on food insecurity. Am. J. Agric. Econ. 99, 875–893. doi: 10.1093/ajae/aax026
Gundersen, C., Kreider, B., and Pepper, J. V. (2018b). Reconstructing the supplemental nutrition assistance program to more effectively alleviate food insecurity in the United States. J. Soc. Sci. 4, 113–130. doi: 10.7758/rsf.2018.4.2.06
Gundersen, C., Waxman, E., and Crumbaugh, A. S. (2019). An examination of the adequacy of supplemental nutrition assistance program (SNAP) benefit levels: impacts on food insecurity. Agric. Resour. Econ. Rev. 48, 433–447. doi: 10.1017/age.2019.30
Gundersen, C., and Ziliak, J. P. (2015). Food insecurity and health outcomes. Health Aff. 34, 1830–1839. doi: 10.1377/hlthaff.2015.0645
Gundersen, C., Engelhard, E., Satoh, A., and Waxman, E. (2015) Map the meal gap 2015: food insecurity and child food insecurity estimates at the county level. Feeding America. Available online at: https://www.feedingamerica.org/research/map-the-meal-gap/by-county
Gundersen, C., Dewey, A., Crumbaugh, A., Kato, M., and Engelhard, E. (2016) Map the meal gap 2016: a report on county and Congressional District food insecurity and county food cost in the United States in 2014. Feeding America. Available online at: https://www.feedingamerica.org/research/map-the-meal-gap/by-county
Gundersen, C., Dewey, A., Crumbaugh, A., Kato, M., and Engelhard, E. (2017a) Map the meal gap 2017: a report on county and Congressional District food insecurity and county food cost in the United States in 2015. Feeding America. Available online at: https://www.feedingamerica.org/research/map-the-meal-gap/by-county
Gundersen, C., Dewey, A., Crumbaugh, A., Kato, M., and Engelhard, E. (2018a). Map the meal gap 2018: a report on county and Congressional District food insecurity and county food cost in the United States in 2016. Feeding America. Available online at: https://www.feedingamerica.org/research/map-the-meal-gap/by-county
Hartline-Grafton, H., and Vollinger, E. (n.d.) Thrifty food plan 101 (part 2). Food Research & Action Center (FRAC). Available at: https://frac.org/blog/thrifty-food-plan-101-part-2 (Accessed July 25, 2023)
Hasson, F., Keeney, S., and McKenna, H. (2000). Research guidelines for the Delphi survey technique. J. Adv. Nurs. 32, 1008–1015. doi: 10.1046/j.1365-2648.2000.t01-1-01567.x
Hawaiʻi Foodbank (2024) The State of Food Insecurity in Hawaiʻi. Hawaiʻi Foodbank. Available at: https://hawaiifoodbank.org/food-insecurity/ (Accessed December 17, 2024).
Hawaiʻi Health Data Warehouse (HHDW) (2023) Query results for Hawaiʻi's behavioral risk factor surveillance system (BRFSS) data – food security – food didn't last, age adjusted. Available at: https://hhdw.org/report/query/result/brfss/FoodNotLast/FoodNotLastAA11_.html (Accessed June 30, 2023).
Heaton, T. (2023). Hawaii Families Are On The Edge Of A ‘Hunger Cliff Now That Extra Foods Stamps Are Gone’, Honolulu Civil Beat, 23 March. Available at: https://www.civilbeat.org/2023/03/hawaii-families-are-on-the-edge-of-a-hunger-cliff-now-that-extra-foods-stamps-are-gone/ (Accessed December 17, 2024).
Hebinck, A., Zurek, M., Achterbosch, T., Forkman, B., Kuijsten, A., Kuiper, M., et al. (2021). A sustainability compass for policy navigation to sustainable food systems. Glob. Food Sec. 29:100546. doi: 10.1016/j.gfs.2021.100546
Herd, P., Favreault, M., Meyer, M. H., and Smeeding, T. M. (2018). ‘A targeted minimum benefit plan: a new proposal to reduce poverty among older Social security recipients a targeted minimum benefit plan. J. Soc. Sci. 4, 74–90. doi: 10.7758/RSF.2018.4.2.04
HIEMA (2022) State of Hawaiʻi emergency operation – Basic plan. State of Hawaiʻi. Hawaiʻi Emergency Management Agency. Available at: https://dod.hawaii.gov/hiema/files/2022/07/22-0228-State-of-Hawaii-Emergency-Operations-Plan-Basic-Plan.pdf (Accessed July 25, 2023)
HLPE (2020) Food security and nutrition: Building a global narrative towards 2030. A report by the High Level Panel of Experts on Food Security and Nutrition of the Committee on World Food Security, Rome. Available at: https://www.fao.org/3/ca9731en/ca9731en.pdf (Accessed June 30, 2023)
Hutchins, L., and Feldman, M. (2021). ‘What do values have to do with it?: resilience of two types of farmers in Hawai‘i to the COVID-19 pandemic. Front. Sustain. Food Syst. 5:685321. doi: 10.3389/fsufs.2021.685321
Hwalla, N., El Labban, S., and Bahn, R. A. (2016). Nutrition security is an integral component of food security. Front. Life Sci. 9, 167–172. doi: 10.1080/21553769.2016.1209133
Ilieva, R. T. (2017). Urban food systems strategies: a promising tool for implementing the SDGs in practice†. Sustain. For. 9:1707. doi: 10.3390/su9101707
Ismail, G., and Taliep, N. (2023). “The Delphi method” in Handbook of Social sciences and global public health. ed. P. Liamputtong (Cham: Springer International Publishing), 1–19.
Jakobsen, D. D., Brader, L., and Bruun, J. M. (2023). Association between food, beverages and overweight/obesity in children and adolescents—a systematic review and Meta-analysis of observational studies. Nutrients 15:764. doi: 10.3390/nu15030764
Juarez, R., Bonham, C., Bond-Smith, D., Moore, C., Wada, C., Le, B., et al. (2023) Shaping health in Hawaiʻi: the influences of poverty, housing and food insecurity. The economic research Organization at the University of Hawaiʻi (UHERO). Available online at: https://uhero.hawaii.edu/public-health-report-shaping-health-in-hawaii-the-influences-of-poverty-housing-and-food-insecurity/ (Accessed July 25, 2023)
Jünger, S., Payne, S. A., Brine, J., Radbruch, L., and Brearley, S. G. (2017). Guidance on conducting and REporting DElphi studies (CREDES) in palliative care: recommendations based on a methodological systematic review. Palliat. Med. 31, 684–706. doi: 10.1177/0269216317690685
Kantilafti, M., Giannakou, K., and Chrysostomou, S. (2023). Multimorbidity and food insecurity in adults: a systematic review and meta-analysis. PLoS One 18:e0288063. doi: 10.1371/journal.pone.0288063
Karger, H. (2020). Problems in paradise: low wages and the well-being of Hawaiians. Fam. Soc. 101, 340–352. doi: 10.1177/1044389420911321
Karlsson, J. O., Carlsson, G., Lindberg, M., Sjunnestrand, T., and Röös, E. (2018). Designing a future food vision for the Nordics through a participatory modeling approach. Agron. Sustain. Dev. 38:59. doi: 10.1007/s13593-018-0528-0
Keeney, S., Hasson, F., and McKenna, H. P. (2001). A critical review of the Delphi technique as a research methodology for nursing. Int. J. Nurs. Stud. 38, 195–200. doi: 10.1016/S0020-7489(00)00044-4
Kent, G. (2016). “Food security in Hawaiʻi” in Thinking like an island: Navigating a sustainable future in Hawaiʻi. eds. J. Chirico and G. S. Farley (Honolulu: University of Hawaiʻi Press), 28–45.
Khan, S. S., Arita, S., Howitt, R., and Leung, P. S. (2019). A calibrated model of local food system of Hawaii: what are the economic implications of the state’s food goals and policies? Nat. Resour. Model. 32:e12196. doi: 10.1111/nrm.12196
Khan, S. S., Yang, Y., Greaney, T., and Leung, P. S. (2020). Who leads the Price in Honolulu’s food market? An evaluation of the competitiveness of local foods. J. Int. Food Agribus. Mark. 32, 464–481. doi: 10.1080/08974438.2020.1750527
Kimberlin, S., Tach, L., and Wimer, C. (2018). A Renter’s tax credit to curtail the affordable housing crisis. J. Soc. Sci. 4, 131–160. doi: 10.7758/RSF.2018.4.2.07
Kreider, B., Pepper, J. V., Gundersen, C., and Jolliffe, D. (2012). Identifying the effects of SNAP (food stamps) on child health outcomes when participation is endogenous and misreported. J. Am. Stat. Assoc. 107, 958–975. doi: 10.1080/01621459.2012.682828
Landert, J., Schader, C., Moschitz, H., and Stolze, M. (2017). A holistic sustainability assessment method for urban food system governance. Sustain. For. 9:490. doi: 10.3390/su9040490
Lee, B. Y., Bartsch, S. M., Mui, Y., Haidari, L. A., Spiker, M. L., and Gittelsohn, J. (2017). A systems approach to obesity. Nutr. Rev. 75, 94–106. doi: 10.1093/nutrit/nuw049
Leonard, L. (2021) This Hawaiʻi community is a model for food security and resilience. GreenBiz. Available online at: https://www.greenbiz.com/article/hawaii-community-model-food-security-and-resilience (Accessed July 25, 2023).
Leung, C. W., Kullgren, J. T., Malani, P. N., Singer, D. C., Kirch, M., Solway, E., et al. (2020). Food insecurity is associated with multiple chronic conditions and physical health status among older US adults. Prev. Med. Rep. 20:101211. doi: 10.1016/j.pmedr.2020.101211
Loke, M., and Leung, P. (2013). Hawaii’s food consumption and supply sources: benchmark estimates and measurement issues. Agric. Food Econ. 1. doi: 10.1186/2193-7532-1-10
Lovell, B. (2022) ‘Hawaiʻi lawmakers finally agree on raising the minimum wage’, Honolulu Civil Beat, 29 April. Available online at: https://www.civilbeat.org/2022/04/hawaii-lawmakers-finally-agree-on-raising-the-minimum-wage/ (Accessed July 25, 2023)
Lund, B. D. (2020). Review of the Delphi method in library and information science research. J. Doc. 76, 929–960. doi: 10.1108/JD-09-2019-0178
Lyte, B. (2021) ‘How Hawaiʻi squandered its food security — and what it will take to get it Back’, Honolulu Civil Beat. Available online at: https://www.civilbeat.org/2021/04/how-hawaii-squandered-its-food-security-and-what-it-will-take-to-get-it-back/ (Accessed June 30, 2023)
Malachowski, C. P., and Dugger, B. D. (2018). Hawaiian duck behavioral patterns in seasonal wetlands and cultivated taro. J. Wildl. Manag. 82, 840–849. doi: 10.1002/jwmg.21429
Mauser, W., Klepper, G., Rice, M., Schmalzbauer, B. S., Hackmann, H., Leemans, R., et al. (2013). Transdisciplinary global change research: the co-creation of knowledge for sustainability’. Curr. Opin. Environ. Sustain. 5, 420–431. doi: 10.1016/j.cosust.2013.07.001
McKenna, H. P. (1994). The Delphi technique: a worthwhile research approach for nursing? J. Adv. Nurs. 19, 1221–1225. doi: 10.1111/j.1365-2648.1994.tb01207.x
McKernan, S.-M., Ratcliffe, C., and Braga, B. (2021). The effect of the US safety net on material hardship over two decades. J. Public Econ. 197:104403. doi: 10.1016/j.jpubeco.2021.104403
Melesse, M. B., van den Berg, M., Béné, C., de Brauw, A., and Brouwer, I. D. (2020). Metrics to analyze and improve diets through food systems in low and middle income countries. Food Secur. 12, 1085–1105. doi: 10.1007/s12571-020-01091-2
MERIC (2023) Cost of living data series. Missouri economic research and information center. Available at: https://meric.mo.gov/data/cost-living-data-series (Accessed July 25, 2023).
Meter, K., and Goldenberg, M. P. (2017) Hawaiʻi’s food system: food for all. Crossroads Resource Center. Available online at: http://www.crcworks.org/hifood.pdf (Accessed July 25, 2023)
Miles, A., and Heaivilin, H. (2018) Hawaiʻi farmers needs assessment. Available online at: https://www.hawaiifarmersurvey.com/ (Accessed July 25, 2023)
Montenegro de Wit, M., Canfield, M., Iles, A., Anderson, M., McKeon, N., Guttal, S., et al. (2021). Editorial: resetting power in global food governance: the UN food systems summit. Development 64, 153–161. doi: 10.1057/s41301-021-00316-x
Moore, E., Biehl, E., Burke, M., Bassarab, K., Misiaszek, C., and Neff, R. (2022) ‘Food system resilience: a planning guide for local governments’, Johns Hopkins Center for a Livable Future and the Bloomberg Center for Government Excellence. Available online at: https://clf.jhsph.edu/publications/food-system-resilience-planning-guide-local-governments (Accessed July 30, 2023)
Moradi, S., Mirzababaei, A., Dadfarma, A., Rezaei, S., Mohammadi, H., Jannat, B., et al. (2019). Food insecurity and adult weight abnormality risk: a systematic review and meta-analysis. Eur. J. Nutr. 58, 45–61. doi: 10.1007/s00394-018-1819-6
Moragues-Faus, A. (2021). The emergence of city food networks: rescaling the impact of urban food policies. Food Policy 103:102107. doi: 10.1016/j.foodpol.2021.102107
MUFPP (2020) Milan urban food policy pact. Available at: https://www.milanurbanfoodpolicypact.org/ (Accessed June 30, 2023)
Mukherjee, N., Zabala, A., Huge, J., Nyumba, T. O., Adem Esmail, B., and Sutherland, W. J. (2018). Comparison of techniques for eliciting views and judgements in decision-making. Methods Ecol. Evol. 9, 54–63. doi: 10.1111/2041-210X.12940
Mullender, S. M., Sandor, M., Pisanelli, A., Kozyra, J., Borek, R., Ghaley, B. B., et al. (2020). A delphi-style approach for developing an integrated food/non-food system sustainability assessment tool. Environ. Impact Assess. Rev. 84:106415. doi: 10.1016/j.eiar.2020.106415
Musa, H. D., Yacob, M. R., Abdullah, A. M., and Ishak, M. Y. (2015). Delphi method of developing environmental well-being indicators for the evaluation of urban sustainability in Malaysia. Procedia Environ. Sci. 30, 244–249. doi: 10.1016/j.proenv.2015.10.044
Naomasa, E., Arita, S., Tamaru, C., and Leung, P. S. (2013). Assessing Hawaii’s aquaculture farm and industry performance. Aquac. Econ. Manag. 17, 184–207. doi: 10.1080/13657305.2013.796235
Nasa, P., Jain, R., and Juneja, D. (2021). Delphi methodology in healthcare research: how to decide its appropriateness. World J. Methodol. 11, 116–129. doi: 10.5662/wjm.v11.i4.116
NASS (2023) 2022 State Agriculture Overview. U.S. Department of Agriculture, National Agricultural Statistics Service. Available at: https://www.nass.usda.gov/Statistics_by_State/Hawaii/index.php (Accessed July 25, 2023).
Nature Editorial (2018). The best research is produced when researchers and communities work together. Nature. 562:7. doi: 10.1038/d41586-018-06855-7
Niederberger, M., and Köberich, S.members of the DeWiss Network (2021). Coming to consensus: the Delphi technique. Eur. J. Cardiovasc. Nurs. 20, 692–695. doi: 10.1093/eurjcn/zvab059
Nisbett, N., Friel, S., Aryeetey, R., Gomes, F. S., Harris, J., Backholer, K., et al. (2021). Equity and expertise in the UN food systems summit. BMJ Glob. Health 6:e006569. doi: 10.1136/bmjgh-2021-006569
Norström, A. V., Cvitanovic, C., Löf, M. F., West, S., Wyborn, C., and Balvanera, P. (2020). Principles for knowledge co-production in sustainability research. Nature Sustainability 3, 182–190. doi: 10.1038/s41893-019-0448-2
Ogot, N. (2021). “Chapter 7 – metrics for identifying food security status” in Food security and nutrition. ed. C. M. Galanakis (Cambridge, MA: Academic Press), 147–179.
Ohri, C., Celik, N., Levy, R., and Waters, T. (2020) Hawaiʻi financial health pulse: 2019 survey results. Financial Health Network. Available at: https://finhealthnetwork.org/research/hawaii-financial-health-pulse/ (Accessed July 25, 2023)
Organization for Economic Co-Operation and Development (OECD) (2008). Handbook on constructing composite indicators: Methodology and user guide. Paris: OECD.
Orou Sannou, R., Kirschke, S., and Günther, E. (2023). Integrating the social perspective into the sustainability assessment of Agri-food systems: a review of indicators. Sustain. Product. Consumpt. 39, 175–190. doi: 10.1016/j.spc.2023.05.014
Padilla-Rivera, A., do Carmo, B. B. T., Arcese, G., and Merveille, N. (2021). Social circular economy indicators: selection through fuzzy delphi method. Sustain. Product. Consumpt. 26, 101–110. doi: 10.1016/j.spc.2020.09.015
Pangaribowo, E. H., Gerber, N., and Torero, M. (2013) ʻFood and nutrition security indicators: a reviewʻ, ZEF working paper series. No. 108. Bonn: University of Bonn, Center for Development Research (ZEF). Available online at: https://www.econstor.eu/bitstream/10419/88378/1/773397795.pdf (Accessed June 30, 2023)
Pape, E. (2015) ‘Living Hawaiʻi: how much does shipping increase the cost of living?’, Honolulu Civil Beat, 6 April. Available online at: https://www.civilbeat.org/2015/04/living-hawaii-how-much-does-shipping-increase-the-cost-of-living/ (Accessed July 25, 2023).
Parcon, H., Arita, S., Loke, M., and Leung, P. (2011). A comparison of agricultural input prices: Hawaii vs. its major competitor, Economic Issues Series, EI-20. Honolulu, Hawaiʻi: University of Hawaiʻi. Available online at: https://scholarspace.manoa.hawaii.edu/items/06590b5e-734b-4a30-87f0-aeec6b4dc3bd (Accessed July 25, 2023)
Pirkle, C., and Sentell, T. (2021). Hawaiʻi residents continue to struggle to afford food in 2021. Hawaii: SMS Community Pulse.
Pourmotabbed, A., Moosavian, S. P., Hadi, A., Mohammadi, H., Dadfarma, A., Rezaei, S., et al. (2020). The relationship between food insecurity and risk of overweight or obesity in under 18 years individuals: a systematic review and Meta-analysis. Int. J. Prev. Med. 11:158. doi: 10.4103/ijpvm.IJPVM_463_19
Pourmotabbed, A., Moradi, S., Babaei, A., Ghavami, A., Mohammadi, H., Jalili, C., et al. (2020). Food insecurity and mental health: a systematic review and meta-analysis. Public Health Nutr. 23, 1778–1790. doi: 10.1017/S136898001900435X
Powell, C. (2003). The Delphi technique: myths and realities. J. Adv. Nurs. 41, 376–382. doi: 10.1046/j.1365-2648.2003.02537.x
Prosperi, P., Allen, T., Cogill, B., Padilla, M., and Peri, I. (2016). Towards metrics of sustainable food systems: a review of the resilience and vulnerability literature. Environ. Syst. Decis. 36, 3–19. doi: 10.1007/s10669-016-9584-7
Prosperi, P., Moragues-Faus, A., Sonnino, R., and Devereux, C. (2015) Measuring progress towards sustainable food cities: sustainability and food security indicators. Report of the ESRC financed project “enhancing the impact of sustainable urban food strategies”. Available online at: https://www.researchgate.net/publication/286263657_Measuring_progress_towards_sustainable_food_cities_Sustainability_and_food_security_indicators (Accessed December 17, 2024).
Pruitt, A., Zhang, W., Wu, Y., Bird, O., Nakamura, B., and Barile, J. (2021). Addressing Hunger & Food Insecurity among Hawaiʻi’s families. Prepared for the College of Social Sciences, UH Mānoa and First Insurance Company of Hawaiʻi, Honolulu, HI. Available at: https://drive.google.com/file/d/1e3MkhACuaFYxULdsfwx56Jp1psCMAm4t/view (Accessed June 30, 2023)
Qureshi, M. E., Dixon, J., and Wood, M. (2015). Public policies for improving food and nutrition security at different scales. Food Secur. 7, 393–403. doi: 10.1007/s12571-015-0443-z
Reid, N. (1988). “The Delphi technique: its contribution to the evaluation of professional practice” in Professional competence and quality Assurance in the Caring Professions. ed. E. Roger (London: Croom Helm), 230–262.
Saffie, N. A. M., Shukor, N. M., and Rasmani, K. A. (2016) ‘Fuzzy delphi method: issues and challenges’, in 2016 International Conference on Logistics, Informatics and Service Sciences (LISS), pp. 1–7.
Schmit, T. M., Jablonski, B. B. R., Minner, J., Kay, D., and Christensen, L. (2017). Rural wealth creation of intellectual capital from urban local food system initiatives: developing indicators to assess change. Community Dev. 48, 639–656. doi: 10.1080/15575330.2017.1354042
Shaw, A., Miles, A., Afuso, K., and Bartolotti, T. (2021). Vulnerability & Resilience in Hawaiʻi’s Food System: Lessons from COVID-19: Key Informant Interview Findings. Available at: https://transforminghawaiifoodsystem.org/old-kp-page/vulnerability-assessments/ (Accessed December 17, 2024).
SMS Hawaiʻi (2023) Community pulse survey dashboard. Available online at: https://www.smshawaii.com/studies/community-pulse-survey (Accessed June 30, 2023).
Social Ventures LLC (2018) Supplemental nutrition assistance program inquiry: report on Findings & Recommendations. Available online at: https://www.hacbed.org/wp-content/uploads/2018/04/SNAP-Inquiry-FINAL-Report.pdf (Accessed July 25, 2023).
Spoto, D., Smith, J., and Thomas, D. (2023) Hawaiʻi SNAP: challenges and opportunities for improving food security for Hawaiʻi residents. Hawaiʻi Appleseed Center for Law & Economic Justice. Available online at: https://static1.squarespace.com/static/601374ae84e51e430a1829d8/t/63c6ef146e1b9e327c4e0828/1673981727681/SNAP+Needs+Report_FINAL.pdf (Accessed July 25, 2023).
Steffen, W., Richardson, K., Rockström, J., Cornell, S. E., Fetzer, I., Bennett, E. M., et al. (2015). Planetary boundaries: guiding human development on a changing planet. Science 347:1259855. doi: 10.1126/science.1259855
Stupplebeen, D. A., Quensell, M., Peltzer, N. K., and Pirkle, C. M. (2020) Food insecurity in Hawaiʻi using a population-based sample: A data brief. University of Hawaiʻi and Mānoa, Office of Public Health Studies, Healthy Hawaiʻi Initiative Evaluation Team. Available online at: https://www.hawaiihealthmatters.org/content/sites/hawaii/2018_Food_Insecurity_Data_Brief.pdf (Accessed June 30, 2023)
Swann, C. A. (2017). Household history, SNAP participation, and food insecurity. Food Policy 73, 1–9. doi: 10.1016/j.foodpol.2017.08.006
Terrell, J. (2021) ‘Hawaiʻi’s food system is broken. Now is the time to fix it’, Honolulu Civil Beat. Available online at: https://www.civilbeat.org/2021/01/hawaiis-food-system-is-broken-now-is-the-time-to-fix-it/ (Accessed June 30, 2023)
Thomas, M. K., Lammert, L. J., and Beverly, E. A. (2021). Food insecurity and its impact on body weight, type 2 diabetes, cardiovascular disease, and mental health. Curr. Cardiovasc. Risk Rep. 15:15. doi: 10.1007/s12170-021-00679-3
Tiehen, L., Jolliffe, D., and Gundersen, C. (2012) Alleviating poverty in the United States: The critical role of SNAP benefits, ERR-132, U.S. Department of Agriculture, Economic Research Service. Available at: https://www.ers.usda.gov/publications/pub-details/?pubid=44965 (Accessed July 25, 2023)
Tribble, A. G., Maxfield, A., Hadley, C., and Goodman, M. (2020). ‘Food insecurity and mental health: a Meta-analysis’ (January 15, 2020). Lancet. doi: 10.2139/ssrn.3520061
Tyndall, J., Bond-Smith, D., and Inafuku, R. (2023) The Hawaiʻi housing Factbook. The economic research Organization at the University of Hawaiʻi (UHERO). Available online at: https://uhero.hawaii.edu/the-hawaii-housing-factbook/ (Accessed July 25, 2023)
United Nations (2015) Goal 2: Zero Huner. Available online at: https://www.un.org/sustainabledevelopment/hunger/ (Accessed December 1, 2023)
Urke, H. B., Cao, Z. R., and Egeland, G. M. (2014). Validity of a single item food security questionnaire in Arctic Canada. Pediatrics 133, e1616–e1623. doi: 10.1542/peds.2013-3663
Volkery, A., Ribeiro, T., Henrichs, T., and Hoogeveen, Y. (2008). Your vision or my model? Lessons from participatory land use scenario development on a european scale. Syst. Pract. Act. Res. 21, 459–477. doi: 10.1007/s11213-008-9104-x
von der Gracht, H. A. (2012). Consensus measurement in Delphi studies: review and implications for future quality assurance. Technol. Forecast. Soc. Chang. 79, 1525–1536. doi: 10.1016/j.techfore.2012.04.013
Wang, D. D., Li, Y., Afshin, A., Springmann, M., Mozaffarian, D., Stampfer, M. J., et al. (2019). Global improvement in dietary quality could Lead to substantial reduction in premature death. J. Nutr. 149, 1065–1074. doi: 10.1093/jn/nxz010
Waxman, E., Gundersen, C., and Fiol, O. (2021) How far did SNAP benefits fall short of covering the cost of a meal in 2020? Urban Institute. Available online at: https://www.urban.org/research/publication/how-far-did-snap-benefits-fall-short-covering-cost-meal-2020 (Accessed July 25, 2023)
WB, FAO, and RAUF (2017) Urban food systems diagnostic and metrics framework: roadmap for future geospatial and big data analytics. World Bank, Food and Agriculture Organization, and RUAF Foundation. Available at: https://documents1.worldbank.org/curated/en/807971522102099658/pdf/Urban-food-systems-diagnostic-and-metrics-framework-roadmap-for-future-geospatial-and-big-data-analytics.pdf (Accessed June 30, 2023)
Wentholt, M. T. A., Rowe, G., König, A., Marvin, H. J. P., and Frewer, L. J. (2009). The views of key stakeholders on an evolving food risk governance framework: results from a Delphi study. Food Policy 34, 539–548. doi: 10.1016/j.foodpol.2009.06.002
Wheaton, L., and Kwon, D. (2022) Effect of the reevaluated thrifty food plan and emergency allotments on supplemental nutrition assistance program benefits and poverty. Urban Institute. Available at: https://www.urban.org/research/publication/effect-reevaluated-thrifty-food-plan-and-emergency-allotments-supplemental (Accessed July 25, 2023)
WHO (2020) Healthy diet. World Health Organization. Available at: https://www.who.int/news-room/fact-sheets/detail/healthy-diet (Accessed July 25, 2023)
WHO (2021a). Comprehensive mental health action plan, 2013–2030. World Health Organization. Licence: CC BY-NC-SA 3.0 IGO. Geneva: World Health Organization.
Willett, W., Rockström, J., Loken, B., Springmann, M., Lang, T., Vermeulen, S., et al. (2019). Food in the Anthropocene: the EAT–lancet commission on healthy diets from sustainable food systems. Lancet 393, 447–492. doi: 10.1016/S0140-6736(18)31788-4
WSFS (2009) Declaration of the world summit on food security. Food and agriculture organization, world summit on food security. 16-18 November. Rome, Italy. Available online at: https://www.fao.org/fileadmin/templates/wsfs/Summit/Docs/Final_Declaration/WSFS09_Declaration.pdf (Accessed June 30, 2023)
Zhou, C., Miao, H., Zhao, Y., and Wan, X. (2023). Food insecurity increases the risk of overweight and chronic diseases in adolescents: a systematic review and meta-analysis. Food Sci. Human Wellness 12, 1937–1947. doi: 10.1016/j.fshw.2023.03.002
Keywords: food security, indicators and metrics, Delphi method, Hawaiʻi, food system transformation, SDG 2 (Zero Hunger)
Citation: Shon J and Miles A (2025) Ranking food security indicators and metrics in Hawaiʻi: a Delphi approach. Front. Sustain. Food Syst. 8:1427270. doi: 10.3389/fsufs.2024.1427270
Edited by:
Manjeet Singh Nain, Indian Agricultural Research Institute (ICAR), IndiaReviewed by:
Luis F. Goulao, University of Lisbon, PortugalRajinder Parshad Parshad, Indian Council of Agricultural Research (ICAR), India
Copyright © 2025 Shon and Miles. This is an open-access article distributed under the terms of the Creative Commons Attribution License (CC BY). The use, distribution or reproduction in other forums is permitted, provided the original author(s) and the copyright owner(s) are credited and that the original publication in this journal is cited, in accordance with accepted academic practice. No use, distribution or reproduction is permitted which does not comply with these terms.
*Correspondence: Jason Shon, amFzb250bWprc0BnbWFpbC5jb20=