 Andrew J. Fletcher
 Nick W. Smith
 Jeremy P. Hill1,2
 Warren C. McNabb
94% of researchers rate our articles as excellent or good
Learn more about the work of our research integrity team to safeguard the quality of each article we publish.
Find out more
ORIGINAL RESEARCH article
Front. Sustain. Food Syst. , 10 July 2024
Sec. Sustainable Food Processing
Volume 8 - 2024 | https://doi.org/10.3389/fsufs.2024.1419259
Introduction: Fermentation-produced protein (FPP) is gaining global interest as a means of protein production with potentially lower cost and environmental footprint than conventionally-produced animal-sourced proteins. However, estimates on the potential performance of FPP vary substantially, limiting assessment of its scalability and utility.
Methods: We integrate life cycle analysis data with nutritional and economic data in an interactive online tool, simulating the requirements and consequences of fermentation at a globally-relevant scale.
Results: The tool demonstrates that production of an additional 18 million tons of protein annually via fermentation (~10% of 2020 global consumption) would necessitate 10–25 million hectares of feedstock cropland expansion/reallocation, utilize up to 1% of global electricity generation, produce 159 million tons CO2 equivalents, and have a total process input cost of 53.77 billion USD, with a negligible impact on nutrient supply beyond protein.
Discussion: This tool should be used to inform the debate on the future use of fermentation in the food system.
An increasing global population raises the challenge of how we adequately nourish people in the future without exceeding the capacity of the planet to support food production and all other forms of human activity. It has been suggested that the world needs to produce 70% more protein by 2050 to meet the needs of the future population (High Level Expert Forum, 2009), although this figure may be confounding demand with nutritional requirement, since other analyses have shown that current protein production is sufficient to meet global requirements for both total protein and essential amino acids, even when adjusted for protein quality (i.e., the digestibility and amino acid composition of different protein sources) (Smith et al., 2021). However, many populations already have insufficient quality protein intakes to meet requirements for all amino acids, owing to inequities in access (Moughan, 2021; FAO et al., 2022), and tackling the resulting undernourishment will require changes to food production systems (FAO et al., 2022). Increasing the affordability and local availability of protein supply will be vital in addressing these challenges, although the ideal source of this protein is the subject of debate.
Food production at the global scale is associated with harmful environmental impacts, necessitating the development of sustainable sources of food. One technology that has received substantial research and capital investment is the production of food proteins or lipids by “precision fermentation” (Te Puna Whakaaronui, 2022). Investment in these technologies has been associated with claims of improved comparative environmental performance—primarily lower greenhouse gas (GHG) footprints—compared with the traditional livestock products they are intended to replace (Tubb and Seba, 2019; Järviö et al., 2021; Perfect Day and WSP, 2021; Behm et al., 2022). There have also been reports that have extended to other environmental impacts, such as energy use, land use, and the production of other pollutants, but these have most commonly focused on meat produced via cellular agriculture (Sinke et al., 2023). Moreover, the nascent nature of this technology has led to diverse estimates for its impact, usually on a relatively small scale compared to traditional livestock.
A recent framework assessed the GHG and water footprints of using precision fermentation for the manufacture of the dairy whey protein beta-lactoglobulin (β-lac) (Behm et al., 2022). β-lac was an apt case study, due to its relatively simple structure and broad use and functionality as an ingredient in the food industry, and whey is the focus of existing commercial fermentation efforts (Perfect Day and WSP, 2021). The research assessed outcomes in a range of locations worldwide and showed that the GHG footprint was strongly dependent on the characteristics of the local electricity supply and the chosen carbon source (Behm et al., 2022). With high fermentation performance and a predominantly renewable electricity supply, footprints were comparable with dairy protein produced by traditional means.
Here, we build on this work to provide an expanded context for these technologies, assessing the impact of large-scale deployment of precision fermentation on global nutrition (beyond solely protein supply), the primary production and subsequent processing of the simple carbohydrates used to fuel first generation fermentations, the physical processing equipment requirements for the fermentation and downstream processing, and a consideration of key operational costs. We have incorporated this information into a computer model that is accessible through the Sustainable Nutrition Initiative® website (www.sustainablenutritioninitiative.com), which enables users to modify a wide range of parameters related to the raw material, fermentation, post-fermentation processing and utility supplies to explore the impact and overall viability of fermentation for large scale food ingredient production.
The foundation for this research was the work of Behm et al. (2022). Readers are referred to this publication for full details of the precision fermentation process underlying the computational model presented here. Briefly, the process considers the production of β-lac by genetically engineered Trichoderma reesei, an industrially proven combination for fermentation-produced protein (FPP) (Perfect Day and WSP, 2021). The “cradle to gate” analysis considers the supply of raw materials for the fermentation, energy production and use, and the processing of produced materials to a final product comparable to isolated dairy protein. Given the paucity of data for large-scale FPP, the authors made several assumptions for fermentation parameters based on similar processes.
In this paper, we describe the development and results of our own extensions of the work of Behm and colleagues, and its incorporation into an online, accessible computer model. The model is linear in nature, with all inputs and outputs scaling linearly based on the protein production set by the user, subject to the specific prices, footprints, and protein structure relevant for the user inputs. Figure 1 gives an overview of model calculation methodology.
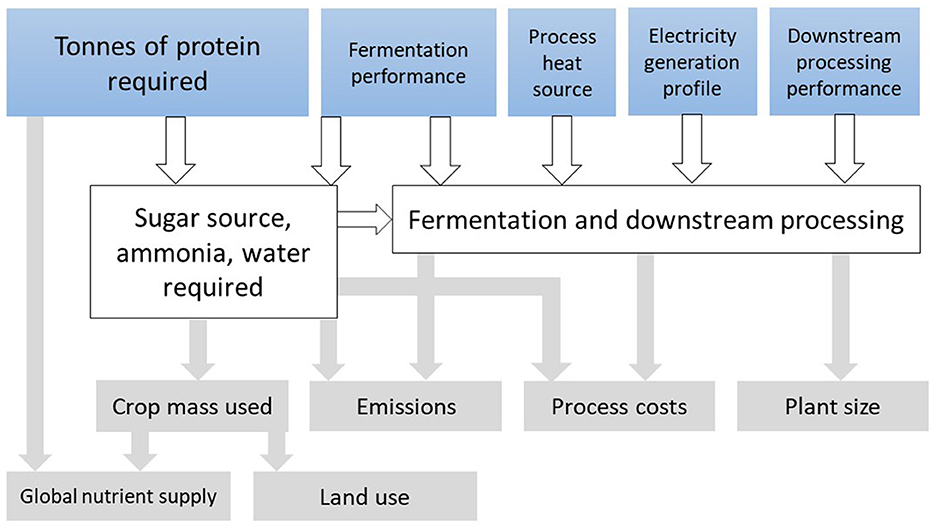
Figure 1. Schematic of model calculation methodology. User inputs (shown in blue) are total protein production, along with various parameters for fermentation performance and inputs. The model outputs (shown in gray) are calculated linearly from the connected inputs.
Fermentation processes require sources for each of the elements that make up the products they produce and the biomass of the production organisms themselves. The major components of this are carbon, nitrogen, hydrogen, oxygen, and sulfur. First generation fermentations use a simple carbohydrate source such as glucose or sucrose as the primary carbon and biological energy source. Nitrogen and sulfur come from ammonia and sulphuric acid respectively.
Sucrose or glucose can be produced from a range of base food commodities: by direct extraction from juice (sugar beet or sugar cane), or by hydrolysis of starch (various grains or tubers). Information on the global average yield of these processes is available from the FAO (1997), and the post-harvest loss and seed use of the base commodities can be obtained from the FAO Food Balance Sheets (FAO, 2023). These enable back calculation of the amount of primary commodity required to provide a specified amount of carbohydrate for the fermentation.
For example, initial processing of sugar beet has a yield of 14 tons of raw sugar per 100 tons of beet, and the refining process a yield of 94 tons of refined sucrose per 100 tons of raw sugar, giving an overall yield of 13.2 tons of sugar per 100 tons of beet. Thus, 1 million tons of sugar would require production of 7.6 million tons of sugar beet.
The land required to produce the primary crop can then be estimated using the method of Smith et al. (2022), which uses the range of global yields to determine the land requirements under average (mean of global production), low (mean of poorest yielding 50% of production), and high (mean of highest yielding 50% of production) yields of the base crops.
Behm et al. (2022) included consideration of the contribution of transport emissions for the fermentation feed material as part of the overall footprint. For most of the scenarios studied these were a comparatively minor portion of the overall emissions: at most 3% of net emissions [0.17 kg CO2-equivalents (CO2e) of 5.5 kg CO2e total]. In this work, transport emissions have been omitted.
Emissions related to process inputs, such as carbohydrate source and ammonia, were inferred from Behm et al. (2022). Emissions related to energy use by the fermentation process itself are described below.
Fermentation processes require considerable amounts of energy (in the form of electricity) to agitate the fermenters, provide adequate supply of oxygen (usually as compressed air) to maintain aerobic conditions, provide cooling, and to operate the downstream processes required to convert the fermenter output into food grade ingredients. As noted by Behm et al. (2022), the scope 2 emissions associated with the electricity supply are a major part of the overall product footprint.
The GHG footprint of electricity production varies considerably around the world based on the production mix of the electricity grid. For this work the footprints of different electricity generation systems were taken from the World Nuclear Association (2022). National values for three example countries (Australia, New Zealand, and the United States) were calculated using these figures and data on the share of production by each generation type (see Supplementary material). These countries were included in the analysis of Behm et al. (2022) and have very different electrical generation profiles: Australia is heavily dependent on coal, New Zealand has a high portion of hydroelectricity, and the United States is a larger economy with an intermediate generation profile, thus they show a useful range of possible footprints.
Production of dried food ingredients requires significant quantities of heat. Generally, this is sourced from the combustion of fossil fuels (coal, oil, or natural gas) or biomass, with the associated GHG emissions from the use of these fuels. An alternative approach is providing process heat using electricity, which in a low GHG footprint electricity grid could yield lower product footprints than combustion of either fossil fuels or biomass. This option was included in the model with a default efficiency of 99% and the cost and GHG emissions determined from the selected electricity supply.
Much of the work on FPP has focused on the production of whey proteins, particularly β-lac, the major protein in bovine whey. This is sensible, as β-lac in undenatured form is water soluble, has a modest chain length, does not have an overly complex structure, has a good mix of essential amino acids (AA), is produced in nature to be a food protein, and is used in a variety of food products. However, fermentation can be used to produce a wide range of proteins.
The type of protein being produced will affect the fermentation in several ways. The simplest to model is the impact of the AA sequence on the stoichiometric requirements for the component atoms. This can be determined directly from the AA sequence and the molecular formulae of the AA themselves. The protein selection will also affect the nutritional properties of the product based on the AA content and the relative digestibility of these. The current model can take information on a variety of proteins to provide a range of options for the user, with β-lac and as1-casein provided as initial options.
The stoichiometry used by Behm et al. (2022) corresponds to an AA sequence that includes the signal sequence (SS) as well as the β-lac protein itself. This sequence is 16 AA longer and results in a slightly different ratio of AA and atoms than the protein alone. The final fate of the SS—which is required as part of the assembly of the protein, but not for the final function—has an impact on the efficiency of the system. The approach we have considered is that the signal sequence is detached from the protein within the cells and reused by the cells or remains as part of the cell biomass at the end of the fermentation. The stoichiometry of the fermentation is therefore based on the protein AA sequence without the SS.
At an early stage of development, it can be difficult to predict the final cost of products produced by new technologies—especially as related to the capital, maintenance, and labor costs as these are strongly scale dependent. However, it is possible to set lower boundaries based on process inputs such as ingredients and electricity, which have a fixed price per unit giving a linear response to scale. In the case of FPP, major inputs include the carbohydrate source, ammonia, electricity, process heat, and water. This is not an exhaustive list as there will also be a sulfur source, corn steep liquor, cleaning chemicals, and wastewater treatment. By applying relevant prices to the supply of the five inputs currently included in the model we can establish a lower boundary for the process costs that, even if all other costs were zero, would set a minimum cost for the resulting protein ingredient. For the examples in this paper, we originally calculated prices in New Zealand dollars (NZD), before converting to United States dollars (USD) using 1 NZD = 0.6 USD (November 2023 exchange rate).
Costs for sugar, water, ammonia, and natural gas were obtained from various government and industry sources (Watercare, 2022; Index Mundi, 2023; MBIE, 2023).
The cost of processing equipment has a non-linear relationship with plant size. This is a combination of the effect of the square-cube law (only 4 × the surface area is needed to enclose 8 × the volume) and distributing the cost of a fixed amount of instrumentation and control equipment across a larger capacity. This provides a significant scale advantage, which promotes larger unit sizes. However, there is a point at which further increases in physical size becomes impractical and further scale is achieved by increasing the number of standard size modules. For example, spray driers for the manufacture of milk powder have reached an effective maximum unit size of ~30 tons of product per hour, this being a good compromise between the economies of scale and operational practicality (Eagle, 2021). Maximum sizes for the major process components have been set as follows:
• Fermenters–300 m3 liquid volume
• Ring driers–10 t/h water evaporation
• Spray driers–30 t/h water evaporation
The filtration plant is typically less scale dependent than the process items above once commercial scale modules have been attained. The key sizing variable is the filter (or membrane) area. The size of the filtration processes within the post-processing have been estimated by setting a value for the average permeate flux over the entire operating cycle of the filter (including cleaning and other downtime) to determine the total area required.
Using recently published life cycle analysis data (Behm et al., 2022), publicly-available emissions, commodity pricing and electricity production data (Supplementary material), in combination with previously developed cropland and global nutrition modeling (Smith et al., 2021, 2022), we have developed an interactive model which allows users to investigate the inputs, outputs, and resource footprints of fermentation at scale. The tool can be accessed at www.sustainablenutritioninitiative.com. The tool was constructed as a simple linear representation of the fermentation process as described and parameterized by Behm et al. (2022), with all inputs, outputs, and footprints scaling linearly with the user-defined protein production amount. This tool allows interested users to simulate the production of various protein species via fermentation, at a scale relevant to global nutrition. Part of the user interface is shown in Figure 2.
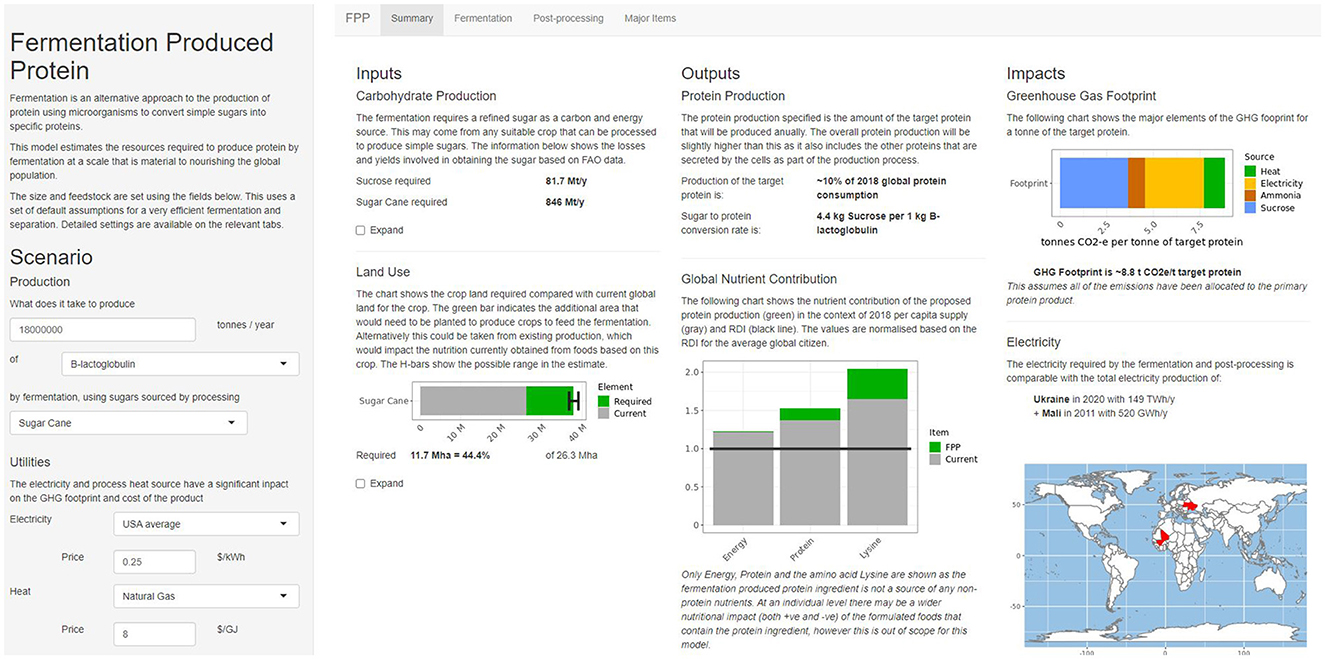
Figure 2. User interface of the interactive FPP tool.
To demonstrate the functionality of this model, here we investigated the scale of operation required to produce 18 million tons of target protein, which would be approximately equivalent to 10% of global food protein consumption in 2020.
Fermentation parameters comparable with previously published work Behm et al. (2022) were selected for this demonstration, and are listed below. Note that these values are adjustable in the interactive tool.
• Target protein as a percentage of the non-cellular protein produced by the fermenter = 90%
• Carbohydrate carbon converted to CO2 = 50%
• Final protein concentration at the end of the fermentation = 50 g/L
• Final cell biomass concentration at the end of the fermentation = 30 g/L
• Protein recovery in the post fermentation processing = 97.5%
If using sucrose, this gives an effective yield of 1 kg of β-lac for every 4.4 kg of sucrose used in the fermentation. The final ingredient will also include 0.11 kg of non-β-lac fungal protein. There is also a by-product containing 0.69 kg of fungal biomass and unrecovered protein.
The type of carbon source selected to act as the feedstock for the fermentation impacts the area of cropland required. Table 1 shows the model results for four different feedstock crops.
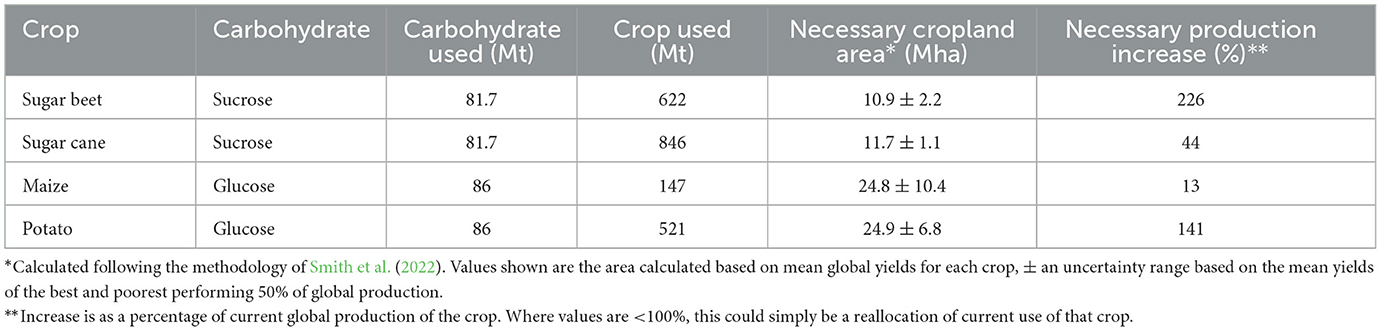
Table 1. Cropland footprint of producing 18 million tons of protein via fermentation using various carbon sources.
While maize would be the most efficient crop to use in terms of total crop mass required, from a land area perspective, the use of sugar beet would be more than twice as efficient as maize or potato at global average yields. However, it is also important to consider this from a feasibility of expansion perspective. Production of the necessary amount of sugar beet would require a 226% increase in sugar beet production. By contrast, only a 13% increase or reallocation of maize production would be necessary owing to the far greater extent of current global maize production.
The GHG footprint of FPP is strongly dependent on the energy source for the electrical power and heat necessary for its production, particularly during drying stages. Table 2 shows the model results for GHG emissions when production is based on sucrose derived from sugar cane.
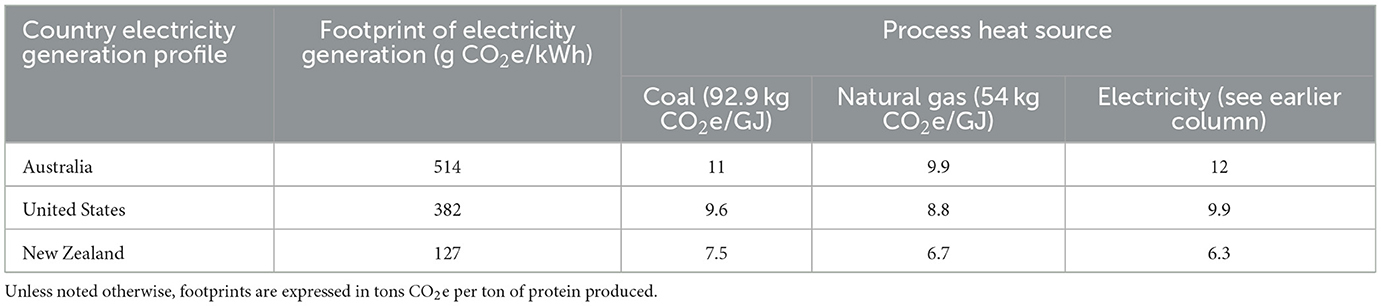
Table 2. GHG footprint of producing protein via fermentation assuming the electricity generation profile of three example countries and three process heat sources.
New Zealand has the lowest footprint irrespective of process heat source owing to its largely renewable electricity generation, while Australia has the highest. Use of electricity to provide process heat is only optimal when the average footprint of the electrical grid is below the direct footprint of providing process heat from natural gas (the lower of the fossil fuel sources). At 54 kg CO2e/GJ for natural gas, this equates to an electricity footprint of 194 t CO2e/GWh, which in this example was only possible in New Zealand. In Australia and the United States, natural gas would be a more emissions-efficient source of process heat.
The electricity required can be compared with the national electricity supply of countries to provide a point of reference. In this scenario, the total electricity requirement would be 150 TWh/year, which is 57% of Australia's 2018 electricity generation (261 TWh), or 3.6% of US generation (4,178 TWh) in the same year, or 0.56% of global generation. Using electricity to provide process heat increases this to 253 TWh/year, equivalent to almost all Australian generation in 2018, and 0.95% of global generation.
Table 3 summarizes the major operational costs for production of 10% of global protein supply per year using the default conditions in the US and sugar cane as the carbohydrate source.
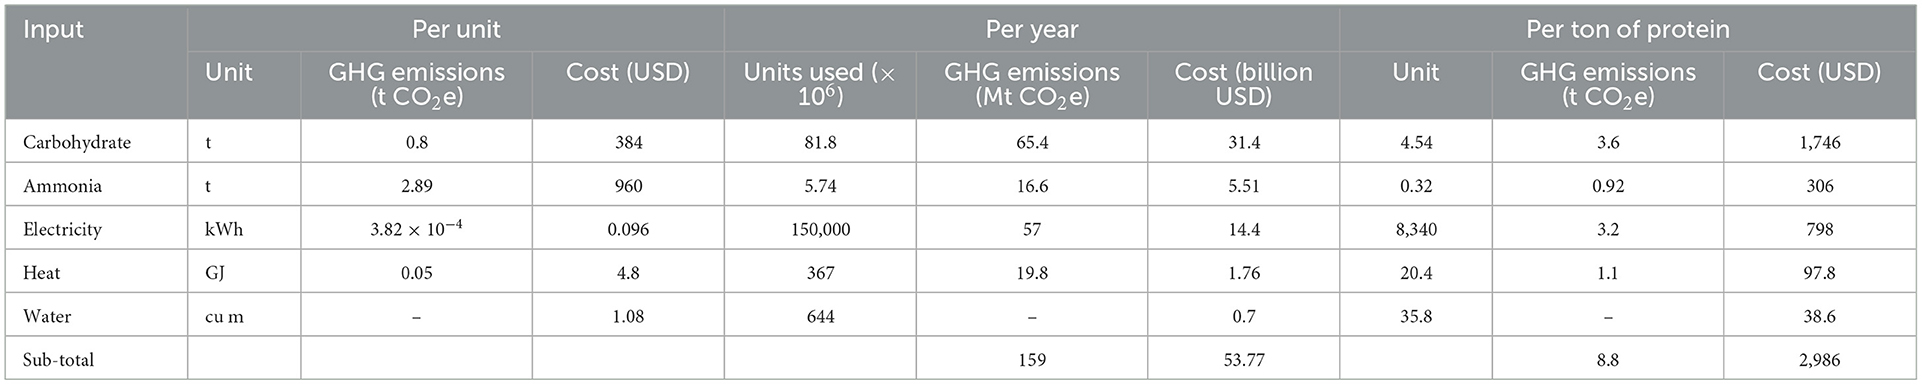
Table 3. Inputs, costs, and emissions of producing 10% of global protein supply via fermentation.
For context, total GHG emissions from all sources in 2021 were 54.59 billion tons CO2e (Ritchie et al., 2020), so FPP as simulated here would constitute 0.3%. Agriculture and related land use change accounted for 9.3 billion tons in 2018 (FAO, 2020), making this FPP scenario equal to ~1.7% of all agriculture.
As noted elsewhere (Behm et al., 2022), the emissions per ton of protein product are of the same order as conventional whey protein isolate (WPI), with the more efficient of the two largely dependent on country of production.
Significant infrastructure is necessary to produce FPP at the rate necessary to achieve 18 million tons per year. Supplementary Table 4 captures the scale of this infrastructure as calculated by the model. The model finds that 22,800 300 m3 fermenters, 319 ring driers and 228 large spray driers would be necessary to support this quantity of FPP production.
To put this is context, global whole milk powder (WMP) production was 3.97 Mt in 2020 (FAO, 2021). This is spray dried from ~50% solids in spray driers, giving a total water evaporation similar to the amount of product produced (3.97 Mt/yr). At 18 Mt scale, FPP production would require spray drying capacity at around 15 times the amount currently used for WMP.
To understand the nutritional context of FPP production and consumption, we drew estimated global energy, protein, and lysine (the first limiting AA in global supply) requirements of the 2020 population from the DELTA Model® (Smith et al., 2021), noting that it is only to protein, amino acid, and energy supply that FPP would contribute in this scenario. This model estimates 2020 global surpluses of these nutrients of 26, 42, and 70%, respectively.
If the feedstock for the fermentation were maize glucose, and this maize was sourced from the reallocation of existing production (rather than increased production), the impact would be broader than simply protein and energy. Table 4 details the results of this reallocation for global nutrient supply. These results are based on the total protein product including co-products of the fermentation, which make up 10% of the dry protein content of the final ingredient. Maize was chosen for this simulation as it would have a greater impact than either of the sugar crops considered. Potato could have been used, but as shown in Table 1, current global potato production would be insufficient to produce this amount of FPP, even with complete reallocation to this use.
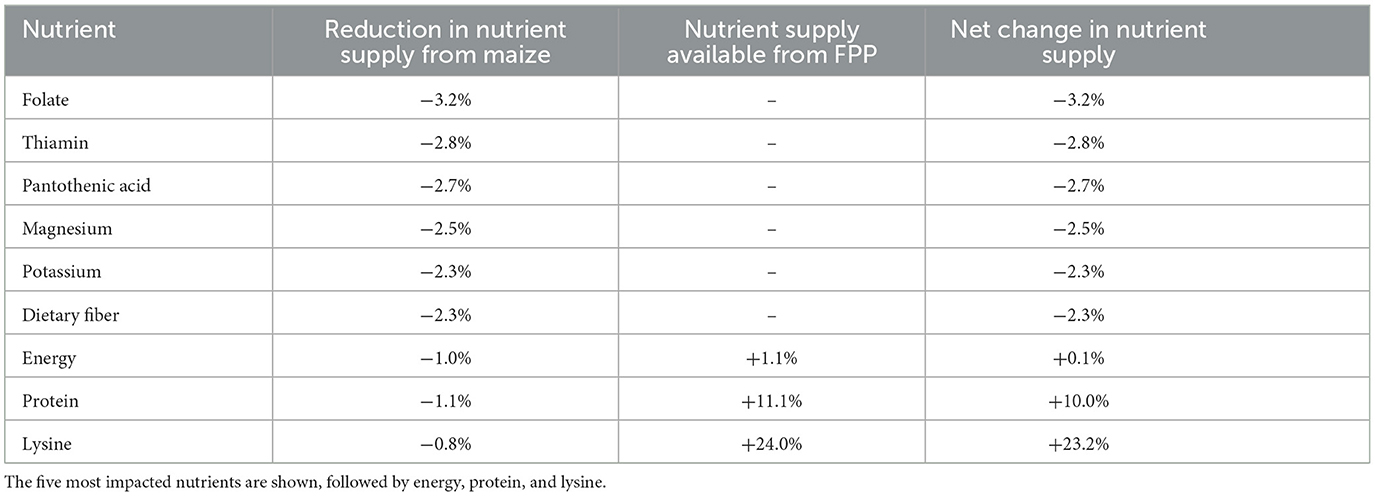
Table 4. Impact on global nutrient supply of diverting maize from current uses to produce an additional 10% of global protein supply via fermentation.
The reallocation would have a relatively minor impact on the availability of all nutrients other than protein and the amino acids. The increase in lysine supply would be substantially greater than the increase in protein supply, due to the relatively high lysine content of β-lac.
A previous publication performed a sensitivity analysis of their model conclusions based on realistic variations in key model parameters, reporting the sensitivity of emissions and water use estimates to these values (Behm et al., 2022). We used a similar approach for cropland footprint and cost, analyzing the impact of variations in final titer, CO2 selectivity, final fungal biomass amount, and percentage of protein recovered in microfiltration (Table 5).
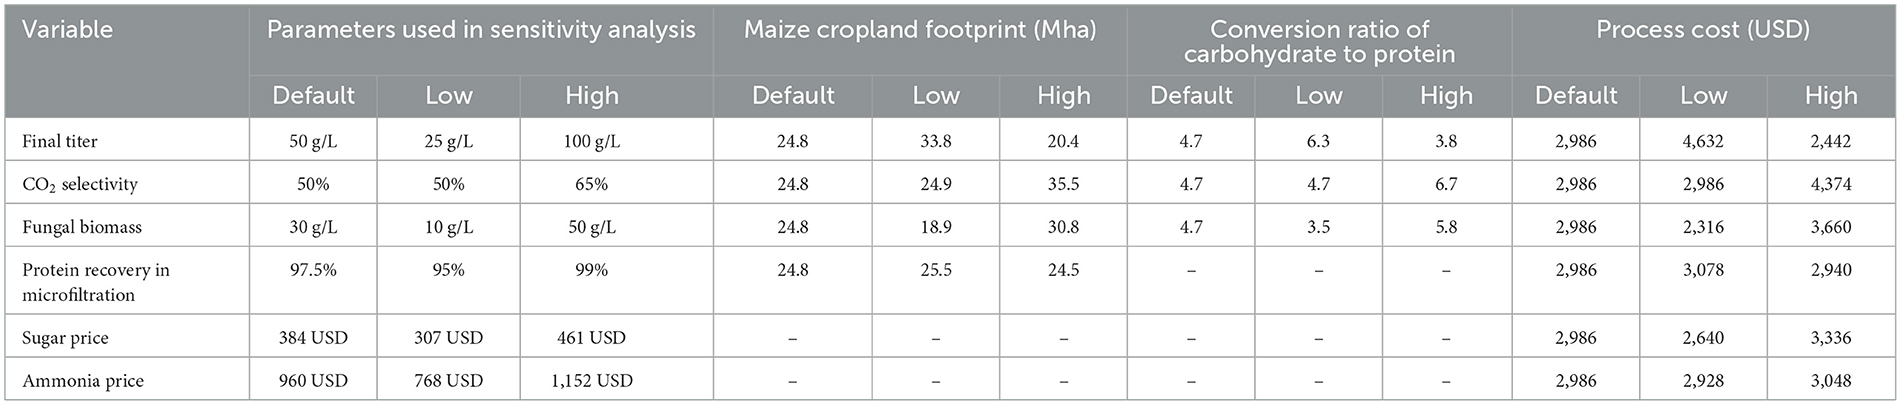
Table 5. Sensitivity of cropland footprint, carbohydrate to protein conversion ratio, and process cost to variations in selected model parameters.
We did not include the sensitivity of nutrient supply due to reallocated crops as these were negligible in the default scenario. Fermentation time was also omitted from the sensitivity analysis as this only affects the number of fermenters required to achieve the target production. In this respect, overall cycle time (fermentation time and turnaround time) is more relevant, but not captured in this model.
Of the outputs analyzed, the cropland footprint was most sensitive to the fungal biomass, CO2 selectivity, and final titer parameters (up to 43% increase or 24% decrease in cropland estimate possible using the variations in Table 5). These parameters also had the greatest impact on the conversion ratio of carbohydrate to protein (up to 43% increase or 26% decrease). Cost was also sensitive to these parameters (up to 55% increase or 22% decrease), and to a lesser degree to changes in the sugar price (±12%). Protein recovery rates and ammonia price made a maximum 3% difference to all output estimates.
In this paper, we have extended previous work to include the inputs, outputs, resource footprints and nutritional implications of FPP production at scale. This involved the inclusion of cropland footprints for various feedstocks, the impact on global nutrient supply, and contextualizing resource use, economic costs, and emissions of large-scale FPP production. By developing an interactive tool to make these analyses accessible to all, we hope to stimulate greater dissemination and understanding of the utility and implications of FPP among technologists and policy makers.
Our analysis describes a scenario in which FPP is used to produce protein equivalent to an additional 10% of 2020 global protein supply. Achieving this target required an increase or reallocation of 10–25 million hectares of cropland to provide feedstock for the fermentation, up to 1% of 2020 global electricity generation, would produce 159 million tons CO2e annually, and have a minimum process input cost of 53.77 billion USD per year (2,986 USD per ton protein). Beyond increasing protein and amino acid supply, meeting this target would have a minor impact on net nutrient supply.
The core goal of FPP production at scale is to provide a more sustainable protein supply. Previous work established that, with some variation based on location of production, the environmental impacts of FPP would likely be comparable to conventional production of WPI (Behm et al., 2022). Economically, we find that the consumables involved in FPP production would amount to 2,986 USD per ton. This should be seen as a lower bound, as it excludes costs related to capital, labor, cleaning, waste management, etc. There would also be further costs associated with incorporating the produced β-lac (a powder ingredient) into consumer foods, which could be achieved in diverse ways and as such was beyond the scope of this paper.
The sensitivity of the model to changes in the input parameters must also be acknowledged, and it is notable that process costs were the most sensitive. This is important, as the economic viability of FPP will be a key factor in deciding its ultimate place in the global food system and remains the topic of much debate (Tubb and Seba, 2019; Te Puna Whakaaronui, 2022; Good Food Institute, 2023). As FPP production increases over time, greater detail on as-yet uncertain parameters will allow for more precise estimates at the global scale, and for the inclusion of additional model outputs, such as area of land under facilities.
The implications of FPP for the social aspects of sustainability are more difficult to quantify. However, the implications for employment, value distribution, cultural traditions, and animal welfare should all be considered (FAO, 2018). Nutritionally, FPP can produce high quality protein, presumably nutritionally equal to purified protein powders available currently. However, a single protein is the sole product of this process, and would need to be combined with other materials and foods to form part of a complete diet.
Previous analyses have estimated a current global protein surplus (Smith et al., 2021; Lividini and Masters, 2022). However, ~800 million people were hungry in 2021, particularly in lower income economies, in part owing to low protein availability and affordability challenges (FAO, 2022; FAO et al., 2022). The potential for FPP production to address protein deficits, or cater to protein-replete consumers should be carefully investigated, from both an affordability and access perspective.
Perhaps more importantly, the extent of micronutrient deficiency is far greater and more widespread than insufficient protein intakes (Beal et al., 2017; Stevens et al., 2022). FPP will only address this challenge through combination with other materials and/or foods. By contrast, the use of fermentation to produce vitamins in shortfall for specific populations does have the potential to fill these gaps, and the technology is already widely used (Saubade et al., 2017; Calvillo et al., 2022; Rohner et al., 2023). Prioritization of fermentation technology development based on nutritional need would favor these applications over protein production.
Our analysis assumed that the feedstock for fermentation would require additional production or use reallocation of current food crops. It may be possible that alternative feedstocks may be used in the future, including simpler molecules than sugars, novel crops, or crop by-products (Lips, 2022; Zhang et al., 2022). These feedstocks are not ready for application at scale but may result in reduced footprints and costs for fermentation in the future.
We have focused on dairy proteins, and not the many other proteins that can be produced via fermentation, reflecting the availability of data and expertise. However, other proteins, particularly meat proteins, have received much recent attention. Recent publications have provided different estimates on the environmental impacts of “cultured meat” at scale (Derrick et al., 2023; Sinke et al., 2023), which reflects the challenges of obtaining accurate data for such an emerging technology in a competitive space. How meat proteins produced via mammalian cell culture will be converted into consumer-ready products (e.g., via combination with plant material) is also unclear, and would have a determining role in the environmental, economic, and nutritional implications of the food.
Also challenging to predict are the impact of factors like protein structure, solubility and biological function on the fermentation and post-fermentation processing. For example, proteins with anti-microbial effects, such as lactoferrin (Lu et al., 2021), will require quite different model parameters. Use of the model for proteins other than β-lac should be informed by experimental data on the fermenter performance and the operation of the downstream separation processes. Once the parameters for other proteins have been determined, it will be possible to incorporate them into the tool produced here.
FPP has been presented as a partial solution for the sustainability challenges faced by the global food system. Several studies with widely differing conclusions have now been published, particularly focusing on the environmental implications. However, sustainability also has economic and nutrition dimensions. Here, we have extended recently published research on the environmental impacts of FPP, and added cost and nutrition data and unified these aspects into an interactive online tool. Use of the tool by industry and policy stakeholders will allow visualization of the characteristics of FPP at scale, to guide thinking, discourse, and decision making on this technology.
The original contributions presented in the study are included in the article/Supplementary material, further inquiries can be directed to the corresponding author.
AF: Conceptualization, Data curation, Formal analysis, Methodology, Visualization, Writing – original draft, Writing – review & editing. NS: Conceptualization, Data curation, Formal analysis, Writing – original draft, Writing – review & editing. JH: Conceptualization, Supervision, Writing – review & editing. WM: Conceptualization, Supervision, Writing – review & editing.
The author(s) declare that no financial support was received for the research, authorship, and/or publication of this article.
The authors thank the other members of the Sustainable Nutrition Initiative® team for valuable feedback on the interactive application.
AF and JH are employees of Fonterra Cooperative Ltd. NS and WM are employees at the Riddet Institute, which has a research agreement with Fonterra Cooperative Ltd. All authors are involved in separate research projects funded by the dairy industry.
All claims expressed in this article are solely those of the authors and do not necessarily represent those of their affiliated organizations, or those of the publisher, the editors and the reviewers. Any product that may be evaluated in this article, or claim that may be made by its manufacturer, is not guaranteed or endorsed by the publisher.
The Supplementary Material for this article can be found online at: https://www.frontiersin.org/articles/10.3389/fsufs.2024.1419259/full#supplementary-material
Beal, T., Massiot, E., Arsenault, J. E., Smith, M. R., and Hijmans, R. J. (2017). Global trends in dietary micronutrient supplies and estimated prevalence of inadequate intakes. PLoS ONE 12:e0175554. doi: 10.1371/journal.pone.0175554
Behm, K., Nappa, M., Aro, N., Welman, A., Ledgard, S., Suomalainen, M., et al. (2022). Comparison of carbon footprint and water scarcity footprint of milk protein produced by cellular agriculture and the dairy industry. Int. J. Life Cycle Assess. 27, 1017–1034. doi: 10.1007/s11367-022-02087-0
Calvillo, Á., Pellicer, T., Carnicer, M., and Planas, A. (2022). Bioprocess strategies for vitamin B12 production by microbial fermentation and its market applications. Bioengineering 9:365. doi: 10.3390/bioengineering9080365
Derrick, R., Yoonbin, K., Cuong, N., Justin, B. S., and Edward, S. S. (2023). Environmental impacts of cultured meat: a cradle-to-gate life cycle assessment. bioRxiv. doi: 10.1101/2023.04.21.537778
Eagle, J. (2021). GEA Installs 'Second of its Kind' World's Largest Spray Dryer at Fonterra Milk Powder Plant. Crawley: Dairy Reporter.
FAO (1997). Technical Conversion Factors for Agricultural Commodities. Rome: FAO. Available online at: https://www.fao.org/3/cb2466t/cb2466t.pdf
FAO (2018). Sustainable Food SYSTEMS: Concept and framework. Rome: FAO. Available online at: www.fao.org/3/ca2079en/CA2079EN.pdf
FAO (2020). Emissions Due to Agriculture. Global, Regional and Country Trends 2000–2018. Rome: FAO. Available online at: https://www.fao.org/3/cb3808en/cb3808en.pdf
FAO (2021). FAO Supply Utilization Accounts. United Nations Food and Agriculture Organization. Available online at: http://www.fao.org/faostat/en/#data/SP (accessed March 3, 2021).
FAO (2022). World Food and Agriculture – Statistical Yearbook 2022. Rome: FAO. Available online at: https://www.fao.org/documents/card/en/c/cc2211en
FAO (2023). FAO Food Balance Sheets. United Nations Food and Agriculture Organization. Available online at: http://www.fao.org/faostat/en/#data/FBSH (accessed February 16, 2023).
FAO IFAD, UNICEF, WFP, and WHO. (2022). The State of Food Security and Nutrition in the World 2022. Repurposing Food and Agricultural Policies to Make Healthy Diets More Affordable. Rome: FAO.
Good Food Institute (2023). 2022 State of the Industry Report. Fermentation: Meat, Seafood, Eggs, and Dairy. Washington, DC. Available online at: https://gfi.org/wp-content/uploads/2023/01/2022-Fermentation-State-of-the-Industry-Report-1.pdf
High Level Expert Forum (2009). How to Feed the World in 2050. Rome: Food and Agriculture Organization.
Index Mundi (2023). Sugar Monthly Price. Available online at: https://www.indexmundi.com/commodities/?commodity=sugar&months=60¤cy=nzd (accessed November 2, 2023).
Järviö, N., Parviainen, T., Maljanen, N.-L., Kobayashi, Y., Kujanpää, L., Ercili-Cura, D., et al. (2021). Ovalbumin production using Trichoderma reesei culture and low-carbon energy could mitigate the environmental impacts of chicken-egg-derived ovalbumin. Nat. Food 2, 1005–1013. doi: 10.1038/s43016-021-00418-2
Lips, D. (2022). Fuelling the future of sustainable sugar fermentation across generations. Eng. Biol. 6, 3–16. doi: 10.1049/enb2.12017
Lividini, K., and Masters, W. A. (2022). Tracing global flows of bioactive compounds from farm to fork in nutrient balance sheets can help guide intervention towards healthier food supplies. Nat. Food 3, 703–715. doi: 10.1038/s43016-022-00585-w
Lu, J., Francis, J. D., Guevara, M. A., Moore, R. E., Chambers, S. A., Doster, R. S., et al. (2021). Antibacterial and anti-biofilm activity of the human breast milk glycoprotein Lactoferrin against group B Streptococcus. Chembiochem 22, 2124–2133. doi: 10.1002/cbic.202100016
MBIE (2023). Energy prices. Wellington: Ministry of Business, Innovation & Employment. Available: https://www.mbie.govt.nz/building-and-energy/energy-and-natural-resources/energy-statistics-and-modelling/energy-statistics/energy-prices/ (accessed November 2, 2023).
Moughan, P. J. (2021). Population protein intakes and food sustainability indices: the metrics matter. Glob. Food Sec. 29:100548. doi: 10.1016/j.gfs.2021.100548
Perfect Day and WSP (2021). Comparative Life Cycle Assessment of Perfect Day Whey Protein Production to Dairy Protein. Portland, OR.
Ritchie, H., Rosado, P., and Roser, M. (2020). Greenhouse Gas Emissions. Available online at: https://ourworldindata.org/greenhouse-gas-emissions (accessed November 2023).
Rohner, F., Wirth, J. P., Zeng, W., Petry, N., Donkor, W. E. S., Neufeld, L. M., et al. (2023). Global coverage of mandatory large-scale food fortification programs: a systematic review and meta-analysis. Adv. Nutr. 14, 1197–1210. doi: 10.1016/j.advnut.2023.07.004
Saubade, F., Hemery, Y. M., Guyot, J.-P., and Humblot, C. (2017). Lactic acid fermentation as a tool for increasing the folate content of foods. Crit. Rev. Food Sci. Nutr. 57, 3894–3910. doi: 10.1080/10408398.2016.1192986
Sinke, P., Swartz, E., Sanctorum, H., Van Der Giesen, C., and Odegard, I. (2023). Ex-ante life cycle assessment of commercial-scale cultivated meat production in 2030. Int. J. Life Cycle Assess. 28, 234–254. doi: 10.1007/s11367-022-02128-8
Smith, N. W., Fletcher, A. J., Dave, L. A., Hill, J. P., and Mcnabb, W. C. (2021). Use of the DELTA model to understand the food system and global nutrition. J. Nutr. 151, 3253–3261. doi: 10.1093/jn/nxab199
Smith, N. W., Fletcher, A. J., Millard, P., Hill, J. P., and Mcnabb, W. C. (2022). Estimating cropland requirements for global food system scenario modeling. Front. Sustain. Food Syst. 6:1063419. doi: 10.3389/fsufs.2022.1063419
Stevens, G. A., Beal, T., Mbuya, M. N. N., Luo, H., Neufeld, L. M., Addo, O. Y., et al. (2022). Micronutrient deficiencies among preschool-aged children and women of reproductive age worldwide: a pooled analysis of individual-level data from population-representative surveys. Lancet Global Health 10, e1590–e1599. doi: 10.1016/S2214-109X(22)00367-9
Te Puna Whakaaronui (2022). WELL_NZ: Alternative Protein 2022 – Establishing a Fact-Base. Wellington.
Tubb, C., and Seba, T. (2019). Rethinking Food and Agriculture 2020-2030. London. Available online at: https://static1.squarespace.com/static/585c3439be65942f022bbf9b/t/5d7fe0e83d119516bfc0017e/1568661791363/RethinkX+Food+and+Agriculture+Report.pdf
Watercare (2022). Commercial Water Services and Wastewater Charges and IGC. Auckland. Available online at: https://wslpwstoreprd.blob.core.windows.net/kentico-media-libraries-prod/watercarepublicweb/media/watercare-media-library/fees-charges/non_domestic_charges_2022_2023.pdf
World Nuclear Association (2022). Carbon Dioxide Emissions From ElectricityWorld Nuclear Association. Available online at: https://www.world-nuclear.org/information-library/energy-and-the-environment/carbon-dioxide-emissions-from-electricity.aspx (accessed November 23, 2023).
Keywords: alternative proteins, life cycle assessment, food security, human nutrition, novel proteins
Citation: Fletcher AJ, Smith NW, Hill JP and McNabb WC (2024) Modeling the feasibility of fermentation-produced protein at a globally relevant scale. Front. Sustain. Food Syst. 8:1419259. doi: 10.3389/fsufs.2024.1419259
Received: 25 April 2024; Accepted: 24 June 2024;
Published: 10 July 2024.
Edited by:
Pankaj B. Pathare, Sultan Qaboos University, OmanReviewed by:
Wayne Martindale, University of Lincoln, United KingdomCopyright © 2024 Fletcher, Smith, Hill and McNabb. This is an open-access article distributed under the terms of the Creative Commons Attribution License (CC BY). The use, distribution or reproduction in other forums is permitted, provided the original author(s) and the copyright owner(s) are credited and that the original publication in this journal is cited, in accordance with accepted academic practice. No use, distribution or reproduction is permitted which does not comply with these terms.
*Correspondence: Nick W. Smith, bi53LnNtaXRoQG1hc3NleS5hYy5ueg==
Disclaimer: All claims expressed in this article are solely those of the authors and do not necessarily represent those of their affiliated organizations, or those of the publisher, the editors and the reviewers. Any product that may be evaluated in this article or claim that may be made by its manufacturer is not guaranteed or endorsed by the publisher.
Research integrity at Frontiers
Learn more about the work of our research integrity team to safeguard the quality of each article we publish.