- 1School of Business, Xiamen Institute of Technology, Xiamen, China
- 2School of Economics, Fujian Normal University, Fuzhou, China
Introduction: Food security is a common livelihood issue that has received much attention from countries all over the world. Thus, researching the impact of COVID-19 on eradicating hunger, achieving food security, and improving nutrition can provide experiences for effectively responding to future emergencies that may affect food security.
Research and methods: Previous studies on the impact of COVID-19 on food security are less concerned with its impact on improving nutrition, therefore, this paper opens the black box of the process of eliminating hunger, reaching food security and improving nutrition, and divides it into the agricultural production sub-stage and the elimination of hunger and improvement of nutritional sustainability sub-stage. On the other hand, most of the past studies are based on impact pathway analysis only, and lack the assessment of the degree of impact from a quantitative perspective. Therefore, this paper takes the data of 29 provinces in China from 2016 to 2020 as the object of the study to measure their total and sub-stage efficiencies in the process of eradicating hunger, reaching food security, and improving nutrition, and to explore the characteristics of their spatial distributions. Meanwhile, the focus is concentrated on the 2019–2020 window to explore the impact of COVID-19.
Result and discussion: Based on research findings, this paper puts forward policy recommendations such as establishing a sound natural disaster prevention and control mechanism and accelerating agricultural technological innovation in order to better reduce the negative impact of food security emergencies in the future.
1 Introduction
According to the 2023 State of Food Security and Nutrition in the World report, there are currently about 735 million hungry people in the world, an increase of 122 million compared to before the outbreak of COVID-19 in 2019 (World Health Organization, 2023). There is a lot of evidence that major global emergencies such as COVID-19, extreme weather events, and the conflict in Ukraine will pose a major threat to the achievement of Sustainable Development Goal 2 (SDG2) of “Zero Hunger.” Taking COVID-19 as an example, it is estimated that the number of hungry people will increase by nearly 90 million in 2019–2020 alone. Moreover, the impact of such major emergencies on food security and improved nutrition is more serious in developing countries, with the proportion of hungry people in Africa approaching 20%, Asia 8.5%, and Latin America and the Caribbean 6.5% (World Health Organization, 2023). Therefore, how to recover from COVID-19 as soon as possible, reduce poverty and hunger, and achieve food security has become an important issue that has attracted close attention from the international community.
According to the definition of the United Nations World Food Security Committee, food security means that all people have physical, social and economic access to sufficient, safe and nutritious food at all times to meet their food preferences, eating habits and the needs of an active and healthy life. Global food security depends on the normal operation of the global food and agricultural supply system. The impact of COVID-19 on the global food supply chain is mainly through the following three channels. At the production level, anti-epidemic measures have restricted the flow of workers in the food and agricultural industry, exacerbated the shortage of agricultural labor, and made it difficult to purchase agricultural inputs needed for food production, resulting in production obstructions and affecting food production. At the circulation level, COVID-19 affects the circulation of food, especially the circulation of international food and agricultural trade, which has hit the enthusiasm of market players to participate in international trade and led to a reduction in trade and investment (Pavolova et al., 2021; Akbari et al., 2021); at the same time, the food export restrictions of some food exporting countries such as Russia and Belarus have caused sharp fluctuations in international food prices, disrupting the global food supply chain (Alpizar et al., 2011; Fukase and Martin, 2016). On the consumer side, under the influence of Covid-19, the world economic growth rate has dropped sharply and fallen into recession. The restrictions on the flow of people taken by various countries have caused the economy to stop, and production and work cannot be resumed quickly, resulting in reduced income, which affects the ability of vulnerable groups to obtain food (Balgah et al., 2023; Huang et al., 2023; Jin et al., 2022). From the above analysis, it can be seen that countries exhibited uneven levels of food security even before the outbreak of COVID-19, and that under the impact of COVID-19, any disruption in production, distribution, and consumption would lead to a break in a country’s food supply chain.
Thus, safeguarding food production, effectively saving food and reducing losses, and upgrading the capacity of food reserves and management are very important for coping with the impact on food security of various emergencies such as COVID-19 (Hou et al., 2022; Kelsall et al., 2023; Lu et al., 2023). The resilience of a country’s agri-food system is affected by climate conditions and natural resources, the level of agricultural science and technology and business models, agricultural support policies, public awareness of food security and other factors, and shows different resilience in response to shocks and pressures (Huang and Yang, 2017; Brown et al., 2017; Wang et al., 2018). Faced with an extremely unstable world food supply, as the world’s largest food producer, China uses less than 9% of the world’s arable land to produce about 1/4 of the world’s food, solving the problem of feeding 1/5 of the world’s population and making positive contributions to addressing global food security issues. In terms of improving nutrition, the nutritional level of Chinese residents has significantly improved, and the consumption structure has also changed significantly. The consumption of staple foods such as rice and wheat has gradually decreased, while the consumption of meat, poultry, eggs, milk and other animal foods has increased significantly (Patel and Shrimali, 2023; Qin et al., 2022). In response to major natural disasters and public safety incidents such as COVID-19, China has established a complete emergency reserve system in large and medium-sized cities and areas where prices are prone to fluctuate, which can provide 10–15 days of emergency supply. All of the above shows that China has rich theoretical and practical experience in eliminating hunger, achieving food security and improving nutrition (Zivin et al., 2020; Yang, 2022). Research on relevant data in China will hopefully provide reference for developing countries.
Based on the above analyses, this paper explores the relationship between the stages of agricultural production and the sub-stages of hunger eradication, achieving food security, and improving nutrition in China and answers the following questions: (1) How to assess the efficiency of the process of agricultural production, hunger eradication, achieving food security, and improving nutrition? (2) To what extent does COVID-19 impact this process? (3) How can the efficiency of agricultural production be effectively improved to better contribute to eradicating hunger, achieving food security, and improving nutrition?
To address the above questions, this paper establishes the Entropy Window two-stage DDF model, divides the 2016–2020 period into window sub-periods of 2 years, measures the overall efficiency value of the process of eradicating hunger, achieving food security, and improving nutrition in the agricultural production of 29 provinces in China in each window and the efficiency value of the sub-stages, and conducts comparative analyses by stage, by region, and by province. The impacts of COVID-19 on hunger eradication, achieving food security, and improving nutrition are further explored based on the epidemic’s 2019–2020 window. From an objective and comprehensive understanding of the current situation of China’s food security, this paper offers targeted policy recommendations for the nation to ensure food security, improve agricultural production, eradicate hunger, and improve nutrition.
The rest of the paper runs as follows. Section 2 surveys the relevant literature on food security and presents the innovations of the paper. Section 3 describes the modeling process and the sources and methods of dataset creation. Section 4 provides an empirical analysis based on the results of the Entropy Window two-stage DDF model and explores in depth the impact of COVID-19 on eradicating hunger, reaching food security, and improving nutrition. Section 5 presents relevant policy recommendations.
2 Literature review
The concept of food security was first introduced by the Food and Agriculture Organization of the United Nations (FAO) at the World Food Conference held in Rome in 1974. Subsequently, the connotation of the concept has been enriched continuously, and research related to food security has also been deepened. Many scholars have focused on three main aspects of food security as follows.
Factors influencing food security. The literature on factors influencing food security mostly focuses on the status of natural resource endowment such as moisture, arable land, and light, as well as the status of human resources such as labor force and technology level. Abbas et al. (2023), Wu et al. (2023), and Amadou et al. (2021) examined the effects of climate change, the level of intensive land use, and digital technology on food security, respectively. Vochozka et al. (2020a, 2020b), on the other hand, pointed out that changes in the price of fossil fuels will also have an impact on the price of food, leading to food insecurity. Tang et al. (2015) conducted an empirical analysis based on China’s macroeconomic data for 1978–2013, and the results showed that agricultural mechanization, fertilizer, efficient irrigation, and food policy are important factors in reaching food security, while the role of per capita sown area of grain has been decreasing year by year. Some scholars have also analyzed the impact of major emergencies on food security. For example, Lialina and Morachevskaya (2022) argued that the impact of COVID-19 on food security manifested itself in a decline in people’s income and an increase in food price.
Food security evaluation. Many scholars have used hierarchical analysis, entropy weight TOPSIS model, data envelopment analysis (DEA), and other methods for assessment of food security evaluation, among which the DEA method is the more commonly used method by many scholars. For example, Hu et al. (2021) used a three-stage DEA model to assess the efficiency of China’s main grain producing areas for 2007–2019 after removing environmental factors and random variables; Fu et al. (2021) applied a DEA model to assess China’s food security from the perspective of trade and concluded that the status quo of its heavy dependence on the international market for soybeans may bring a crisis to its food security. Gokhan and Shannon (2019) evaluated the food security of states in the United States over a 13-year period based on the DEA-Malmquist model and concluded that food security was improving during that time.
Risks and challenges to food security and measures to address them. Some scholars considered the changes in supply and demand brought about by declining yields and rising food prices in the international food market, the uncertainty of policies in various countries, and the high concentration of food exports and low concentration of imports as risk challenges to reach food security (Zhang et al., 2014; Zhang et al., 2022; Zhong et al., 2018). They then proposed countermeasures to these challenges. There are also scholars who focus on a specific type of challenge and propose corresponding solutions. For example, in improving agricultural science and technology, satellite forecasting can be used to detect crops (Tanaka et al., 2023), the role of big data and algorithms in predicting food prices can be utilized (Valaskova et al., 2024; Kliestik et al., 2024), and the use of AI in agricultural production can be increased (Kliestik et al., 2023; Dvorský et al., 2023). In terms of improving the environment for agricultural production, soil fertility can be restored through biochar (Maroušek, 2014; Maroušek et al., 2017). Based on the coupling of the three systems of energy-water-food, De Laurentiis et al. (2016) proposed that achieving sustainable agricultural development, reducing food losses at all stages of production, and forming dietary habits that conserve food and reduce wastage are effective measures to cope with food risks.
The above literature has studied food security based on different perspectives and methods, which is an important reference value for understanding the current situation of food security and constructing a food security evaluation system, but there are still some issues that need to be further explored. First, when assessing food security, the literature is mostly based on food supply security, while the assessment of nutritional supply is missing. Sajjad (2017) proposed sood security at the nutritional level is more of a health concern than at the yield level, and the lack of nutritional supply will lead to increased malnutrition rates. Second, the literature is mostly based on a static perspective to assess the current situation of food security in China, and it is difficult to conduct in-depth analyses of the characteristics of its temporal and spatial changes. Third, more scholars have analyzed the path of the COVID-19 epidemic’s impact on food security, but fewer have quantitatively analyzed the extent of its impact based on mathematical models. Therefore, this paper also incorporates the measure of improved nutrition into the evaluation system, subdividing reaching food security into two sub-stages of agricultural production stage and eradicating hunger and improving nutrition sustainable development stage. It uses the window analysis method, assesses the dynamic evolution perspective, and examines in-depth the extent of COVID-19’s impact on eradicating hunger, reaching food security, and improving nutrition, in order to better examine the global perspective of the efficiency value changes and to more deeply delineate the temporal trends in food security levels.
3 Research methods
In order to better assess efficiency from a dynamic perspective, this paper combines the data envelopment analysis (DEA) model framework with Charnes et al. (1985) window analysis and Shannon (1948) entropy method to construct the Entropy Window Two-stage DDF model. Through the Entropy Window two-stage DDF model, an empirical study is conducted to investigate COVID-19’s impact on the development efficiency of eradicating hunger, achieving food security, and improving nutrition (Stage 2) in 29 provinces of China. In the following, the Entropy method is introduced first, and then the Entropy Window two-stage DDF model is built, which is described as follows.
3.1 The entropy method
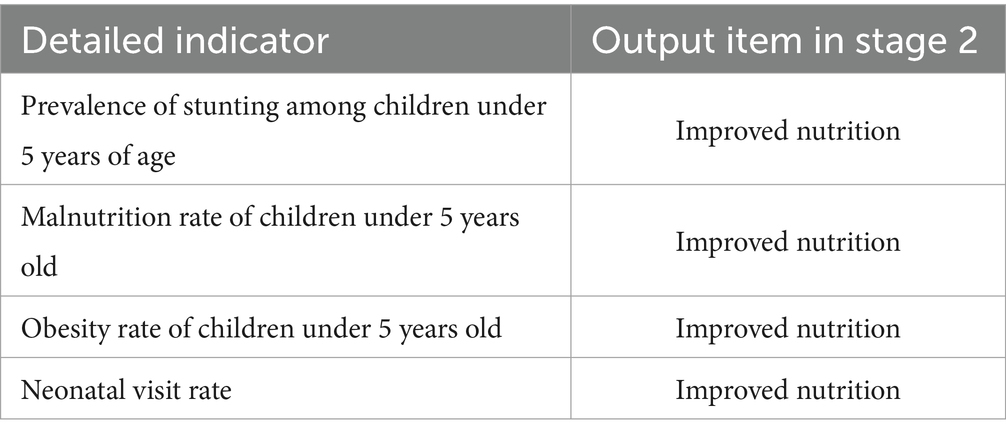
The improvement in nutrition is reflected in the following four aspects: (1) the incidence of stunting in children under 5 years of age, (2) the incidence of malnutrition in children under 5 years of age, (3) the incidence of obesity in children under 5 years of age, and (4) the incidence of neonatal visits. If these parallel indexes are put into the DEA model, there will be no solution problem. Therefore, the entropy method of Shannon (1948) was adopted in this model to fit the above four indicators, and a comprehensive indicator of improved nutrition (IN) was obtained. These are shown in Table 1.
The Entropy method and steps are as follows.
Step 1: Data standardization. The following detailed indicator variables in the outputs of Stage 2 are calculated by Equation 1: (1) stunting rate of children under 5 years of age, (2) malnutrition rate of children under 5 years of age, (3) obesity rate of children under 5 years of age, and (4) neonatal visit rate for the 29 provinces of China.
Here, is the standardized value of the nth indicator for the mth province; is the minimum value of the nth indicator for the mth province; and is the maximum value of the nth indicator for the mth province.
Step 2: Sum the standardized values for the detailed indicators in Stage-2 output items by Equation 2.
Here, denotes the ratio of the standardized value of the nth indicator to the sum of the standardized values for the m provinces.
Step 3: Calculate the entropy value of the nth indicator ( ) by Equation 3.
Step 4: Calculate the weight of the nth indicator ( ) by Equation 4.
Using the above steps, we find out the weights and output values of the detailed indicators in the output items of Stage 2: (1) Prevalence of stunting among children under 5 years of age, (2) malnutrition rate of children under 5 years of age, (3) obesity rate of children under 5 years of age, and (4) neonatal visit rate for the 29 provinces of China. Based on the above entropy method, the Window two-stage DDF model is introduced as Entropy Window two-stage DDF model, which is described as follows.
3.2 Entropy window two-stage DDF model
Suppose there are n DMUs (j = 1, …, n), which contain t time periods (t = 1, 2, …, T). In each of these period there are two distinct stages: the agricultural production stage and the hunger eradication and nutritional sustainability stage. We create T-d + 1 windows to measure the efficiency of each DMU, and each DMU gets d efficiency values in each window. Next, we use the moving average method to obtain the efficiency of DMUs in each period. For DMUi, the d efficiency value is measured in the first window starting from the time period t = 1 (t = 1, 2, …, T). We move to the second time period t = 2 and measure the d efficiency value in the second window, and so on, until we move to the T -d + 1 time period and measure the d efficiency value in the last window. Therefore, for each DMU, the efficiency of total factor production is determined by the tth time period (t = 1, 2 … d) in the mth [m = 1, 2 … (T-d + 1)] window.
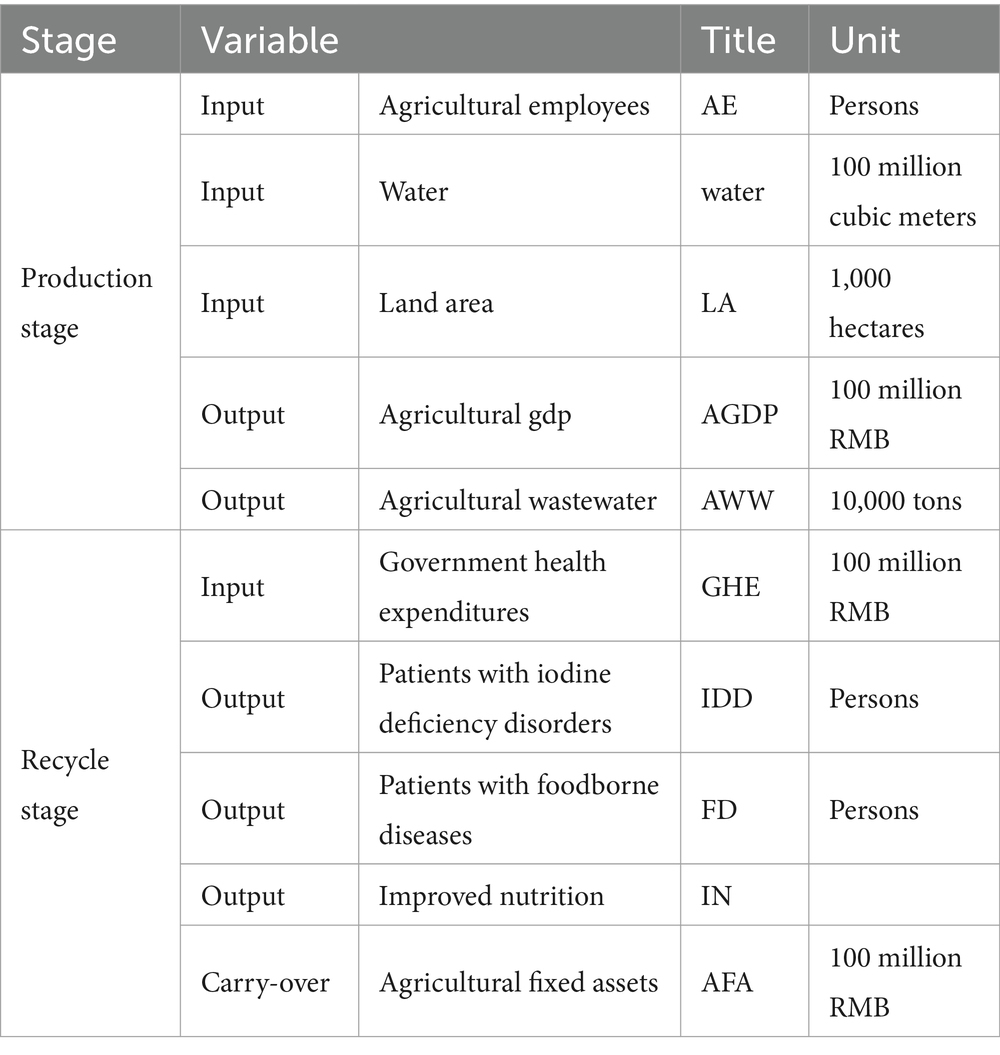
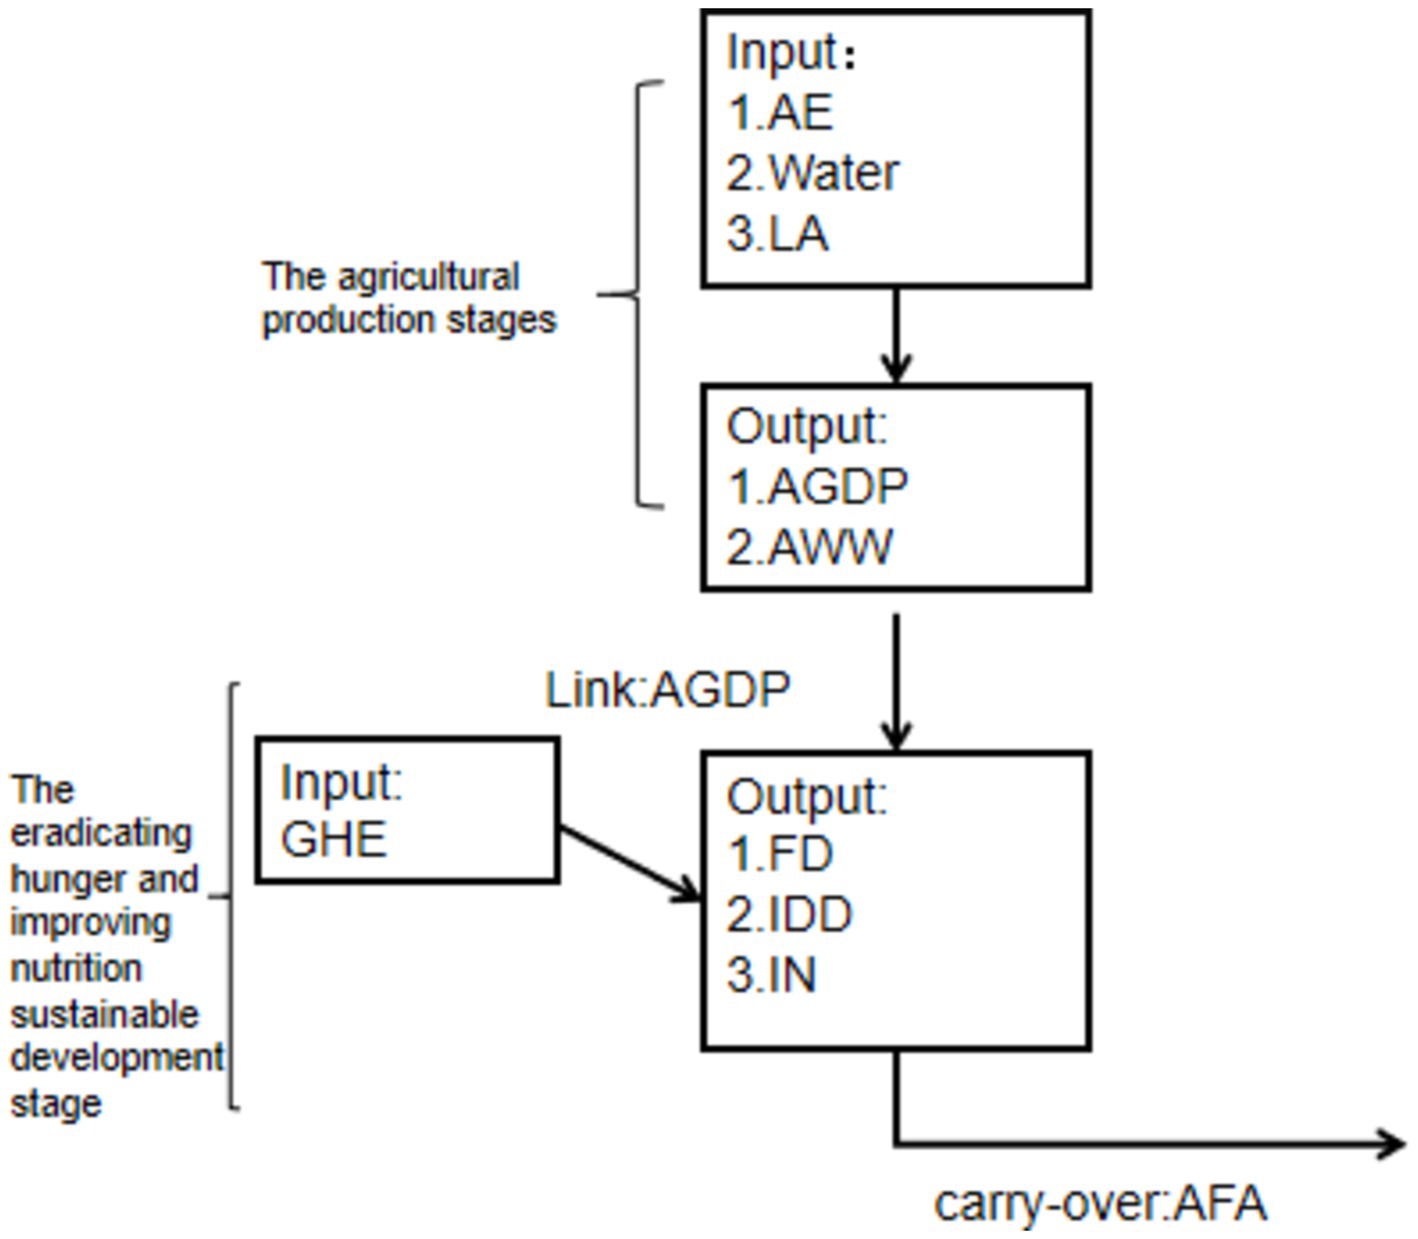
In the agricultural production stage there are I inputs that produce K good output and O bad outputs ; B inputs are used to create V good outputs ; and is the intermediate output, linking the agricultural production stage (Stage 1) and the hunger eradication and nutritional sustainability stage (Stage 2). The agricultural production stage (Stage 1) input variables are agricultural employees, land area, and water, while the output variables are good agricultural output (agricultural GDP) and bad agricultural output (wastewater). The hunger eradication and nutrition improvement stage (Stage 2) input variable is government health expenditure, while the output variables are patients with iodine deficiency disorders, patients with foodborne diseases, and improved nutrition. The link between Stage 1 and Stage 2 is the intermediate output of agricultural output.
Under the frontier, the DMU can choose the final output that is most favorable to its maximum value. Thus, the DMU’s efficiency under the common boundary can be solved by the following linear programming procedure.
Objective function:
The efficiency of DMUp is calculated by Equation 5 to be:
Subject to:
Agricultural production stage (Stage 1) is represented by Equation 6:
Intermediate output from Stage 1 to Stage 2 is represented by Equation 7:
Eradicating hunger and improving nutrition sustainable development stage (Stage 2) is represented by Equation 8:
Here, are stage 1 and stage 2 weights, respectively. From the above results, the overall efficiency, the period efficiency, the division efficiency, and division period efficiency are obtained.
3.3 Input–output indicators and indicator efficiency calculations
The gap between the actual input–output indicators of each DMU and the ideal input–output indicators under the optimal efficiency value represents its room for efficiency improvement from input and output orientation. This study chooses the ratio of the actual input–output value to the calculated optimal input–output value as the efficiency value of the input–output index. The relationship between the optimal value, the actual value, and the efficiency of the indicator is represented by the following Equations 9–11.
For inputs and bad outputs, if the actual inputs are greater than the optimal inputs, then the efficiency of the input indicator is less than 1 and is called non-efficient. If the actual inputs are equal to the optimal inputs, then the efficiency of the input and bad output indicators is equal to 1 and is called efficient. If the actual outputs are less than the optimal outputs, then the efficiency of the output indicator is less than 1 and is called non-efficient. If the actual outputs are equal to the optimal outputs, then the efficiency of the output indicator is equal to 1 and is called efficient. The indicator system and the framework diagram of this study are below. The data used in the study were obtained from the China Statistical Yearbook, China Health Statistical Yearbook, and China National Meteorological Science Data Center (Table 2 and Figure 1).
4 Empirical study
4.1 Data description and statistics analysis
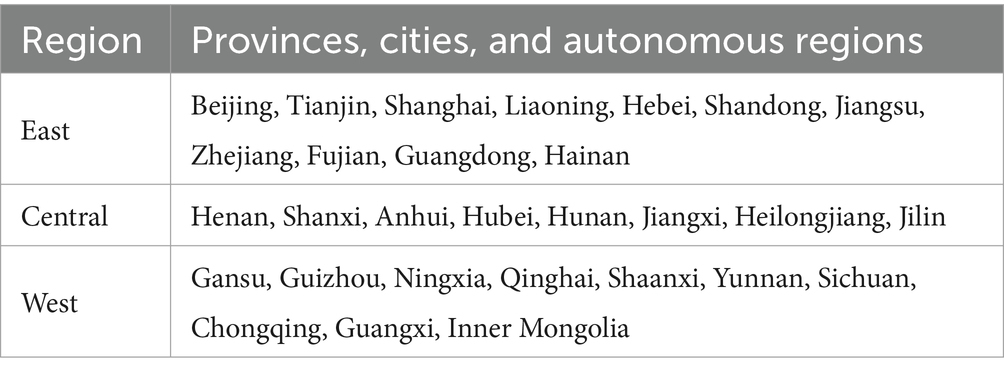
This study uses data from a provincial-level sample for 2016–2020. Due to the lack of data for some regions, 29 provinces, municipalities, and autonomous regions are selected for this study (Municipalities and autonomous regions are provincial administrative divisions with the same administrative status as provinces, please note that municipalities such as Beijing are hereafter referred to as provinces). The Seventh Five-Year Plan (The starting and ending period of the “Seventh Five-Year Plan” was 1986–1990. The Five-Year Plan, which started in 1953, is a five-year plan for short- and medium-term planning of the country, mainly for major construction projects, distribution of productive forces and important proportionality of the national economy, and setting goals for the development of the national economy), adopted at the Fourth Session of the Sixth National People’s Congress, divided the 30 provinces into east, central, and west regions. The per capita GDP of the Inner Mongolia Autonomous Region and the Guangxi Autonomous Region is comparable to that of the 10 western provinces. This means that Guangxi and Inner Mongolia belong to the west region. The regional divisions are shown in the table (Table 3).
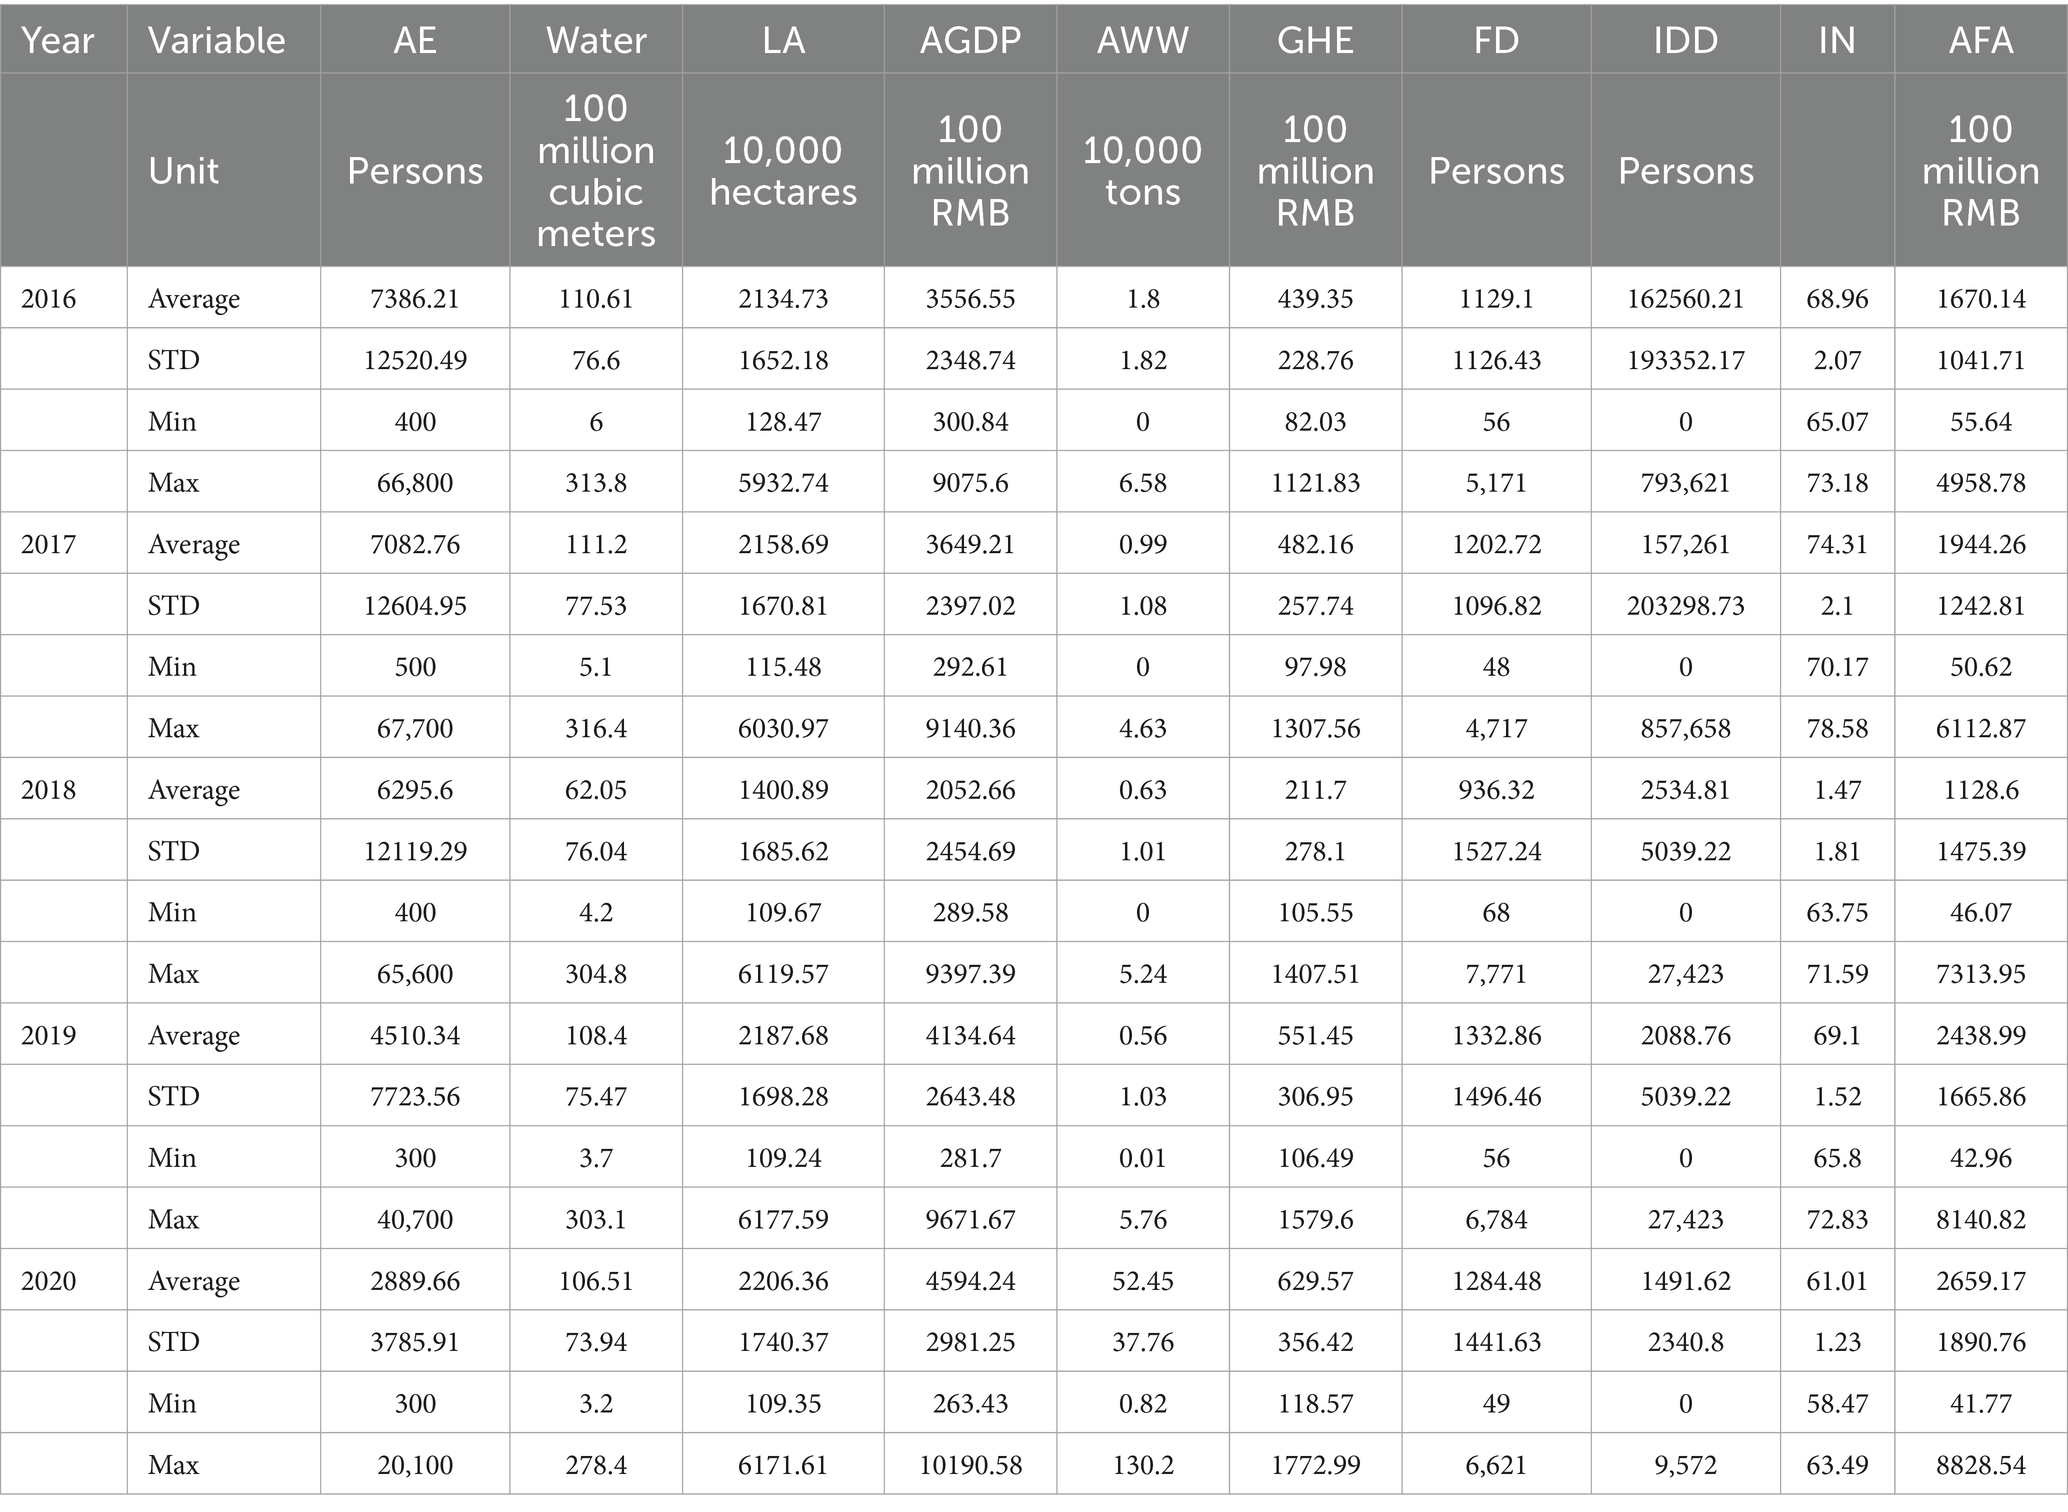
This study uses data on 10 input and output indicators from 2016 to 2017 for 29 provinces in China, which are available from the National Bureau of Statistics website and the China Environmental Statistics Yearbook. We calculate the mean, standard deviation, and minimum and maximum values, and the results are kept to two decimal places (Table 4).
4.2 Window data analysis
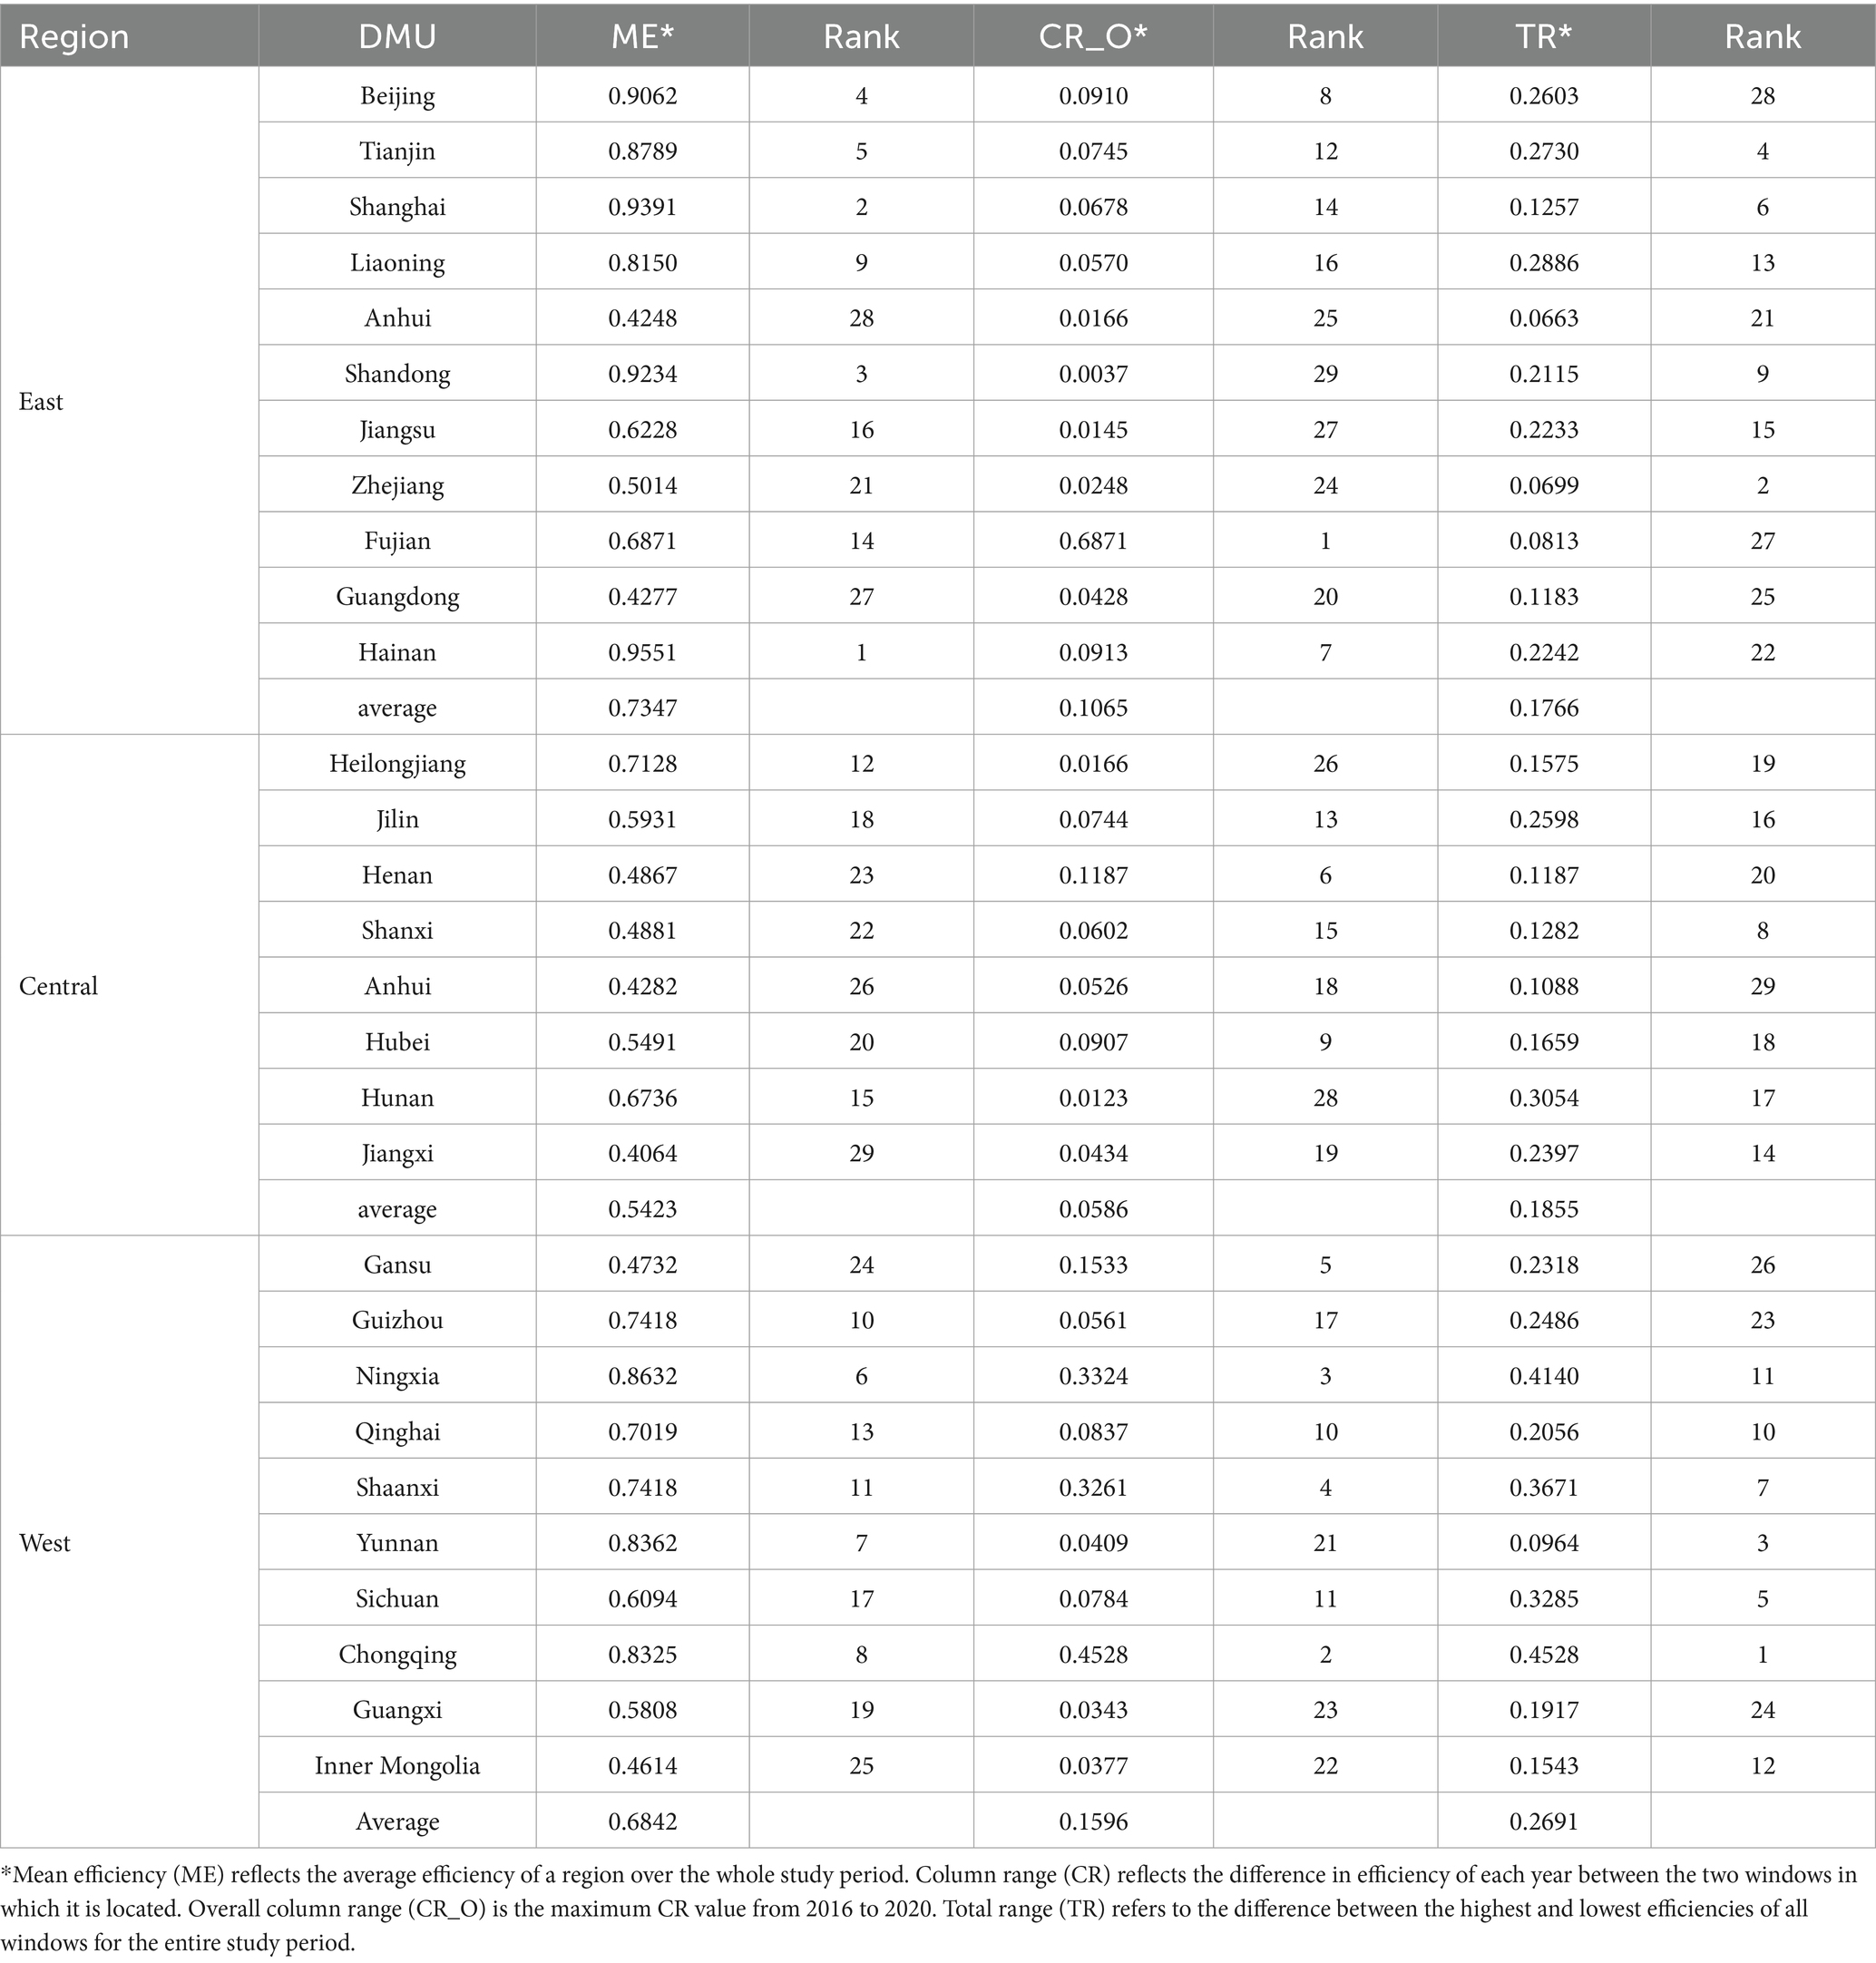
Referring to Chung et al. (2008), this paper analyzes a series of indicators for each DMU, which include ME, CR, CR_O, and TR. Among them, ME (mean efficiency) reflects the average efficiency of a region over the whole study period, and a higher value indicates higher efficiency. CR (column range) reflects the difference in efficiency of each year between the two windows in which it is located. CR_O (overall column range) is the maximum CR value from 2016 to 2020, which indicates the maximum change in efficiency between windows for different years and reflects the stability of efficiency. TR (total range) refers to the difference between the highest and lowest efficiencies of all windows for the entire study period (Table 5).
Taking Beijing as an example to show the calculation process of each indicator, as shown in the table, each 2 years are divided into a window: 2016 to 2017 (W1), 2017 to 2018 (W2), 2018 to 2019 (W3), and 2019 to 2020 (W4). The table reflects the efficiency value corresponding to each year in its window, as well as the ME, CR, CR_O, and TR indicators.
4.2.1 Overall analysis
4.2.1.1 Overall system efficiency analysis
The total efficiency is a comprehensive reflection of the efficiency of the two stages, reflecting the overall efficiency of the entire system from agricultural production inputs to the ultimate goal of eliminating hunger and improving nutrition. It measures whether resources are used effectively throughout the entire chain. In terms of efficiency level, as shown in Table 6, ME in the east region is 0.7347, ME in the central region is 0.5423, and ME in the west region is 0.6842, showing the east region is the best and the central regions is the worst. This may be due to the fact that the eastern region has a developed economy and a high degree of agricultural industrialization. At the same time, the eastern region is close to the consumer market, so there is less waste of resources from agricultural production to the ultimate goal of achieving food security and nutrition improvement, and the connection and transformation of each link are smoother.
Both CR_O and TR can reflect the stability of efficiency. CR_O in the east region is 0.1065, CR_O in the central region is 0.0586, and CR_O in the west region is 0.1596. The stability of efficiency in the central region is better than that in the east region and better than that in the west region. TR works similarly to CR_O, with smaller TR indicating better stability. However, since CR_O first compares different windows of the same year and then compares different years, the difference is relatively small; TR is used to compare all windows of all years, resulting in larger differences. TR for the east region is 0.1766, TR for the central region is 0.1855, and TR for the west region is 0.2691. Combining years and windows to assess stability, the east region is better than the central region and better than the west region. This means that there are differences and fluctuations in efficiency trends among different regions, and the reasons behind this need to be explored from two aspects: the agricultural production stage and the nutrition improvement stage.
4.2.1.2 Analysis of the agricultural production stages
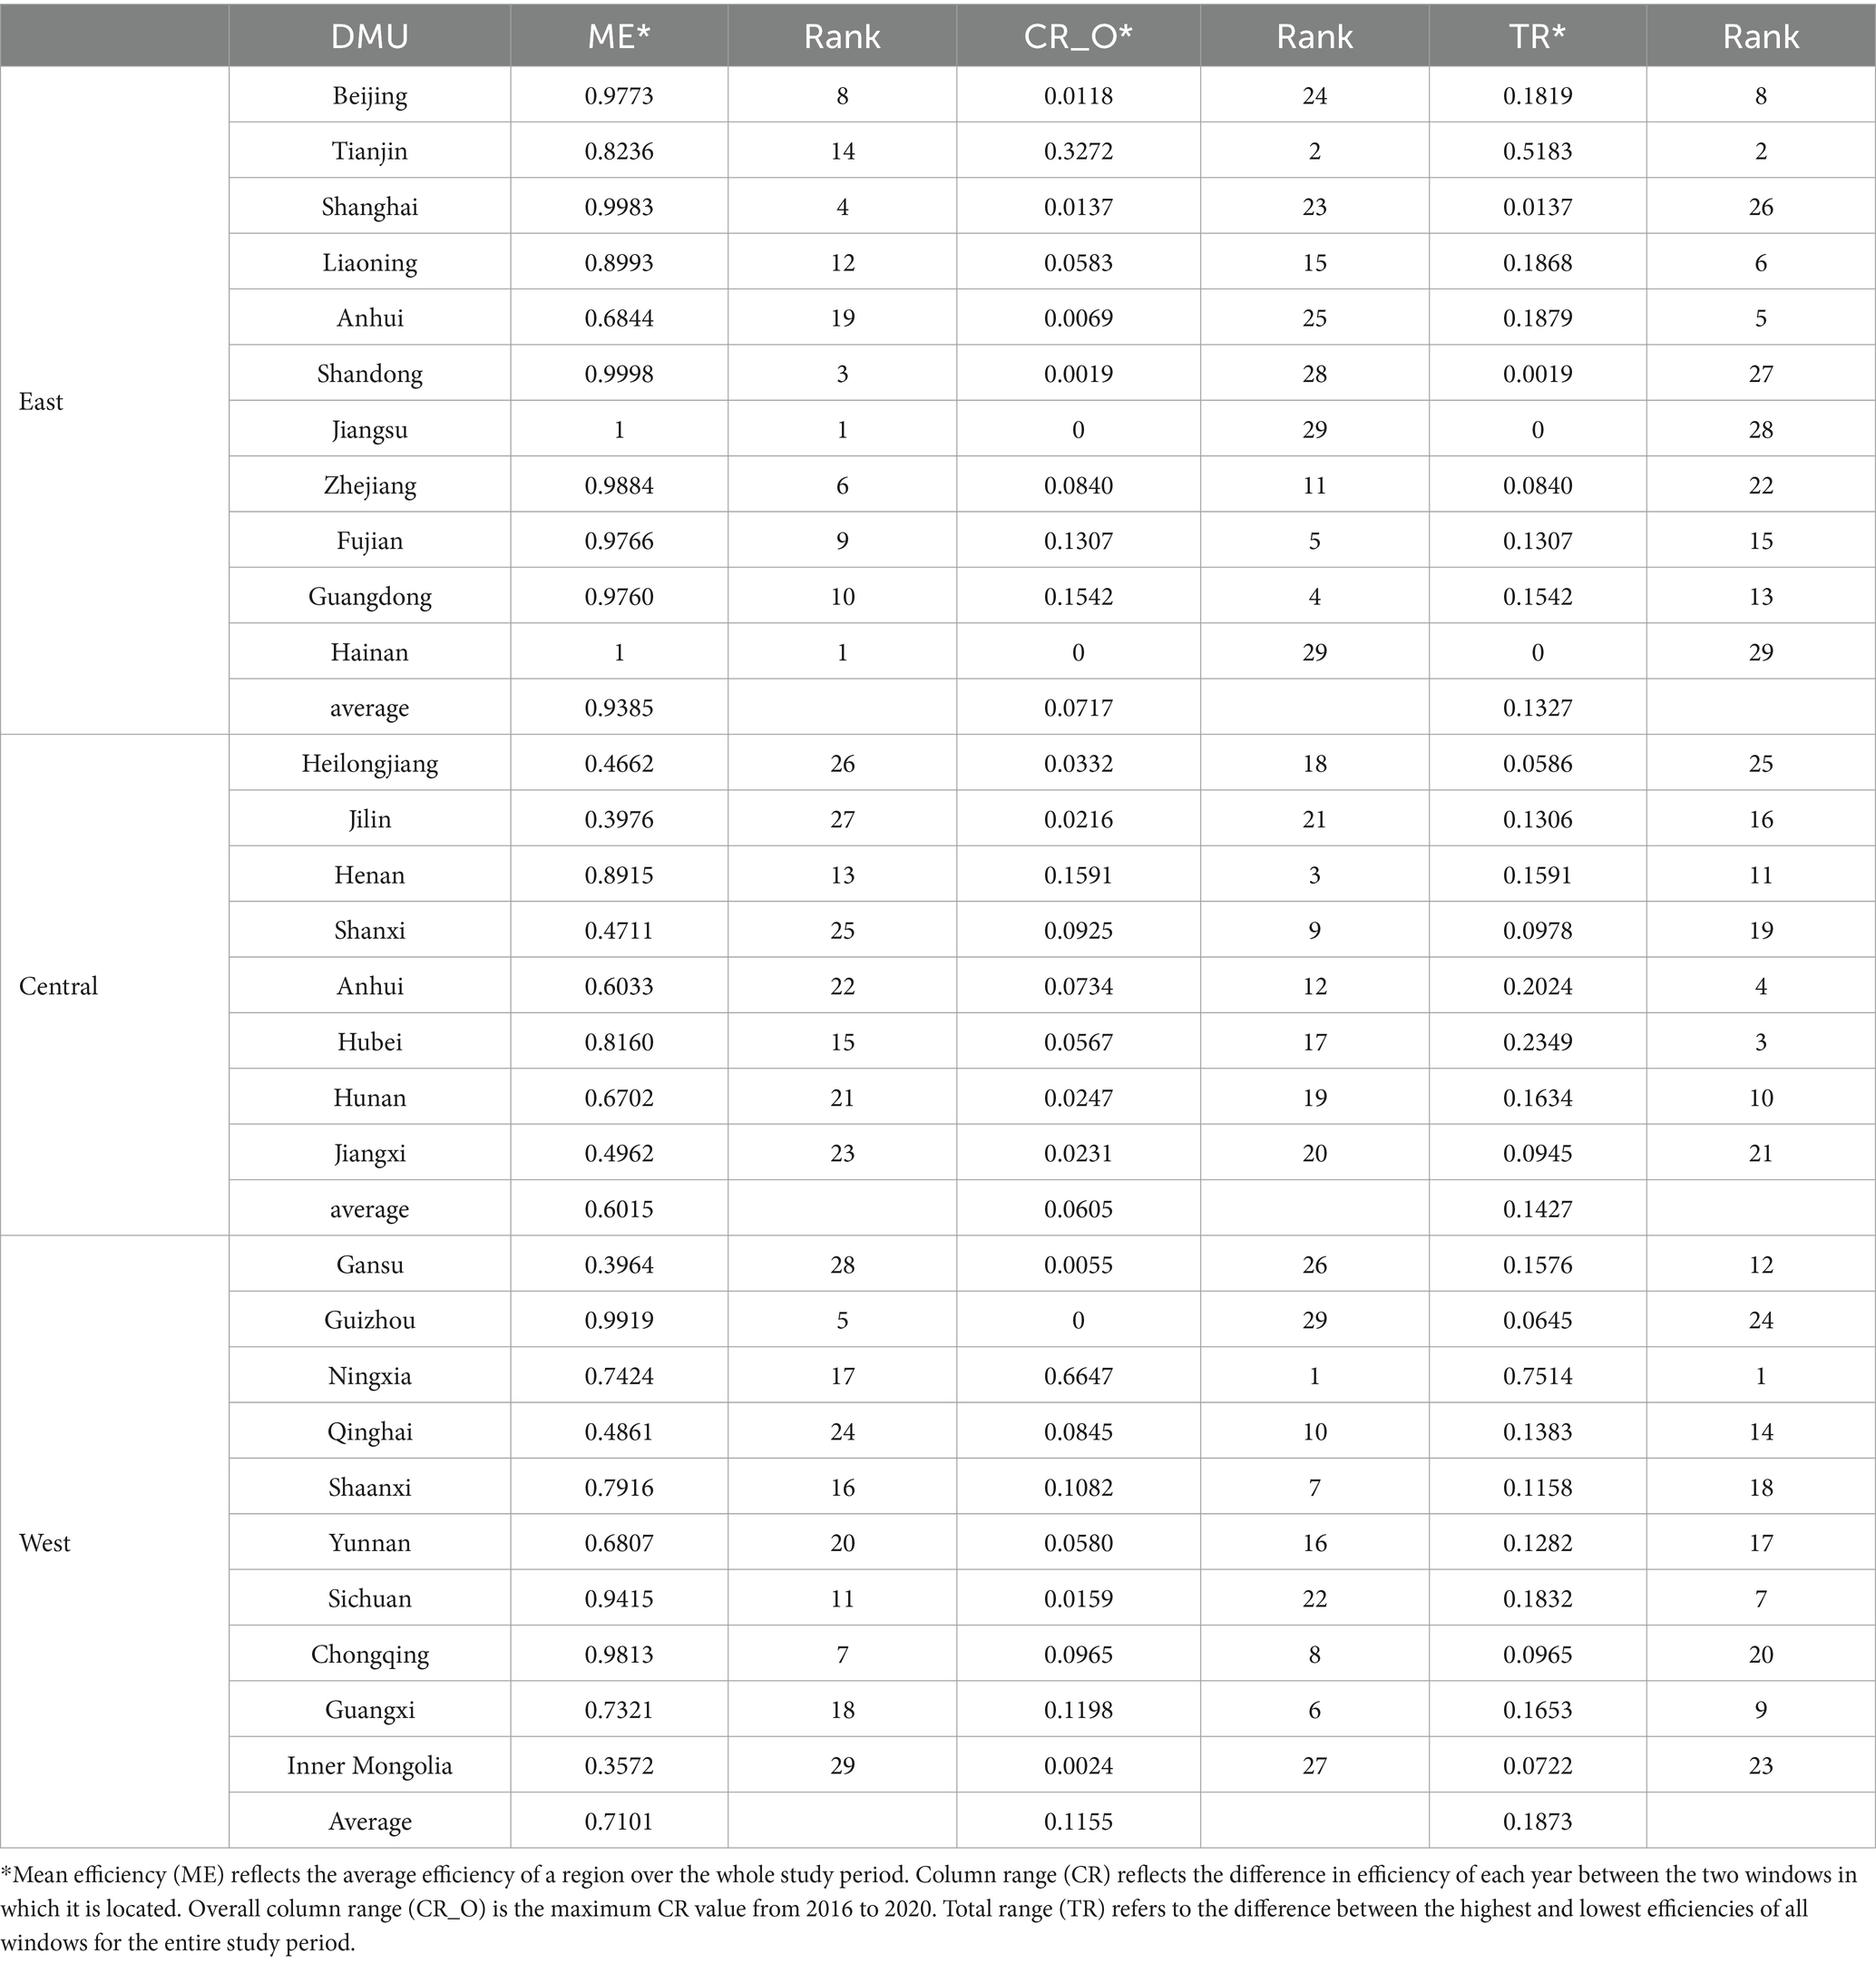
As shown in Table 7, in the agricultural production stage, ME in the east region is 0.9385, ME in the central region is 0.6015, and ME in the west region is 0.7101, with the east region being higher than the west region, and the central region being the worst. This may be due to the fact that the eastern region itself has a developed economy and has continued to invest in agricultural technology innovation and upgrading during this period, such as further improvement in agricultural mechanization and informatization. At the same time, the region has a complete agricultural industrial chain, which can quickly adapt to market changes and obtain higher production benefits. The average efficiency of the agricultural production stage in the western region is between the central and eastern regions, thanks to the support of national policies. Vigorously developing characteristic agriculture has played the comparative advantages of the western region and improved the efficiency of the agricultural production stage in the western region to a certain extent. However, the problems of poor natural environment, fragile ecological environment and relatively weak agricultural infrastructure in the western region have not been completely solved during this period, resulting in limited efficiency improvement. The average efficiency of the agricultural production stage in the central region is relatively low, which shows that the low efficiency of the agricultural production stage is one of the important reasons for its low overall efficiency. The possible reason is that during the inspection period, the growth of agricultural input in the central region was relatively slow, and some labor force flowed out, resulting in insufficient motivation for agricultural development.
In terms of stability, CR_O of the east region is 0.0717, CR_O of the central region is 0.0605, and CR_O of the west region is 0.1155; the TR value of the eastern region is 0.1327, the TR value of the central region is 0.1427, and the TR value of the western region is 0.1873. In general, the stability of the western region is weaker than that of the eastern and central regions. The reason is that although the eastern region is affected by market changes, it has a solid technical and management foundation and is stable. The agricultural production model in the central region is relatively traditional and mature, so its agricultural production efficiency shows a certain stability.
Therefore, improving the efficiency of the agricultural production stage is the key. Because high-efficiency agricultural production can increase agricultural product output, ensure supply, resist interference from external factors such as nature and the market, and improve the stability of agricultural production efficiency.
4.2.1.3 Analysis of the eradicating hunger and improving nutrition sustainable development stage
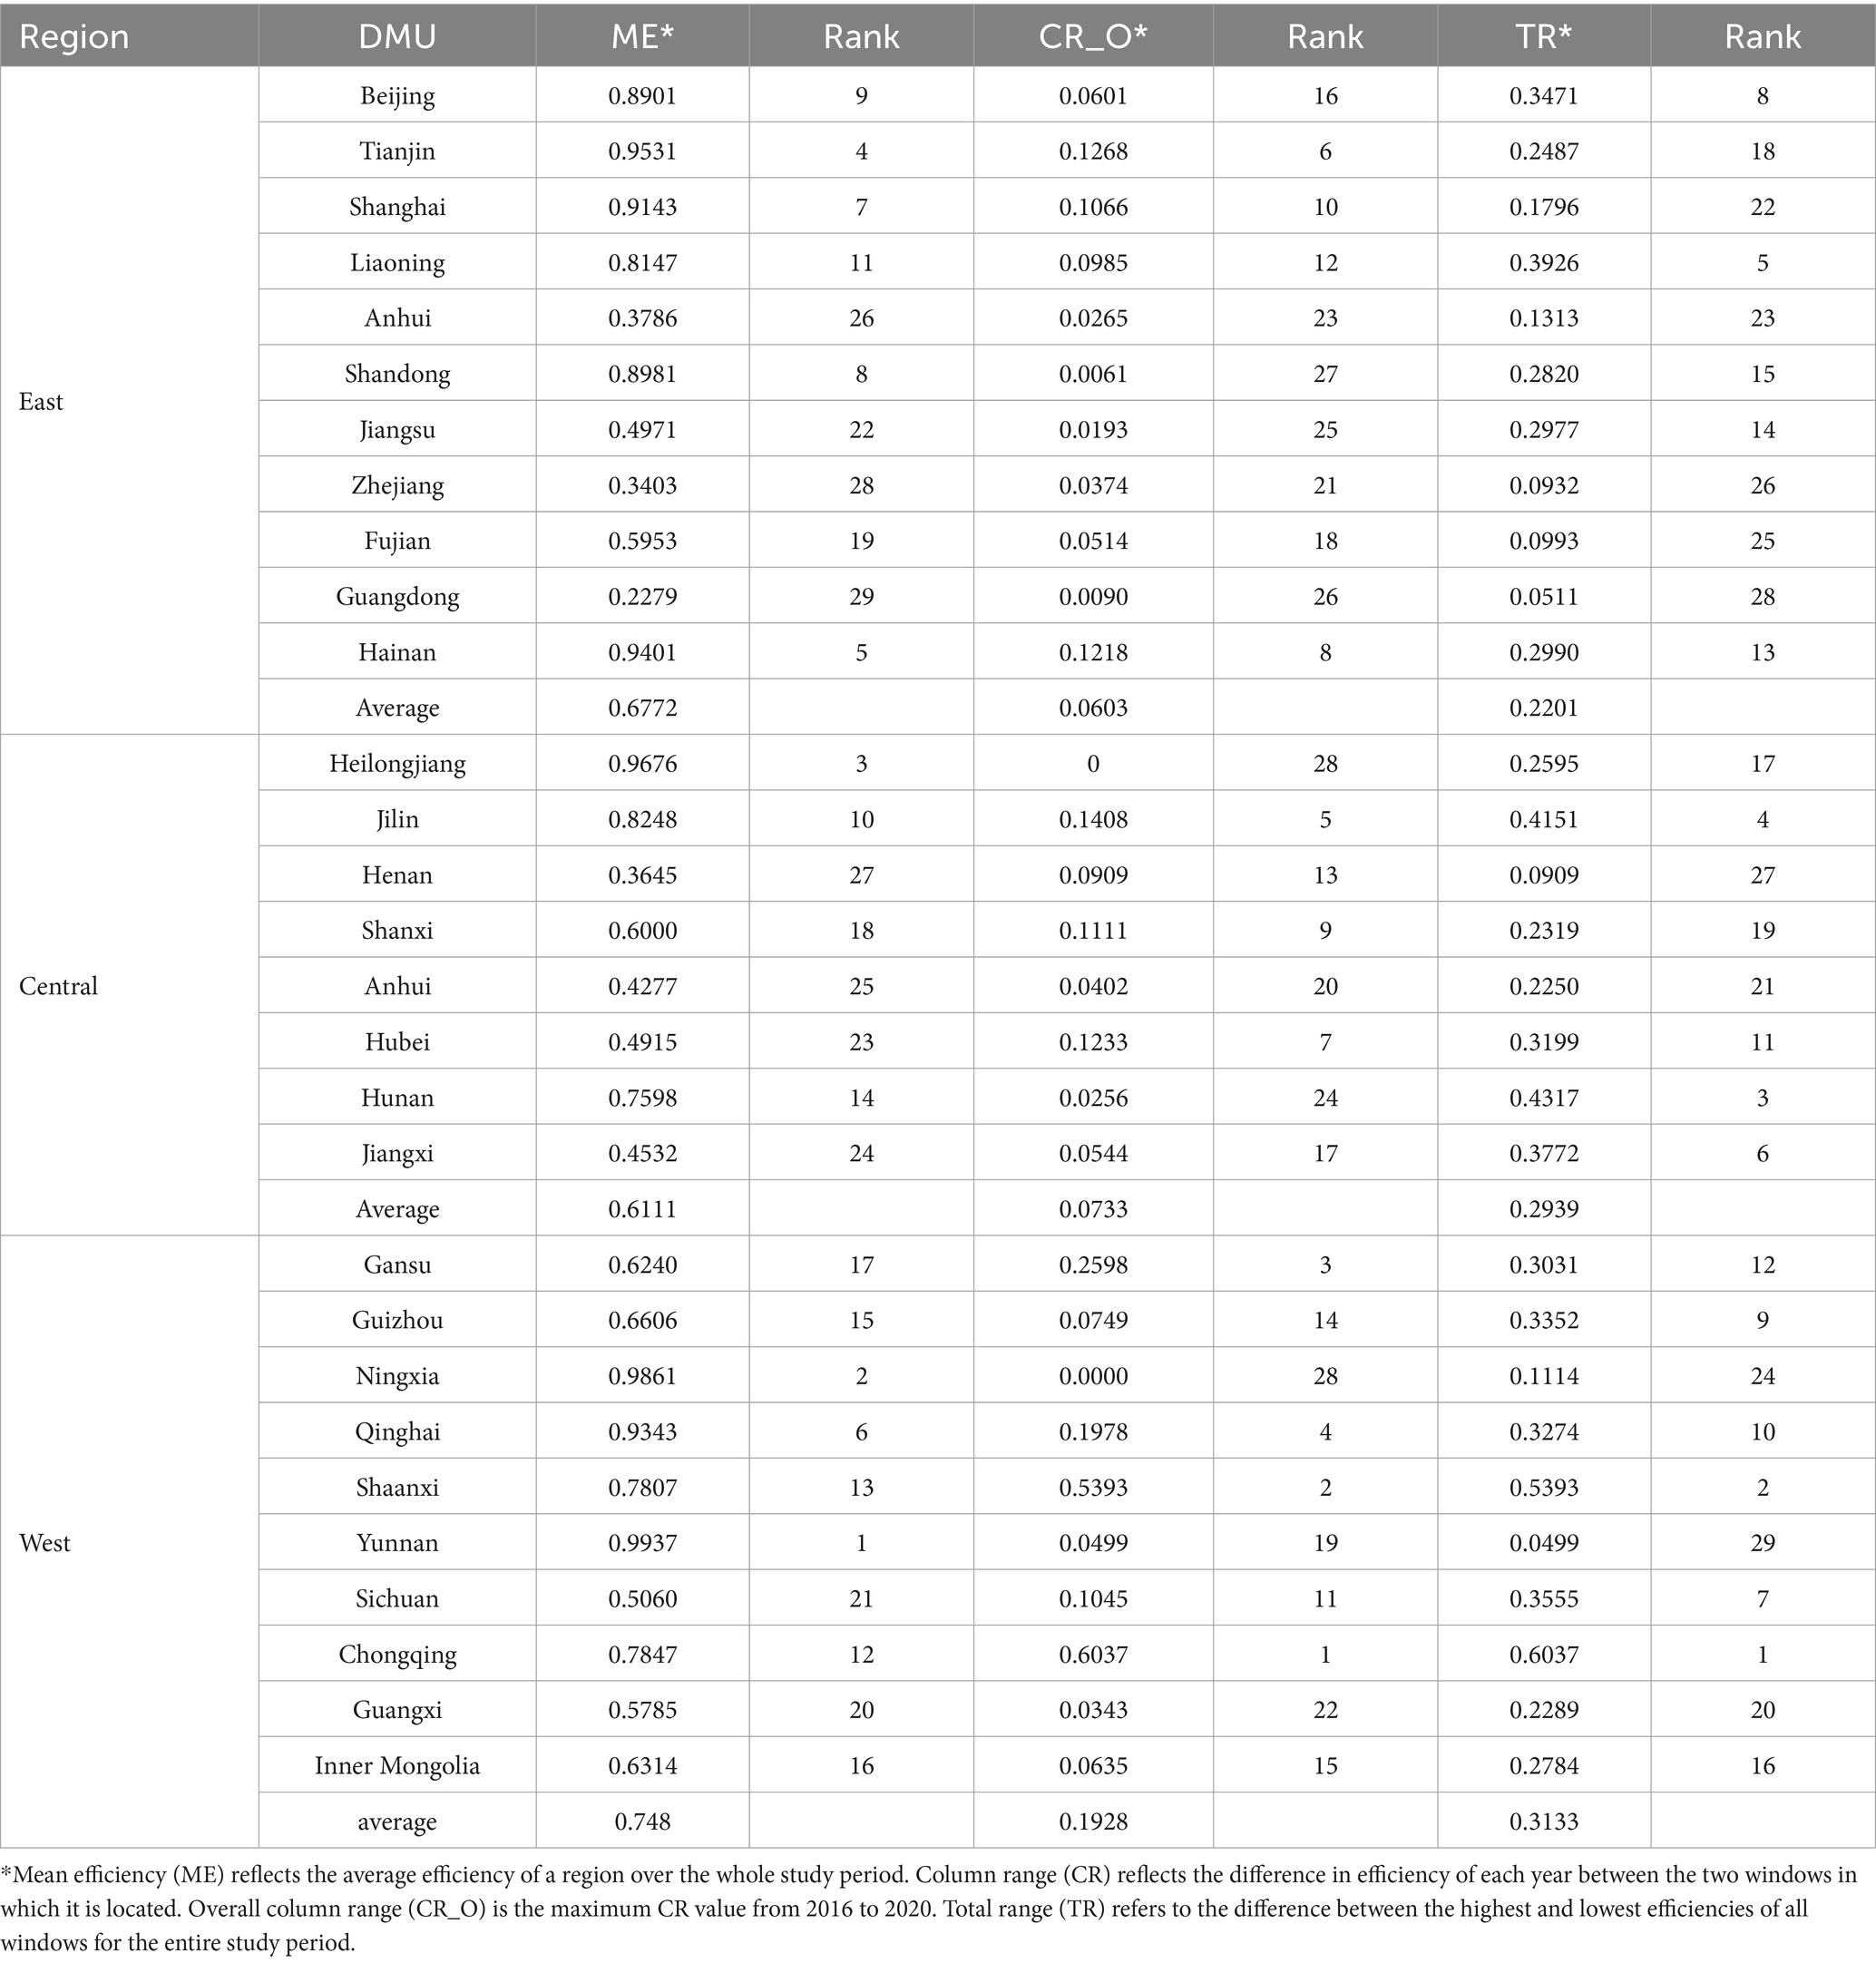
As shown in Table 8, in the eradicating hunger and improving nutrition sustainable development stage, ME in the east region is 0.6772, ME in the central region is 0.6111, and ME in the west region is 0.748. Thus, the west region is better than the east region, which is better than the central region. Obviously, the overall efficiency of the western region from the agricultural production stage to the sustainable stage of eliminating hunger and improving nutrition is excellent. Therefore, the key to improving the overall efficiency of the western region lies in improving the efficiency of agricultural production in the first stage and its stability. Only a few provinces in the central region have a high level of sustainable efficiency, and most provinces have great room for improvement. The eastern region can focus on how to optimize the efficiency of the stage of eliminating hunger and improving nutrition.
In terms of stability, the CR_O in the eastern region is 0.0603, the CR_O in the central region is 0.0733, and the CR_O in the western region is 0.1928; the TR value in the eastern region is 0.2201, the central region is 0.2939, and the western region is 0.3133. It can be seen that the stability of the eastern region is better than that of the central region and better than that of the western region.
4.2.2 Comparison of the efficiency of different windows
4.2.2.1 Overall system efficiency analysis
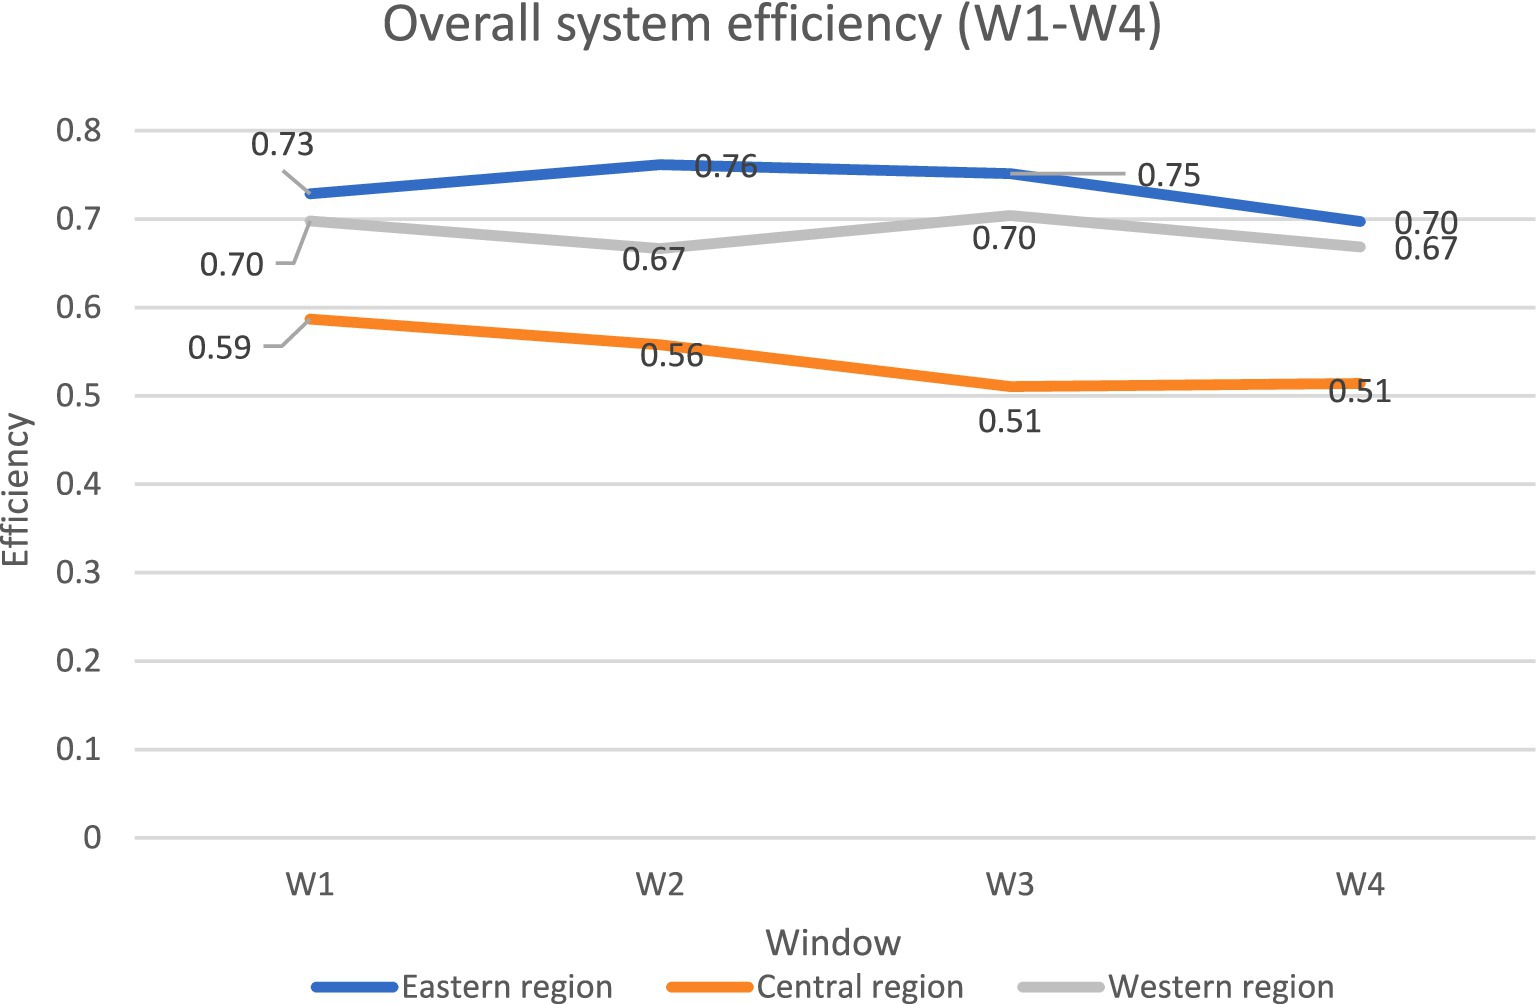
W1 corresponds to the 2016–2017 window, W2 to the 2017–2018 window, W3 to the 2018–2019 window, and W4 to the 2019–2020 window. As can be seen in Figure 2, in W1-W4 the east region has the highest overall system efficiency, ranging from 0.70 to 0.76, the west region has the second highest, ranging from 0.67 to 0.70, and the central region has the lowest, ranging from 0.51 to 0.59.
This reveals that the central region lags behind the eastern and western regions in all windows. However, both the eastern and central regions show a significant decline in total efficiency in W4 (2019–2020), while the western region stabilizes, so it is necessary to further analyze the impact of the new crown outbreaks of major public health emergencies on total efficiency in 2019–2020 to understand the causes behind.
4.2.2.2 Efficiency analysis of agricultural production stages
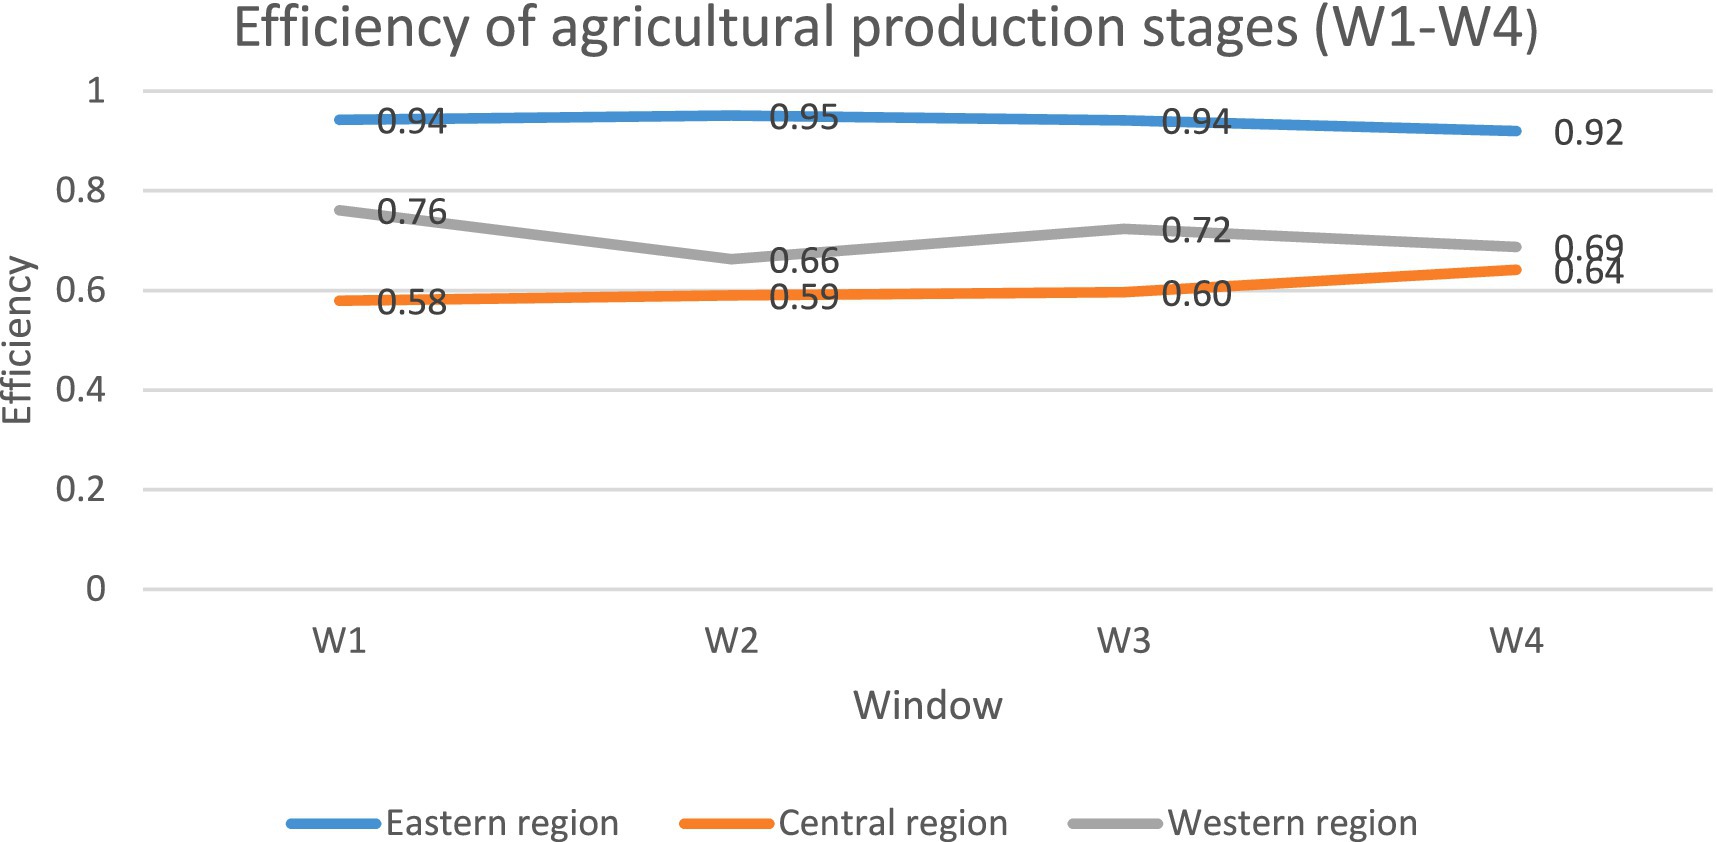
As shown in Figure 3, in the agricultural production stage the efficiency values of China’s east, central, and west regions vary greatly during the four windows. The efficiency value of the east region in the agricultural production stage is much higher than that of the central region and the west region, maintaining the same trend as total efficiency. The east region has better economic conditions and therefore pays more attention to the introduction of advanced agricultural production technology. During the period W1–W4, efficiency values at the stage of agricultural production fluctuated in the range of 0.92–0.95 in the eastern region, 0.69–0.76 in the western region, and 0.58–0.64 in the central region.
Further observation reveals that the Central Region shows a significant increase from window W3 to W4 compared to the Eastern and Western Regions. Especially in the case of an epidemic, the agricultural productivity of the Central region is still able to maintain its growth. It can be seen that the experiences and practices of the central region with regard to the stage of agricultural production have important lessons for responding to the issue of food security in the context of the impact of major public health emergencies.
4.2.2.3 Efficiency analysis of the eradicating hunger and improving nutrition sustainable development stage
As shown in Figure 4, in the stage of the eradicating hunger and improving nutrition sustainable development from W1 to W4, the efficiency values of China’s east, central, and west regions in this stage are relatively close to each other. All fluctuate within the interval of 0.64–0.75, with the central and west regions showing a trend of decreasing, then increasing, and decreasing again, and the east region showing a trend of increasing and then decreasing. The west region, except for its efficiency value of W2 that drops steeply to the lowest value of 0.67, has efficiency values in W1, W3, and W4 that are significantly higher than those in the east and central regions. In addition, during the period from W3 to W4, which was during the COVID-19, the efficiency values of both the eastern and central regions showed a decreasing trend, while the efficiency of the western region remained unchanged. The possible reasons for this are that the population density in the west is relatively low, and the impact on the food supply system caused by the stoppage of work and production as a result of the epidemic prevention and control measures is relatively small, and on the other hand, the western region is more self-sufficient, with a relatively independent production and consumption system. In contrast, the eastern and central regions are characterized by high population mobility, and the supply chain is blocked under the epidemic, resulting in lower efficiency in the sustainable phase of hunger eradication and nutrition improvement. It can be seen that during the period from W3 to W4, the efficiency of the eradicating hunger and improving nutrition sustainable development stage in each region was affected by the impact of the new crown epidemic to different degrees.
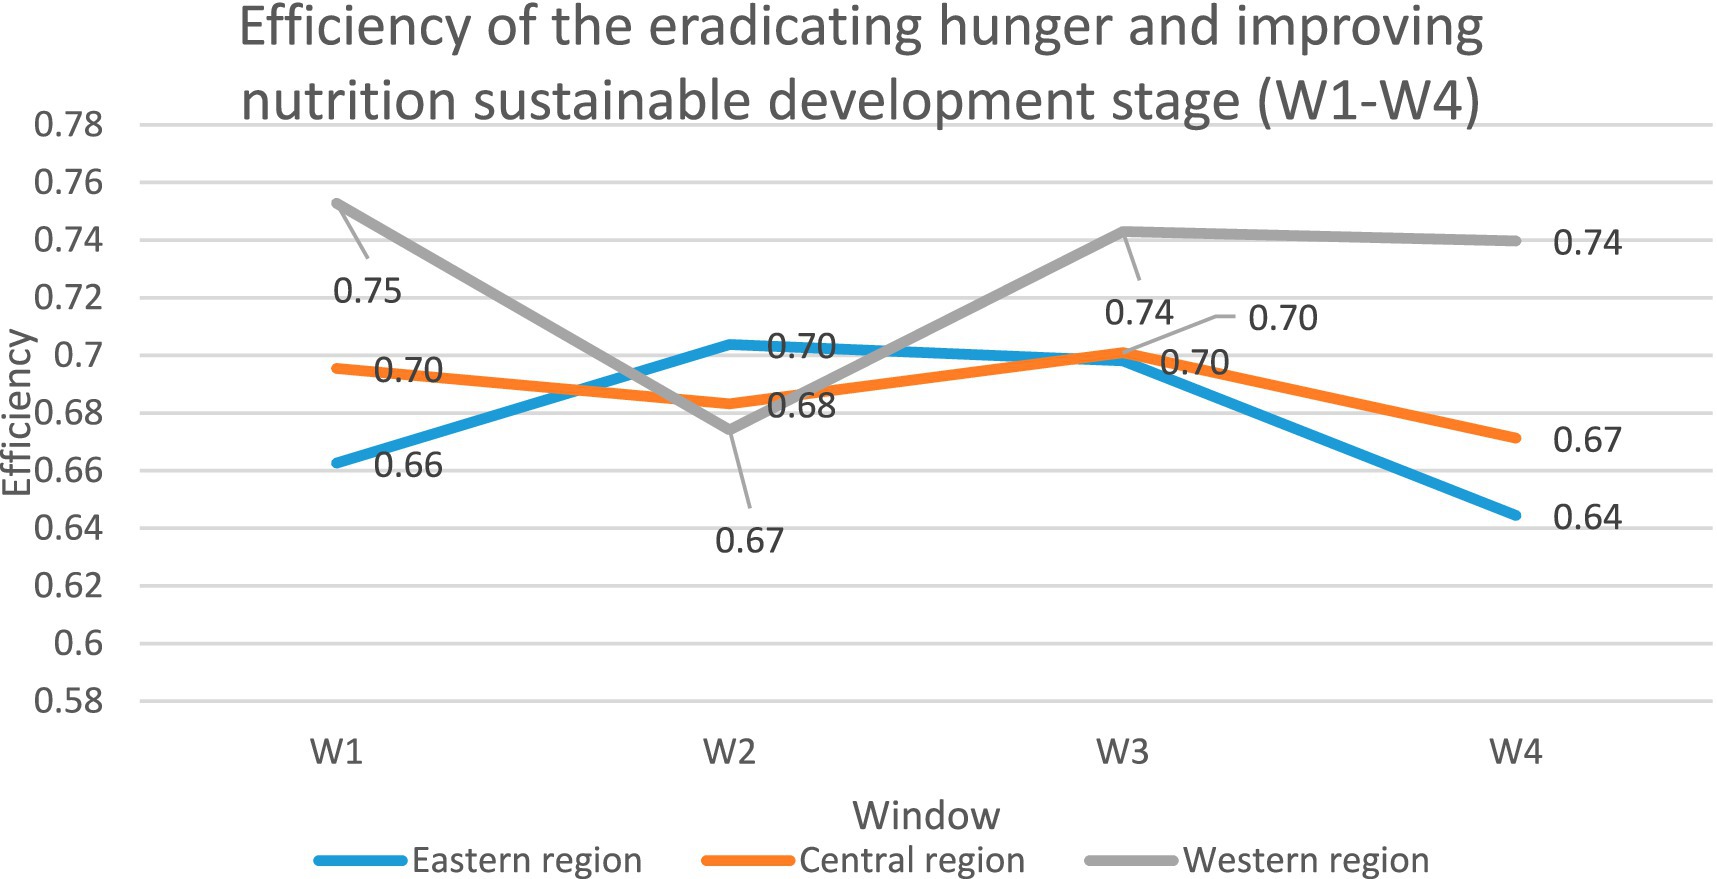
Figure 4. Efficiency of the eradicating hunger and improving nutrition sustainable development stage (W1–W4).
4.3 Efficiency analysis for the COVID-19 period
In order to study the impact of COVID-19 on eradicating hunger, reaching food security, and improving nutrition, this section focuses on the efficiency of window W4 (2019 to 2020), the period of the epidemic. It uses indicator WE to measure the efficiency of the window for W4 and indicator EV to measure the growth rate of efficiency during the window.
4.3.1 Overall system efficiency analysis for the period COVID-19
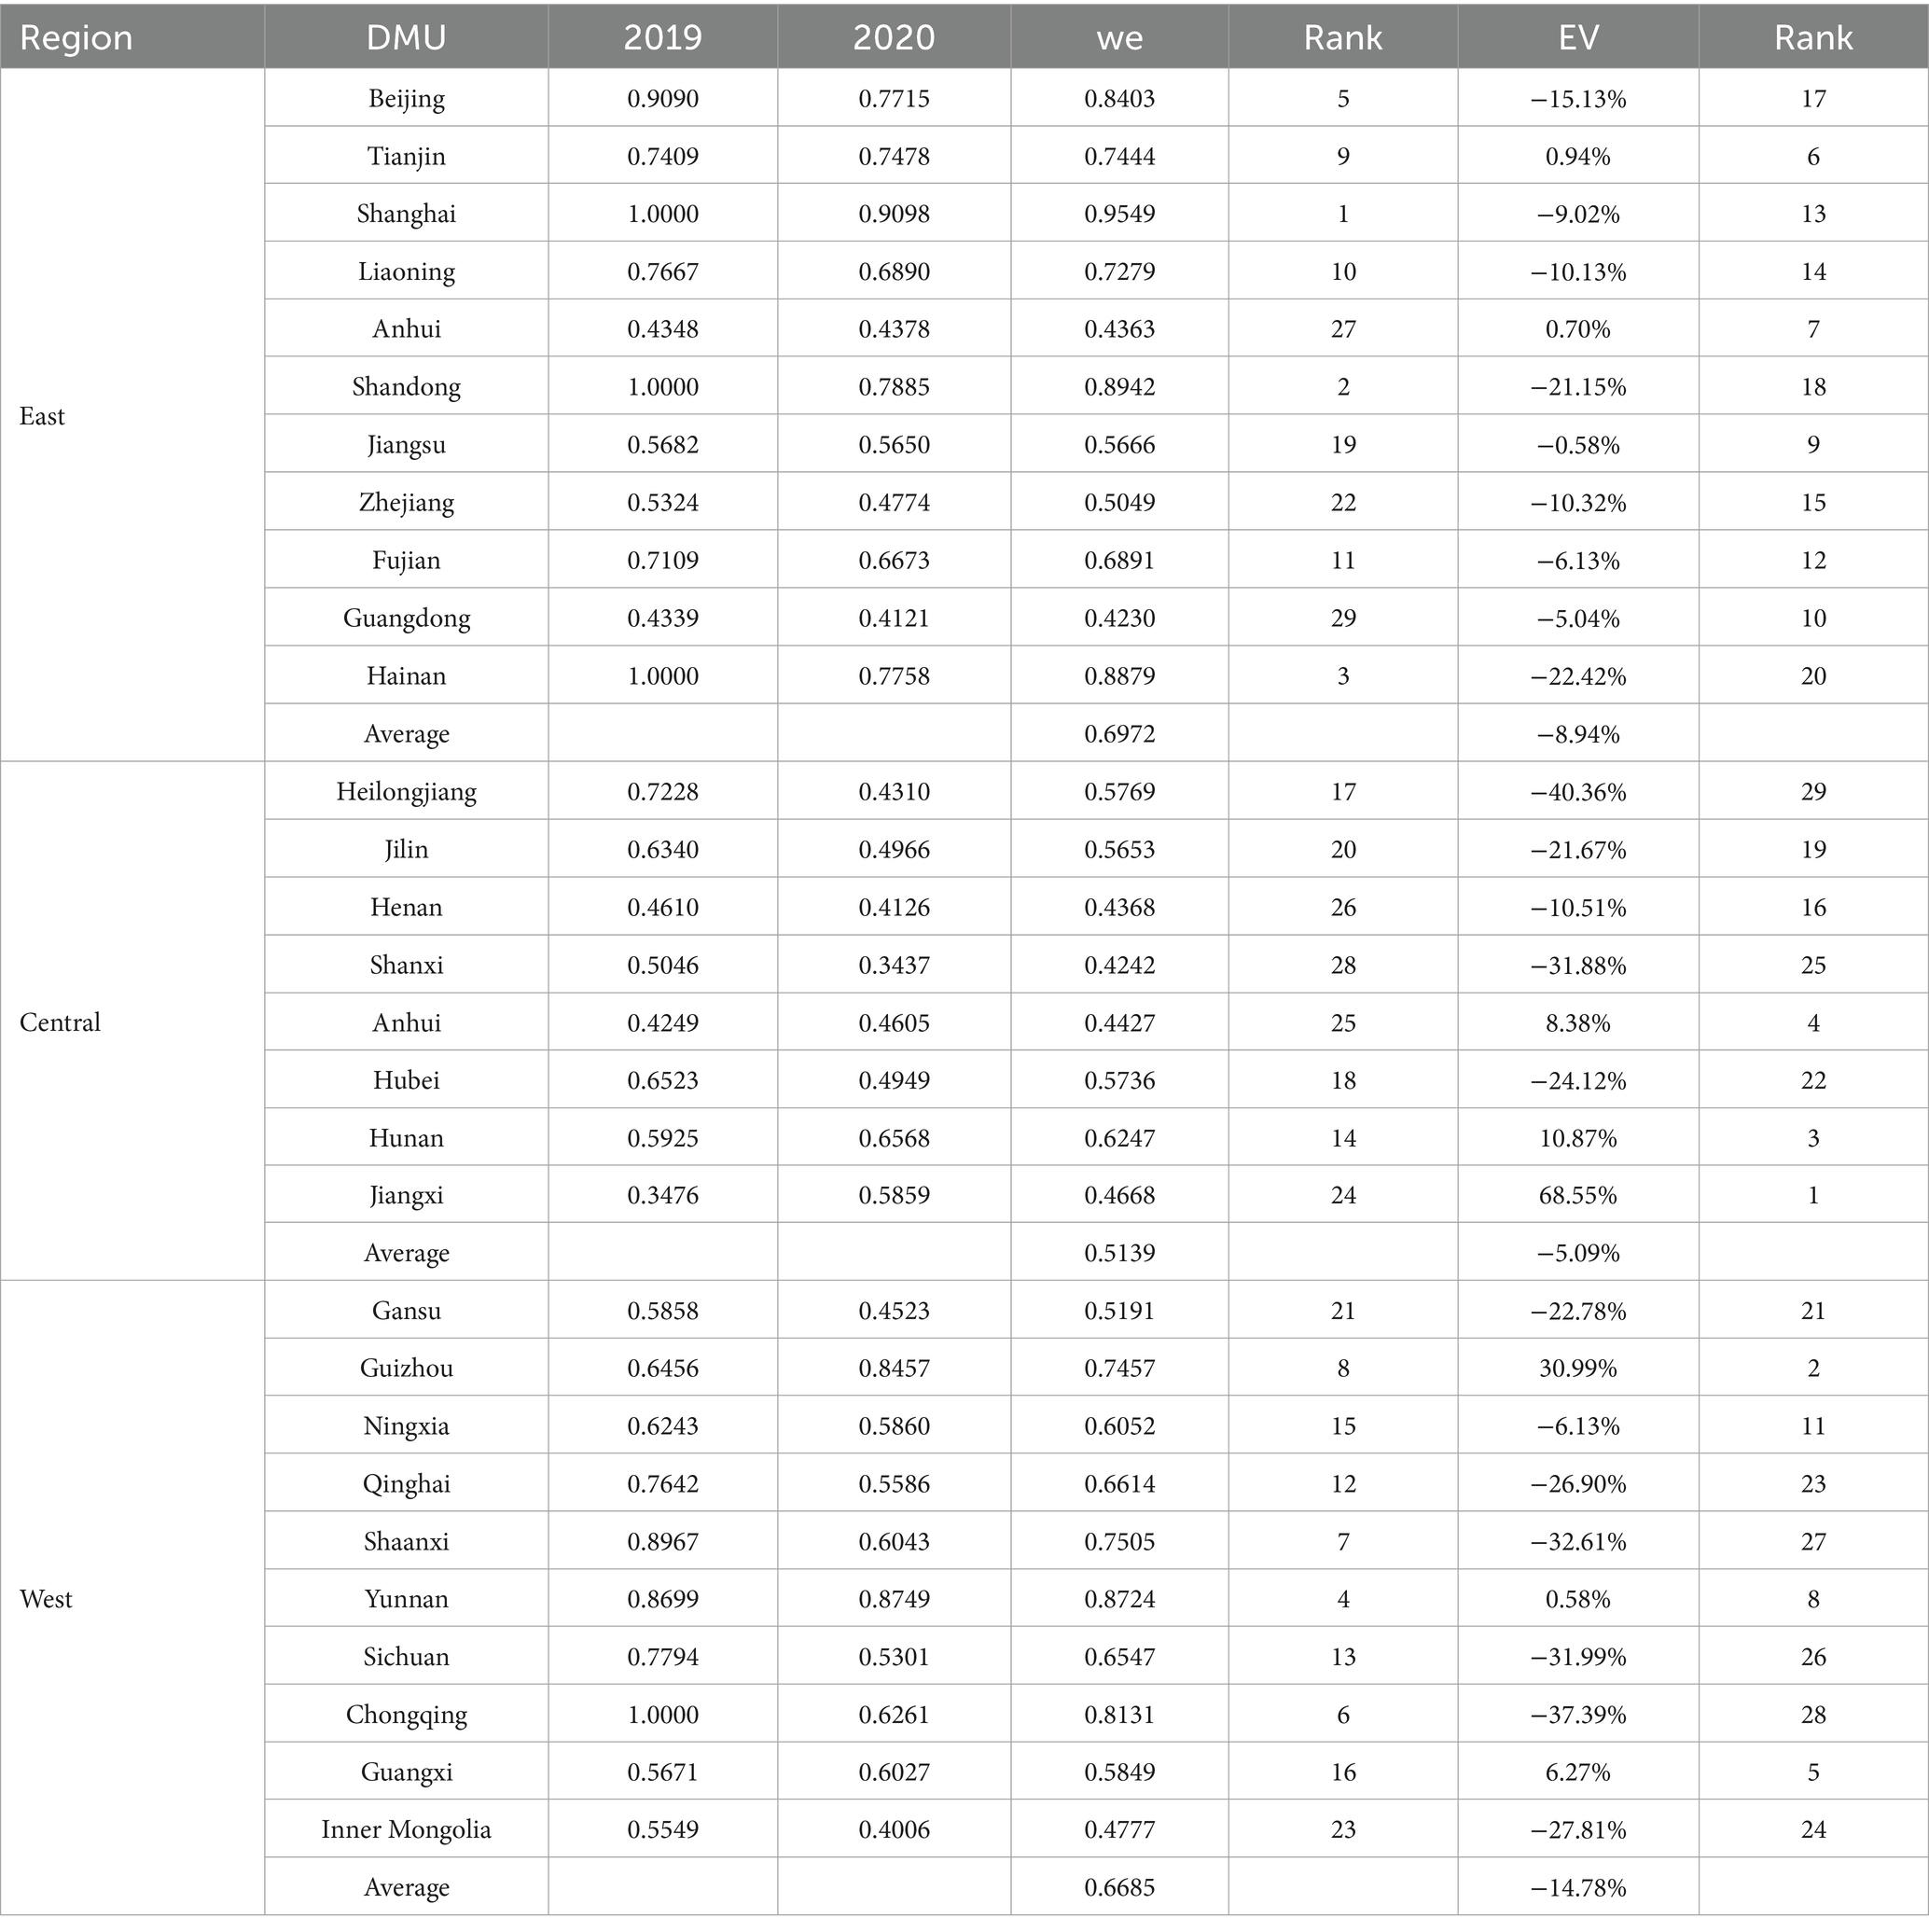
As shown in Table 9, during the period of COVID-19, in terms of overall system efficiency WE, the east region (0.6972) is better than the west region (0.6685), which is better than the central (0.5139). Among the 29 provinces, six provinces have total efficiency values >0.8, of which 4 are located in the east region, and 2 are located in the west region. Shanghai (0.9549), Shandong (0.8942), and Hainan (0.8879) are the three provinces with the highest efficiency value, all of which are in the east region. The three provinces with the lowest efficiency values are Guangdong (0.4230), Shanxi (0.4242), and Hebei (0.4363). Guangdong and Hebei are located in the east region, and Shanxi is located in the central region. Thus, it can be seen that the overall system efficiency in east China varies considerably across provinces.
During the period of COVID-19, EV in the east region is −8.94%, EV in the central region is −5.09%, and EV in the west region is −14.78%. During the 2 years of COVID-19, the overall system efficiency values of the east, central, and west regions show a decreasing trend, in which the west region has the largest decreasing trend, followed by the east region, and then the central region. Only 8 provinces present an increase in overall efficiency, of which 2 provinces are in the east region, 3 in the central region, and 3 in the west region. The three provinces with the largest increases are Jiangxi (68.55%), Guizhou (30.99%), and Hunan (10.87%), and the three provinces with the largest decreases are Heilongjiang (−40.36%), Chongqing (−37.39%) and Shaanxi (−32.61%).
4.3.2 Analysis of the efficiency of agricultural production stages during COVID-19
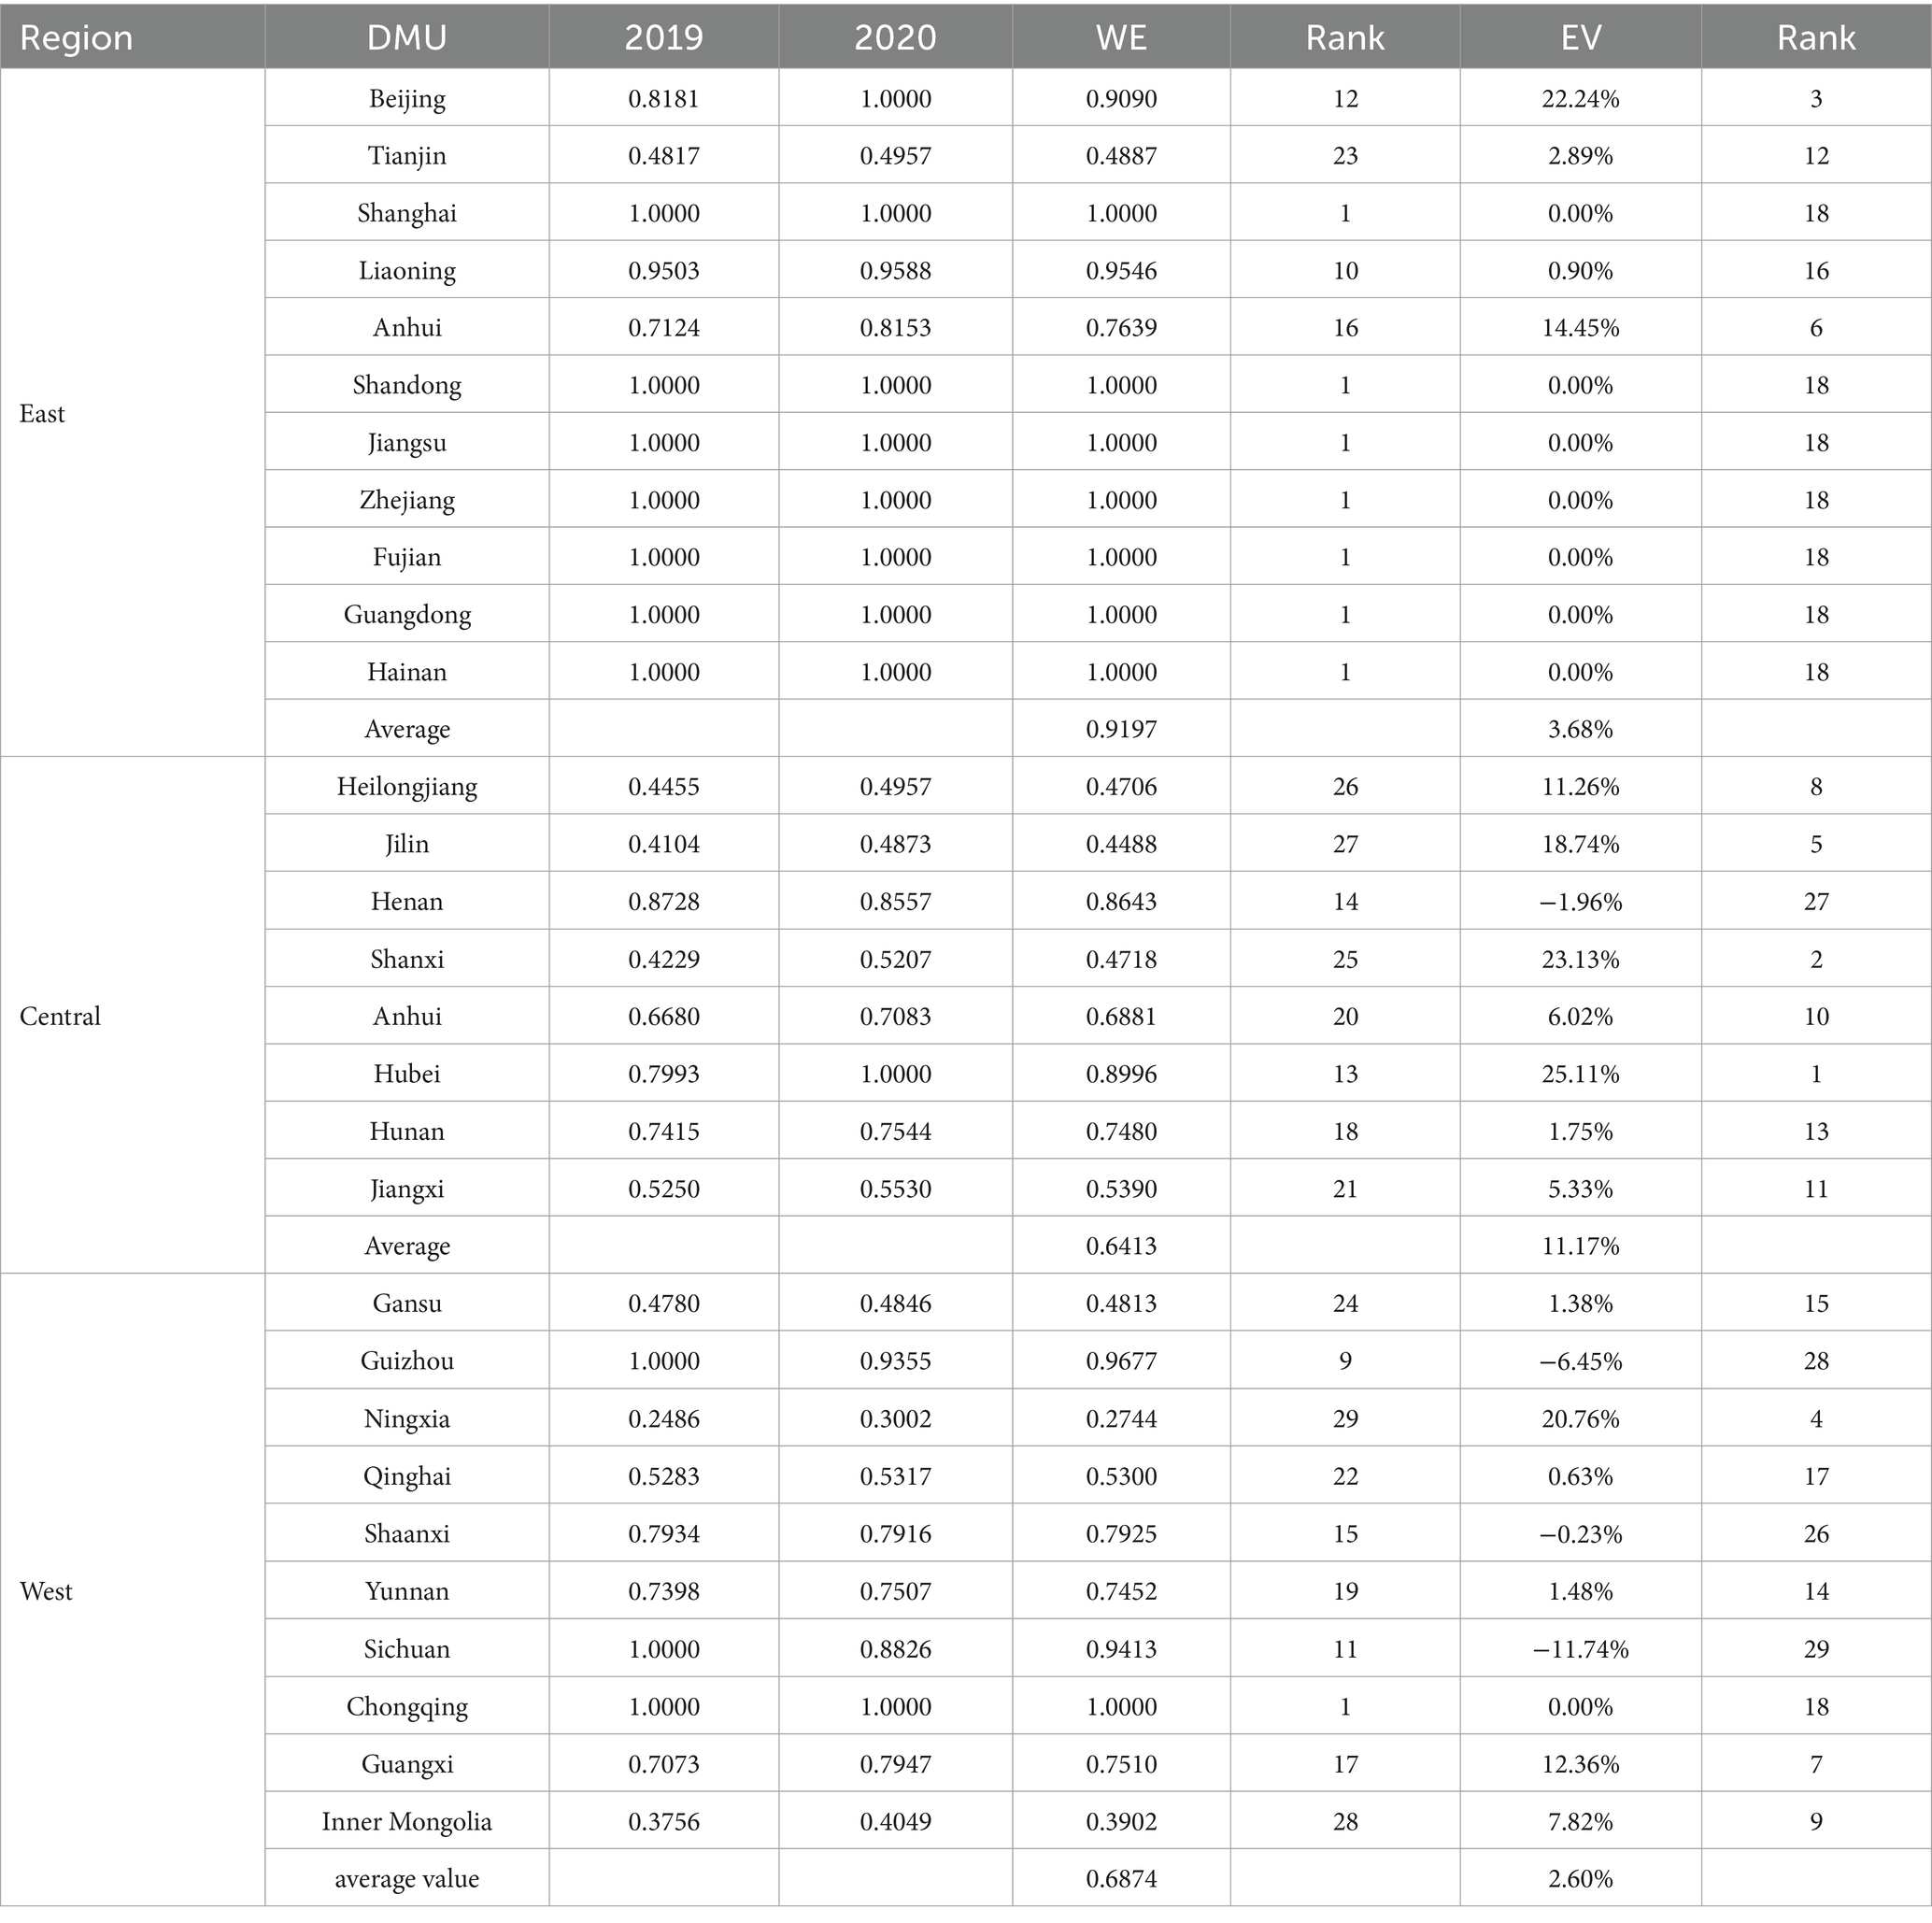
As can be seen from Table 10, in terms of the efficiency value WE in the agricultural production stage during the COVID-19 period, the east region (0.9197) is higher than the west region (0.6874), which is slightly higher than the central region (0.6413). Among the 29 provinces, 14 provinces’ WE is higher than 0.8, and only 1 province (Ningxia) has it lower than 0.3. Eight provinces have WE equal to 1, of which 7 provinces are in the east region and 1 province in the west region. During the COVID-19 period, the east region still maintains a high level of efficiency of agricultural production stages and is much better than the central and west regions.
In terms of EV during the COVID-19 period in the agricultural production stage, it is 3.68% in the east region, 11.17% in the central region, and 2.60% in the west region. The largest increase in the value of efficiency is in the central region, the second largest in the east region, and the smallest in the west region. As a result, the central region is an important food production base in China, and the increase in its agricultural productivity remained outstanding during the Xinguan epidemic, playing a crucial role in guaranteeing China’s food security.
4.3.3 Analysis of the efficiency of the hunger eradication and nutritional sustainability phase during COVID-19
As can be seen from Table 11, in the stage of eradicating hunger and improving nutrition sustainable development during COVID-19, WE is higher in the west region (0.7397) than in the east region (0.6444), which is higher than the central region (0.5432). Among the 29 provinces, nine have an efficiency value higher than 0.8, and only one (Guangdong) has an efficiency value lower than 0.3. The 3 provinces with the highest WE are Tianjin (1.0000), Yunnan (0.9997), and Ningxia (0.9443), and the 3 provinces with the lowest WE are Guangdong (0.2306), Jiangxi (0.3323), and Zhejiang (0.3399).
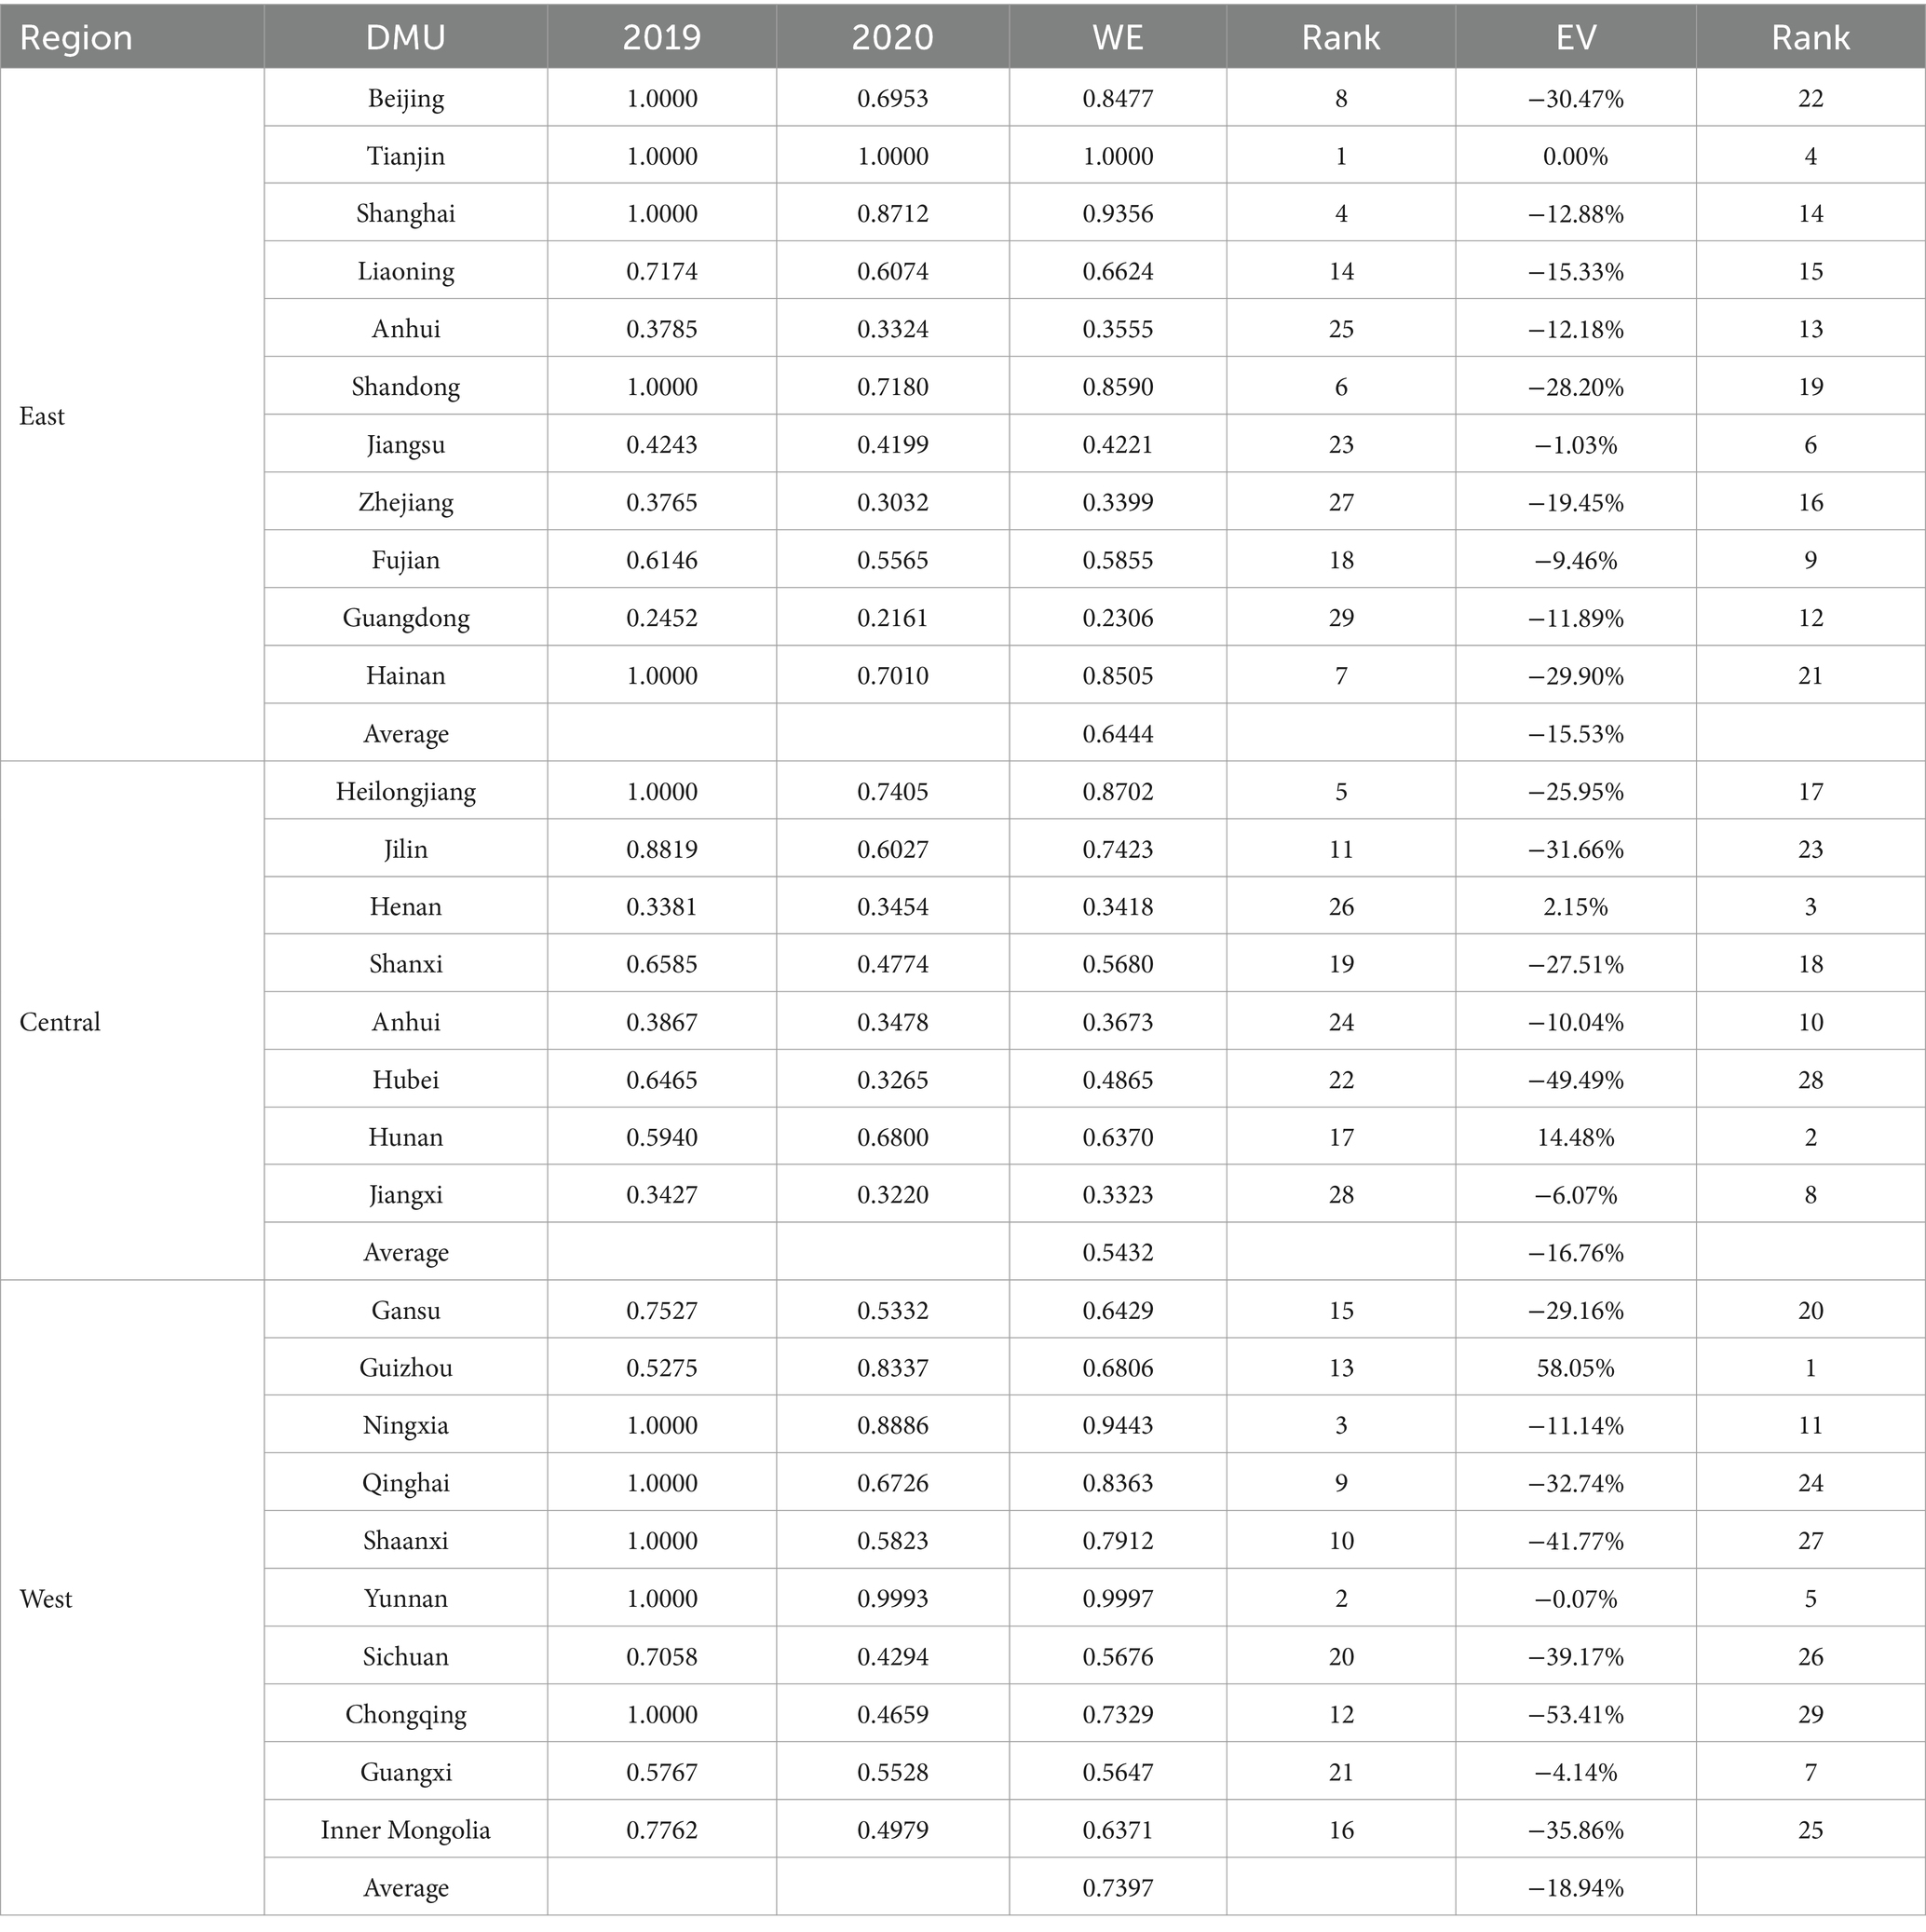
Table 11. Efficiency of the eradicating hunger and improving nutrition sustainable development stage during COVID-19.
In the stage of eradicating hunger and improving nutrition sustainable development during COVID-19, the EV value of the east region is −15.53%, the EV value of the central region is −16.76%, and the EV value of the west region is −18.94%. The efficiency values of the east, central, and west regions of China show a downward trend, with the west region showing the greatest decline, the central region in second, and then the east region. It can be seen that in the stage of eradicating hunger and improving nutrition sustainable development, the eastern, central and western parts of the country were strongly affected by the epidemic. During this phase, all three regions experienced a considerable drop in efficiency, with the central and western regions being particularly affected.
From the previous section, it can be seen that the eastern region is in the leading position in terms of efficiency in the agricultural production stage, but its efficiency performance in the eradicating hunger and improving nutrition sustainable development stage during the COVID-19 period is poor, which indicates that the eastern region has not been able to successfully transform the efficiency advantage in the agricultural production stage into the actual effectiveness in the eradicating hunger and improving nutrition sustainable development stage. This shows that the major public health emergency of COVID-19 had a huge impact in the eradicating hunger and improving nutrition sustainable development stage.
Having explored the impact of the new crown epidemic on the efficiency of the stage of eradicating hunger and improving nutrition sustainable development in various regions, we have further reflected on the key factors that will guarantee the realization of this goal in the context of the epidemic. Indeed, agriculture in China is characterized to some extent by an energy-intensive industry, which has a crucial impact on hunger eradication and nutrition in the current context. As we know, agricultural machinery requires energy to run, and fertilizer and pesticide production and transportation also consume large amounts of energy. In the context of the epidemic, energy management has become a key element in influencing the food supply and the eradicating hunger and improving nutrition sustainable development stage.
On the one hand, effective energy management ensures the stable operation of agricultural production, which in turn guarantees the stability of the food supply and provides the material basis for the phase of improving nutrition in the fight against hunger. On the other hand, effective energy management also affects the sustainability of hunger eradication and improved nutrition. The rational use of energy in food processing, storage and transportation can reduce costs and increase efficiency, so that nutritious food can be more widely distributed to areas and populations in need, thus contributing to distribution and sustainable development, which is of great significance for regions that are striving to maintain the efficiency of the sustainable phase of hunger eradication and improved nutrition in the face of the impact of epidemics.
5 Conclusions and policy implications
5.1 Conclusion
First of all, the total efficiency measured in this paper fully demonstrates the comprehensive results of the whole system from the initial inputs of agricultural production to the final realization of the goal of hunger eradication and nutrition improvement, which measures the effective utilization of resources in the whole chain process. From 2016 to 2020, in terms of the total efficiency level, the average efficiency value is the highest in the eastern region, the second in the western region, and the lowest in the central region; the stage of agricultural production also shows the highest average efficiency value in the east, the second highest in the west, and the lowest in the center; in the stage of eradicating hunger and improving nutritional sustainability, the western region has the highest average efficiency value, the second highest in the east, and the lowest in the center. The higher total efficiency in the eastern region is attributed to the combination of its developed economy, high degree of industrialization of agriculture, and proximity to the consumer market; however, the central region, as a concentration of China’s large agricultural provinces, has a low total efficiency. In view of this, it is necessary to focus on the problems in the central region.
Second, using the window analysis, combining the agricultural production stage, the eradicating hunger and improving nutritional sustainability stage, and the system as a whole, the total efficiency values of the eastern and western regions, the efficiency values of the eastern and western regions in the agricultural production stage, and the efficiency values of the three regions in the eradicating hunger and improving nutritional sustainability stage showed a significant decrease in the W3 - W4 period. However, the Central Region shows a certain increase in the W3 - W4 period. Although the central region is still in a state of low efficiency, this increase in the face of shocks during the epidemic implies that the central region has some resilience or adaptive mechanisms under certain conditions.
Finally, to further explore the impact of major emergencies on eradicating hunger, achieving food security and improving nutrition, specific analyses were conducted for the COVID-19 period. During the COVID-19 period, in terms of the overall efficiency level, the Eastern region had the highest average efficiency value, followed by the Western region, and the Central region had the lowest. At the same time, the overall efficiency values of all three regions showed a decreasing trend, with the lowest decrease in the central region, which indicates that the central region was the least affected by the epidemic, and this is mainly due to the fact that the central region still maintained the highest increase in the agricultural production stage during the COVID-19 period. However, in the eradicating hunger and improving nutritional sustainability stage, the efficiency values of all regions show a decreasing trend, and the efficiency value of the central region is the lowest, which shows that the central region has the problems of insufficient capacity to deal with public health emergencies, poor connection between agricultural production and nutrition improvement, and insufficient rationalization of resource allocation and utilization in this stage, and also reflects that the central region still has a problem of enhancing the efficiency of the eradicating hunger and improving nutritional sustainability stage, which indicates that the central region is still the least affected by the epidemic. At the same time, it also reflects that the central region still has a great deal of room for improvement in enhancing the efficiency of the permanent phase of hunger eradication and nutritional improvement, and that efforts in the areas of policy support, technological innovation, and industrial synergy need to be further strengthened in order to enhance the central region’s ability to achieve the goals of hunger eradication and nutritional improvement in the face of major emergencies.
5.2 Implications for theory and practice
5.2.1 Establishing a sound natural disaster prevention and control mechanism to effectively respond to natural disasters in agriculture
In order to prevent natural disasters as best as possible and reduce the negative impact of natural disasters on agricultural production, the relevant government departments should establish a sound natural disaster prevention and control mechanism. First, investments in the configuration of facilities to cope with natural disasters in agriculture should be increased, and routine maintenance should be carried out on a daily basis to ensure that they function properly in the event of a natural disaster. Second, it is necessary to strengthen the reserves of natural disaster emergency supplies and improve the natural disaster risk management mechanism. Finally, disaster prevention awareness and capacity of agricultural operators need to be enhanced.
5.2.2 Accelerating agricultural technological innovation and modernizing agricultural production
In order to improve the level of agricultural production, it is necessary to continuously accelerate agricultural technological innovation and strengthen the construction of modernized agricultural production. Research institutes, colleges and universities, and new business entities should actively engage in agricultural science and technology research. At the same time, the sharing of agricultural scientific and technological resources among regions should be promoted in order to facilitate agricultural technological innovation to better support the development of agricultural production. In addition, the strength and intensity of support for the cultivation of the agricultural technology industry should be increased, and the latest scientific research results and invention patents should be invested in actual agricultural production, so as to realize the transformation and application of agricultural technology more quickly. Attention should be paid to the development of smart agriculture by combining modern science and technology with agricultural cultivation in order to achieve unmanned, automated, and intelligent management.
5.2.3 Establishment of special support funds to promote the resumption of work and production, and enhancement of the effectiveness of emergency prevention and control strategies to increase production efficiency
Wuhan City introduced the new agricultural business entities “relief eleven,” for example, in the financial, fiscal and tax, insurance, land, project construction and other eleven levels, the implementation of a series of specific and quantifiable initiatives, aimed at new agricultural business entities to support, to help reduce the negative impact of the epidemic, to accelerate the resumption of work of the agricultural enterprise The aim is to support new agricultural enterprises, help them reduce the negative impact of the epidemic and speed up the pace of agricultural enterprises resuming work and production. The main support targets cover four types of subjects: family farms, farmers’ cooperatives, leading agricultural enterprises and large farming households, and the core support dimensions include financial support, fiscal support, factor support and service guarantee, etc., so as to effectively solve the difficulties faced by new agricultural management subjects. For developing countries, they can learn from this practice and clarify the precise allocation criteria and scientific use process of the special support funds to ensure that the funds flow accurately and precisely to the most urgently needed business entities and key projects. At the same time, an effective supervision and scientific evaluation mechanism for the use of funds should be established to ensure the transparency and effectiveness of the use of funds, so that each fund can maximize its effectiveness, promote the successful resumption of work and production by agricultural business entities, and promote the sound development of the agricultural industry, thus providing strong support for the recovery and sustainable development of the agricultural economy of developing countries in the face of major emergencies.
5.2.4 Building green food policy frameworks for sustainable development trends
Emerging trends toward decarbonization, circularity and sustainability had a positive impact on food supply by promoting environmentally friendly agricultural practices, efficient resource use and long-term ecological balance. These trends help to ensure food security while protecting and improving agro-ecosystems and supporting the achievement of the United Nations sustainable development goals. A green food policy framework should be developed in response to the impact of emerging decarbonization, circularity and sustainability trends on food supply. In response to the decarbonization trend, subsidy incentives should be established, such as subsidies for farmers using decarbonized fertilizers and pesticides, tax incentives for relevant enterprises, and the development and regulation of production standards; in response to the recycling trend, infrastructure investment should be increased, such as the construction of facilities for the treatment of agricultural wastes and systems for recycling water resources; and in response to the sustainability trend, policies on the management of land and water resources should be formulated, and agroecological compensation mechanisms should be established to protect ecosystems and enhance agro-genetic diversity. In response to sustainability trends, land and water management policies need to be developed, agro-ecological compensation mechanisms need to be established to protect ecosystems, and agro-genetic diversity conservation needs to be strengthened in order to ensure that the food supply develops on an environmentally friendly, resource-efficient and long-term sustainable track.
5.2.5 Improve the supply chain system of agricultural products to ensure the effective connection between agriculture and nutrition
Strengthening supply chain infrastructure. Invest in the construction of modernized storage facilities for agricultural products, equipped with advanced cold storage, freshness preservation, ventilation and other equipment, to ensure the quality and nutritional stability of agricultural products in the storage process. For example, building large-scale intelligent grain warehouses in major grain-producing areas, applying automatic temperature and humidity regulation, pest monitoring and other technologies to ensure grain storage safety; establishing an emergency supply chain management mechanism, formulating an emergency response plan for the supply chain of agricultural products in the event of major emergencies, and clarifying the responsibilities and tasks of various departments and links. This includes how to safeguard the production, acquisition, transportation and distribution of agricultural products in an orderly manner during emergencies such as epidemics and natural disasters. For example, it provides for the opening of “green channels” for the transportation of agricultural products during the sealing and control of epidemics, so as to ensure the smooth flow of agricultural materials and agricultural products.
Data availability statement
The original contributions presented in the study are included in the article/supplementary material, further inquiries can be directed to the corresponding author.
Author contributions
ZF: Writing – review & editing, Writing – original draft, Conceptualization. QX: Writing – review & editing, Writing – original draft, Methodology. YG: Writing – review & editing.
Funding
The author(s) declare that financial support was received for the research, authorship, and/or publication of this article. This research was funded by Major Projects of Fujian Social Science Base (FJ2020JDZ025 and FJ2022JDZ022), “National Finance” and “Mezzo Economics” teaching, and the Guangfa Securities Social Charity Foundation for financial support.
Conflict of interest
The authors declare that the research was conducted in the absence of any commercial or financial relationships that could be construed as a potential conflict of interest.
Publisher’s note
All claims expressed in this article are solely those of the authors and do not necessarily represent those of their affiliated organizations, or those of the publisher, the editors and the reviewers. Any product that may be evaluated in this article, or claim that may be made by its manufacturer, is not guaranteed or endorsed by the publisher.
Abbreviations
COVID-19, Coronavirus disease 2019; DDF, Directional distance function; TOPSIS, Technique for order preference by similarity to an ideal solution; DEA, Data envelopment analysis; DMU, Decision making unit; GDP, Gross domestic product; ME, Mean efficiency; CR, Column range; CR_O, Overall column range; TR, Total range.
References
Abbas, M., Ribeiro, P. F., and Santos, J. L. (2023). Farming system change under different climate scenarios and its impact on food security: an analytical framework to inform adaptation policy in developing countries. Mitig. Adapt. Strateg. Glob. Change 28:43. doi: 10.1007/s11027-023-10082-5
Akbari, M., Loganathan, N., Tavakolian, H., Mardani, A., and Štreimikienė, D. (2021). The dynamic effect of micro-structural shocks on private investment behavior. Acta Montan. Slovaca 26, 1–17. doi: 10.46544/AMS.v26i1.01
Alpizar, F., Carlsson, F., and Naranjo, M. A. (2011). The effect of ambiguous risk, and coordination on farmers’ adaptation to climate change—A framed field experiment. Ecol. Econ. 70, 2317–2326. doi: 10.1016/j.ecolecon.2011.07.004
Amadou, S., Schmitt, L. O., Hawa, D., Kadiatou, T., and Cris, A. N. (2021). Barriers and enablers of the use of digital technologies for sustainable agricultural development and food security: learning from cases in Mali. Element. Sci. Anthrop. 9:106. doi: 10.1525/elementa.2020.00106
Balgah, R. A., Benjamin, E. O., Kimengsi, J. N., and Buchenrieder, G. (2023). COVID-19 impact on agriculture and food security in Africa. A systematic review and meta-analysis. World Dev. Perspectives 31:100523. doi: 10.1016/j.wdp.2023.100523
Brown, M. E., Carr, E. R., Grace, K. L., Wiebe, K., Funk, C. C., Attavanich, W., et al. (2017). Do markets and trade help or hurt the global food system adapt to climate change? Food Policy 68, 154–159. doi: 10.1016/j.foodpol.2017.02.004
Charnes, A., Clark, C. T., Cooper, W. W., and Golany, B. (1985). A developmental study of data envelopment analysis in measuring the efficiency of maintenance units in the U.S. Air Forces. Ann Oper Res. 2, 95–112.
Chung, S. H., Lee, A. H. I., and Kang, H. Y. (2008). A DEA window analysis on the product family mix selection for a semiconductor fabricator[J]. Expert Sys. Applic. 35, 379–388.
De Laurentiis, V., Hunt, D. V., and Rogers, C. D. (2016). Overcoming food security challenges within an energy/water/food nexus (EWFN) approach. Sustain. For. 8:95. doi: 10.3390/su8010095
Dvorský, J., Bednarz, J., and Blajer-Gołębiewska, A. (2023). The impact of corporate reputation and social media engagement on the sustainability of SMEs: perceptions of top managers and the owners. Equilibrium. Q. J. Econ. Policy 18, 779–811. doi: 10.24136/eq.2023.025
Fu, J., Lyu, D., and Sun, J. (2021). China's grain trade research based on DEA model of national food security perspective: soybean as an example. Tehnički Vjesnik 28, 609–615. doi: 10.17559/TV-20210130090347
Fukase, E., and Martin, W. (2016). Who will feed China in the 21st century? Income growth and food demand and supply in China. J. Agric. Econ. 67, 3–23. doi: 10.1111/1477-9552.12117
Gokhan, E., and Shannon, S. (2019). Food security performance assessment of the US states: a DEA-based Malmquist productivity index approach. Int. J. Agric. Res. Gov. Ecol. 15, 1–26. doi: 10.1504/IJARGE.2019.099797
Hou, M., Zhong, S., Xi, Z., and Yao, S. (2022). Does large-scale ecological restoration threaten food security in China? A moderated mediation model. Ecol. Indic. 143:109372. doi: 10.1016/j.ecolind.2022.109372
Hu, Y. S., Piao, Y. S., Sun, C. Y., Li, R. Z., Kim, C. S., and Lee, J. (2021). Evaluation of grain production efficiency in the Main grain producing areas in China based on a three stage DEA model. J. Korean Soc. Ind. Acad. Technol. 22, 44–55. doi: 10.5762/KAIS.2021.22.9.44
Huang, S., Ghazali, S., Azadi, H., Moghaddam, S. M., Viira, A. H., and Kurban, A. (2023). Contribution of agricultural land conversion to global GHG emissions: a meta-analysis. Sci. Total Environ. 876:162269. doi: 10.1016/j.scitotenv.2023.162269
Huang, J., and Yang, G. (2017). Understanding recent challenges and new food policy in China. Glob. Food Sec. 12, 119–126. doi: 10.1016/j.gfs.2016.10.002
Jin, X., Jiang, P., Li, M., Gao, Y., and Yang, L. (2022). Mapping Chinese land system types from the perspectives of land use and management, biodiversity conservation and cultural landscape. Ecol. Indic. 141:108981. doi: 10.1016/j.ecolind.2022.108981
Kelsall, T. S., DeBeck, K., Grant, C., Gorbach, P., Milloy, M. J., and Hayashi, K. (2023). Food insecurity during the COVID-19 pandemic who use drugs in Vancouver. Public Health Nutr. 26, 1878–1886. doi: 10.1017/S1368980023001234
Kliestik, T., Kral, P., Bugaj, M., and Durana, P. (2024). Generative artificial intelligence of things systems, multisensory immersive extended reality technologies, and algorithmic big data simulation and modelling tools in digital twin industrial metaverse. Equilibrium. Q. J. Econ. Policy 19, 429–461. doi: 10.24136/eq.3108
Kliestik, T., Nica, E., Durana, P., and Popescu, G. H. (2023). Artificial intelligence-based predictive maintenance, time-sensitive networking, and big data-driven algorithmic decision-making in the economics of industrial internet of things. Oecon. Copernicana 14, 1097–1138. doi: 10.24136/oc.2023.033
Lialina, A. V., and Morachevskaya, K. A. (2022). Economic access to food and COVID-19: new challenges for the Russian exclave. Reg. Res. Russ. 12, 335–349. doi: 10.1134/S2079970522700289
Lu, Y., He, T., Yue, W., Li, M., Shan, Z., and Zhang, M. (2023). Does cropland threaten urban land use efficiency in the peri-urban area? Evidence from metropolitan areas in China. Appl. Geogr. 161:103124. doi: 10.1016/j.apgeog.2023.103124
Maroušek, J. (2014). Economically oriented process optimization in waste management. Environ. Sci. Pollut. Res. 21, 7400–7402. doi: 10.1007/s11356-014-2688-z
Maroušek, J., Kolář, L., Vochozka, M., Stehel, V., and Maroušková, A. (2017). Novel method for cultivating beetroot reduces nitrate content. J. Clean. Prod. 168, 60–62. doi: 10.1016/j.jclepro.2017.08.233
Patel, H., and Shrimali, B. (2023). AgriOnBlock: secured data harvesting for agriculture sector using blockchain technology. ICT Express 9, 150–159. doi: 10.1016/j.icte.2021.07.003
Pavolova, H., Bakalár, T., Kyšeľa, K., Klimek, M., Hajduova, Z., and Zawada, M. (2021). The analysis of investment into industries based on portfolio managers. Acta Montan. Slovaca 26, 161–170. doi: 10.46544/AMS.v26i1.14
Qin, J., Duan, W., Chen, Y., Dukhovny, V. A., Sorokin, D., Li, Y., et al. (2022). Comprehensive evaluation and sustainable development of water–energy–food–ecology systems in Central Asia. Renew. Sust. Energ. Rev. 157:112061. doi: 10.1016/j.rser.2021.112061
Sajjad, A. K. (2017). Contributing factors for protein calorie Malnutrition District Mardan. Pakistan J. Med. Res. 56, 1–4.
Shannon, C. E. (1948). A mathematical theory of communication. Bell Sys. Techn. J. 27, 379–423. doi: 10.1002/j.1538-7305.1948.tb01338.x
Tanaka, T., Sun, L., Becker-Reshef, I., Song, X., and Puricelli, E. (2023). Satellite forecasting of crop harvest can trigger a cross-hemispheric production response and improve global food security. Commun. Earth Environ. 4:334. doi: 10.1038/s43247-023-00992-2
Tang, Y., Bai, S., and Tang, J. (2015). Study on influencing factors of food security in China based on historical data from 1978 to 2013. Stu. Sociol. Sci. 6, 18–25. doi: 10.3968/7469
Valaskova, K., Nagy, M., and Grecu, G. (2024). Digital twin simulation modeling, artificial intelligence-based internet of manufacturing things systems, and virtual machine and cognitive computing algorithms in the industry 4.0-based Slovak labor market. Oeconomia Copernicana 15, 95–143. doi: 10.24136/oc.2814
Vochozka, M., Horák, J., Krulický, T., and Pardal, P. (2020a). Predicting future Brent oil price on global markets. Acta Montan. Slovaca 25, 375–392. doi: 10.46544/AMS.v25i3.10
Vochozka, M., Rowland, Z., Suler, P., and Marousek, J. (2020b). The influence of the international price of oil on the value of the EUR/USD exchange rate. J. Compet. 12, 167–190. doi: 10.7441/joc.2020.02.10
Wang, J., Zhang, Z., and Liu, Y. (2018). Spatial shifts in grain production increases in China and implications for food security. Land Use Policy 74, 204–213. doi: 10.1016/j.landusepol.2017.11.037
World Health Organization (2023). The state of food security and nutrition in the world 2023: urbanization, agrifood systems transformation and healthy diets across the rural–urban continuum. Geneva: World Health Organization.
Wu, Y., Yuan, C., Liu, Z., Wu, H., and Wei, X. (2023). Decoupling relationship between the non-grain production and intensification of cultivated land in China based on Tapio decoupling model. J. Clean. Prod. 424:138800. doi: 10.1016/j.jclepro.2023.138800
Yang, T. (2022). Comparative analysis of China-US grain security policies from the Russia-Ukraine conflict. 2022 5th international conference on humanities education and social sciences (ICHESS 2022). Amsterdam: Atlantis Press.
Zhang, Q., Achal, V., Xu, Y., and Xiang, W. N. (2014). Aquaculture wastewater quality improvement by water spinach (Ipomoea aquatica Forsskal) floating bed and ecological benefit assessment in ecological agriculture district. Aquac. Eng. 60, 48–55. doi: 10.1016/j.aquaeng.2014.04.002
Zhang, X., Wang, Y., Bao, J., and Wei, T. (2022). A research on the evaluation of China’s food security under the perspective of sustainable development—based on an entropy weight TOPSIS model. Agriculture 12:1926. doi: 10.3390/agriculture12111926
Zhong, T., Qian, Z., Huang, X., Zhao, Y., Zhou, Y., and Zhao, Z. (2018). Impact of the top-down quota-oriented farmland preservation planning on the change of urban land-use intensity in China. Habitat Int. 77, 71–79. doi: 10.1016/j.habitatint.2017.12.013
Keywords: food security, entropy, window two-stage DDF model, dynamic efficiency, nutritional sustainability
Citation: Fang Z, Xiao Q and Gao Y (2024) Impact of major emergencies on zero hunger, achieving food security, and improving nutrition. Front. Sustain. Food Syst. 8:1408454. doi: 10.3389/fsufs.2024.1408454
Edited by:
Hamid El Bilali, International Centre for Advanced Mediterranean Agronomic Studies, ItalyReviewed by:
Stanislav Škapa, Brno University of Technology, CzechiaYounas Khan, Kohat University of Science and Technology, Pakistan
Copyright © 2024 Fang, Xiao and Gao. This is an open-access article distributed under the terms of the Creative Commons Attribution License (CC BY). The use, distribution or reproduction in other forums is permitted, provided the original author(s) and the copyright owner(s) are credited and that the original publication in this journal is cited, in accordance with accepted academic practice. No use, distribution or reproduction is permitted which does not comply with these terms.
*Correspondence: Zhong Fang, ZmF6aG9uZzAyQGZqbnUuZWR1LmNu
 Zhong Fang
 Qiqi Xiao2