- 1School of Business, North Minzu University, Yinchuan, China
- 2Faculty of Economics, Chiang Mai University, Chiang Mai, Thailand
- 3School of Economics, Shandong University of Finance and Economics, Jinan, China
This study employs the stochastic frontier model (SFM) to analyze trade potential and efficiency in wheat and maize among Belt and Road Initiative (BRI) countries from 2002 to 2021, encompassing 45 countries for wheat trade and 55 for maize trade. The empirical findings reveal that economic development level, population growth, government efficiency, political stability, and regulatory quality are critical determinants of trade efficiency. Notably, World Trade Organization (WTO) membership exhibits a negative correlation with trade efficiency, potentially reflecting challenges in rule implementation and opportunity utilization among member states. In the context of maize trade, increased arable land area is inversely associated with efficiency, suggesting potential issues in managing large-scale agricultural regions or optimizing land use. The BRI’s impact on trade efficiency varies across countries, with Turkey and Hungary showing improved wheat trade efficiency, while Ethiopia and Georgia experienced declines. During the COVID-19 pandemic, effective disease management strategies and diversified trade mechanisms significantly influenced trade efficiency. Furthermore, the study reveals that larger economies do not necessarily outperform small and medium-sized economies in terms of trade potential. These findings contribute significantly to the literature on agricultural trade and offer valuable insights for policymakers, emphasizing the importance of enhancing government efficiency, political stability, and regulatory quality in the context of regional economic development initiatives such as the BRI. This research underscores the need for tailored approaches to trade policy and agricultural management, considering the unique characteristics and challenges faced by different economies along BRI.
1 Introduction
Agricultural trade plays a crucial role in promoting regional development and ensuring food security, particularly in the context of China’s trade with Belt and Road Initiative (BRI) countries. The BRI, launched in 2013, is a significant effort by China to promote inter-regional economic development, and the initiative aims to facilitate trade and investment in the countries involved, fostering economic development not only in China but also in its partner countries (Görg and Mao, 2022; Fan, 2023). The initiative supports free trade, connects economies worldwide through regional cooperation, and promotes the close connection of China’s foreign direct investment (FDI) and import and export trade with countries along the BRI (Gao et al., 2022). This global initiative lays the foundation for strengthening agricultural trade, which is crucial for the economic stability and development of the countries participating in the BRI.
In the realm of agricultural economics, the trade of grain crops holds a pivotal position, underpinning the global food supply chain and influencing economic stability across nations. Agricultural efficiency is crucial for ensuring food security and generating income (Cai et al., 2024). The significance of grain crops trade extends beyond mere commodity exchange; it is a critical component in ensuring food security, stabilizing food prices, and facilitating the equitable distribution of food resources worldwide. Grain crops, including wheat, maize, rice, and soybeans, represent the backbone of global agriculture, providing essential nutrients to billions of people. Their trade patterns reflect complex interactions between national agricultural policies, global market dynamics, and environmental factors, highlighting the necessity for a nuanced understanding of grain trade’s economic and policy implications (Cao and Yuan, 2022; Rathore et al., 2023). In the global agricultural sector, wheat and maize are paramount to the food trade, serving as fundamental staples for billions worldwide. Compared to other corps, the study of wheat and maize’s trade potential holds greater significance due to their foundational role in global food security and their substantial impact on the agricultural economy. Data from the Food and Agriculture Organization (FAO) reveal that wheat and maize collectively account for a significant portion of the world’s grain trade, underscoring their pivotal role in global food systems. Specifically, the international trade volume for wheat reached approximately 184 million tonnes in 2020, while maize trade was close to 163 million tonnes in the same year, highlighting the massive scale at which these grains circulate globally (Food and Agriculture Organization of the United Nations (FAO), 2021, 2023). This extensive trade volume indicates not just the global reliance on wheat and maize as staple foods but also their importance in the agricultural trade market. Countries across various continents depend on the importation of these crops to meet their domestic food demands, illustrating a global interdependence that underscores the strategic significance of wheat and maize trade. For instance, major wheat-importing countries include Egypt, Indonesia, and Algeria, whereas significant maize imports are seen in countries like Japan, Mexico, and South Korea, reflecting a diverse geographic reliance on these grains (United States Department of Agriculture (USDA), 2021, 2023). Furthermore, The Arab world imports large quantities of wheat and maize through virtual water trade (VWT), which is crucial not only for ensuring regional food security but also for significantly promoting the conservation of water resources and arable land. Egypt, as the main importing country, saves 13.1 billion cubic meters of irrigation water and 2.1 million hectares of crop area annually through these imports, highlighting the central role of these crops in regional resource management.(Lee et al., 2018). Moreover, China’s strategic economic investments in wheat and maize imports, amounting to billions of dollars, underscore the critical importance of these crops in meeting the country’s growing food demand and ensuring national food security (Shahzad et al., 2019). This global dependence on wheat and maize trade underscores the importance of exploring their trade dynamics, as they influence food security policies, international trade agreements, and national economic strategies more profoundly than many other crops. In conclusion, wheat and maize trade plays a vital role in the global agricultural economy and food security. Understanding the dynamics and implications of their trade is essential for informing policy decisions and ensuring the stability and sustainability of the global food supply.
The literature on grain crops trade encompasses various crucial aspects, including the impact of international trade on introducing nonindigenous organisms into new habitats (Shimono and Konuma, 2008), the influence of genetic and environmental factors on crop yield, particularly for wheat (Brinton et al., 2017), the increasing global production of grain legumes owing to their diverse applications (Sinclair and Vadez, 2012), and the importance of forecasting agricultural commodity prices, such as widely consumed grains in Nigeria, which is essential for informed decision-making within the agricultural sector (Sanusi et al., 2022). Among these areas of study, the trade potential of grain crops, facilitated by the application of advanced econometric models like the stochastic frontier model (SFM), has emerged as a key area of interest. The application of SFM to examine the determinants of agricultural exports in Pakistan revealed potential for increased exports to neighboring countries, the Middle East, and European nations (Atif et al., 2017). Nguyen’s (2022) research employed SFM to investigate the “behind-the-border” constraints affecting Vietnam’s rice and coffee exports, demonstrating significant impacts on achieving full export potential and indicating opportunities for expanding exports within the Association of Southeast Asian Nations (ASEAN) as well as with the European Union and countries under the Comprehensive and Progressive Agreement for Trans-Pacific Partnership (CPTPP). Abdullahi et al. (2022) utilized the stochastic frontier gravity model to examine the determinants positively influencing China’s agricultural exports, the study finds that factors such as China’s economic size, the BRI framework, common borders, and linguistic similarities play pivotal roles in enhancing China’s agricultural export flows. Kamal et al. (2020) utilized the SFGM to clarify the variation in trade between partner countries, while Abdullahi et al. (2021) focused on the determinants, efficiency, and potential of agri-food exports from Nigeria to the EU using the SFGM. Additionally, Tian (2023) employed the time-varying SFGM to measure China’s trade expansion space and other countries’ agricultural import dependence. These studies demonstrate the versatility of the SFGM in assessing agricultural trade efficiency across different regions and trade relationships. Furthermore, the SFGM has been employed to explore the prospective efficiency gains in trade arising from the liberalization of agricultural commerce, as investigated by Moon (2022). Building upon the existing literature, this study addresses a significant gap by examining the trade potential and efficiency of wheat and maize within the Belt and Road Initiative (BRI) framework. While the stochastic frontier model (SFM) has been widely employed in various trade studies, research specifically focusing on agricultural commodities in BRI countries remains limited. This paper applies SFM methodology to quantify trade efficiency and potential, identify factors influencing efficiency, and analyze variations among different countries. By concentrating on these key agricultural commodities within the BRI context, this research aims to enhance understanding of their trade dynamics and offer valuable insights for policymakers and stakeholders in the agricultural sector. The findings of this study contribute to the growing body of literature on agricultural trade within the BRI framework and provide empirical evidence to inform policy decisions in this critical area of international commerce.
Building upon this foundation and addressing the identified research gap, this study makes several noteworthy contributions to the existing body of literature. Firstly, it presents a thorough analysis of the trade potential and efficiency of wheat and maize among the Belt and Road Initiative (BRI) countries by utilizing the stochastic frontier model (SFM) to quantify trade efficiency and identify the factors that influence it. Secondly, the research underscores the importance of economic scale, market potential, government efficiency, political stability, and regulatory quality in enhancing trade efficiency while also examining the intricate relationship between World Trade Organization (WTO) membership and trade efficiency. Thirdly, the study uncovers disparities in the trade potential of wheat and maize across various countries, suggesting that higher domestic production levels may reduce the need for imports; however, international trade remains crucial for global food security. The findings provide valuable insights for developing effective agricultural trade policies and fostering regional economic growth, emphasizing the significance of improving government efficiency, political stability, and regulatory quality to increase trade efficiency. Lastly, by focusing on wheat and maize, this study contributes to a more profound understanding of the trade dynamics of these essential agricultural commodities within the BRI framework, paving the way for further research on the factors that influence trade efficiency.
The rest of the paper is organized as follows: section 2 presents the methodology, detailing the selection of BRI countries for the sample, the choice of agricultural products for analysis, and the construction of the stochastic frontier and trade inefficiency models. Section 3 delves into the results and their implications, exploring the complexities of agricultural trade within the BRI framework. The concluding sections, 4 and 5, summarize the main findings and discuss the implications of the research, highlighting the agricultural trade potential in BRI countries and suggesting ways to enhance cooperation and optimize trade strategies, with an emphasis on the importance of improving government efficiency, political stability, and regulatory quality to significantly boost trade efficiency. Through the application of SFM, this study offers a fresh perspective and methodology for understanding and improving agricultural trade efficiency.
2 The data and methods
2.1 Sample size and data sources
This study covers 45 countries for wheat, and 55 countries for maize. We initially considered all countries participating in the Belt and Road Initiative. However, due to limitations in data availability and consistency from 2002 to 2021, we restricted our sample to countries where reliable and consistent data on agricultural trade, economic indicators, and governance quality could be obtained for the period under study. This study builds upon previous comprehensive agricultural product research by focusing specifically on wheat and maize, two crops of paramount importance in global agriculture and trade. To analyze the efficiency and potential of agricultural trade in countries along the Belt and Road, both wheat and maize were selected due to their significance in global trade and food security. Wheat is a staple food and a major agricultural product in many countries, making it a crucial commodity for trade and food security (Zhang et al., 2022). Additionally, the trade of wheat has been identified as a key component of international agricultural negotiations, such as the Belt and Road Initiative, to enhance global food security (Zhang et al., 2022). With regard to maize, its importance is equally significant. For instance, research conducted in Kupang District indicates the market dominance of Lamuru maize seed farming, showing its economic value and market growth potential (Bria and Joka, 2023). Efficiency in input practices, such as land use, has been identified as a key factor in increasing maize production, potentially mitigating the need for land expansion (Edison, 2021). Additionally, the cultivation of vegetable (sweet) maize varieties as a primary crop has been explored, highlighting the crop’s versatility (Sanaev et al., 2020). These findings collectively emphasize the critical role of wheat and maize in agricultural trade dynamics and underscore the necessity to ensure their sustainability and efficiency in trade relations.
The influencing factors in agricultural trade potential analysis in the Belt and Road countries are multifaceted and encompass various dimensions. Cultural and institutional distance, trade facilitation, reduction of tariff barriers, and trade network structure are significant factors affecting agricultural trade between China and the Belt and Road countries (Liu et al., 2020; Fan et al., 2022; Yang and Tsai, 2022; Zhang et al., 2022). The efficiency of China’s agricultural exports is also determined by a mix of economic indicators including per capita GDP, exchange rate fluctuations, geographic distance, and the landlocked nature of certain regions (Abdullahi et al., 2022; Khan et al., 2024). Additionally, the strategic economic partnerships, exchange rate policy, and the development level of geo-economic relations play crucial roles in shaping agricultural trade dynamics (Muganyi and Chen, 2016; Hu et al., 2020). Moreover, research indicates that the Belt and Road Initiative (BRI) has led to an expansion in the scale of agricultural trade in BRI countries, highlighting the initiative’s impact on trade potential (Wang et al., 2022).
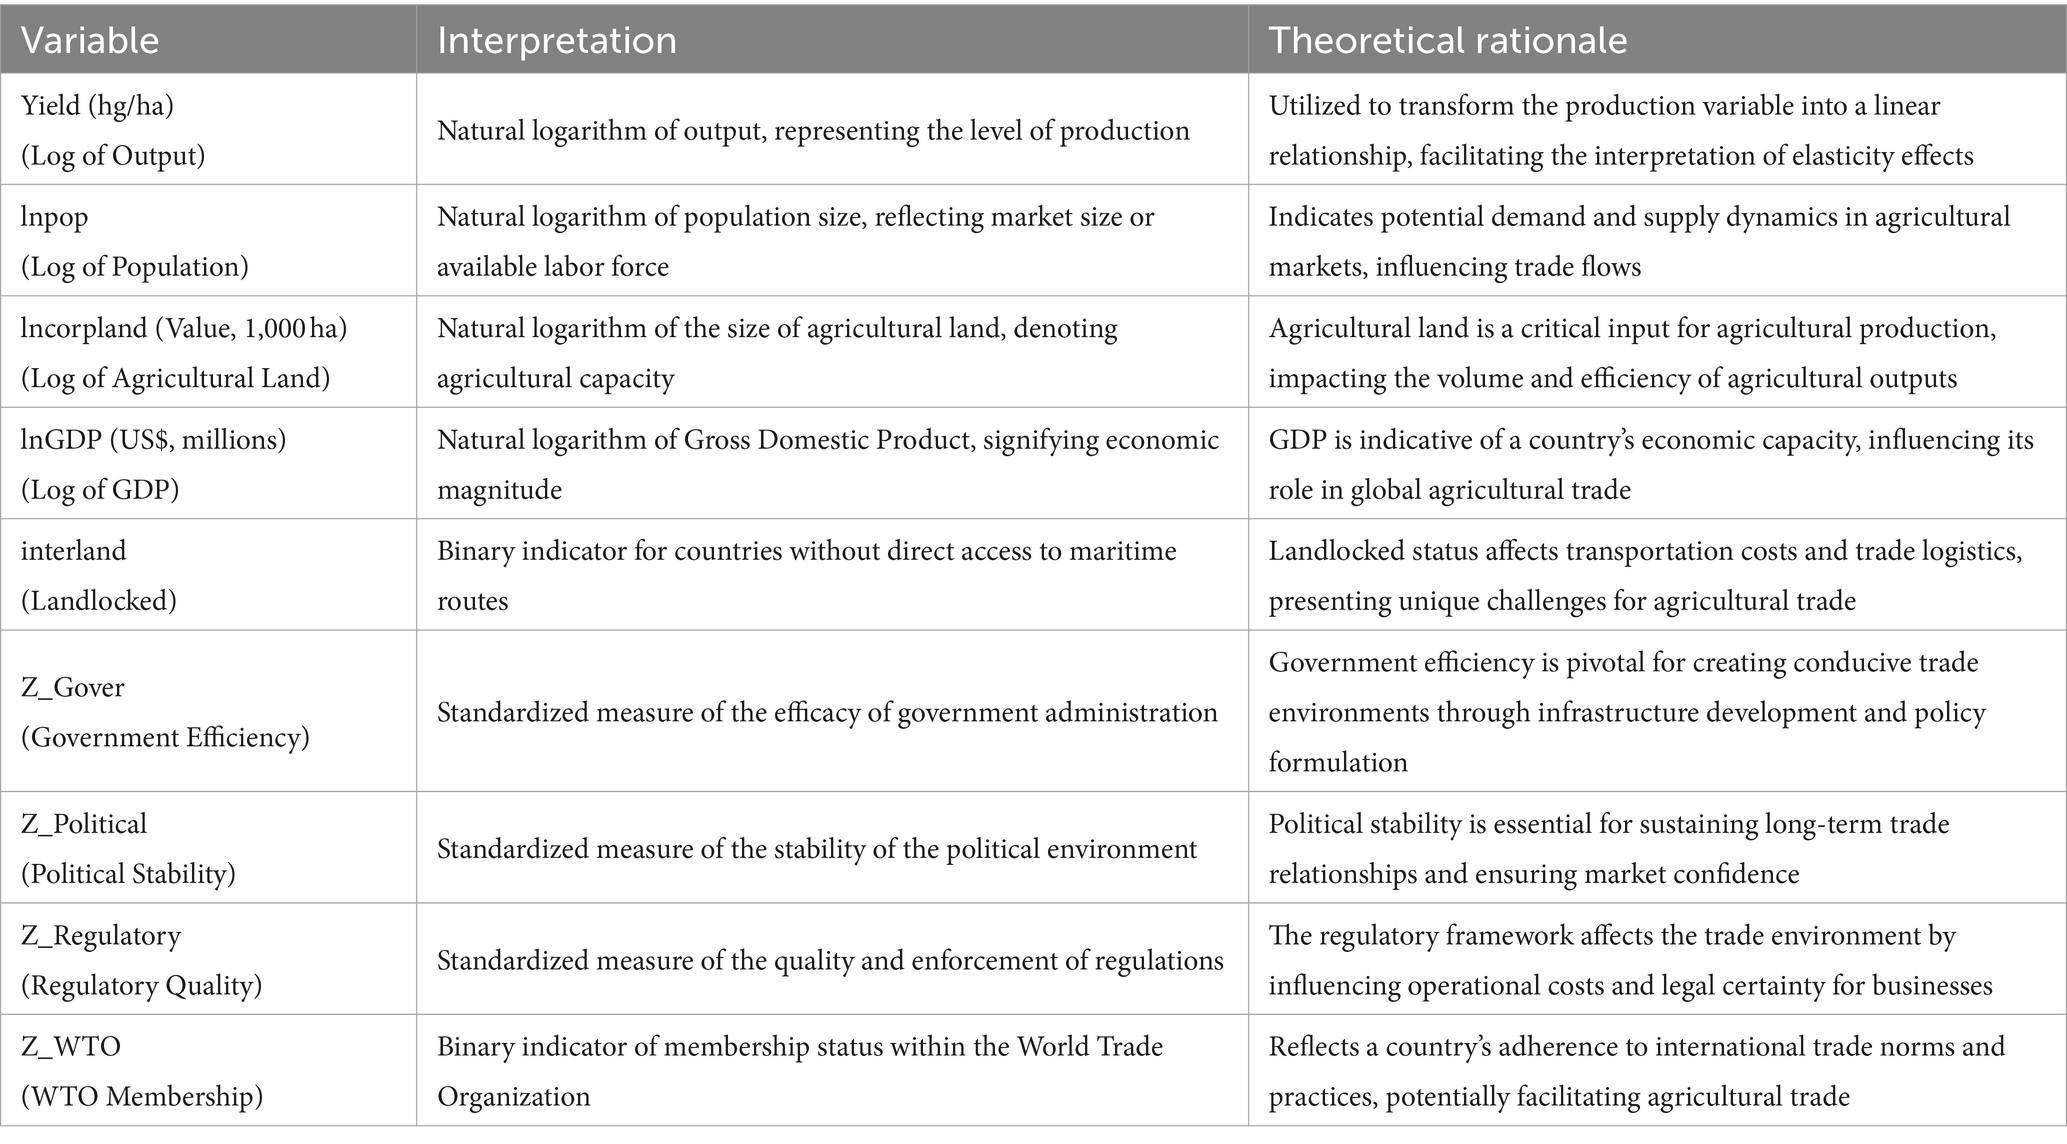
This study draws upon a diverse array of reliable data sources to ensure a comprehensive analysis. The World Food and Agriculture Organization (FAO) database provided essential agricultural trade metrics, including yield, population, agricultural land, and GDP figures. To account for geographical factors, information on landlocked countries was sourced from publicly available geographical data. The World Bank’s Worldwide Governance Indicators (WGI) database supplied crucial governance metrics, specifically focusing on government efficiency, political stability, and regulatory quality. Additionally, World Trade Organization (WTO) membership status was obtained from the official World Trade Organization (WTO) website. Table 1 presents the names, interpretations, and theoretical rationales of the various variables.
2.2 Model setting
The stochastic frontier model (SFM) is primarily used to analyze and estimate trade efficiency and the potential of agricultural trade flows, considering a combination of both traditional gravity variables such as the economic size of bilateral countries, population, distance, and whether they are landlocked, as well as inefficiency factors such as government efficiency, political stability, regulatory quality, and free trade agreements. Armstrong (2007) pointed out that in the stochastic frontier model, objective variables that do not change in the short term over time, such as the economic size of bilateral countries, population, distance, and whether they are landlocked, are mainly taken into account, while human factors such as government efficiency, political stability, regulatory quality, and free trade agreements are incorporated into the trade inefficiency model. Furthermore, Romyen et al. (2023) used a copula-based gravity stochastic frontier model (GSFM) to estimate trade efficiency under free trade agreements for Thailand’s agricultural exports. Abdullahi et al. (2022) examined the determinants and efficiency of China’s agricultural exports with its 114 importing countries using the SFGM, applied to an augmented gravity model. Additionally, Chu (2023) utilized the SFGM to explore the impact of digital trade on China’s trade potential and trade efficiency with countries participating in the Belt and Road Initiative.
The selection of variables such as yield, population size, arable land area, GDP, geographical characteristics, WTO membership, government efficiency, political stability, and regulatory quality is based on their relevance to capturing the multifaceted aspects of trade efficiency. Yield and arable land area are used to capture the agricultural capacity of the countries, while GDP and population size reflect economic and market potential. The inclusion of geographical characteristics and WTO membership provides insights into the logistical and regulatory environments that significantly impact trade efficiency. Moreover, government efficiency, political stability, and regulatory quality are incorporated to account for the institutional factors that influence trade performance. Based on these variables, this paper constructs a stochastic frontier model to analyze agricultural trade flows.
where i represents a given country around the world, this econometric model evaluates the efficiency of imports from country i at time t, encapsulated by the natural logarithm of projected import volumes, ln (IMP)it. The model gauges the maximum possible trade value by integrating a host of explanatory variables: ln(Yield) represents the natural logarithm of agricultural output, providing insight into the productivity and potential of crop production; ln(POP) stands for the natural logarithm of population size, which can influence demand within the trade equation; ln(GDP) denotes the natural logarithm of economic size; ln(Corpland) measures the natural logarithm of the amount of arable land, reflecting the capacity for grain crop production; Gov and PolStab are the governance and political stability respectively, indicating how governance quality and political stability can impact trade flows; RegQual indicates the natural logarithm of country i’s regulatory quality at time t, a standardized measure of the quality and enforcement of regulations, and WTO signifies World Trade Organization membership, both of which can shape trade policies and conditions. The model also accounts for stochastic disturbances through vit, capturing random shocks, and includes an inefficiency term uit, which adjusts for specific, time-invariant characteristics in trade relations, providing a nuanced understanding of import efficiency and potential across different nations.
3 Empirical results
3.1 Estimated results
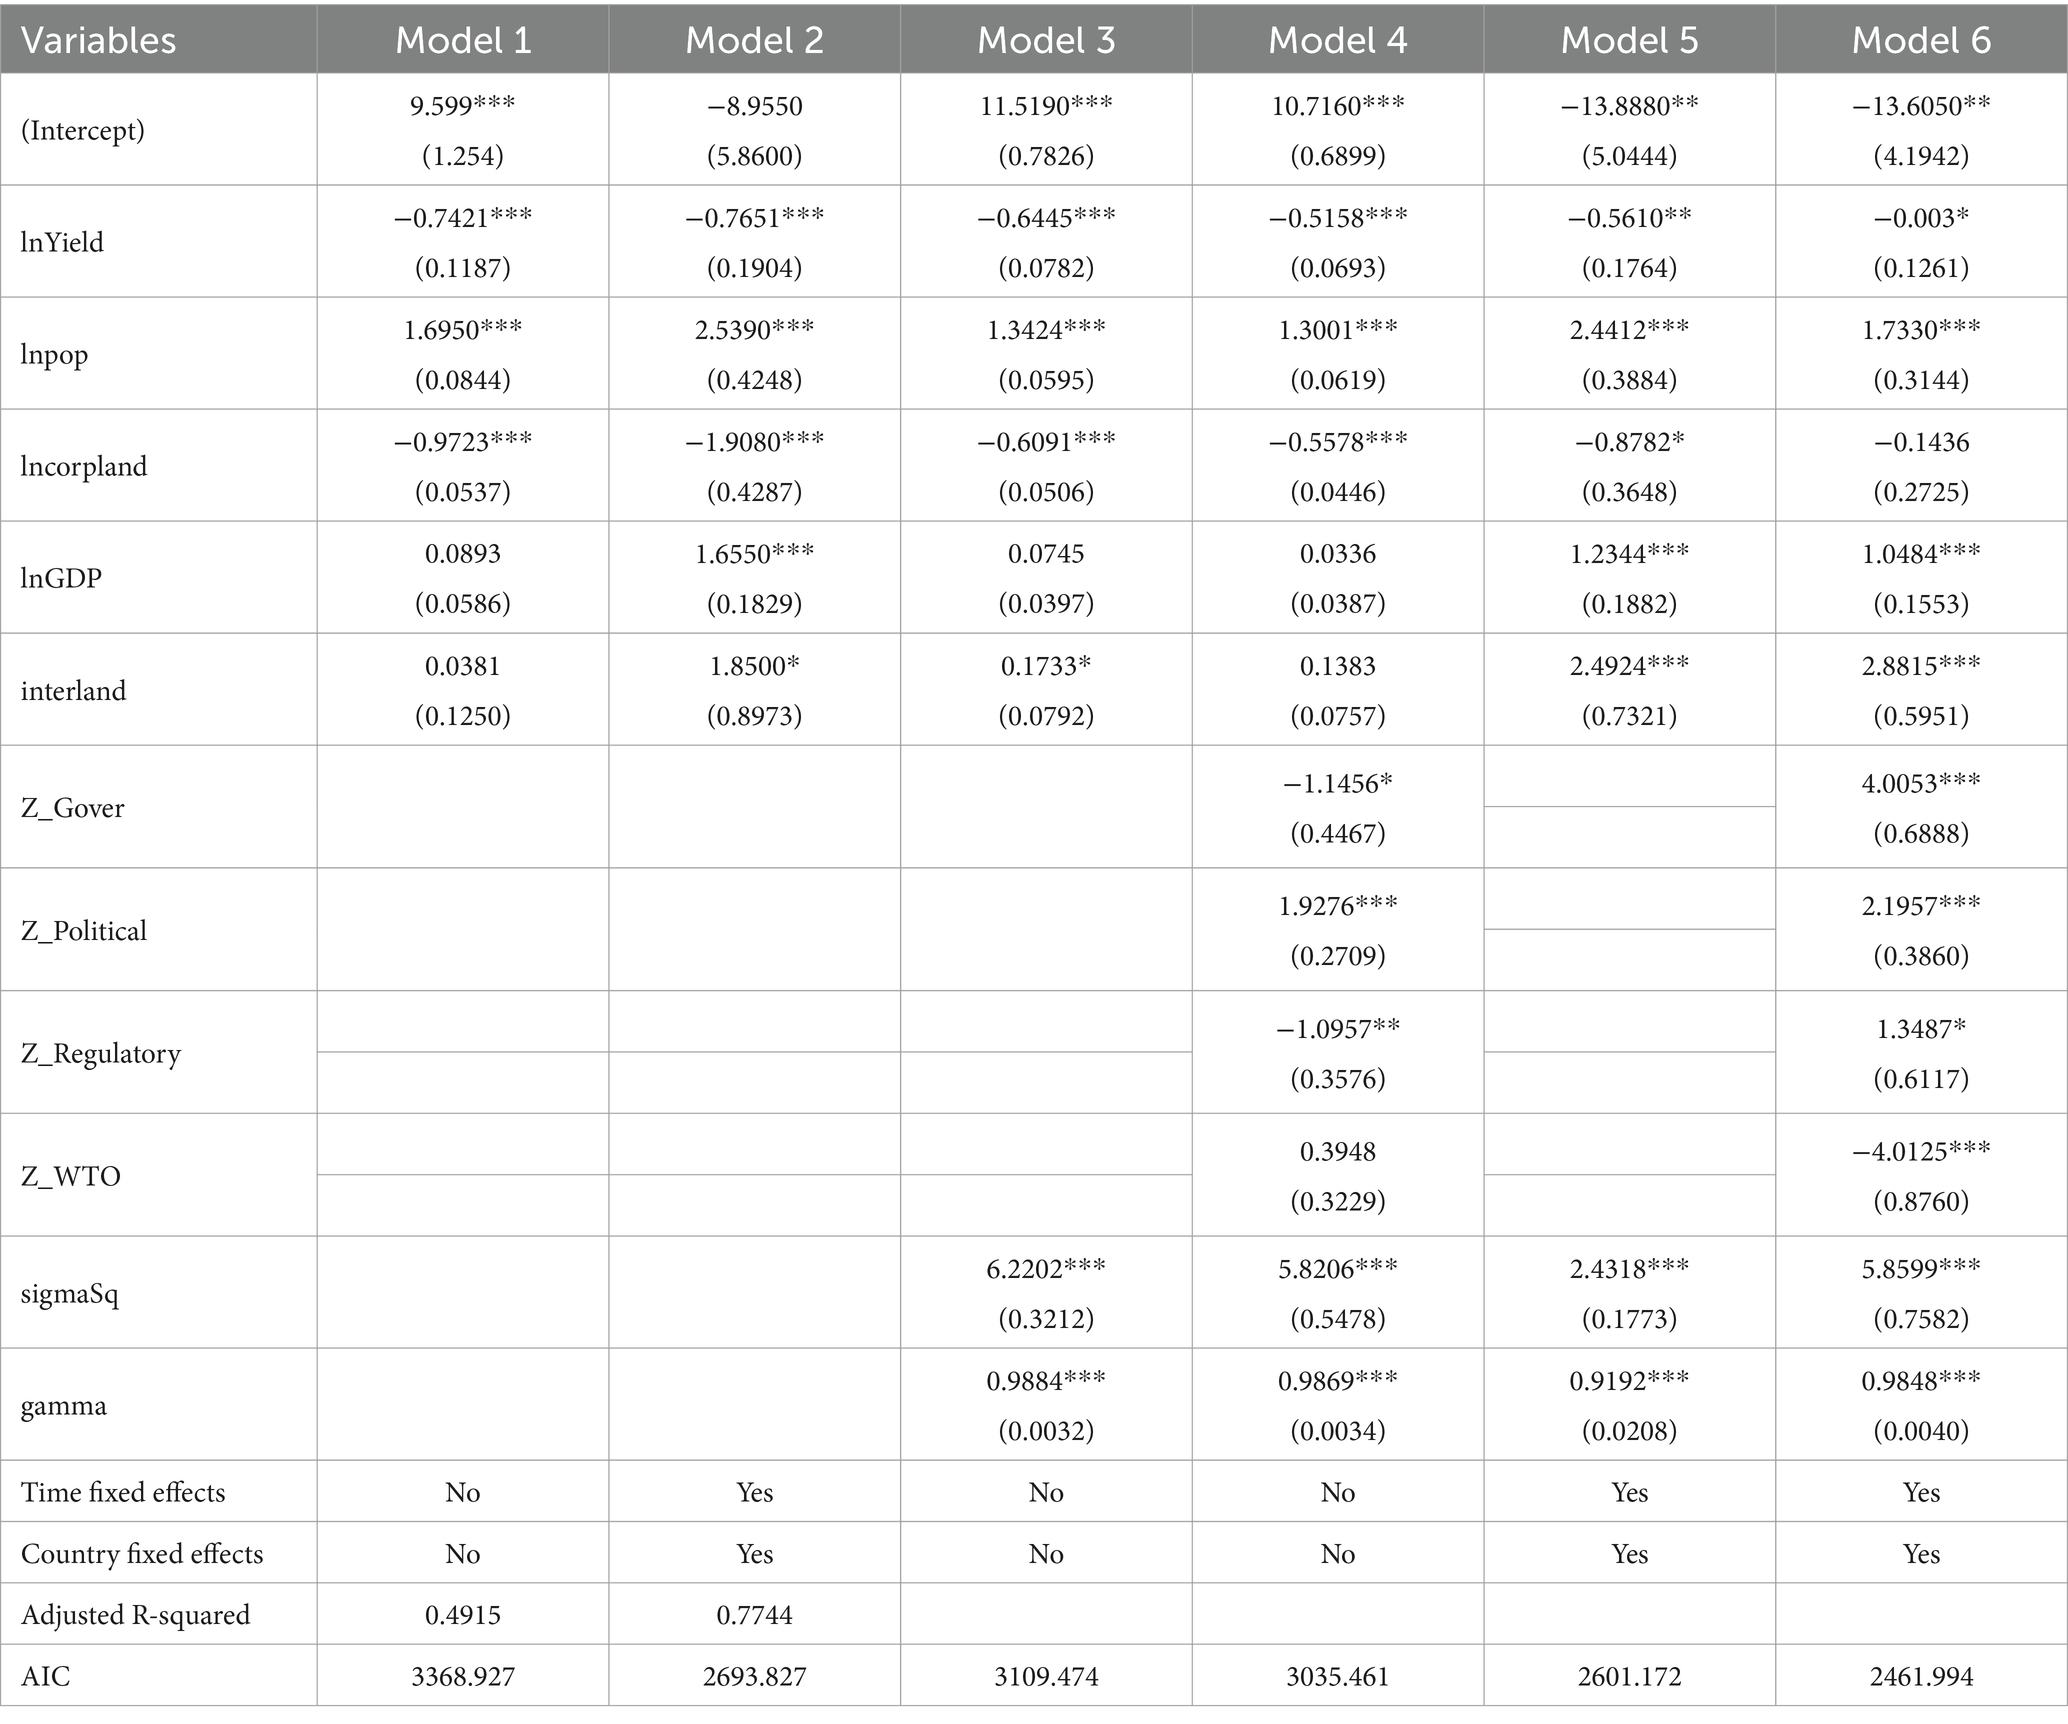
The empirical results of stochastic frontier models are presented in Tables 2, 3, to uncover the details and trends of influencing factors. Table 2 presents the estimated results of six stochastic frontier models for wheat. Each model assesses the efficiency of wheat trade based on a variety of variables and assumptions. By comparing the Akaike information criterion (AIC) values across these models, we can evaluate which model most effectively explains the data. Model 6, with the lowest AIC value of 2461.994, suggests it offers the best fit to the data while accounting for model complexity. This model, incorporating both time fixed effects and country fixed effects, provides an in-depth analysis of the factors influencing the efficiency of wheat trade in countries along the “Belt and Road.” The slight negative impact of yield variation on trade efficiency (with a coefficient of −0.003 and a significance level of *) suggests that while an increase in yield might reduce dependence on international markets to some extent, it could also slightly decrease trade efficiency due to market saturation and increased costs of storage and transportation. This finding emphasizes the need to consider and balance the relationship between domestic supply and international trade when increasing yield, and to enhance trade efficiency by improving production efficiency rather than merely expanding cultivated areas. The coefficient for population size (lnpop) is 1.7330 (significance level ***), indicating that an increase in the logarithm of population size is positively correlated with wheat trade efficiency. This result may reflect the positive role of larger market size and consumption potential in enhancing trade efficiency. Similarly, the coefficient for GDP (lnGDP) is 1.0484 (significance level ***), indicating that the logarithmic growth of GDP has a positive impact on wheat trade efficiency, emphasizing the importance of economic development level in promoting trade efficiency. Notably, the coefficient for the “interland” (landlocked country) variable is 2.8815 (significance level ***), indicating a significant positive correlation between being a landlocked country and wheat trade efficiency. This may reflect that landlocked countries, facing unique geographical and logistical challenges, have taken effective measures to enhance trade efficiency, or they may focus more on strategies to improve trade efficiency due to geographical constraints.
Furthermore, Model 6 also shows that the coefficient for government efficiency (Z_Gover) is 4.0053 (significance level ***), the coefficient for political stability (Z_Political) is 2.1957 (significance level ***), and the coefficient for regulatory quality (Z_Regulatory) is 1.3487 (significance level *). These results highlight the important role of efficient government operations, stable political environments, and high-quality regulation in reducing transaction costs and risks, thereby enhancing trade efficiency. The coefficient for WTO membership is −4.0125 (significance level ***), indicating a significant negative correlation between WTO membership and wheat trade efficiency. This result may initially seem surprising, as WTO members are generally expected to increase their trade efficiency by promoting trade liberalization and providing a more stable and predictable trade environment. However, this negative correlation may reflect the challenges WTO members face in implementing WTO rules and commitments, especially for those countries that may lack the preparation or resources to adapt to rapid trade liberalization. Additionally, this may also indicate differences in trade efficiency among WTO members, where some countries may not fully utilize the opportunities provided by WTO membership due to various internal and external factors. Therefore, the impact of WTO membership on wheat trade efficiency is complex and multifaceted, requiring further research to deeply understand the underlying mechanisms. This includes considering the adaptation process of member countries after joining the WTO, their capacity in implementing trade policies, and how they utilize the WTO framework to enhance their trade efficiency.
By comprehensively considering these variables, Model 6 not only provides an in-depth understanding of the factors affecting wheat trade efficiency in countries along the “Belt and Road” but also ensures the robustness of the analysis results by controlling for time and country-specific fixed effects. This approach allows us to more accurately identify and assess the key factors influencing trade efficiency.
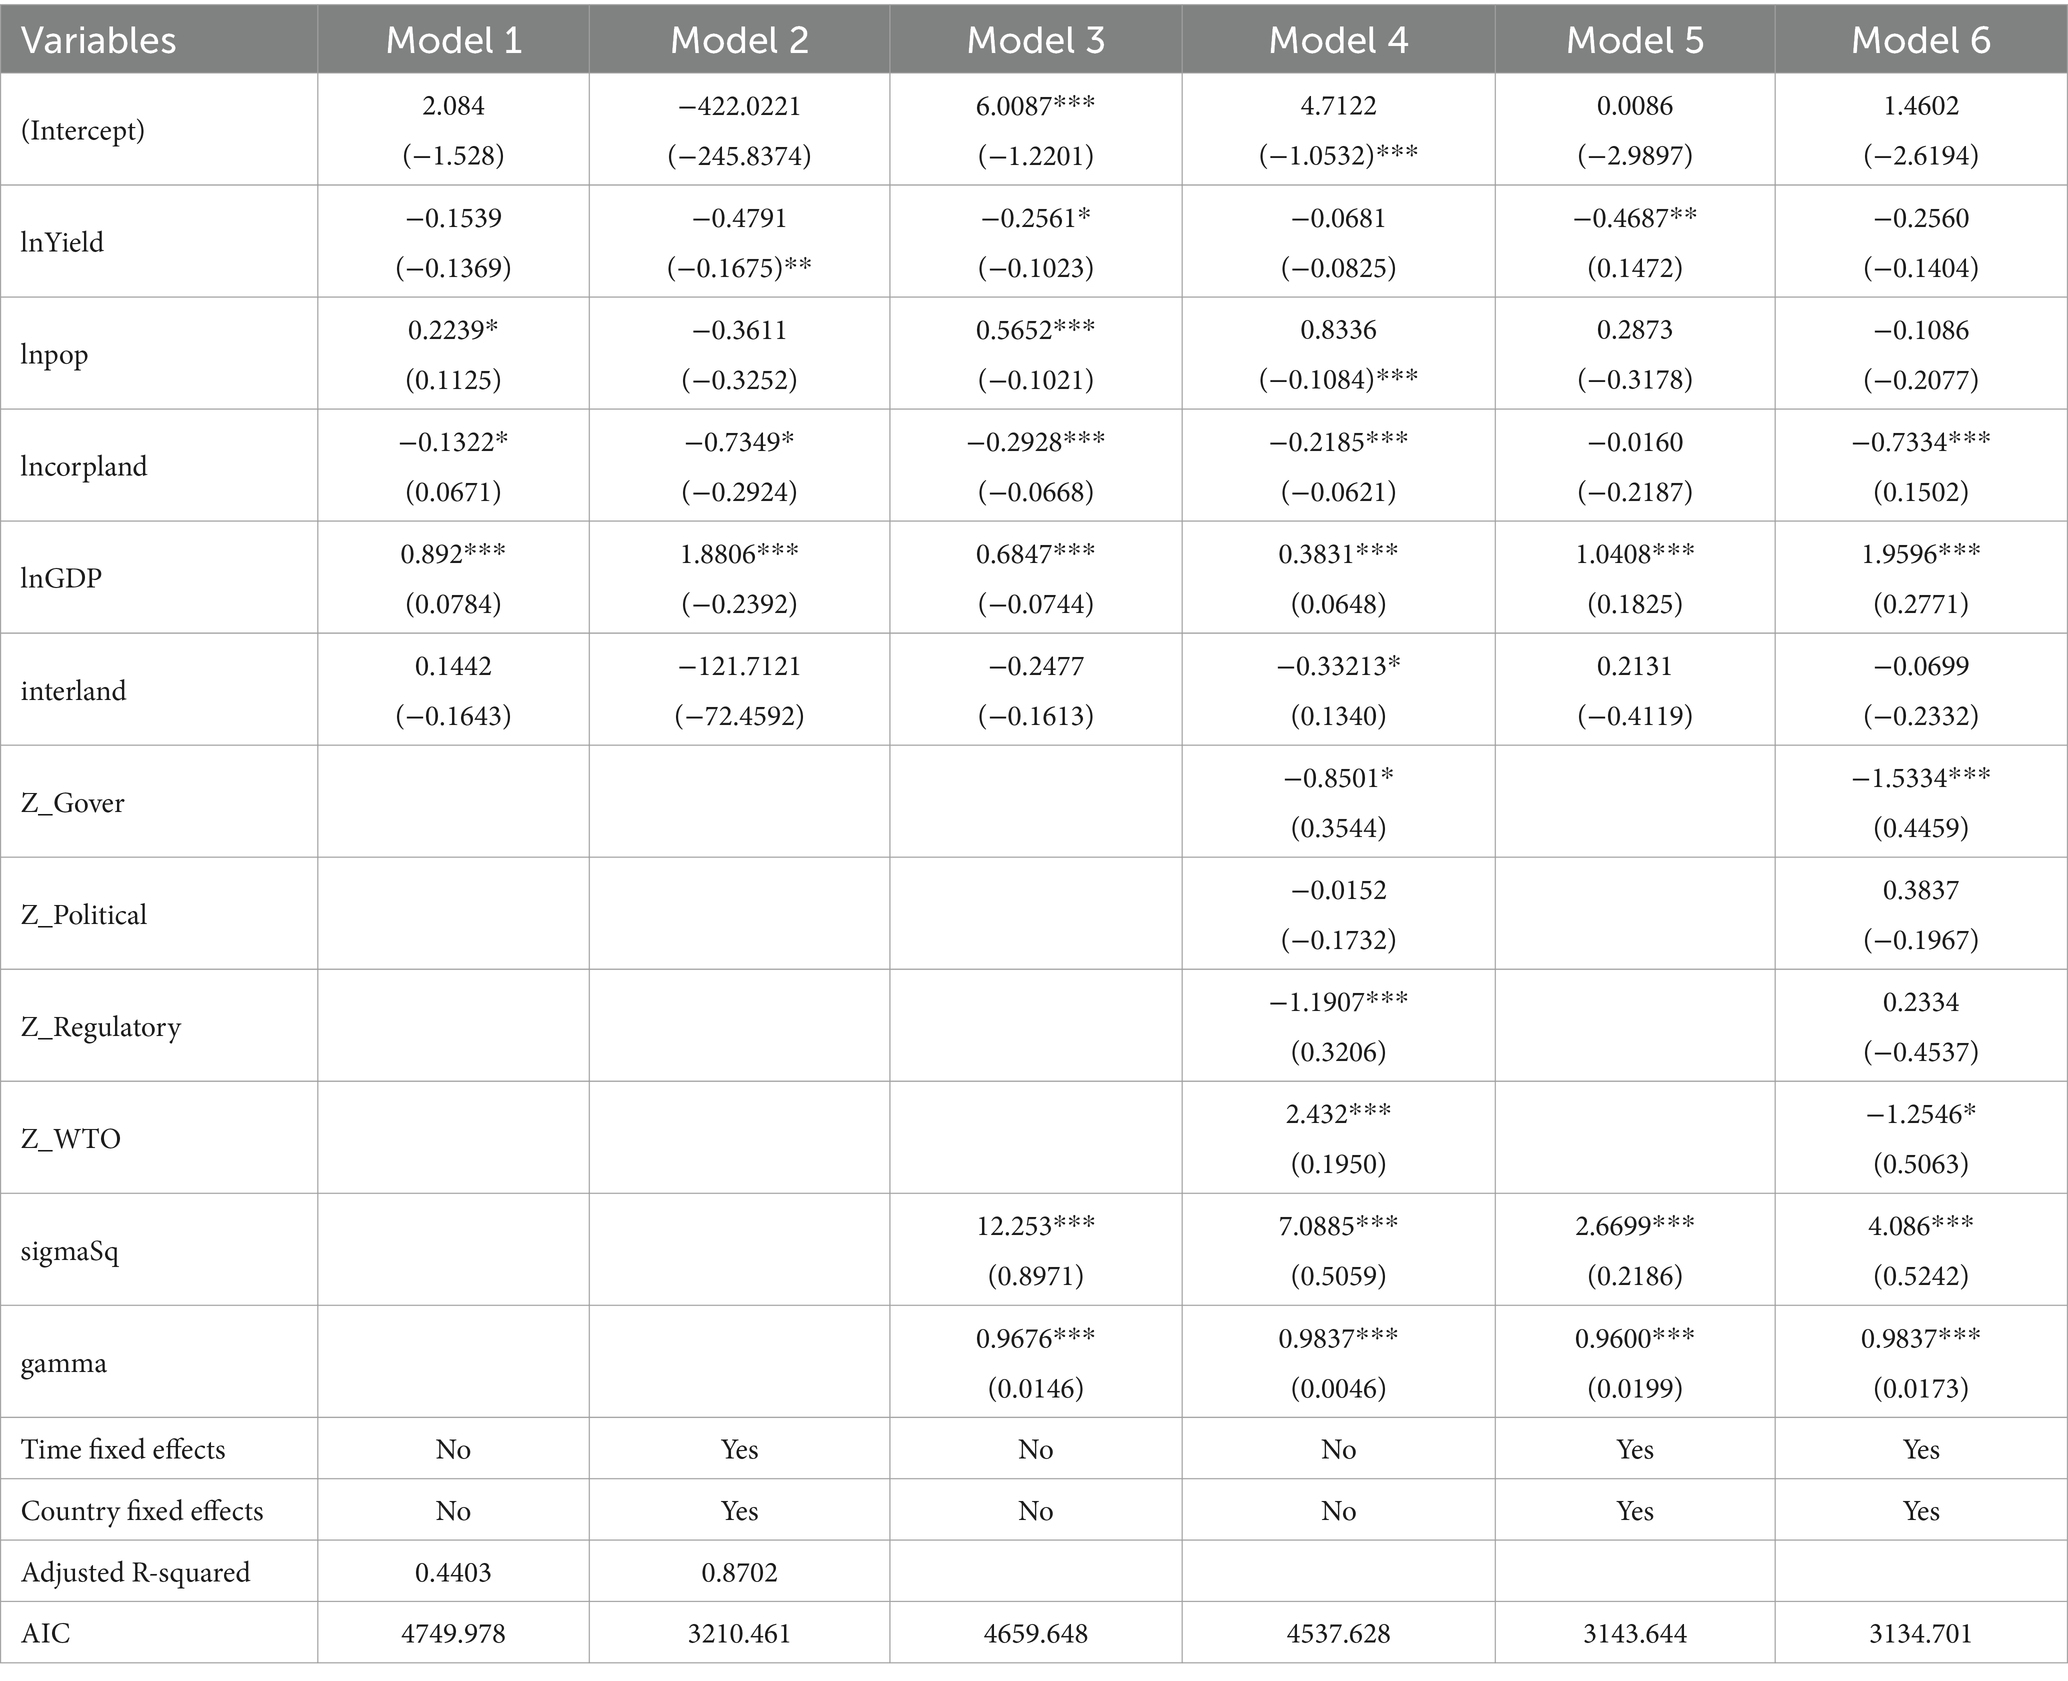
Table 3 presents the estimated results of six stochastic frontier models for maize. Model 6 provides an in-depth analysis of the factors affecting maize trade efficiency by incorporating both time fixed effects and country fixed effects, along with the lowest AIC value (3134.701). In Model 6, the coefficient for cultivated land area (lncorpland) is −0.7334 (significance level ***), indicating that an increase in the logarithm of cultivated land area is significantly negatively related to maize trade efficiency. This may reflect efficiency issues in managing larger agricultural areas or challenges in optimizing land use for trade purposes. The coefficient for GDP (lnGDP) is 1.9596 (significance level ***), showing that an increase in the logarithm of GDP positively affects maize trade efficiency. This highlights the importance of the level of economic development in promoting trade efficiency, where wealthier economies may have better infrastructure and systems to facilitate trade. Moreover, Model 6 also shows that the coefficient for government efficiency (Z_Gover) is −1.5334 (significance level ***), and the coefficient for WTO membership (Z_WTO) is −1.2546 (significance level *). These results highlight the complex role of governance, regulatory quality, and international trade agreements in influencing trade efficiency. The negative coefficients may indicate that, although these factors are crucial, challenges and efficiency issues need to be addressed to fully leverage their potential in enhancing trade efficiency. Therefore, the impact of these variables on maize trade efficiency is complex and multifaceted, requiring further research to deeply understand the mechanisms behind them. This includes considering how countries can optimize agricultural productivity, manage population growth, and improve governance and regulatory frameworks to enhance trade efficiency.
Tables 2, 3 respectively provide an analysis of the trade efficiency of wheat and maize from 2002 to 2021 under the “Belt and Road” initiative, conducted through six different models using stochastic frontier models. In the analysis of wheat trade efficiency, the results of Model 6 highlight the importance of the level of economic development, population size growth, as well as efficient government operations, stable political environments, and high-quality regulation in promoting trade efficiency. However, the impact of WTO membership on wheat trade efficiency shows a negative correlation, which might reflect the challenges WTO members face in implementing WTO rules and commitments. In the analysis of maize trade efficiency, an increase in the area of cultivated land is significantly negatively correlated with maize trade efficiency, reflecting potential efficiency issues in managing larger agricultural areas or optimizing land use for trade purposes. Additionally, the negative impacts of government efficiency and WTO membership on maize trade efficiency underscore the complex role of governance, regulatory quality, and international trade agreements in influencing trade efficiency. Therefore, the factors affecting the trade efficiency of wheat and maize are complex and multifaceted, necessitating further research to deeply understand the mechanisms behind them. This includes considering how to optimize agricultural productivity, manage population growth, and improve governance and regulatory frameworks to enhance trade efficiency.
Building on the insights from Tables 2, 3 regarding the trade efficiency of wheat and maize, Figure 1 compares the average efficiency of wheat and maize from 2002 to 2021, revealing that wheat’s efficiency, though fluctuating, generally exhibits a slight upward trend, peaking at 0.55 before slightly declining to 0.49 by 2021. In contrast, maize’s efficiency starts lower, shows some variability, but overall remains relatively stable, concluding at 0.37 in 2021, which is similar to initial value. This indicates that while both crops have seen efficiency fluctuations, wheat has experienced a modest improvement over the period, whereas maize’s efficiency has remained stable without a significant long-term increase. Further research would be necessary to examine factors influencing these trends, including shifts in agricultural practices, climate conditions, and technological advancements in farming. Such factors might encompass technological progress in agriculture, global climate pattern changes affecting crop yields, and shifts in market demand or agricultural policy.
3.2 Country-level trade efficiency results
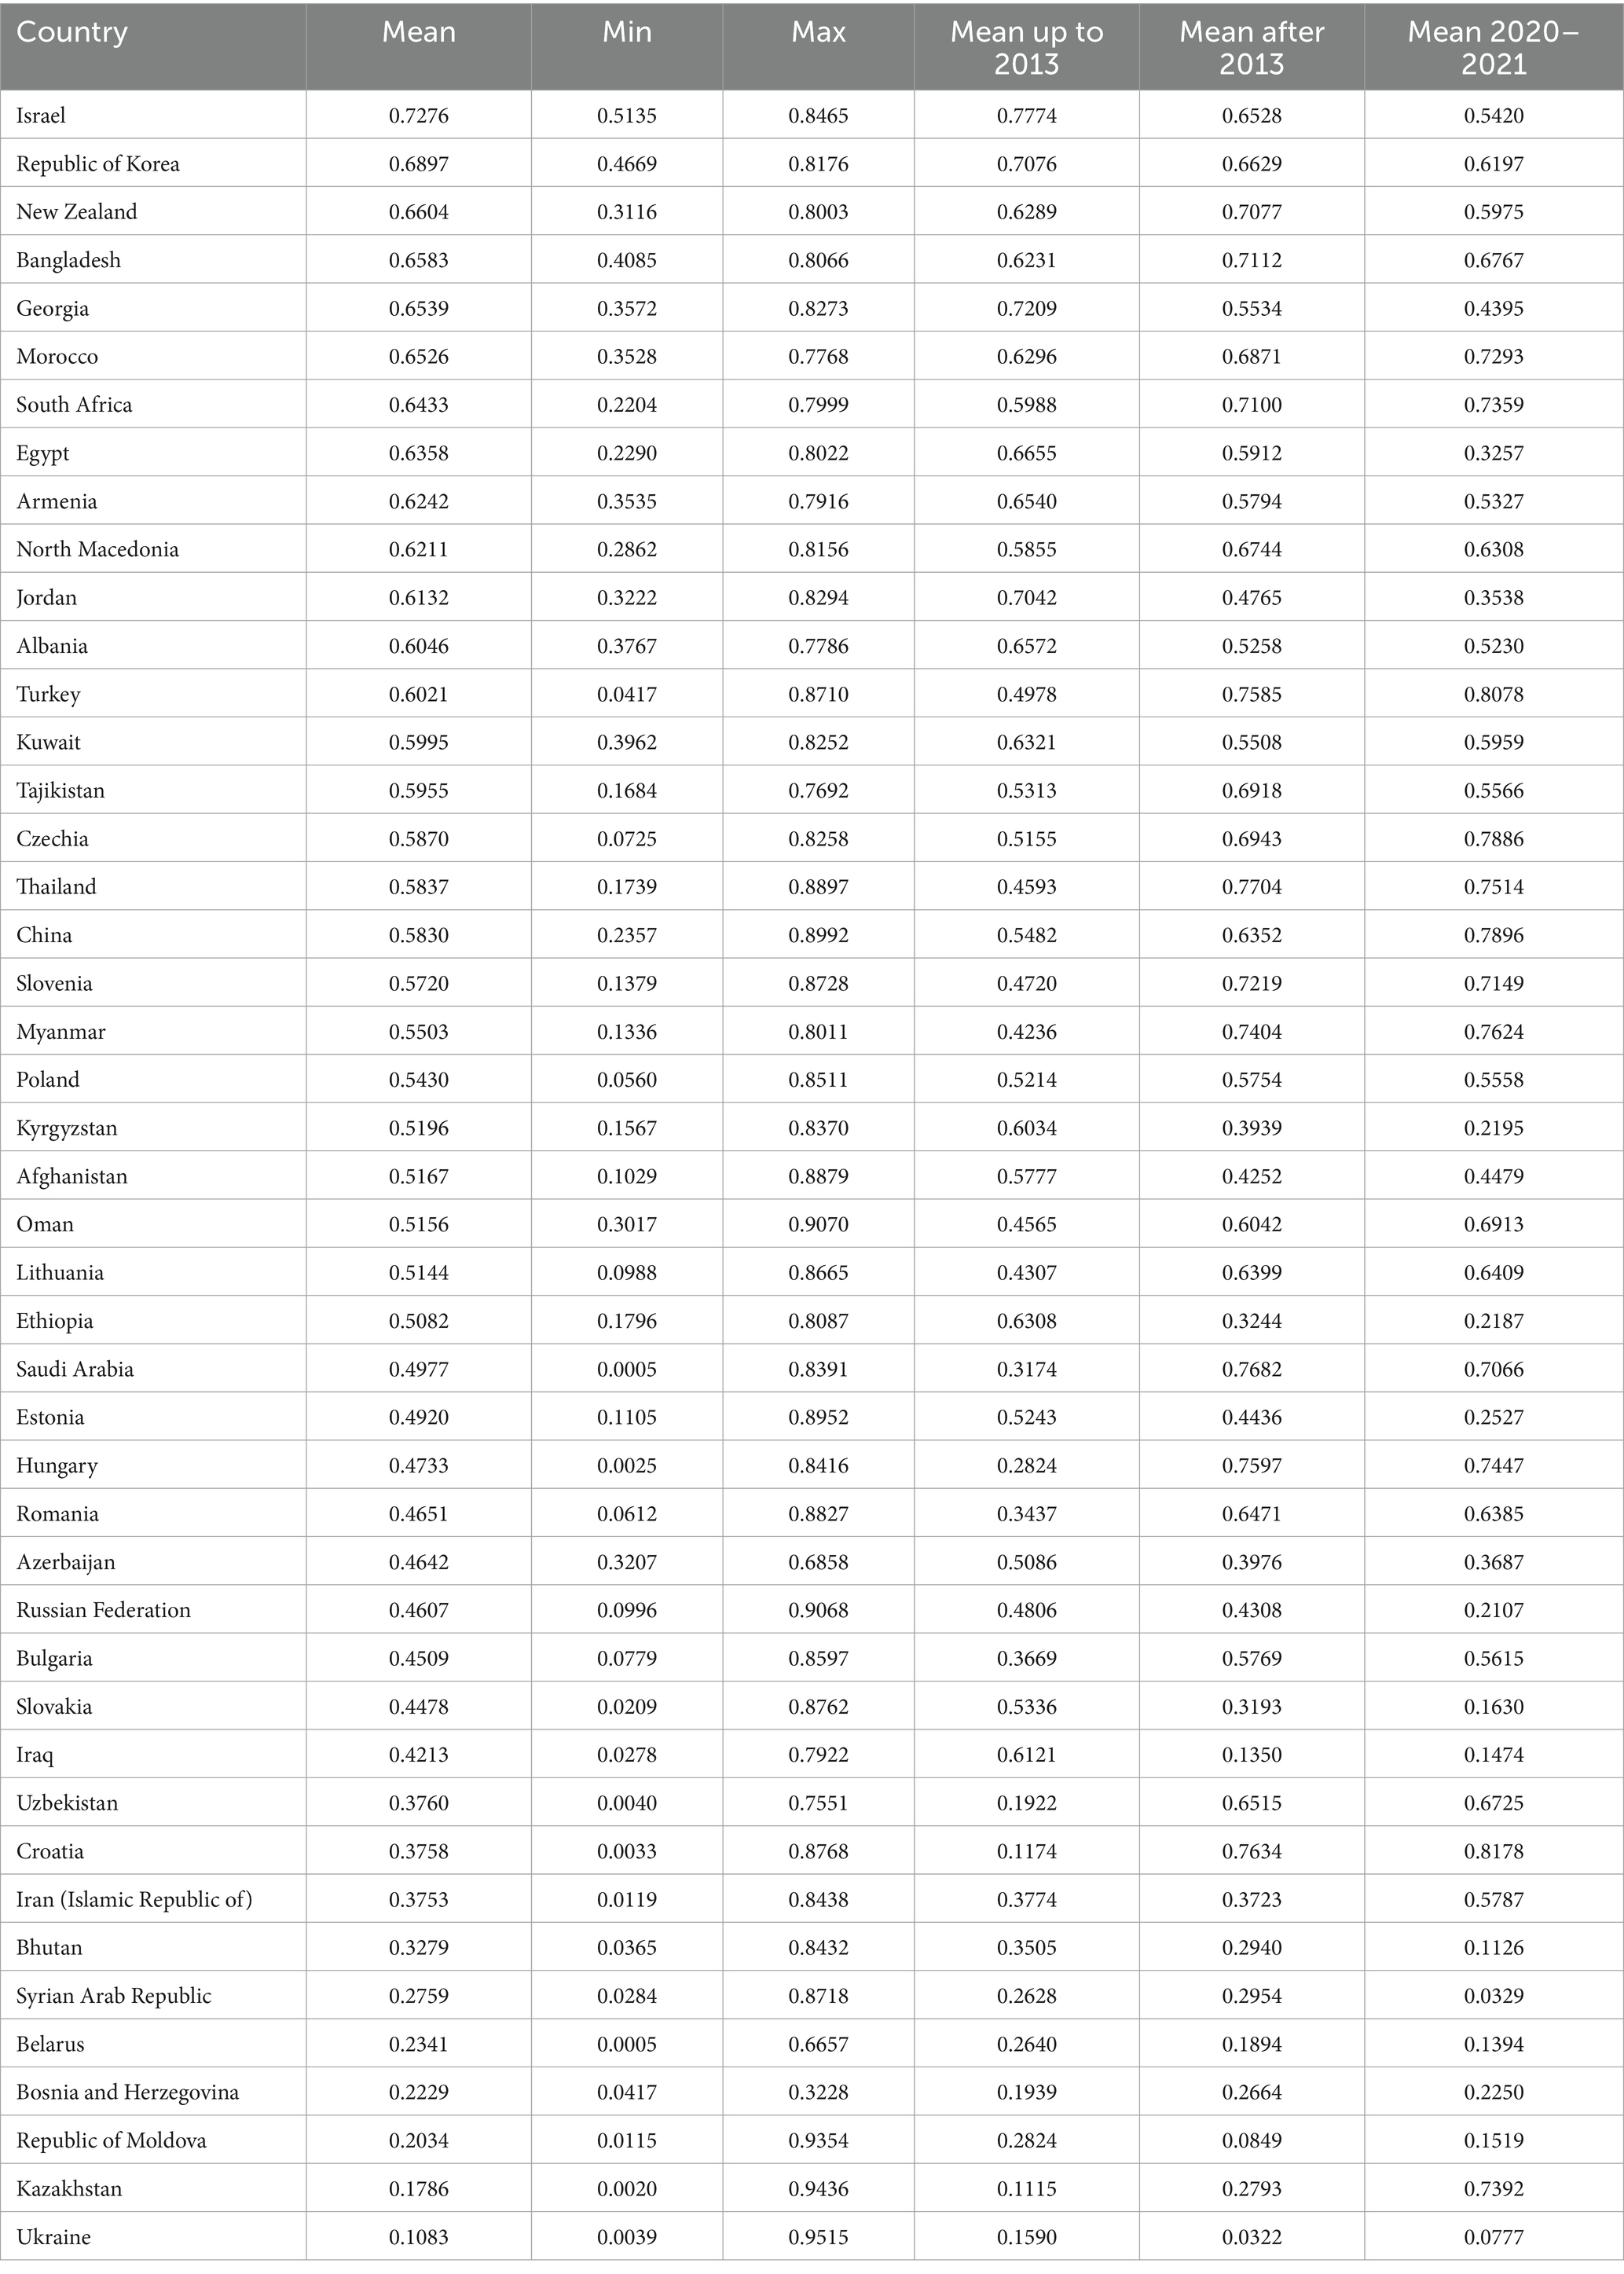
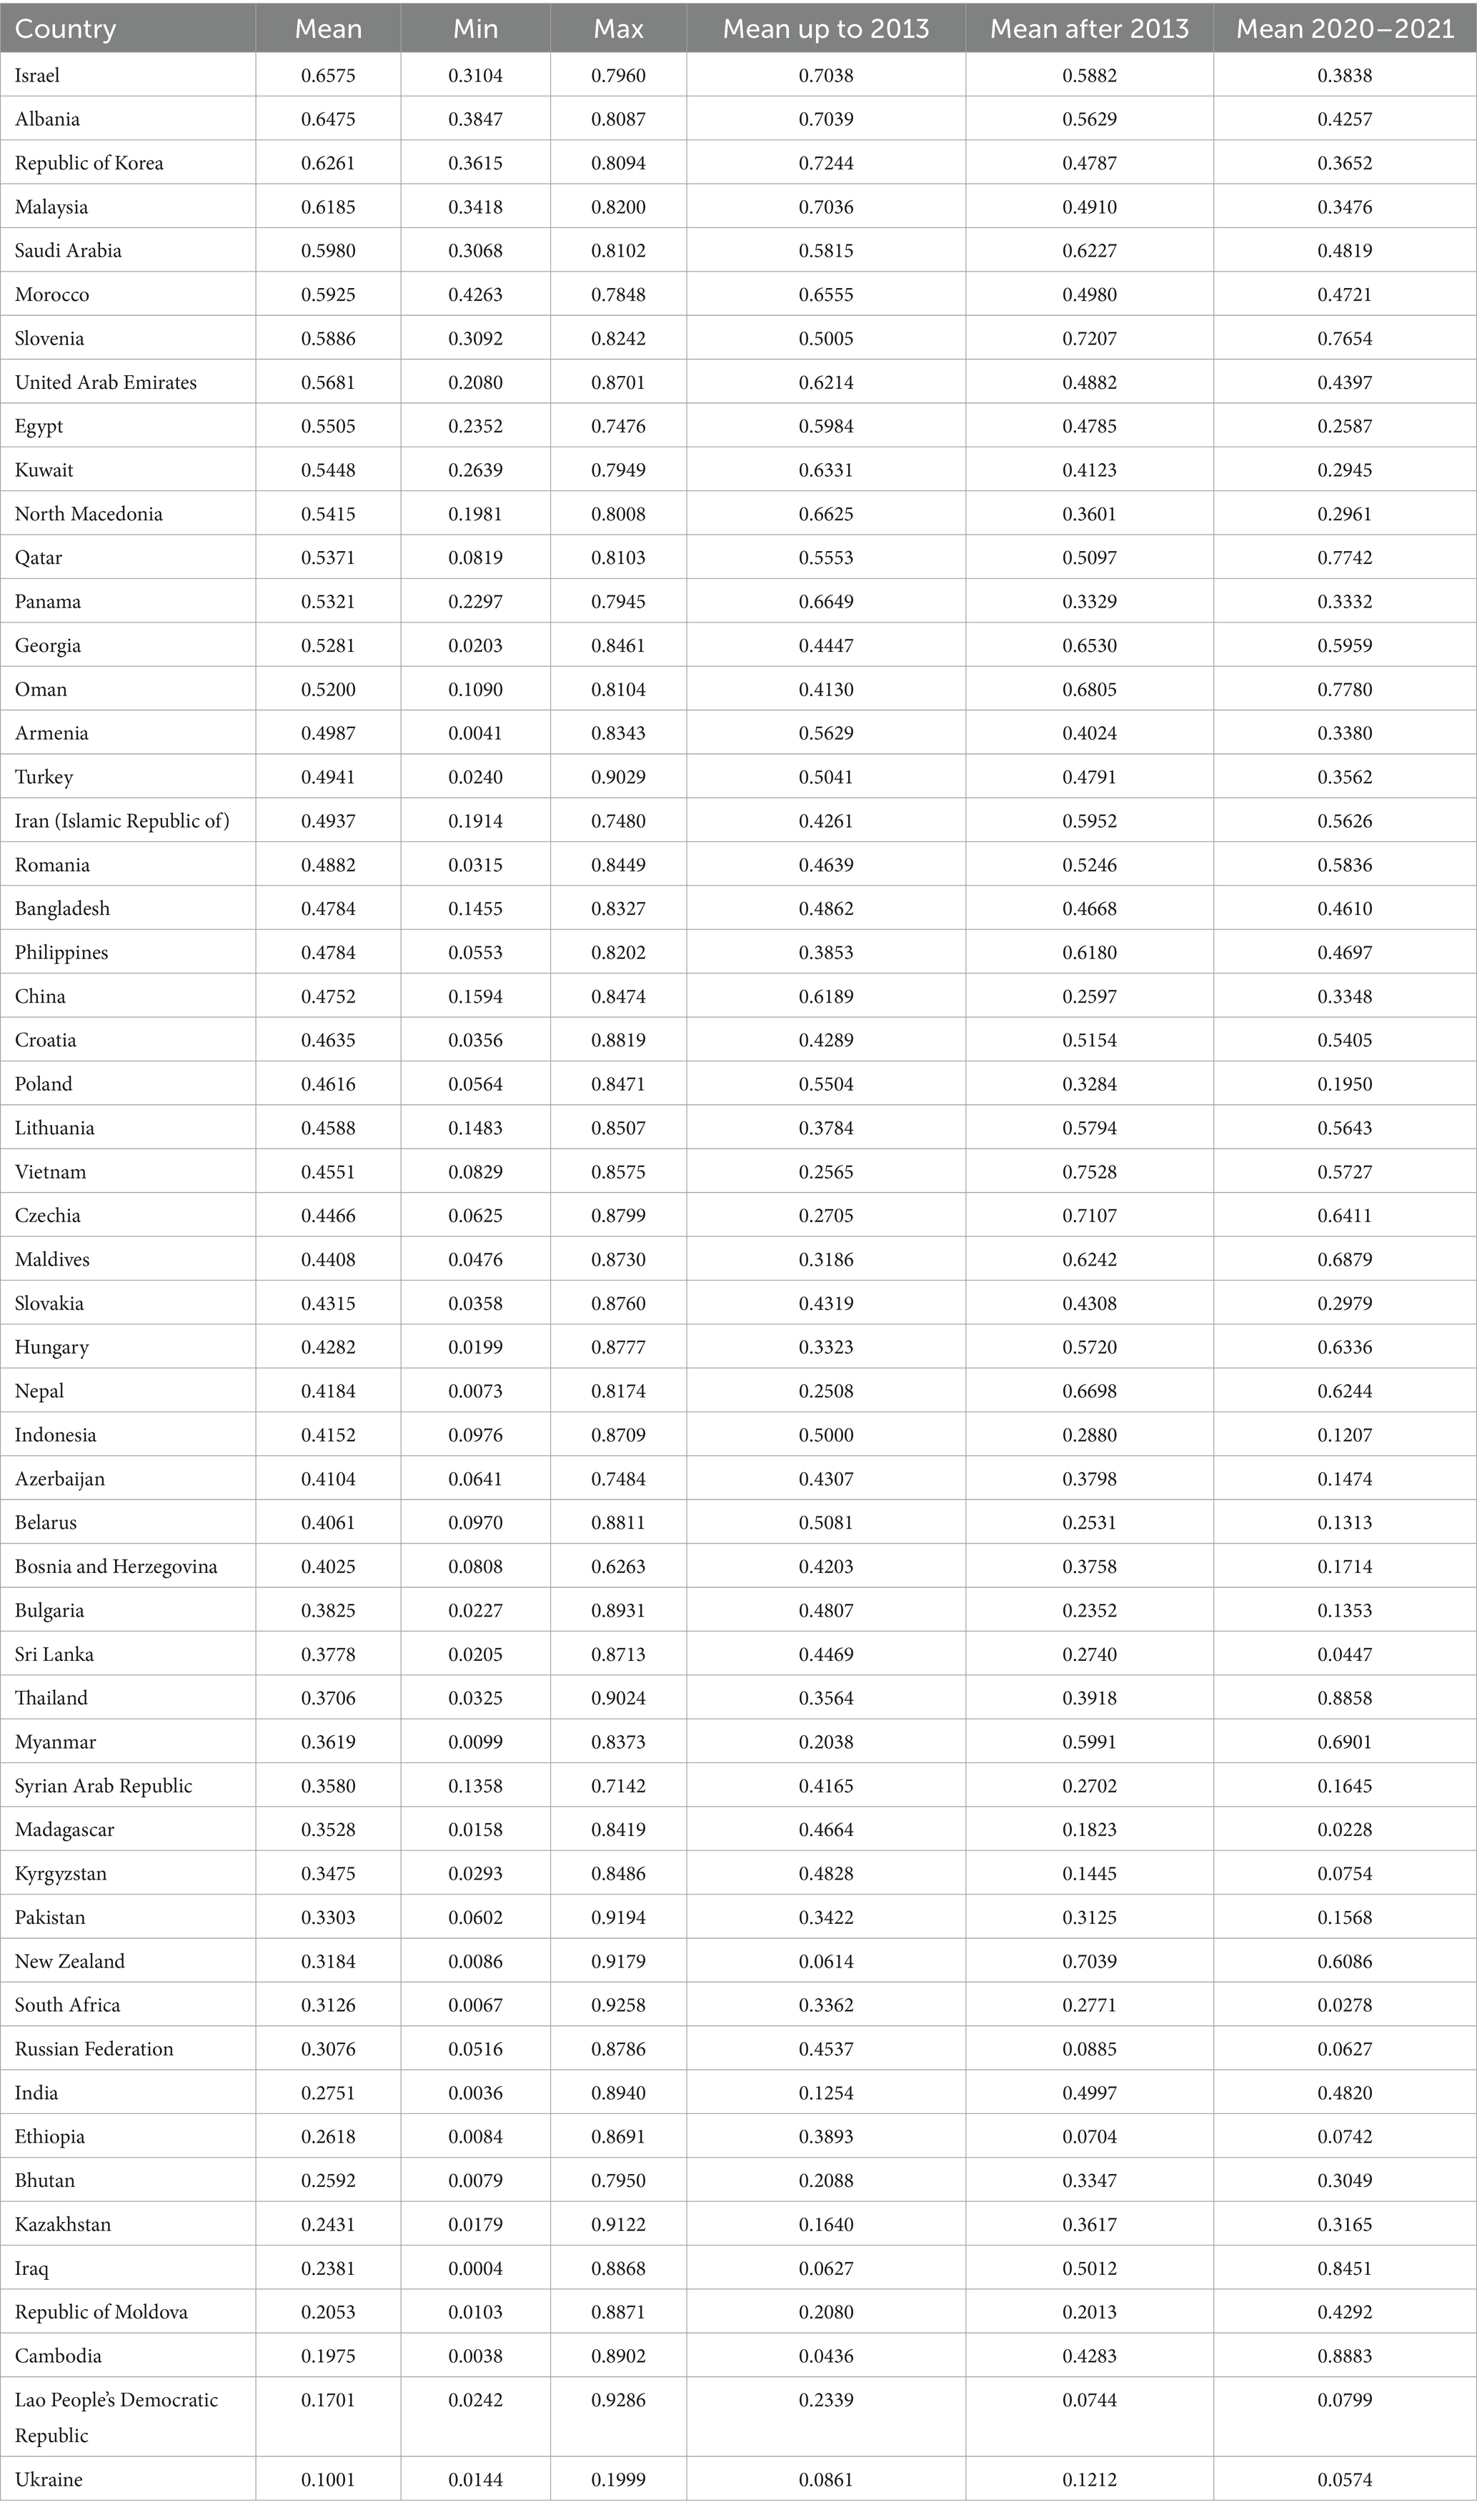
Tables 4, 5 provide a statistical descriptive of country-level trade efficiency scores for wheat and maize over the period from 2002 to 2021. The tables categorize data into several key metrics: overall mean trade efficiency, minimum and maximum efficiency scores observed, mean efficiency up to 2013 (prior to the Belt and Road Initiative, BRI), mean efficiency after 2013 (post-BRI implementation), and mean efficiency during the COVID-19 pandemic years of 2020–2021.
Table 4 presents a comprehensive analysis of wheat trade efficiency scores spanning the period from 2002 to 2021. A notable divergence can be observed between the mean trade efficiency scores prior to and following 2013, suggesting the potential influence of the BRI on the dynamics of trade. Turkey and Hungary, for instance, exhibited a marked improvement in their post-2013 mean efficiency, with Turkey’s score increasing from 0.4978 to 0.7585 and Hungary’s from 0.2824 to 0.7597, which can be attributed to the enhanced trade facilitation and infrastructure development fostered by the BRI, such as improved rail connectivity and streamlined customs procedures. Conversely, Georgia and Jordan experienced a decline in trade efficiency in the post-2013 era, with Georgia’s score dropping from 0.7209 to 0.5534 and Jordan’s from 0.7042 to 0.4765, potentially indicating the presence of infrastructural or political obstacles that the BRI has not sufficiently addressed. Furthermore, an examination of the average efficiency scores during the COVID-19 pandemic provides valuable insights into the resilience and vulnerabilities of trade networks in the face of global disruptions. South Africa and Croatia, for example, demonstrated remarkable trade efficiency throughout the pandemic, with scores of 0.7359 and 0.8178 respectively, suggesting the presence of effective pandemic management strategies or well-diversified trade mechanisms that mitigated the impact of the crisis. In contrast, Egypt and Jordan experienced a significant decline in trade efficiency, with scores dropping to 0.3257 and 0.3538 respectively, underlining the detrimental effects of the pandemic on their trade operations, which may have been exacerbated by pre-existing infrastructural or economic vulnerabilities. This disparity in pandemic-era performance highlights the varying degrees of trade resilience across different countries and emphasizes the need for robust crisis management strategies in international trade.
The analysis of wheat trade efficiency reveals a complex landscape of winners and losers in the post-BRI era and during the COVID-19 pandemic. While some countries have significantly benefited from improved infrastructure and trade facilitation, others have struggled to maintain their efficiency levels. This variability suggests that the impact of large-scale initiatives like the BRI and global crises like the pandemic is not uniform and warrants further investigation into country-specific factors that contribute to trade resilience.
Table 5 presents a comprehensive analysis of maize trade efficiency scores spanning the period from 2002 to 2021. A notable divergence can be observed between the mean trade efficiency scores prior to and following 2013, suggesting the potential influence of the BRI on the dynamics of trade. Slovenia and Georgia, for instance, exhibited a marked improvement in their post-2013 mean efficiency, with Slovenia’s score rising from 0.5005 to 0.7207 and Georgia’s from 0.4447 to 0.6530, which can be attributed to the enhanced trade facilitation and infrastructure development fostered by the BRI, such as improved port facilities and digital trade platforms. Conversely, China experienced a decline in trade efficiency in the post-2013 era, with its score decreasing from 0.6189 to 0.2597, potentially influenced by a complex interplay of factors, including domestic and foreign policy shifts and fluctuations in the macroeconomic landscape. Furthermore, an examination of the average efficiency scores during the COVID-19 pandemic provides valuable insights into the resilience and vulnerabilities of trade networks in the face of global disruptions. Oman and Qatar, for example, demonstrated remarkable trade efficiency throughout the pandemic, with scores of 0.7780 and 0.7742 respectively, suggesting the presence of effective pandemic management strategies or well-diversified trade mechanisms that mitigated the impact of the crisis. In contrast, Egypt experienced a significant decline in trade efficiency, with its score dropping to 0.2587, underlining the detrimental effects of the pandemic on its trade operations, which may have been exacerbated by pre-existing infrastructural or economic vulnerabilities. The varied responses to the pandemic underscore the importance of adaptable trade policies and robust supply chain management in maintaining trade efficiency during global crises.
Tables 4, 5 provide a detailed analysis of country-level wheat and maize trade efficiency scores from 2002 to 2021. By comparing the data before and after the implementation of the Belt and Road Initiative (BRI), changes in trade efficiency for wheat and maize in different countries can be observed. For example, China’s wheat trade efficiency significantly improved after the implementation of the BRI, increasing from 0.5482 to 0.6352, while maize trade efficiency declined, dropping from 0.6189 to 0.2597. This difference may be due to various factors. First, the BRI may have focused more investment and improvements on infrastructure and logistics related to wheat trade, thereby enhancing overall wheat trade efficiency. Second, changes in China’s domestic agricultural policies and market demand may have different impacts on the trade of different agricultural products. Wheat, as a major grain crop, may benefit from more stable and prioritized policy support, while maize may be affected by adjustments in domestic supply chains, market demand fluctuations, and changes in international trade policies. Additionally, changes in the global market environment and trade partnerships may also have different impacts on the trade efficiency of different agricultural products. Therefore, although the BRI generally promotes trade facilitation, its specific impact varies significantly between different agricultural products and countries, requiring further in-depth research and analysis.
In comparing wheat and maize trade efficiencies, it’s notable that wheat trade generally showed more resilience and improvement post-BRI and during the pandemic. This could be attributed to wheat’s status as a staple food crop, which may have led to more consistent demand and prioritized trade facilitation efforts. Maize, often used as animal feed, may be more susceptible to fluctuations in livestock industry demands and alternative feed options. In synthesizing the observations from both tables, it is evident that the BRI’s potential to enhance trade efficiency is significant but not uniformly positive across all participating countries. The effectiveness of pandemic response measures, political stability, and existing infrastructure play critical roles in determining the extent of benefits derived from the initiative. Moreover, the COVID-19 pandemic underscores the importance of resilient and diversified trade networks. Future research could focus on identifying best practices from countries that maintained high trade efficiency during the pandemic, potentially informing policy recommendations for enhancing trade resilience in the face of global crises.
3.3 Potential of countries by GDP and yield tiers results
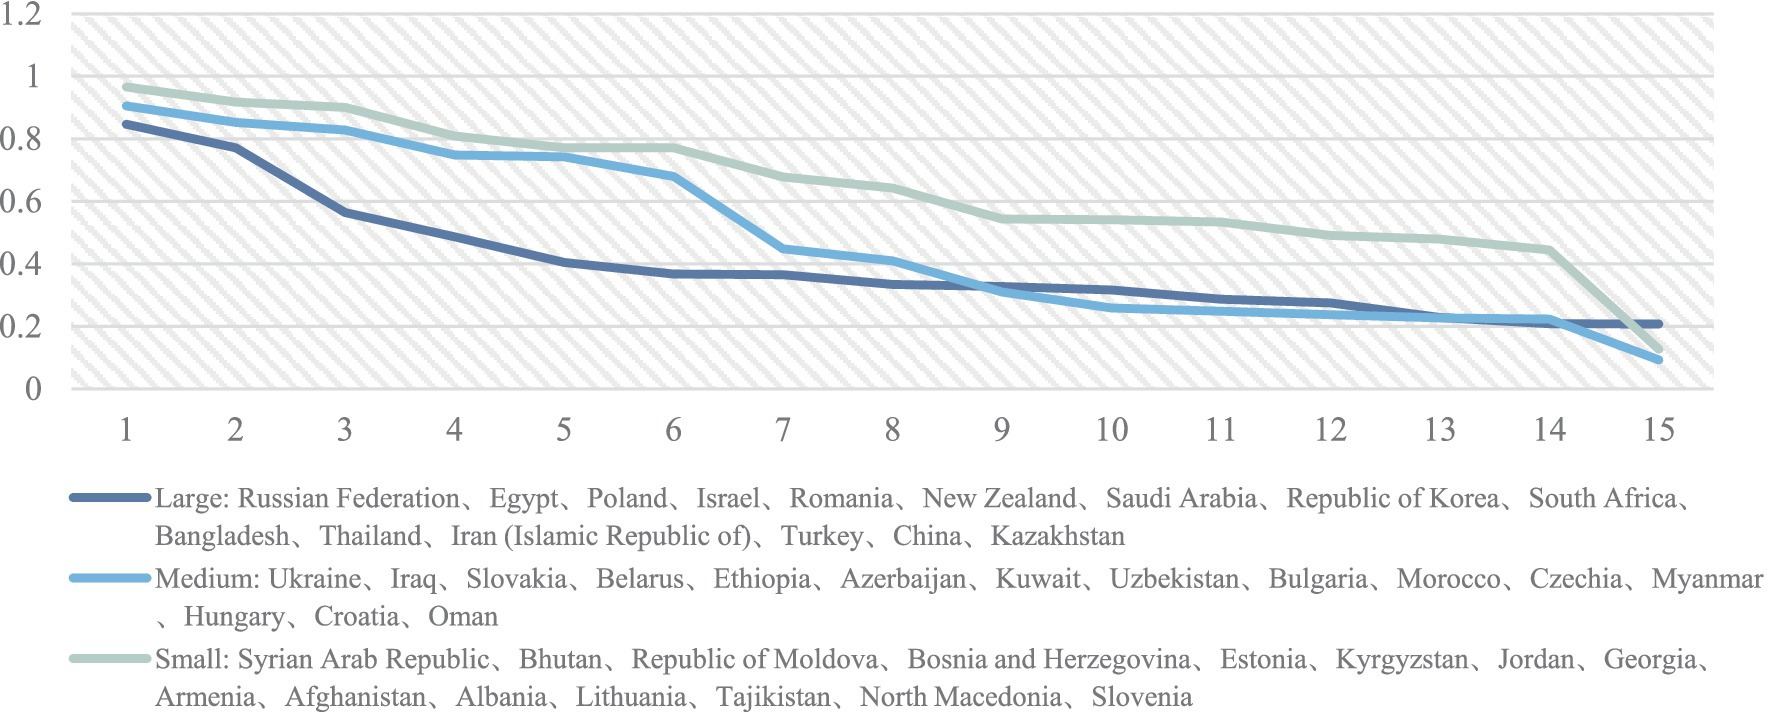
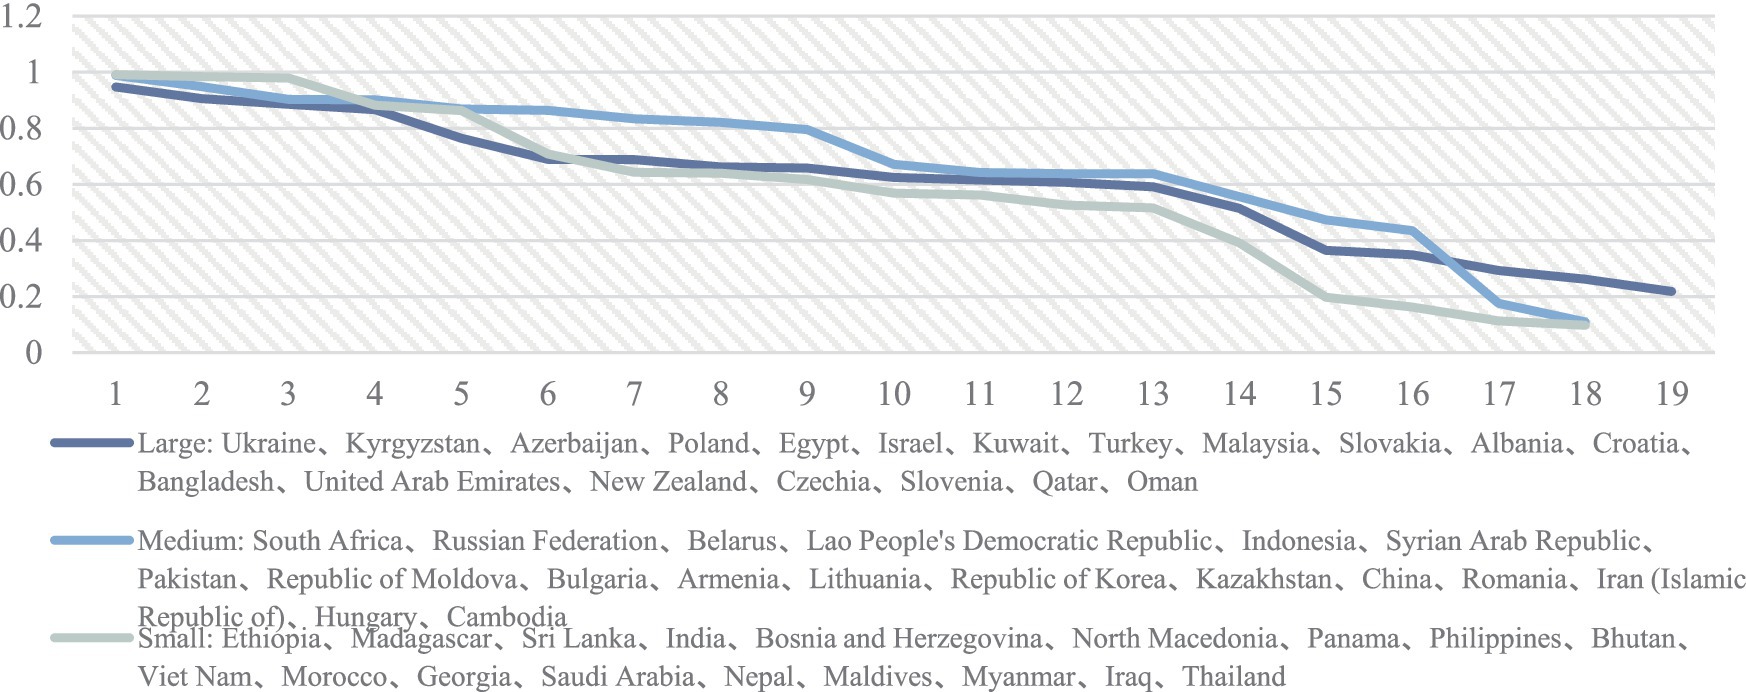
Figures 2, 3 are created by categorizing countries based on their GDP sizes—large, medium, and small—and analyzing the trends and dynamics of trade potential among countries with different GDP levels. This approach aims to uncover the differences in trade potential among countries at various economic levels. In Figure 2, countries of different economic sizes exhibit varying characteristics in terms of wheat trade potential. Large economies such as the Russian Federation, China, and Turkey, despite their significant positions in the global economy, do not significantly outperform medium or small economies in wheat trade potential. This could be due to these countries having a strong capacity for self-sufficiency and a more diversified economic structure, reducing their reliance on imported wheat. Additionally, varying dietary habits and consumption patterns across countries may also influence the demand for wheat.
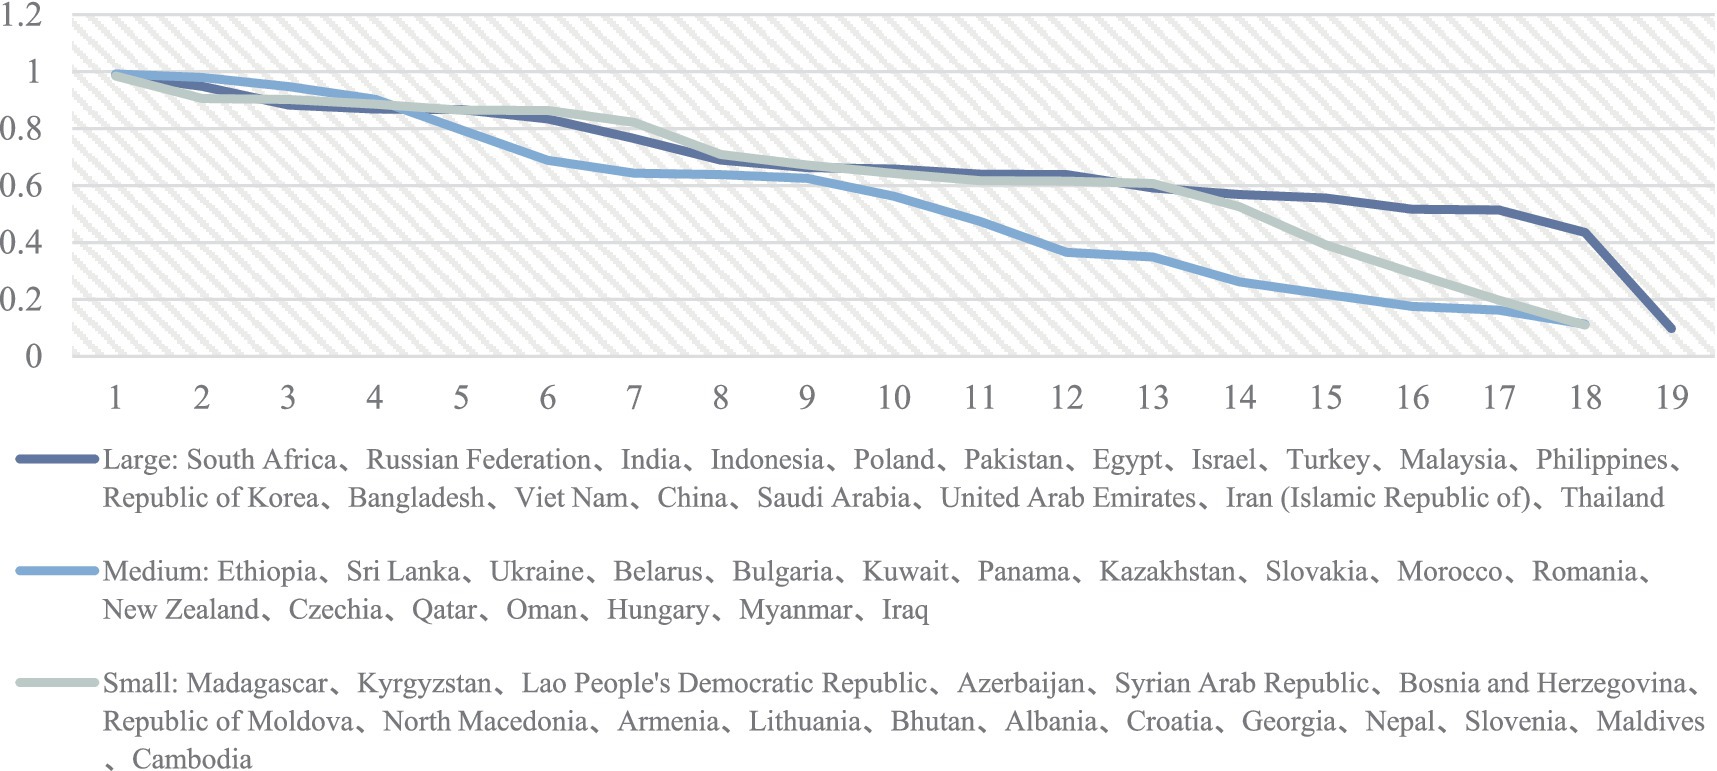
In contrast, the analysis of maize trade potential in Figure 3 shows that large economies have a more pronounced potential in the maize market. This may be related to maize’s dual role as an important food and industrial raw material (such as for producing feed and biofuels). Larger economies, with their developed livestock industries and industrial demands, have relatively higher needs for maize. Furthermore, the international trade flow of maize might be more active, especially in countries where natural conditions are unfavorable for maize production, leading these countries to rely more heavily on imports to meet their needs. Some large economies might also engage more actively in the international maize market to ensure food security.
Through the analysis of wheat and maize trade potential under the 2021 GDP tier classification, we observe performance differences among countries of varying economic sizes in these two important agricultural product markets. These differences not only reflect the variations in agricultural production capabilities among countries but also their diversity in economic strategies, consumption demands, and other aspects. Understanding these differences is crucial for formulating effective international trade policies and promoting global food security. For large economies, such as China and the Russian Federation, domestic markets should be streamlined to reduce reliance on imports while simultaneously enhancing export capabilities. Furthermore, engaging in international trade agreements and cooperation projects can bolster their competitiveness in the global market. For medium and small economies, including Ukraine and Slovakia, agricultural infrastructure should be improved to increase production efficiency and export capacity. Moreover, governments should provide fiscal support, such as financial incentives and tax benefits, to encourage agricultural production and exports.
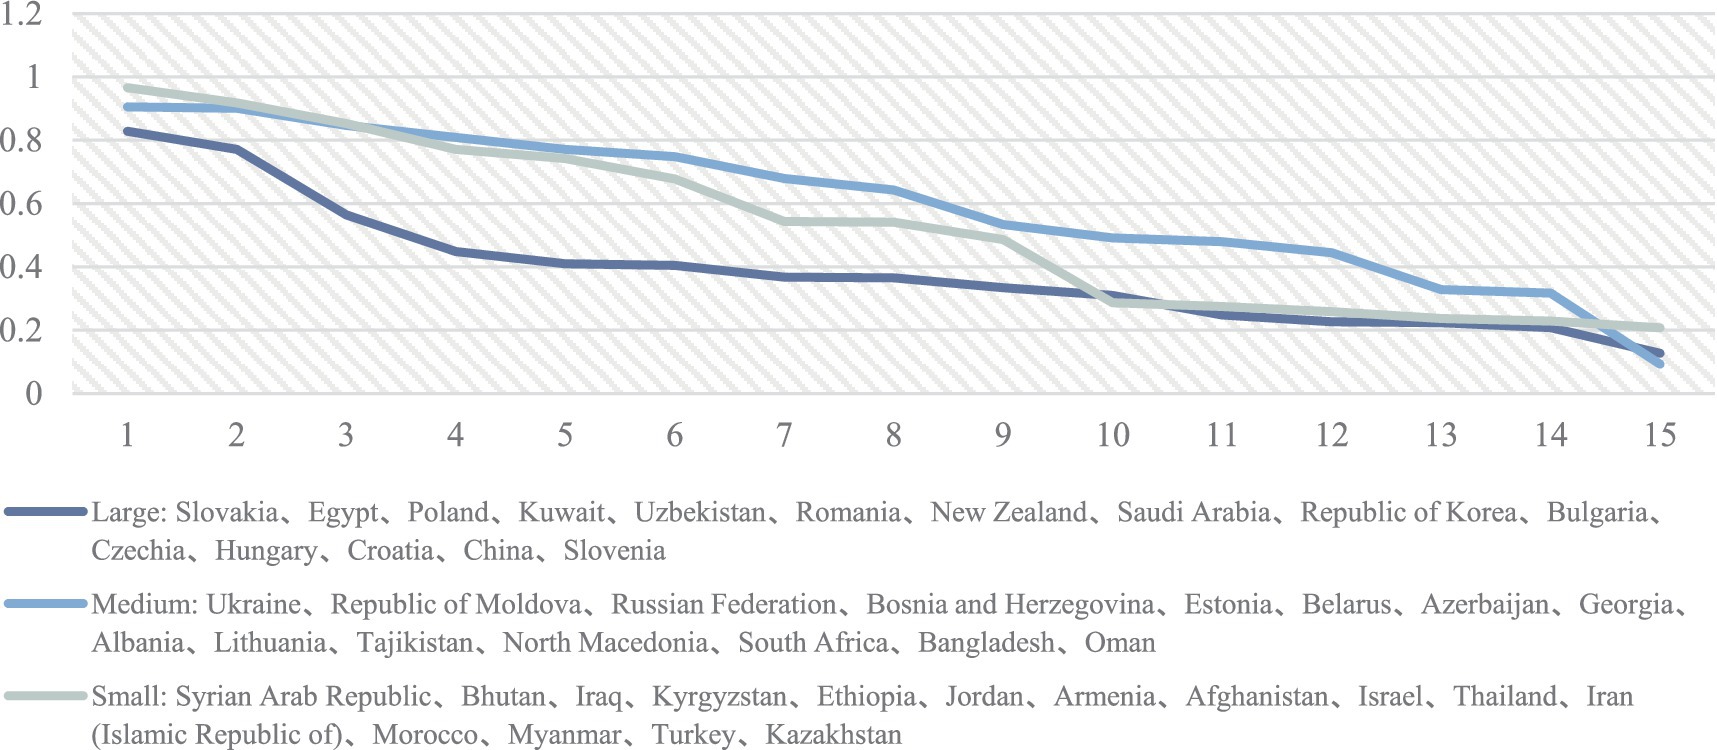
Figures 4, 5 analyze the trade potential of wheat and maize, respectively, across countries categorized by yield tiers (large, medium, and small) in 2021. These figures reveal insights into how yield impacts trade potential across different economic landscapes. In Figure 4, countries with high wheat yields, such as Slovakia, Egypt, and Poland, may have lower wheat trade import potential due to their high domestic production. This aligns with the intuition that countries with high production typically have lower import needs, as they can adequately meet domestic demand.
Similarly, Figure 5 applies this logic to maize. Countries classified with high maize yields, like Ukraine, Kyrgyzstan, and Azerbaijan, indicate excellent production performance, potentially leading to lower maize import potential due to sufficient domestic supply to meet or nearly meet demand.
Figures 4, 5 compare the relationship between production volumes and import potential across different countries for wheat and maize, respectively. Both figures suggest a similar trend: countries with higher production levels tend to have lower import potential. This pattern indicates that increased domestic production can satisfy or even exceed national demand, reducing the need for imports. However, when examining individual countries, variations emerge. For instance, a country with high wheat production might not have a correspondingly high maize production, affecting its import potential for each crop differently. While Slovakia, Egypt, and Poland are highlighted for their wheat production in Figure 4, their maize production and import potential, as shown in Figure 5, may differ. Thus, while the general rule that higher production decreases import potential holds, the specific relationship between production and import potential for wheat and maize can vary significantly from country to country, reflecting differences in agricultural specialization, strengths, and domestic demand for different crops. For high-yield countries, such as Egypt and Poland, export channels should be optimized to ensure their agricultural products can efficiently enter the international market. Additionally, the processing capacity of agricultural products should be enhanced to increase added value and bolster competitiveness in the global marketplace. For medium and low-yield countries, including South Africa and North Macedonia, advanced agricultural technologies should be introduced, and comprehensive farmer training programs should be implemented to improve production levels. Concurrently, through international aid and cooperation projects, these nations can obtain essential financial and technical support to augment their agricultural production capacity and foster sustainable growth in the sector.
3.4 Contrast of wheat and maize potential of different GDP and yield
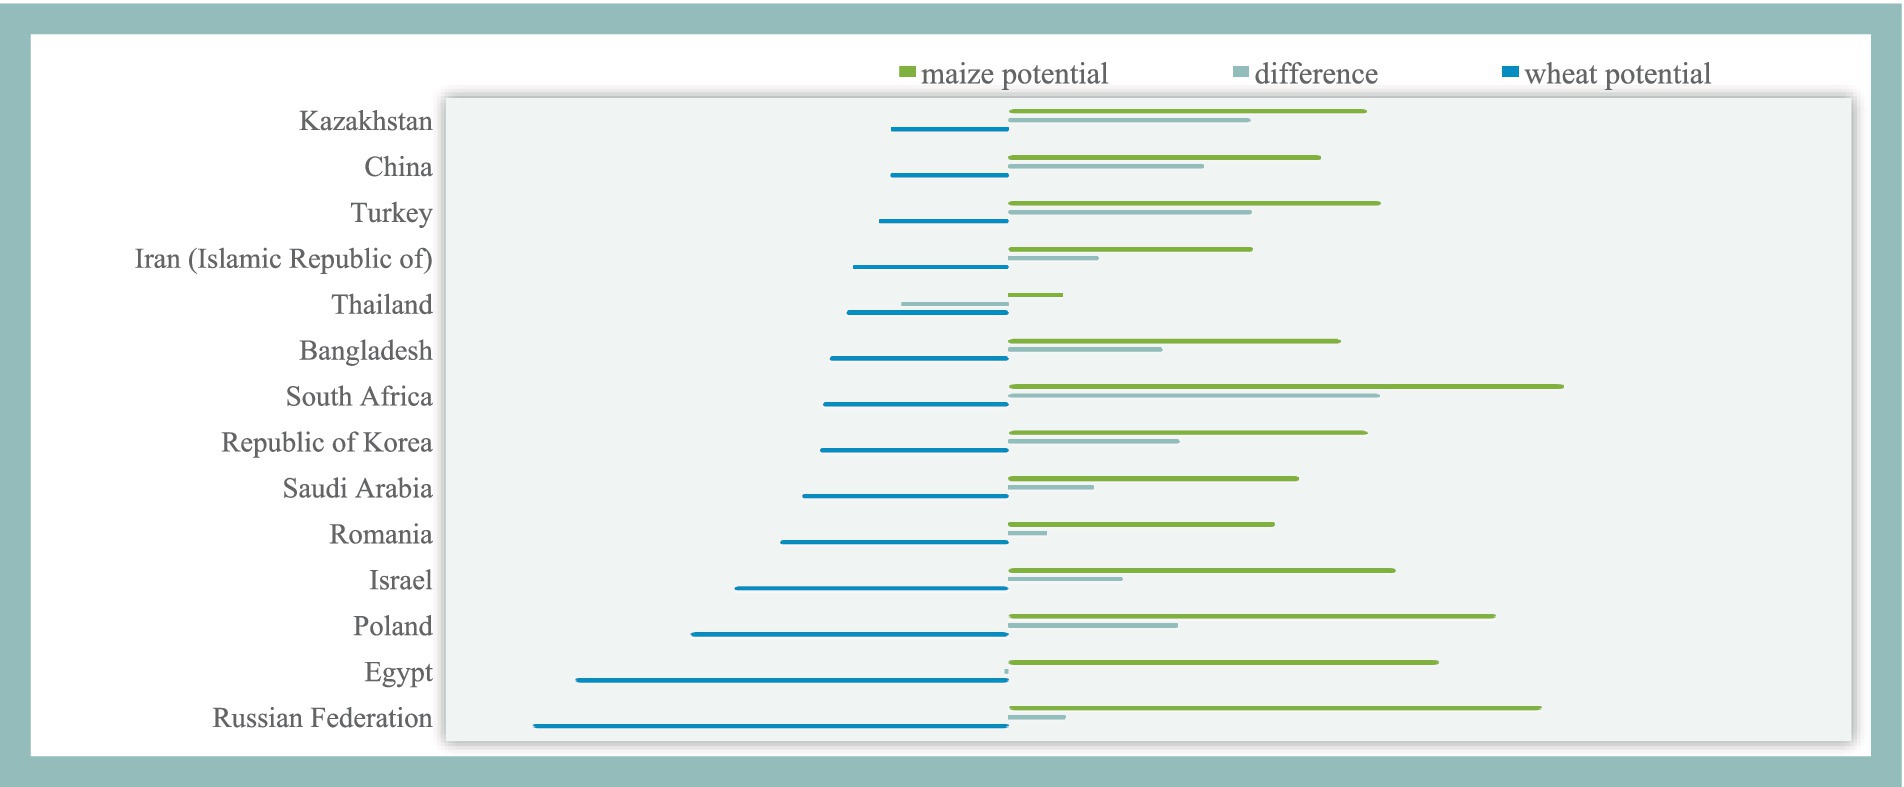
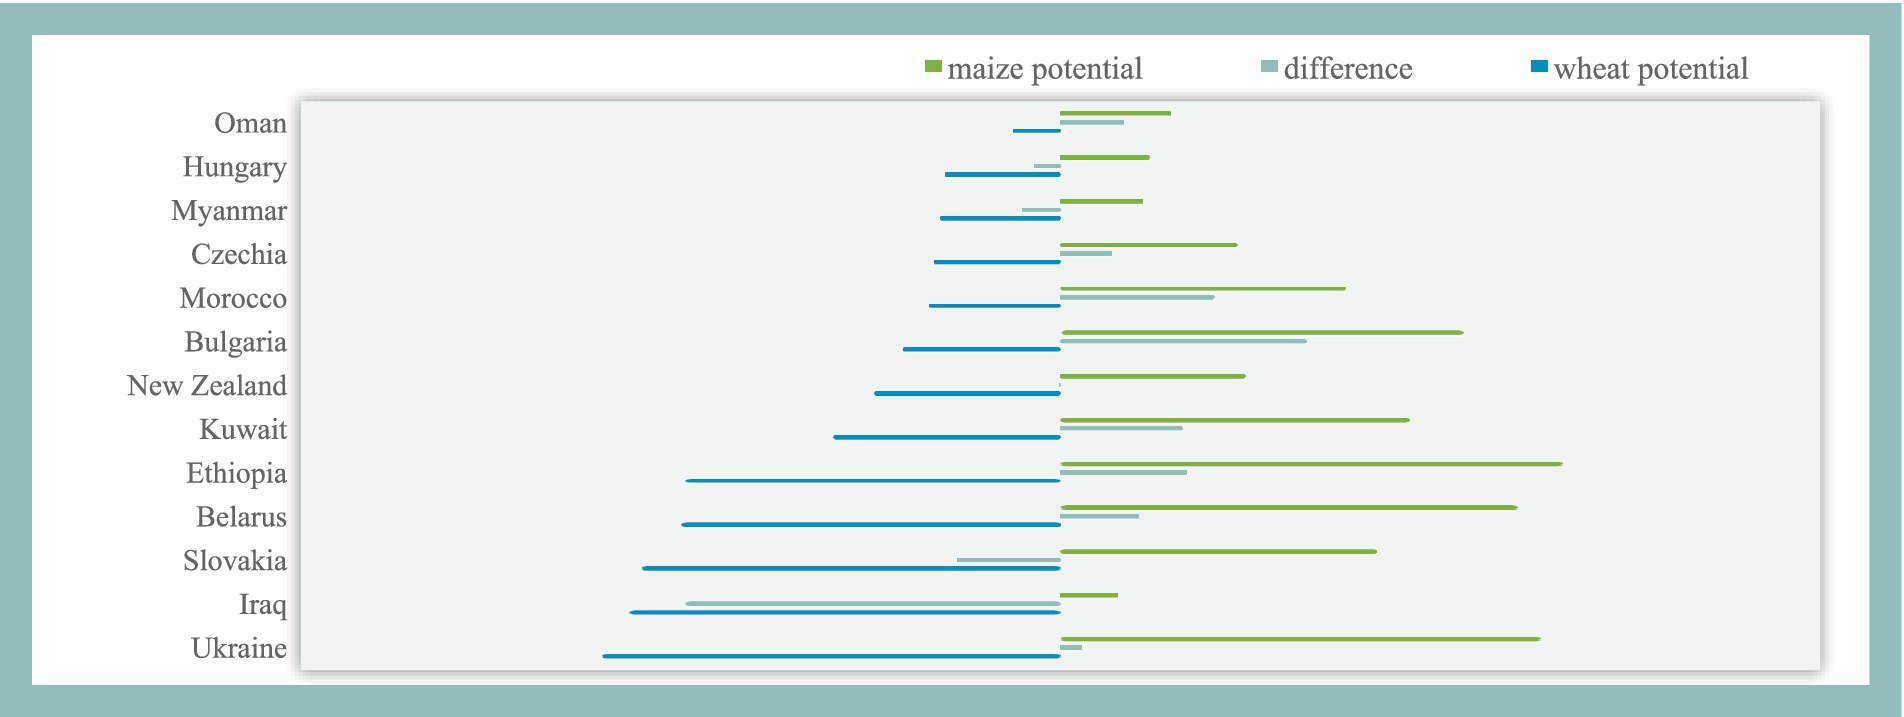
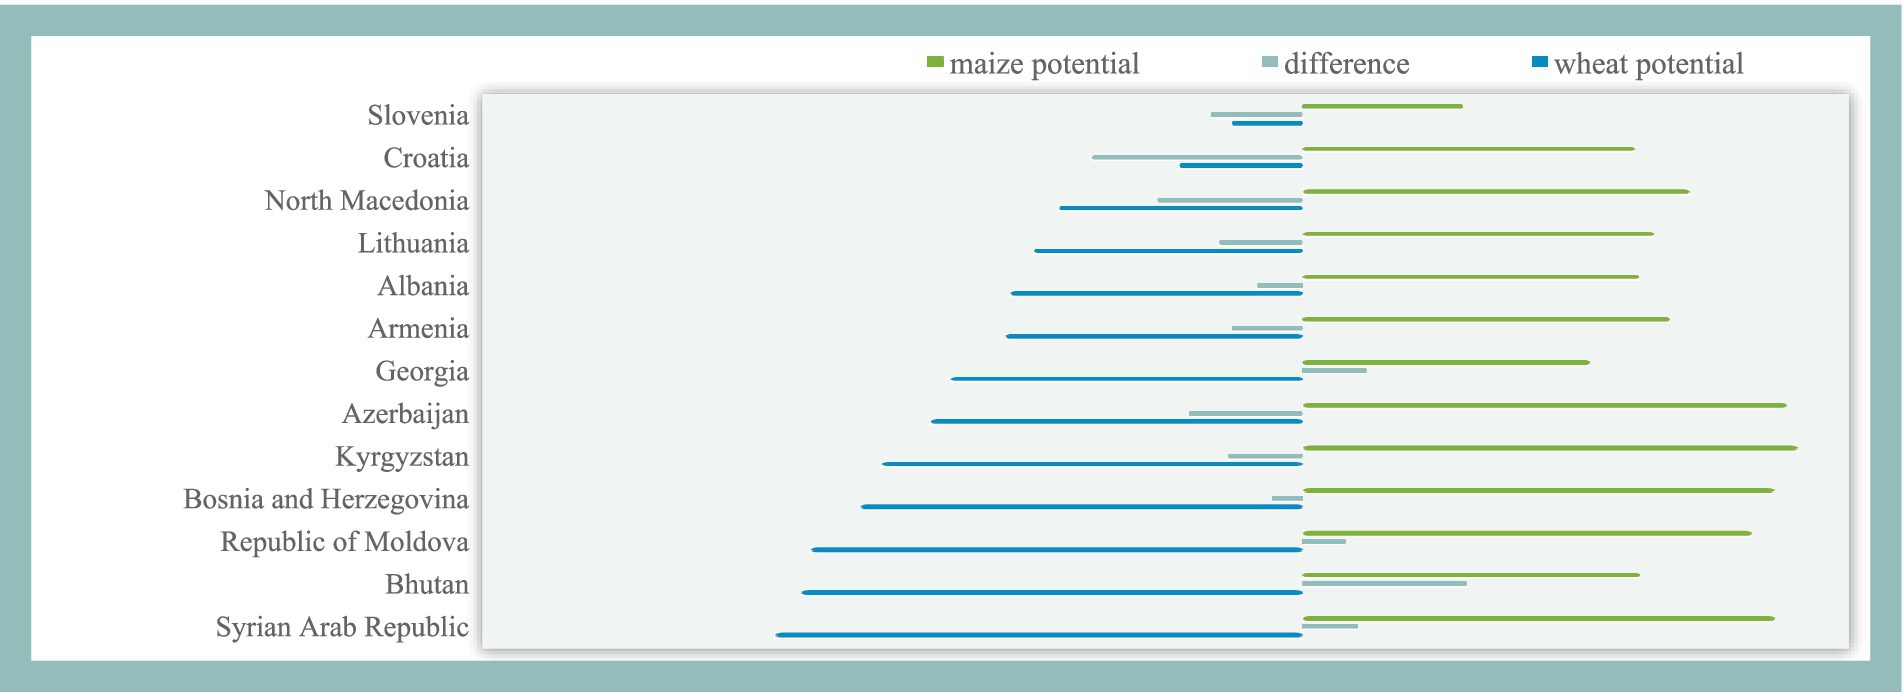
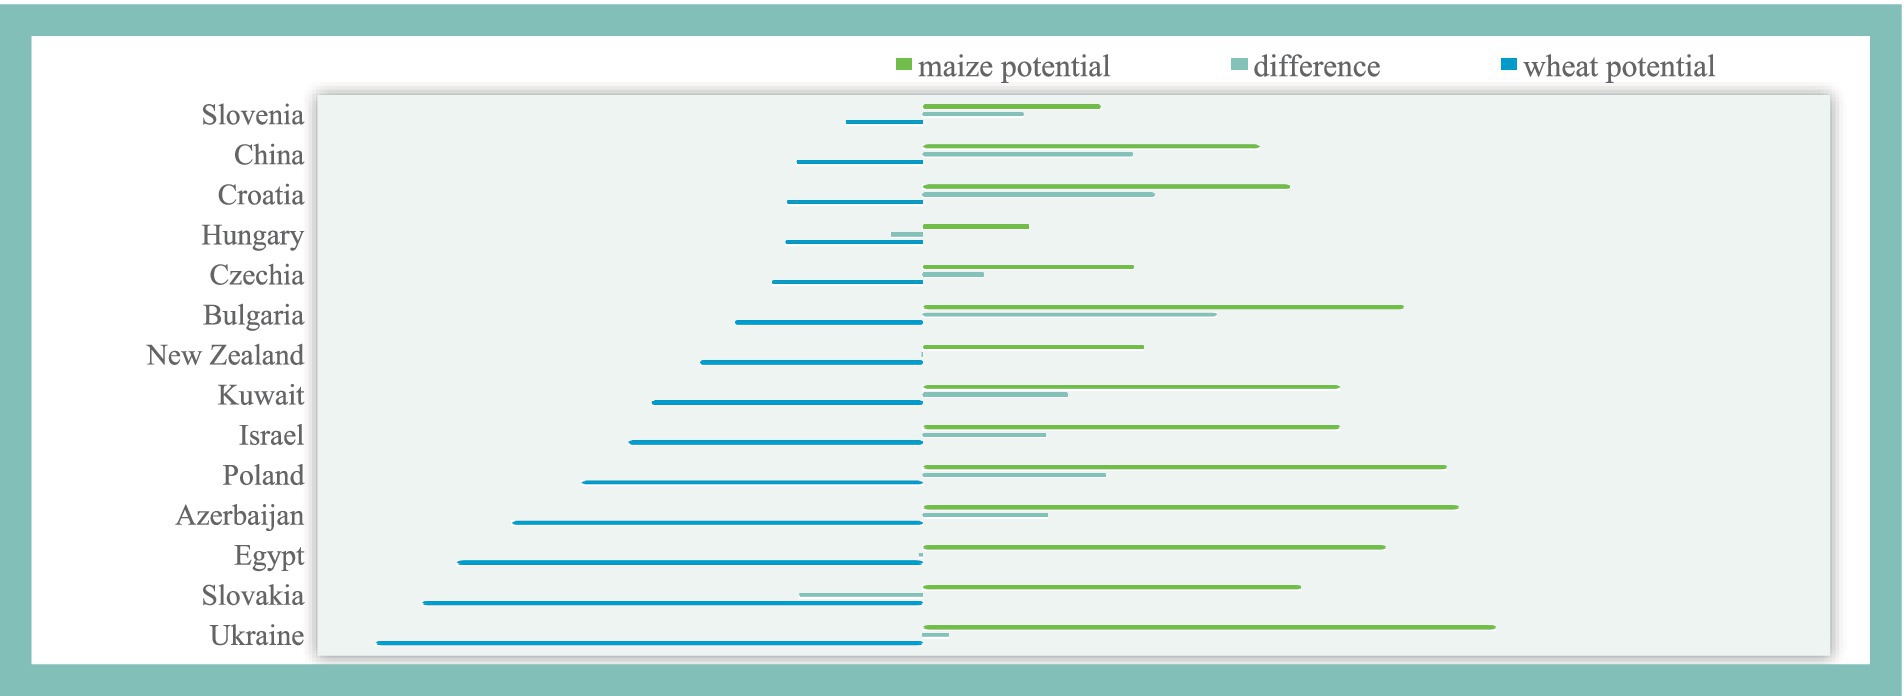
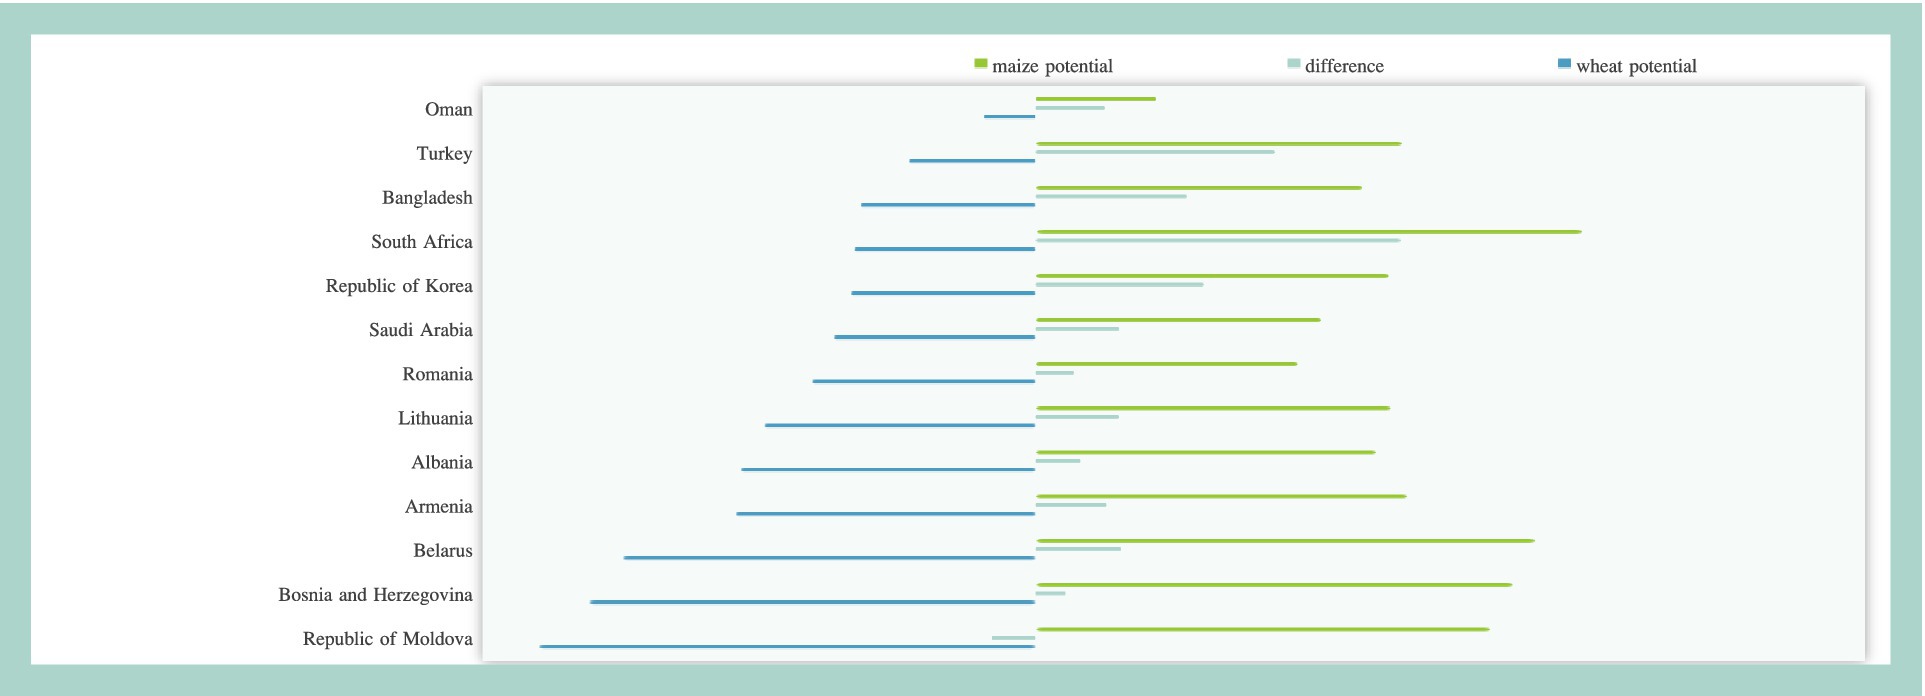
Figures 6–8 present the contrast in wheat and maize import potential among countries categorized by their GDP size into large, medium, and small groups for the year 2021. These charts reveal the potential advantages and challenges in grain trade for countries of different economic scales by comparing the import potential of wheat and maize.
The analysis of Figure 6 reveals a significant difference between the potential for maize imports and wheat imports among large GDP countries. In these countries, the potential for maize imports is generally higher than that for wheat, which may reflect a high demand for maize, whether as food, feed, or for other industrial uses. This trend may be attributed to agricultural policies, consumption patterns, and demand for biofuels in these economies. For instance, large GDP countries might have more capacity to invest in biofuel projects, thereby increasing the demand for maize.
In Figure 7, the data for medium GDP countries show a more complex difference in the potential for wheat and maize imports. While many countries still show higher potential for maize imports compared to wheat, the difference is less pronounced than in large GDP countries. This could be because medium GDP countries have a greater diversity in agricultural production and consumption habits, and they might be more flexible in balancing domestic and international market supply and demand. Additionally, these countries might be making more trade-offs between wheat and maize to meet their domestic market needs.
The analysis of Figure 8 reveals a unique trend in small GDP countries regarding the potential for wheat and maize imports. In these countries, the potential for wheat imports is generally higher than for maize, which may reflect a high dependency on wheat as a staple and basic food. Small GDP countries might focus more on meeting basic food security needs, with wheat being a primary food source in many regions. Moreover, their agricultural policies might be more inclined to support the import of wheat to ensure domestic food security.
Figures 6–8 categorize countries into three groups—large, medium, and small, based on their 2021 GDP, and compare the import potential for wheat and maize among countries of different economic scales. Large GDP countries tend to show a higher demand for the potential of maize imports, possibly related to their agricultural policies, consumption habits, and the demand for biofuels. Medium GDP countries display a greater balance in the potential for wheat and maize imports, reflecting their flexibility in meeting diverse needs. Meanwhile, small GDP countries focus more on wheat imports, likely due to their high emphasis on food security. These trends reveal the complexity of the global agricultural market and the different strategies formulated by economies based on their needs and policies.
Figures 9–11 further explore this dimension by linking grain production capacity to import potential, highlighting the nuanced trade dynamics driven by the production volumes of each country. Figures 9–11 delineate the import potential for two significant grain crops, wheat and maize, across three groups of countries categorized by their yield sizes—large, medium, and small.
Focusing on Figure 9 for countries with large yields, we notice that the import potential for maize generally surpasses that of wheat. This might indicate that in these countries, the production capacity for wheat is relatively high, sufficient to meet most of the domestic demand. Therefore, the demand for maize is relatively higher, possibly due to increased needs for maize in feed, biofuel, and other industrial uses. This trend might reflect the diversified agricultural production demands of these countries and strategic considerations for ensuring food and energy security.
For the medium yield countries depicted in Figure 10, maize’s import potential also generally exceeds that of wheat, though the difference is not as pronounced as in the large yield countries. This might suggest a more balanced distribution of wheat and maize production in these countries, but still a higher demand for maize imports. This could be related to the agricultural production conditions, cultivation patterns, and the increased demand for maize as feed and industrial raw material in these countries.
In the small yield countries shown in Figure 11, the import potential for maize similarly tends to be higher than that for wheat. This phenomenon may highlight the challenges these countries face in meeting domestic wheat demands, resulting in a greater reliance on maize imports. This could be due to limitations in agricultural production in these countries, including adverse climatic conditions, constraints on land resources, and limitations in technology and capital, making maize imports a crucial means to supplement domestic production.
Comparing the analysis from Figures 9–11, we observe a clear pattern: regardless of whether the countries have large, medium, or small yields, the import potential for maize is generally higher than that for wheat. This trend might reflect the growing global demand for the diversified uses of maize, alongside relatively stable wheat production. Additionally, this might indicate changes in the global agricultural trade patterns, where maize, as a key agricultural product, plays an increasingly important role in global food security and energy supply.
4 Discussion
This study employs SFM to conduct a comprehensive analysis of wheat and maize trade efficiency among countries participating in the Belt and Road Initiative (BRI). The research assesses and quantifies the trade efficiency of these key agricultural commodities while exploring various factors influencing the trade potential of these nations.
The findings indicate that economic development level, population growth, government efficiency, political stability, and regulatory quality are crucial factors in enhancing wheat trade efficiency. This underscores the significance of institutional quality and economic foundations in promoting agricultural trade. Fu et al. (2023) utilized a time-varying stochastic frontier gravity model to examine the impact of trade facilitation provisions on fresh agricultural product trade in BRI countries. Their findings emphasize the critical role of trade facilitation in improving trade efficiency, aligning with our analysis highlighting the importance of regulatory quality and government efficiency.
However, the relationship between economic scale and trade potential is not linear. Large economies such as Russia, China, and Turkey do not necessarily outperform medium or small economies in terms of wheat trade potential. This disparity may stem from the self-sufficiency capabilities and diversified economic structures of large economies, reducing their dependence on wheat imports. Comparative analysis reveals that China and the Russian Federation possess relatively high maize trade potential, potentially reflecting increased demand for feed and strategic considerations for ensuring food security and supporting the livestock industry. The economic and demographic scale of these countries creates a larger market demand for maize, indicating their significant influence on international grain markets.
Contrary to expectations, WTO membership shows a negative correlation with wheat trade efficiency. This finding contradicts the conventional view that WTO membership leads to higher trade efficiency through trade liberalization and a more stable trade environment (Pavcnik, 2002; Abbas, 2014; Siddika and Ahmad, 2022). This result may reflect the challenges WTO members face in implementing rules and commitments, especially for countries that may lack the preparation or resources to adapt to rapid trade liberalization. It highlights the complex effects that international trade agreements can have in practice.
For maize trade, an increase in arable land area is negatively correlated with trade efficiency, highlighting potential issues in managing larger agricultural areas or optimizing land use to promote trade. This suggests that simply expanding cultivated land may not be an effective strategy for improving trade efficiency, and countries should focus on optimizing land use and adopting advanced agricultural technologies.
The impact of BRI on trade efficiency varies significantly among participating countries, with some experiencing improvements while others face declines. For instance, wheat trade efficiency significantly improved in Turkey and Hungary but declined in Georgia. This indicates that the positive effects of BRI on trade facilitation and infrastructure improvement are not uniformly manifested across all participating countries, suggesting that the effectiveness of the initiative is influenced by various factors, including each country’s infrastructure level, policy environment, and economic structure. Significant differences in trade efficiency also exist across different sectors (Jiang et al., 2022). While Abdullahi et al. (2022) identified key determinants of China’s agricultural export efficiency, finding economic scale and BRI participation as positive influencing factors while highlighting the adverse impacts of income disparities and geographical barriers, the differential impact of BRI on various countries suggests that a one-size-fits-all approach is insufficient. Policymakers should tailor trade promotion strategies to each country’s specific circumstances, considering factors such as existing infrastructure, economic structure, and institutional capacity. This may involve targeted infrastructure development investments, capacity-building programs, and policy reforms aimed at enhancing trade facilitation.
Notably, some countries like South Africa and Croatia demonstrated significant trade efficiency during the COVID-19 pandemic. This finding emphasizes the importance of resilience and diversity in trade networks when facing global crises, highlighting the need for robust crisis management strategies and diversified trade mechanisms.
Our analysis of trade potential disparities between countries of different economic scales provides valuable insights for formulating targeted trade policies. Large economies like China and Russia, showing higher maize trade potential, may need to focus on strategies that leverage their market size and demand to optimize trade relationships. Conversely, smaller economies might benefit from specializing in niche agricultural products or value-added processing to enhance their competitiveness in global markets. The negative correlation between WTO membership and wheat trade efficiency warrants further investigation. It suggests the need for a more nuanced approach to trade liberalization, particularly for developing countries. Policymakers and international organizations should consider implementing more gradual and targeted trade liberalization approaches, complemented by capacity-building initiatives to help countries adapt to new trade regimes. The importance of land use efficiency in maize trade highlights the need for agricultural modernization and sustainable farming practices. Countries should invest in research and development of advanced agricultural technologies, promote sustainable intensification practices, and implement policies that incentivize efficient land use. This may include promoting precision agriculture techniques, improving irrigation systems, and encouraging crop diversification. The resilience demonstrated by some countries during the COVID-19 pandemic underscores the importance of building robust and diversified trade networks. Policymakers should focus on developing crisis management strategies that can maintain trade efficiency during global disruptions. This may involve diversifying trade partners, investing in digital trade infrastructure, and developing contingency plans for supply chain disruptions.
Despite the comprehensiveness of this study, several limitations should be considered. First, the dataset includes only 55 wheat-trading countries and 55 maize-trading countries, which may not fully represent global agricultural trade dynamics. Future research could expand the dataset to include more countries and more recent data. Second, while this study considers multiple influencing factors, incorporating factors such as climate variability, agricultural policies, and technological progress could provide a more comprehensive analysis of agricultural trade efficiency. Third, an in-depth investigation into the specific challenges faced by BRI and WTO members in implementing trade rules and how these challenges affect trade efficiency would be valuable.
5 Conclusion
This paper evaluates and quantifies the efficiency of wheat and corn trade among the countries along the BRI using SFM, and explores various factors that affect the trade potential of these countries. Our findings reveal that the level of economic development, population growth, government efficiency, political stability, and the quality of regulations are key factors in enhancing the efficiency of wheat trade. However, membership in the WTO is negatively correlated with wheat trade efficiency, which may reflect the challenges faced by WTO members in implementing WTO rules and commitments. Research shows that streamlined customs procedures and enhanced logistical efficiency contribute to increasing trade flows between BRI countries. Regarding the efficiency of corn trade, an increase in arable land area is significantly negatively correlated with corn trade efficiency, reflecting potential efficiency issues in managing larger agricultural areas or optimizing land use to promote trade. The implementation of the BRI has yielded varied results, with countries such as Turkey and Hungary have showing significant improvements in trade efficiency, while countries like Georgia have experienced declines, indicating that the positive effects of the BRI in promoting trade and improving infrastructure are not universally reflected in all participating countries. During the COVID-19 pandemic, some countries like South Africa and Croatia demonstrated significant trade efficiency, possibly benefiting from effective pandemic management or diversified trade mechanisms. Based on our findings, it is recommended that governments of participating countries to prioritize government efficiency, political stability, and regulatory quality. Specifically, each country should develop and implement targeted policies aimed at enhancing agricultural infrastructure, optimizing land use efficiency, and promoting trade liberalization through international cooperation. Additionally, the adaptability and enforcement of WTO rules should be strengthened, especially in the face of the rapidly changing global trade landscape, to ensure that the international trade system is effectively harnessed to promote economic development. These recommendations are intended to support policymakers in better utilizing international resources, thereby improving the overall efficiency and competitiveness of agricultural trade. In future research, it is crucial to examine the specific impact of the implementation of WTO rules and commitments on the trade efficiency of different countries. Furthermore, exploring the challenges faced by WTO members in implementing these rules and proposing corresponding improvements to policies and relevant capacity-building plans is essential. Additionally, investigating the significant differences in trade efficiency among different countries following the implementation of the Belt and Road Initiative (BRI) and the reasons behind these differences could contribute to the formulation of targeted trade promotion strategies, aiming to achieve more balanced and sustainable trade growth. Further research on how to enhance agricultural trade efficiency by improving land use efficiency and adopting advanced agricultural technologies and practices to optimize the use of land resources will also be valuable.
Data availability statement
Publicly available datasets were analyzed in this study. This data can be found at: https://www.fao.org/food-agriculture-statistics/en/.
Author contributions
TM: Conceptualization, Data curation, Formal analysis, Funding acquisition, Project administration, Resources, Writing – original draft. PP: Formal analysis, Funding acquisition, Methodology, Software, Supervision, Writing – review & editing. XL: Writing – review & editing, Data curation, Investigation, Validation, Visualization. JL: Writing – review & editing, Methodology, Software.
Funding
The author(s) declare that financial support was received for the research, authorship, and/or publication of this article. This research was supported by “the Fundamental Research Funds for the Central Universities of North Minzu University” (2022GBQY16).
Acknowledgments
The work was assisted by the Center of Econometrics, Chiang Mai University, and the China-ASEAN High-Quality Development Research Center at Shandong University of Finance and Economics.
Conflict of interest
The authors declare that the research was conducted in the absence of any commercial or financial relationships that could be construed as a potential conflict of interest.
The author(s) declared that they were an editorial board member of Frontiers, at the time of submission. This had no impact on the peer review process and the final decision.
Publisher’s note
All claims expressed in this article are solely those of the authors and do not necessarily represent those of their affiliated organizations, or those of the publisher, the editors and the reviewers. Any product that may be evaluated in this article, or claim that may be made by its manufacturer, is not guaranteed or endorsed by the publisher.
References
Abbas, S. (2014). Trade liberalization and its economic impact on developing and least developed countries. J. Int. Trade Law Policy 13, 215–221. doi: 10.1108/JITLP-06-2013-0018
Abdullahi, N., Aluko, O., and Huo, X. (2021). Determinants, efficiency and potential of agri-food exports from Nigeria to the EU: evidence from the stochastic frontier gravity model. Agric. Econ. 67, 337–349. doi: 10.17221/15/2021-agricecon
Abdullahi, N. M., Zhang, Q., Shahriar, S., Irshad, M., Ado, A. B., and Huo, X. (2022). Examining the determinants and efficiency of China’s agricultural exports using a stochastic frontier gravity model. PLoS One 17:e0274187. doi: 10.1371/journal.pone.0274187
Armstrong, S. (2007). “Measuring trade and trade potential: a survey”, Asia Pacific Economic Papers 368. Canberra: Australian National University.
Atif, R., Haiyun, L., and Mahmood, H. (2017). Pakistan’s agricultural exports, determinants and its potential: an application of stochastic frontier gravity model. J. Int. Trade Econ. Dev. 26, 257–276. doi: 10.1080/09638199.2016.1243724
Bria, L. N., and Joka, U. (2023). Position of Lamuru maize seed farming in Tarus Food Crop Seed Center, Kupang District. Agroland Agric. Sci. J. 10, 23–30. doi: 10.22487/agroland.v0i0.1256
Brinton, J., Simmonds, J., Minter, F., Leverington-Waite, M., Snape, J., and Uauy, C. (2017). Increased pericarp cell length underlies a major quantitative trait locus for grain weight in hexaploid wheat. New Phytol. 215, 1026–1038. doi: 10.1111/nph.14624
Cai, B., Shi, F., Meseretchanie, A., Betelhemabraham, G., and Zeng, R. (2024). Agricultural socialized services empowering smallholder rice producers to achieve high technical efficiency: empirical evidence from southern China. Front. Sustain. Food Syst. 8:1329872. doi: 10.3389/fsufs.2024.1329872
Cao, C., and Yuan, G. (2022). Foreign trade and virtual land resources: a case study of China’s grain. Agric. Econ. 68, 159–167. doi: 10.17221/85/2022-agricecon
Chu, K. (2023). Digital economy, China international trade potential, industries of BRI countries: evidence from stochastic frontier gravity model. Front. Bus. Econ. Manage. 12, 172–178. doi: 10.54097/fbem.v12i2.14875
Edison, E. (2021). Determinants of technical efficiency in smallholder maize crop farming: application of stochastic frontier production function. Int. J. Sci. Technol. Manage. 2, 1900–1906. doi: 10.46729/ijstm.v2i5.335
Fan, S. (2023). Does the Belt and Road Initiative promote bilateral trade? An empirical analysis of China and the belt and road countries. Glob. J. Emerg. Mark. Econ. 15, 190–214. doi: 10.1177/09749101231167453
Fan, H., Thi, V., Zhang, W., and Li, S. (2022). The influence of trade facilitation on agricultural product exports of China: empirical evidence from ASEAN countries. Econ. Res. 36:2143845. doi: 10.1080/1331677x.2022.2143845
Fu, J., Chen, L., and Xue, H. (2023). The impacts of trade facilitation provisions on fresh agricultural products trade between China and the BRI countries. Agriculture 13:272. doi: 10.3390/agriculture13020272
Gao, C., Cao, M., Wen, Y., and Xu, J. (2022). China’s outward foreign direct investment and bilateral trade potential: a theoretical and empirical study. Math. Probl. Eng. 2022, 1–13. doi: 10.1155/2022/5448359
Görg, H., and Mao, H. (2022). Does the Belt and Road Initiative stimulate Chinese exports? Evidence from micro data. World Econ. 45, 2084–2100. doi: 10.1111/twec.13258
Hu, W., Ge, Y., Dang, Q., Yu, H., Hu, Y., Ye, S., et al. (2020). Analysis of the development level of geo-economic relations between China and countries along the belt and road. Sustainability 12:816. doi: 10.3390/su12030816
Jiang, W., Zhang, H., and Lin, Y. (2022). Trade sustainability and efficiency under the Belt and Road Initiative: a stochastic frontier analysis of China’s trade potential at the industry level. Int. Trade J. 35, 1740–1752. doi: 10.1080/1540496X.2021.1925246
Kamal, M., Khan, S., and Gohar, N. (2020). Pakistan’s export performance and trade potential in central Asian region: analysis based on constant market share (CMS) and stochastic frontier gravity model. J. Public Aff. 21:e2254. doi: 10.1002/pa.2254
Khan, H., Chen, Y., and Lv, L. (2024). Does the China-Pakistan free trade agreement benefit the vegetable exports of Pakistan? A gravity estimation. Front. Sustain. Food Syst. 8:1362910. doi: 10.3389/fsufs.2024.1362910
Lee, S.-H., Mohtar, R., and Yoo, S. (2018). Analysis of trade-offs between food security and water-land savings through food trade and structural changes of virtual water trade in the Arab world. Hydrol. Earth Syst. Sci. Discuss. 2018, 1–25. doi: 10.5194/hess-2018-4
Liu, A., Lu, C., and Wang, Z. (2020). The roles of cultural and institutional distance in international trade: evidence from China’s trade with the belt and road countries. China Econ. Rev. 61:101234. doi: 10.1016/j.chieco.2018.10.001
Moon, W. (2022). Are there dynamic productivity gains from agricultural trade? China Agric. Econ. Rev. 14, 32–46. doi: 10.1108/caer-02-2021-0030
Muganyi, T., and Chen, H. (2016). Strategic economic partnerships, exchange rate policy and agricultural trade: a gravity model analysis of China’s agricultural trade flows. Open J. Soc. Sci. 4, 48–55. doi: 10.4236/jss.2016.45008
Nguyen, D. (2022). Determinants of Vietnam’s rice and coffee exports: using stochastic frontier gravity model. J. Asian Bus. Econ. Stud. 29, 19–34. doi: 10.1108/jabes-05-2020-0054
Pavcnik, N. (2002). Trade liberalization, exit, and productivity improvements: evidence from Chilean plants. Rev. Econ. Stud. 69, 245–276. doi: 10.1111/1467-937X.00205
Rathore, L. S., Aziz, D., Demeke, B., and Mekonnen, M. (2023). Sustainability assessment of virtual water flows through cereal and milled grain trade among US counties. Environ. Res. Commun. 5:035013. doi: 10.1088/2634-4505/acc353
Romyen, A., Nunti, C., and Neranon, P. (2023). Trade efficiency under FTA for Thailand’s agricultural exports: copula-based gravity stochastic frontier model. J. Econ. Struct. 11:9. doi: 10.1186/s40008-023-00303-0
Sanaev, S., Saparniyazov, I., and Rakhmatov, I. I. (2020). Growing vegetable (sweet) corn varieties and hybrids as a reproductive crop. Int. J. Prog. Sci. Technol. 24. doi: 10.52155/IJPSAT.V24.1.2509
Sanusi, O. I., Safi, S. K., Adeeko, O., and Tabash, M. I. (2022). Forecasting agricultural commodity price using different models: a case study of widely consumed grains in Nigeria. Agric. Resour. Econ. Intern. Sci. E-Journal. 8, 124–140. doi: 10.51599/10.51599/are.2022.08.02.07
Shahzad, M., Razzaq, A., Aslam, M., Gulzar, M., Naseer, M., and Nisar, N. (2019). Opportunities for agricultural trade in the context of the China-Pakistan economic corridor. Bus. Econ. Res. 9, 291–306. doi: 10.5296/ber.v9i1.14263
Shimono, Y., and Konuma, A. (2008). Effects of human-mediated processes on weed species composition in internationally traded grain commodities. Weed Res. 48, 10–18. doi: 10.1111/j.1365-3180.2008.00605.x
Siddika, R., and Ahmad, S. (2022). Trade liberalization and economic growth: a cross-country study using updated Sachs–Warner index. Asian J. Econ. Model. 10, 216–225. doi: 10.55493/5009.v10i3.4581
Sinclair, T., and Vadez, V. (2012). The future of grain legumes in cropping systems. Crop Pasture Sci. 63:501. doi: 10.1071/CP12128
Tian, Y. (2023). Trade prospects of China’s agricultural exports to countries along the “Belt and Road”. Front. Bus. Econ. Manage. 7, 221–226. doi: 10.54097/fbem.v7i1.4172
United States Department of Agriculture (USDA) . (2023). Foreign Agricultural Service. Agricultural Research Services, US.
Wang, B., Zhang, Y., Wang, T., Hong, L., Zhou, C., and Wu, T. (2022). Analysis of competitiveness and complementarity of Chinese fruits and vegetables in Pakistani market in the context of industrial internet of things. Mob. Inf. Syst. 2022, 1–7. doi: 10.1155/2022/3189858
Yang, L., and Tsai, S. (2022). Dynamic evolution of service trade network structure and influence mechanism in countries along the “Belt and Road” with big data analysis. Math. Probl. Eng. 2022, 1–13. doi: 10.1155/2022/8378137
Zhang, Z., Gao, Y., and Wei, T. (2022). The impact of trade barrier reductions on global value chains for agricultural products in China and countries along the ‘Belt and Road’. World Trade Rev. 21, 224–248. doi: 10.1017/S1474745621000586
Keywords: Belt and Road Initiative, agricultural trade, trade efficiency, maize, wheat, SFM
Citation: Miao T, Pastpipatkul P, Liu X and Liu J (2024) The trade potential of grain crops in the countries along the Belt and Road: evidence from a stochastic frontier model. Front. Sustain. Food Syst. 8:1404232. doi: 10.3389/fsufs.2024.1404232
Edited by:
Josef Abrham, Czech University of Life Sciences Prague, CzechiaReviewed by:
Liang Ma, Xi’an Jiaotong-Liverpool University, ChinaFuyou Guo, Qufu Normal University, China
Copyright © 2024 Miao, Pastpipatkul, Liu and Liu. This is an open-access article distributed under the terms of the Creative Commons Attribution License (CC BY). The use, distribution or reproduction in other forums is permitted, provided the original author(s) and the copyright owner(s) are credited and that the original publication in this journal is cited, in accordance with accepted academic practice. No use, distribution or reproduction is permitted which does not comply with these terms.
*Correspondence: Pathairat Pastpipatkul, cHB0aGFpcmF0cEBob3RtYWlsLmNvbQ==
 Ting Miao
 Pathairat Pastpipatkul2*
 Xinhua Liu
 Jianxu Liu