 Paresh Kumar Sarma
 Mohammad Jahangir Alam
 Ismat Ara Begum
 Andrew M. McKenzie3
94% of researchers rate our articles as excellent or good
Learn more about the work of our research integrity team to safeguard the quality of each article we publish.
Find out more
ORIGINAL RESEARCH article
Front. Sustain. Food Syst. , 27 May 2024
Sec. Agricultural and Food Economics
Volume 8 - 2024 | https://doi.org/10.3389/fsufs.2024.1395897
This article is part of the Research Topic Pushing The Frontiers Of Nutritional Life Cycle Assessment (nLCA) To Identify Globally Equitable And Sustainable Agri-Food Systems View all 15 articles
Food security and livelihood vulnerability are important issues for the economic sustainability of developing countries like Bangladesh. This study examines the influence of total factor productivity (TFP) on the livelihood vulnerability and food security of rice farming households in Bangladesh. Data from 1,841 rice farming households were extracted from the Bangladesh Integrated Household Survey (2015 and 2018) conducted by the International Food Policy Research Institute. Various statistical methods, such as the stochastic frontier model, principal component analysis, path analysis using structural equation modeling, and multivariate regression, were employed to analyze the data. The study utilizes a multivariate modeling approach that combines the stochastic frontier model to determine TFP and sophisticated methodologies to estimate the livelihood vulnerability index (LVI) and women’s empowerment in agriculture index (WEAI). The LVI, household dietary diversity Score (HDDS), TFP, and WEAI scores were 0.454, 10.72, 0.703, and 0.717, respectively. The results indicate a significant relationship between TFP and both LVI and HDDS. Higher TFP is associated with lower LVI and higher HDDS among rice farming households, suggesting that improving TFP can enhance food security and reduce vulnerability. The multivariate regression analysis reveals that TFP, household wealth index, women’s empowerment in agriculture index, per capita food expenditure, household level welfare, and household size have a positive significant impact on HDDS, while TFP is negatively associated with LVI, per capita food expenditure and household size. The findings underscore the importance of increasing TFP to improve food security, reduce livelihood vulnerability, and achieve sustainable development goals in countries like Bangladesh. Higher TFP yields positive outcomes regarding household dietary diversity and livelihood vulnerability, highlighting the need for agricultural policies that prioritize TFP enhancement. Policymakers and professionals can use these findings as a roadmap to implement advanced agricultural policies to achieve food security and reduce livelihood vulnerability. Improving household dietary diversity and reducing livelihood vulnerability can be achieved by focusing on increasing TFP, enhancing household wealth, women’s empowerment, per capita food expenditure, household welfare, and household size. Therefore, increasing TFP should be considered in the design of policies aiming to achieve SDGs Goal 2.
Bangladesh is primarily an agricultural country, and agriculture is critical to the country’s rapid economic growth. Rice is Bangladesh’s most important food crop, accounting for 75% of the cultivated area (Ganesh-Kumar et al., 2012) and providing 48% of rural employment, half of agricultural GDP (13.10% of total GDP), and approximately 75% of calories and 55% of protein consumed (Bhuiyan and Paul, 2004). In 2020, Bangladesh produced 465 million metric tons of rice on approximately 158 ha of land. Despite the COVID-19 pandemic, rice production has increased by approximately 38.70 million metric tons with the help of timely governmental initiatives. The present government has undertaken several innovative actions to further increase rice production (by 47 million metric tons by 2030, by 54 million metric tons by 2040, and by over 60 million metric tons by 2050) by minimizing the effect of natural and environmental disasters, including cyclones and floods (Ahmed, 2021). Furthermore, Bangladesh’s economy is a developing consumer economy, with a nominal GDP of USD 39 billion and a purchasing power parity of USD 29 billion (WFP, 2009; Raiz and Rahman, 2016; Villoria, 2019). However, it is confronted with major problems, including food insecurity. Despite the fact that the country has achieved food self-sufficiency, food insecurity affects a considerable number of people in the country. Over the next 30 years, rice output (a major crop in Bangladesh) is expected to have tripled (Nazma and Saiful, 2012; Hossain and Riad, 2021). Rice is the most consumed food in Bangladesh, accounting for more than 70% of people’s daily calories (Magnani et al., 2015). As a result, rice production self-sufficiency has become synonymous with food security (Bishwajit et al., 2013). Bangladesh has abundant quantities of key food crops, particularly rice, which is the country’s staple diet (Nazma and Saiful, 2012; Hossain and Riad, 2021). Food security is a global issue affecting all of us, with one out of every nine people going hungry every day (WFP, 2020). Additionally, 2 billion people around the world suffer from hunger owing to micronutrient shortages such as iron, vitamin A, and zinc (Ritchie et al., 2018). In Bangladesh, where overcrowding and the deteriorating interaction between land and humans (Nazma and Saiful, 2012) is making food security a major priority, food insecurity is particularly acute (Parvin and Ahsan, 2013).
The ratio of total agricultural production to the total input of land, labor, capital, and materials used in agricultural production is known as total factor productivity (TFP). An increase in TFP indicates that the growth rate of total production is faster than the growth rate of total input use. TFP will vary based upon the efficiency with which inputs are transformed into outputs. Several studies have claimed that technological efficiency (TE) and the extension of cultivable areas, rather than a technological shift, are the primary contributors to TFP in agriculture (Mullen, 2007; Block, 2010; Seaward, 2016). Previous research has mostly employed cross-sectional data and the stochastic frontier approach to measure TFP at the local level (Alemu et al., 1999; O’Donnell, 2008; Christopher and O'Donnell, 2012; Wassie, 2019). Only a few studies (Alam et al., 2011; Suphannachart, 2013; Kondo et al., 2017) have examined the TFP of rice in Bangladesh, and none have examined its impact on food security and livelihoods. We seek to shed light on this important issue by analyzing the relationship between TFP, food security, and livelihood vulnerability. We find empirical evidence showing that increases in TFP contribute to food security and reduce livelihood vulnerability in Bangladesh. Our results highlight the importance of formulating policies that enhance TFP to alleviate hunger and achieve food security in Bangladesh. The study’s novelty lies in its focus on analyzing the TFP of rice farming households in Bangladesh and its direct impact on food security and livelihood vulnerability. While previous studies have examined TFP in relation to agriculture, there is limited research specifically on TFP in the context of rice farming and its implications for food security and livelihood stability. To address this gap, our study adopts a multivariate modeling approach that combines a stochastic frontier model to determine TFP, along with sophisticated methodologies to estimate the LVI and WEAI. By integrating these variables and methodologies, our study provides a comprehensive analysis of the interactions between TFP, food security, and livelihood vulnerability, offering new insights into the relationships within the context of rice farming households in Bangladesh.
The remainder of the paper is organized as follows. Following this Introduction, Section 2 presents the conceptual framework followed by the methodology adopted in this study in the Section 3. The results are presented Section 4 and discussion is in Section 5. Finally, Section 64 provides the conclusions, including policy implications.
The conceptual framework (CF) provides a structured approach to understanding how specific interventions lead to desired outcomes. In the context of total factor productivity (TFP) and its impact on food security and livelihood vulnerability among rice farming households in Bangladesh, the CF illustrates how improving TFP can positively affect these variables. The study revealed significant relationships between TFP and indicators such as the HDDS and LVI, indicating that TFP improvements directly influence these variables.
Based on previous studies (Reddy, 2016; Dinesh et al., 2021; Reddy et al., 2022), Figure 1 shows that the graphical representation of the CF illustrates how TFP impacts both HDDI and LVI. Increasing TFP through modern technologies and better management practices enhances agricultural efficiency, leading to improved HDDS and decreased LVI. Conversely, decreased TFP has adverse effects. To enhance food security and livelihoods, interventions should focus on boosting TFP through measures such as agricultural training, technology access, infrastructure development, and market integration. These initiatives increase productivity, stabilize incomes, and diversify diets, ultimately enhancing the well-being and resilience of rice farming communities. Livelihood vulnerability is influenced by various factors, including human capital, natural capital, social capital, and financial capital of households or individuals (Liu et al., 2024). Livelihood strategies are considered key determinants of livelihood vulnerability. Households engaged in agriculture or other informal occupations, compared to those with members in government jobs, have lower HDDS, suggesting higher LVI (Kundu et al., 2021). Additionally, households with members suffering from chronic illness also experience higher levels of food insecurity and lower HDDS, indicating increased livelihood vulnerability (Dirghayu et al., 2023). This demonstrates an inverse relationship between livelihood vulnerability and household dietary diversity. Households facing higher livelihood vulnerability, characterized by socioeconomic disadvantages, tend to exhibit lower dietary diversity scores, suggesting reduced access to various foods. The conceptual framework presents an understanding of the pathways and mechanisms through how TFP impact food security and livelihoods. TFP, which reflects the efficiency of resource use in production, can influence households’ overall productivity and economic well-being. Conversely, LVI provides insights into the susceptibility of households to external shocks and stresses, highlighting areas where interventions are needed to enhance resilience. The HDDS is crucial for assessing households’ nutritional status and food access, directly impacting their food security. Moreover, the study emphasizes the significance of factors such as women’s empowerment, access to social safety nets, and wealth index in TFP analysis. Integrating these factors into the framework ensures a comprehensive understanding of the pathways toward achieving desired outcomes. Policymakers and stakeholders can utilize this study as a roadmap for implementing advanced agricultural policies in Bangladesh and similar contexts.
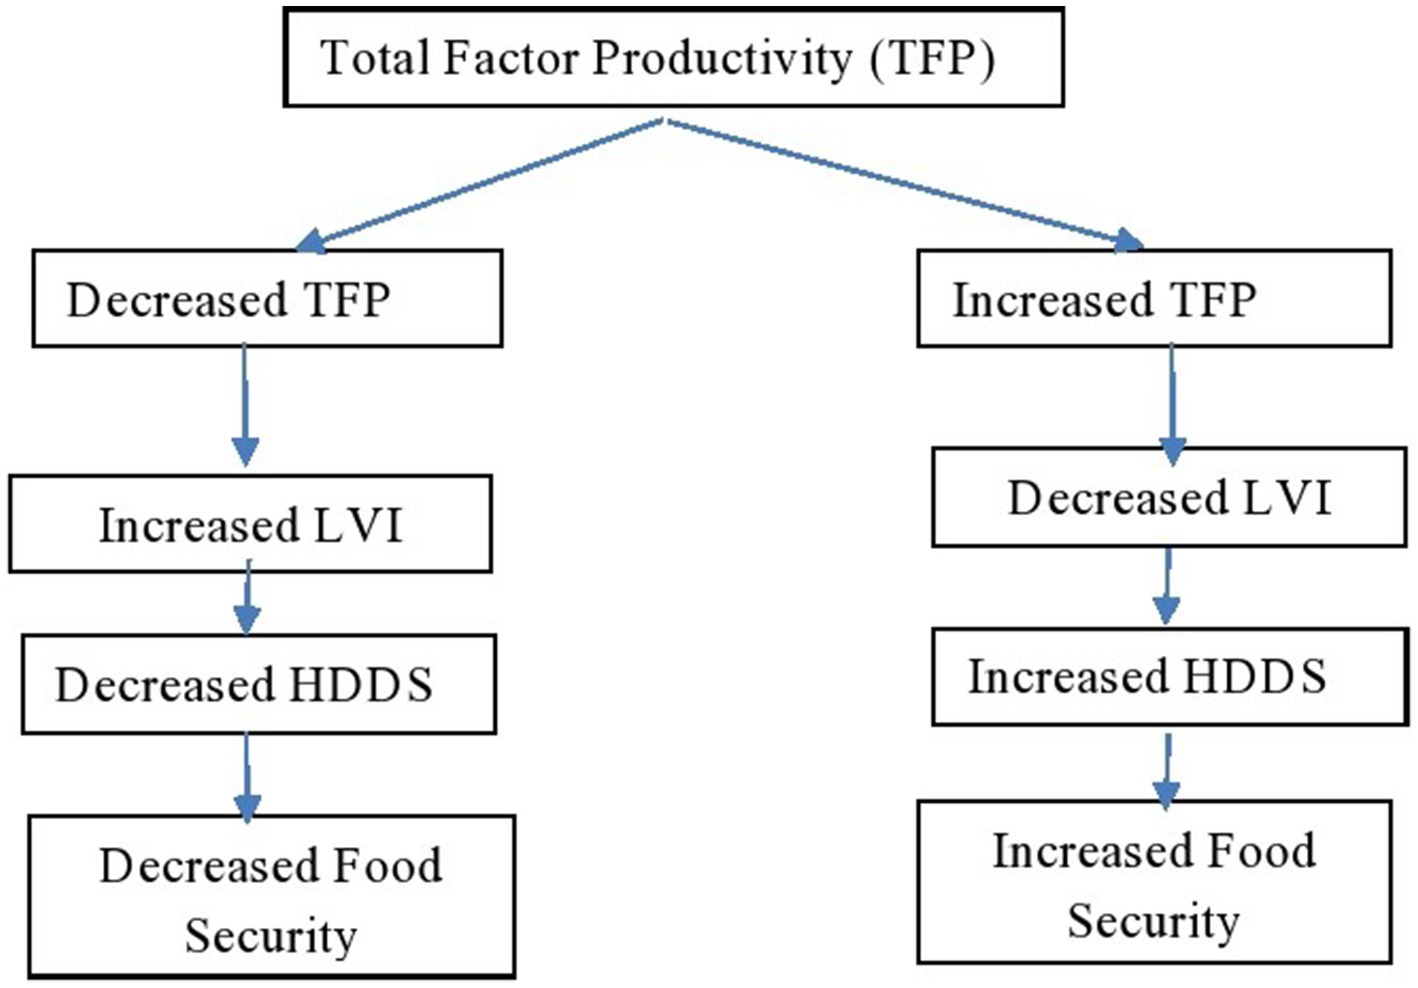
Figure 1. Conceptual framework: pathways to increase food security and livelihoods.
The study used the 2015 and 2018 Bangladesh Integrated Household Survey (BIHS) administered by the International Food Policy Research Institute (IFPRI). Data for 1,841 rice farming households were extracted from a total of 5,603 households. The BIHS provides nationally representative household survey data. The IFPRI dataset is publicly available. The study used the IFPRI dataset and hence did not require the approval of an institutional review board.
The measurements of response and predictor variables, as well as their a priori expected signs according to economic theory, are presented in Table 1.
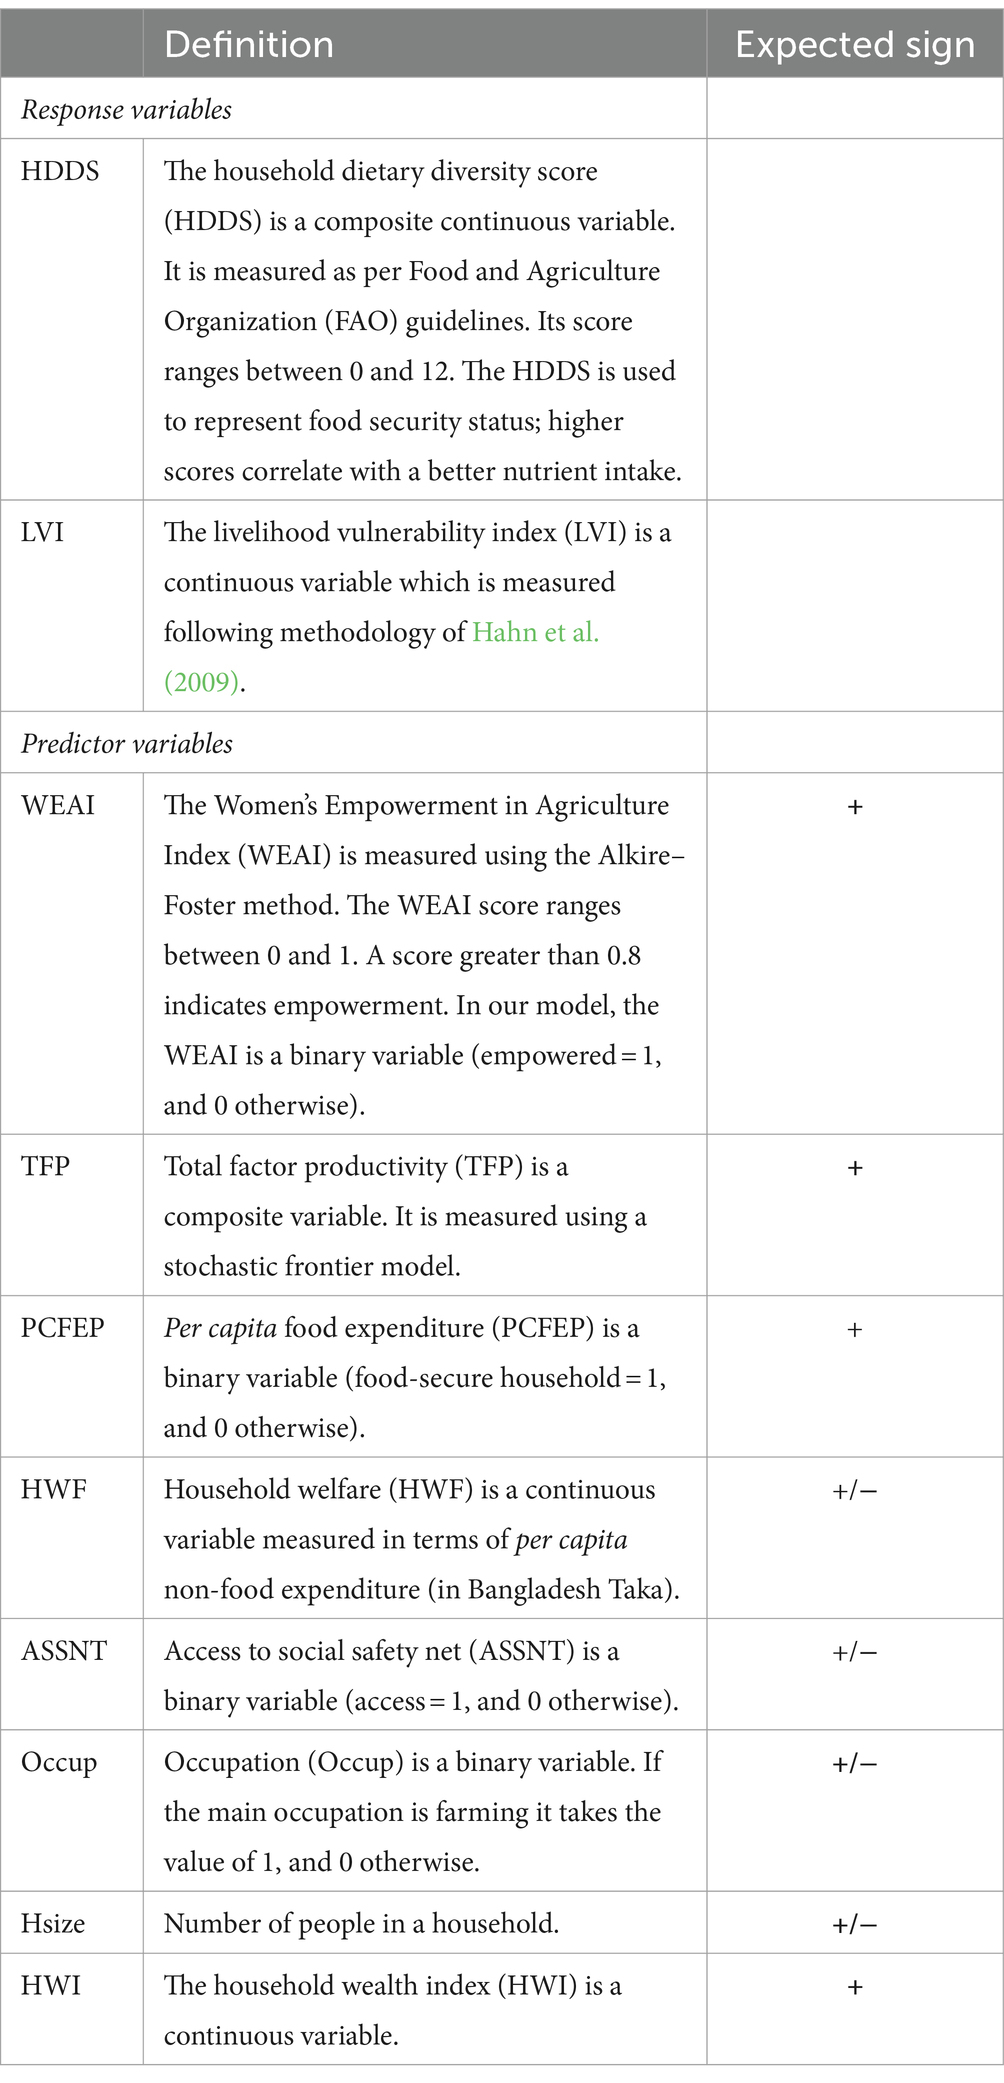
Table 1. Description of response and predictor variables.
The impacts of TFP on rice farmers’ HDDS and LVI are examined using a mix of three econometric methodologies. First, a stochastic frontier model was used to determine the TFP. Second, we used the method of Hahn et al. (2009) and Alkire et al. (2013) to estimate the LVI and WEAI, respectively. A multivariate regression model was utilized in the third stage, with LVI and HDDS as response or outcome variables, which are explained by TFP and other predictor variables listed in Table 1.
We measured TFP at the farm level as the residual from the production function (Baily et al., 1992; Neil et al., 1992; Bartelsman and Dhrymes, 1998; Şeker and Saliola, 2018). We estimated household TFP as a multiplicative combination of change in technical efficiency (EC) and technical change (TC), where TE is:
Equation (1) can be used to compute the TE of production for the ith farm in the tth year (Coelli et al., 2005). Here, are the error components that are uncorrelated with the regressors, and are the non-negative variables associated with technical inefficiency in production.
ECit can be expressed as follows in Equation (2):
where .
Here, the notation represents t period observations and represents s period observations. denotes the input variables.
TC quantifies the change in the border input distance function, regardless of where the input distance functions for states outside the frontier are located, as expected. The index of technical change (TCit) can be derived directly from the estimated parameters of the stochastic production frontier model between two neighboring periods s and t. The partial derivatives of the production function are evaluated with respect to time at Xit and Xis. The geometric mean is calculated after converting these into indexes. The technical change index is calculated as follows in Equation (3), following Coelli et al. (2005):
Therefore, we arrive at TFP in Equation (4):
The HDDS is a snapshot of a family’s capacity to access a range of foods based on their financial situation (Kennedy et al., 2010; Headey and Ecker, 2013). It has previously been employed as a proxy for food access in the home as part of the Food and Nutrition Technical Assistance Project (FANTA) (Swindale and Bilinsky, 2006). The score was calculated by aggregating the number of days that households consumed at least one item from each of the 12 specified food groups in the previous 7 days (Sibhatu et al., 2015). The range of the HDDS is from 0 to 12.
The HDDS is written as follows:
The HDDS indicator is calculated over a 7-day recall period using 12 food groups: cereals; pulses; fruits, vegetables; edible oil; meat, eggs, and milk; fruits; large fish; small fish; spices; drinks and beverages; and other foods produced outside the home. The values for A to L can be 0 or 1.
The HWI is a composite variable created using principal component analysis (PCA). Variables for household land, assets, and productive assets, as well as home amenity ownership indicators, were included in the PCA model. Among the vital commodities are a car, motorcycle, bicycle, radio, gas cooker, sewing machine, bed, and cell phone, as well as livestock (Mutisya et al., 2016). Formally, the HWI for household i is the following linear combination in Equation (5):
where and are the mean and standard deviation of asset , respectively, and represents the weight for each variable for the first principal component. are the household current assets, household-level productive assets, and livestock value.
The farmers’ LVI is a composite variable. The integrated indicators approach established by Hahn et al. (2009) was used to measure it. Based on previous research (Hahn et al., 2009; Gerlitz et al., 2017; Adu et al., 2018; Amuzu and Kabo-bah, 2018; Parker et al., 2019), the LVI was derived from five major components, including social capital (group membership, access to NGOs, access to banks, access to agricultural offices, access to input dealers, etc.), human capital (education, age, information, access to information), physical capital (household assets, household agricultural productive aspects, mobile access, access to water), financial capital (savings, loans, value of livestock, ownership of plot), and natural capital (access to water supply, amount of land, etc.). Several observations are included in each major component, with each sub-value component being determined on a distinct scale. Each sub-value component was standardized into an index (Hahn et al., 2009) as follows in Equation (6):
Here, the mean value of the sub-component indicators is Sr, whereas the minimum and maximum values are Smin and Smax, respectively. To obtain the index of each major component, the sub-component indicators were averaged as follows in Equation (7):
where: Mr is one of the five major components for region r (social capital, human capital, physical capital, financial capital, and natural capital); Sri denotes the sub-components that make up each major component, which are indexed by i; and n is the number of sub-components in each major component. Once the values for each of the five major components for a region are calculated, they are averaged using Equation (8) to obtain the region-level LVI:
where: LVIr denotes the mean value of the livelihood vulnerability index; Mri denotes the value of one of the major components i; and WMi denotes the weights of each major component i.
It is worth noting that Equation (8) can be expanded as follows through Equation (9):
The WEAI was used to assess women’s empowerment. The WEAI, launched in March 2012 by the Oxford Poverty and Human Development Initiative (OPHI), the United States Agency for International Development (USAID), and the IFPRI, is a direct indication of economic empowerment and gender parity at the household and individual levels (Yang and Stanley, 2012; Alkire et al., 2013). The multidimensional empowerment measurement, using the Alkire–Foster method, helps to illustrate women’s accomplishments in 10 indicators and five empowerment areas (5DE). The opposite of empowerment in these five areas is de-empowerment, which is computed as follows using Equation (10):
where Mo is the overall disempowerment score, while 5DE is measured using 10 indicators with their respective weights. Each sign indicates whether or not a person is meeting their goals in that area.
Another unique component of the WEAI is the gender parity index (GPI), which compares women’s and men’s empowerment across the 5DE in the same household. It can be expressed as follows:
where: 5DE is the degree of empowered women; and GPI is the relative empowerment of women in the household, according to the WEAI for gender empowerment in agriculture. The weights assigned to the index are 0.9 for 5DE and 0.1 for GPI.
We estimated the impact of TFP on HDDS and LVI using a standard multivariate linear regression model. The functional form of a multivariate regression model is given below in Equation (12):
where: is a 1 × 2 vector of the response variables HDDS and LVI; and is a 2 × 8 matrix of the predictor variables listed in Table 1.
Enhancing rice production efficiency so that maximum output can be produced with the same number of inputs is crucial for improving food security. To evaluate this, the efficiency of the TFP is utilized. This is a measure of how well agricultural land, labor, capital, and materials are used to generate an agricultural output, and the ratio of total agricultural output to total production inputs is used to calculate it. When more output is produced from a fixed number of resources, TFP increases, indicating that resources are being used more efficiently (IFPRI, 2018). This contributes to the sustainable development of livelihoods, which leads to increased food and nutrition security. Household food security is far more difficult to achieve, as it is influenced by agricultural production factors and numerous sources of income and wealth that influence food purchases, as well as other services, such as nutrition education, health, water, and sanitation (Ragasa and Mazunda, 2018). TE, EC, TC, and TFP were estimated using a stochastic frontier model. The results revealed technical efficiencies of 0.637 and 0.646 in 2015 and 2018, respectively. This indicates that rice farmers have opportunities to increase TE by 35% to increase production with the same amount of inputs. The overall economic efficiency was 1.29%, while TFP was only 70% (see Table 2).
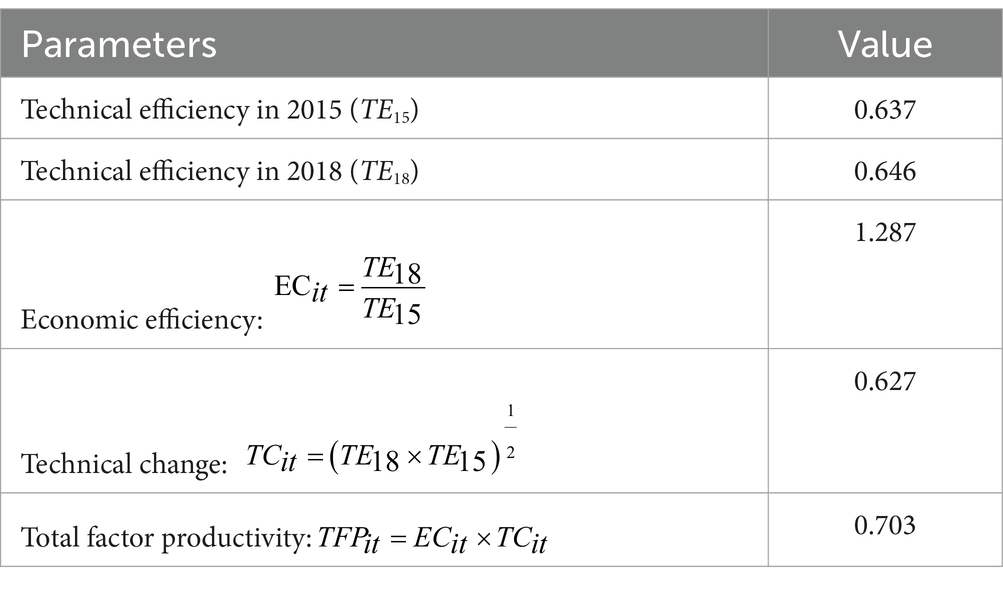
Table 2. The TFP of rice farming households.
Economic efficiency, which is a measure of the ratio between technical efficiencies in different years, was calculated to be 1.287, indicating the overall efficiency of production processes. The technical change factor, showing the combined impact of technical efficiencies, was found to be 0.627. The TFP was determined to be 0.703, signifying the level of productivity achieved by rice farming households in Bangladesh. This value reflects the efficiency of utilizing resources such as land, labor, capital, and materials to generate agricultural output. A higher TFP indicates a more efficient use of resources, leading to increased agricultural productivity and potentially improved food security and livelihood outcomes for farmers.
Figure 2A shows the distribution of TE scores. The rice farmers’ TE scores ranged from 0 to 1, with a higher number indicating better production techniques. The farmers’ average TE was 0.63, implying that they could lower their input use by 37% while maintaining the same output level if they produced rice at the same level as the best farmers. The distribution of TE scores (Figure 2A) shows that most rice farms (almost half) had TE values between 0.61 and 0.80. Figure 2B depicts the TFP of rice farming households. The results reveal that, for the last 3 years studied (from 2015 to 2018), the average value of TFP was 0.702, which demonstrates an increase in the TFP. If farmers produced rice in the same manner as the most efficient farmers, they could lower their input use by 29% while maintaining the same level of production. The largest concentration (approximately 40.85%) of TFP scores was between 0.81 and 5.43.
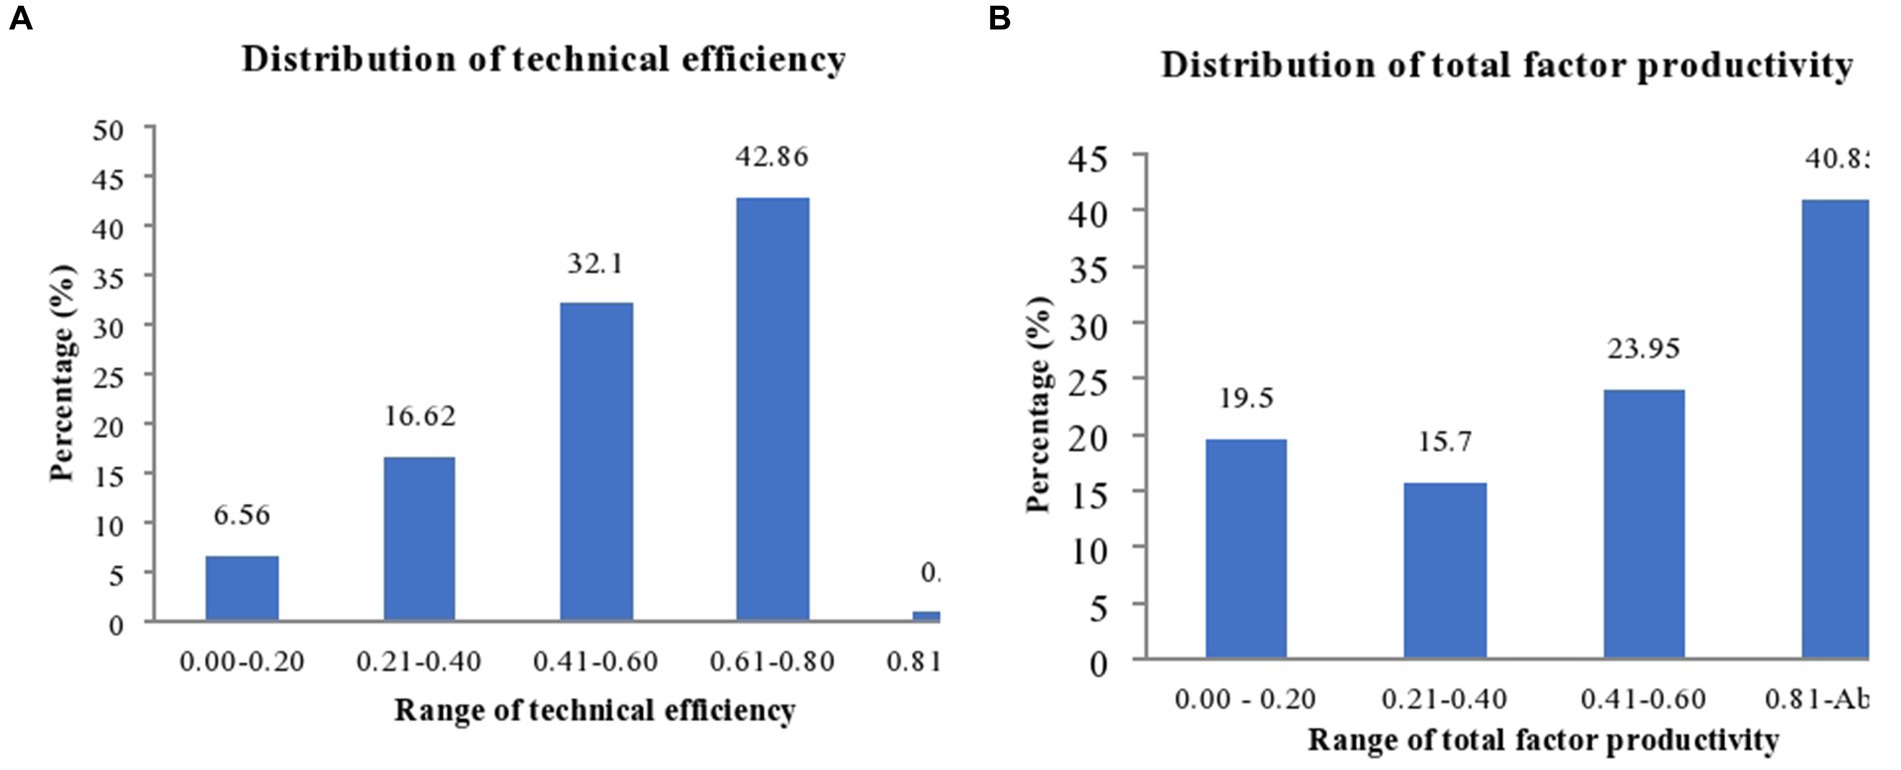
Figure 2. (A) Technical efficiency (TE) distributions of rice farmers. (B) Total factor productivity (TFP) distributions of rice farmers.
The HDDS is a food security assessment tool that has been validated in a number of countries as an approximate estimate of food availability and accessibility, which are two crucial factors of food security (Yohannes et al., 2002; Swindale and Bilinsky, 2006; WFP, 2009; Cordero-Ahiman et al., 2017). It determines how much of each food was consumed at home in a specific time period, such as the last 24 or 48 h (Teklewold et al., 2013; Cordero-Ahiman et al., 2017). The HDDS is a continuous score ranging from 0 to 12, with higher scores indicating higher nutrient intake based on whether the household consumes each of the 12 food groups previously detailed. Table 3 shows the results for the household dietary status of the farm households.
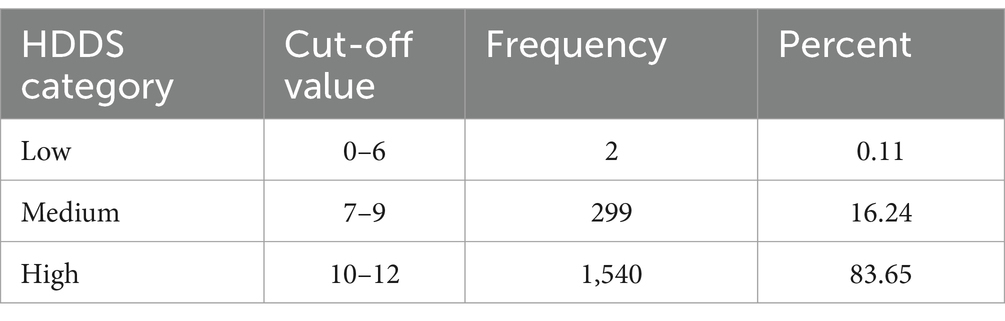
Table 3. Categorization of respondents with respect to the HDDS.
Dietary variety was low in 0.11% of the homes, according to the findings (with a HDDS of less than 6). With scores ranging from 7 to 9 points, 16.24% of families fall into the medium dietary variety category, while the remaining 83.65% fall into the higher dietary diversity category, with scores exceeding 10 points. This means that 16.35% of households lack adequate dietary diversification, whereas the majority (83.65%) have adequate dietary diversification.
Hahn et al. (2009) created the LVI to quantify farmers’ vulnerability to climate change and unpredictability (Adu et al., 2018). This vulnerability is measured by the LVI value, which ranges from 0 to 1. The higher the LVI number, the greater the vulnerability. We found that the sample rice farmers are moderately vulnerable to climate change, as measured by the LVI index value of 0.454. The weighted average of inputs, labor, and capital was used to compute TFP, which is a measure of productivity calculated by dividing the total output of the entire economy by the weighted average of inputs, labor, and capital. This denotes whether the actual output growth is outpacing the increase in inputs such as manpower and capital. We found the average TFP to be 0.702.
The descriptive statistics for the HDDS, LVI, and TFP are shown in Table 4.
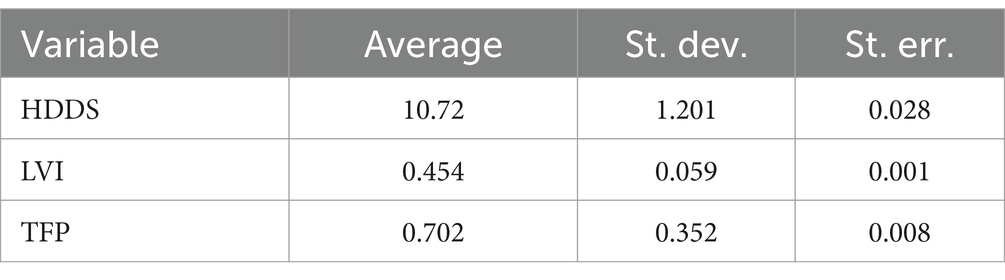
Table 4. Descriptive statistics for the HDDS, LVI, and TFP.
Pearson’s correlation coefficient results show that the HDDS and LVI are significantly correlated (p < 0.01) (Table 5). There is a weak positive correlation between the LVI and HDDS (r = 0.1004; p < 0.01) but a strong positive correlation between Hsize and the HDDS (r = 0.208; p < 0.01). TFP has a positive correlation with the WEAI (r = 0.037; p < 0.109) and the HWI (r = 0.012; p < 0.582) but a negative correlation with PCFEP (r = −0.013; p < 0.10) and HWF (r = −0.038; p < 0.570). The LVI is weakly positively correlated with Hsize (r = 0.166; p < 0.01) and the HWI (r = 0.029; p < 0.10). The HDDS is weakly positively correlated with TFP (r = 0.018; p < 0.10), Hsize (r = 0.208; p < 0.01), the WEAI (r = 0.061; p < 0.01), PCFEP (r = 0.176; p < 0.01), HWF (r = 0.124; p < 0.01), and the HWI (r = 0.072; p < 0.01).
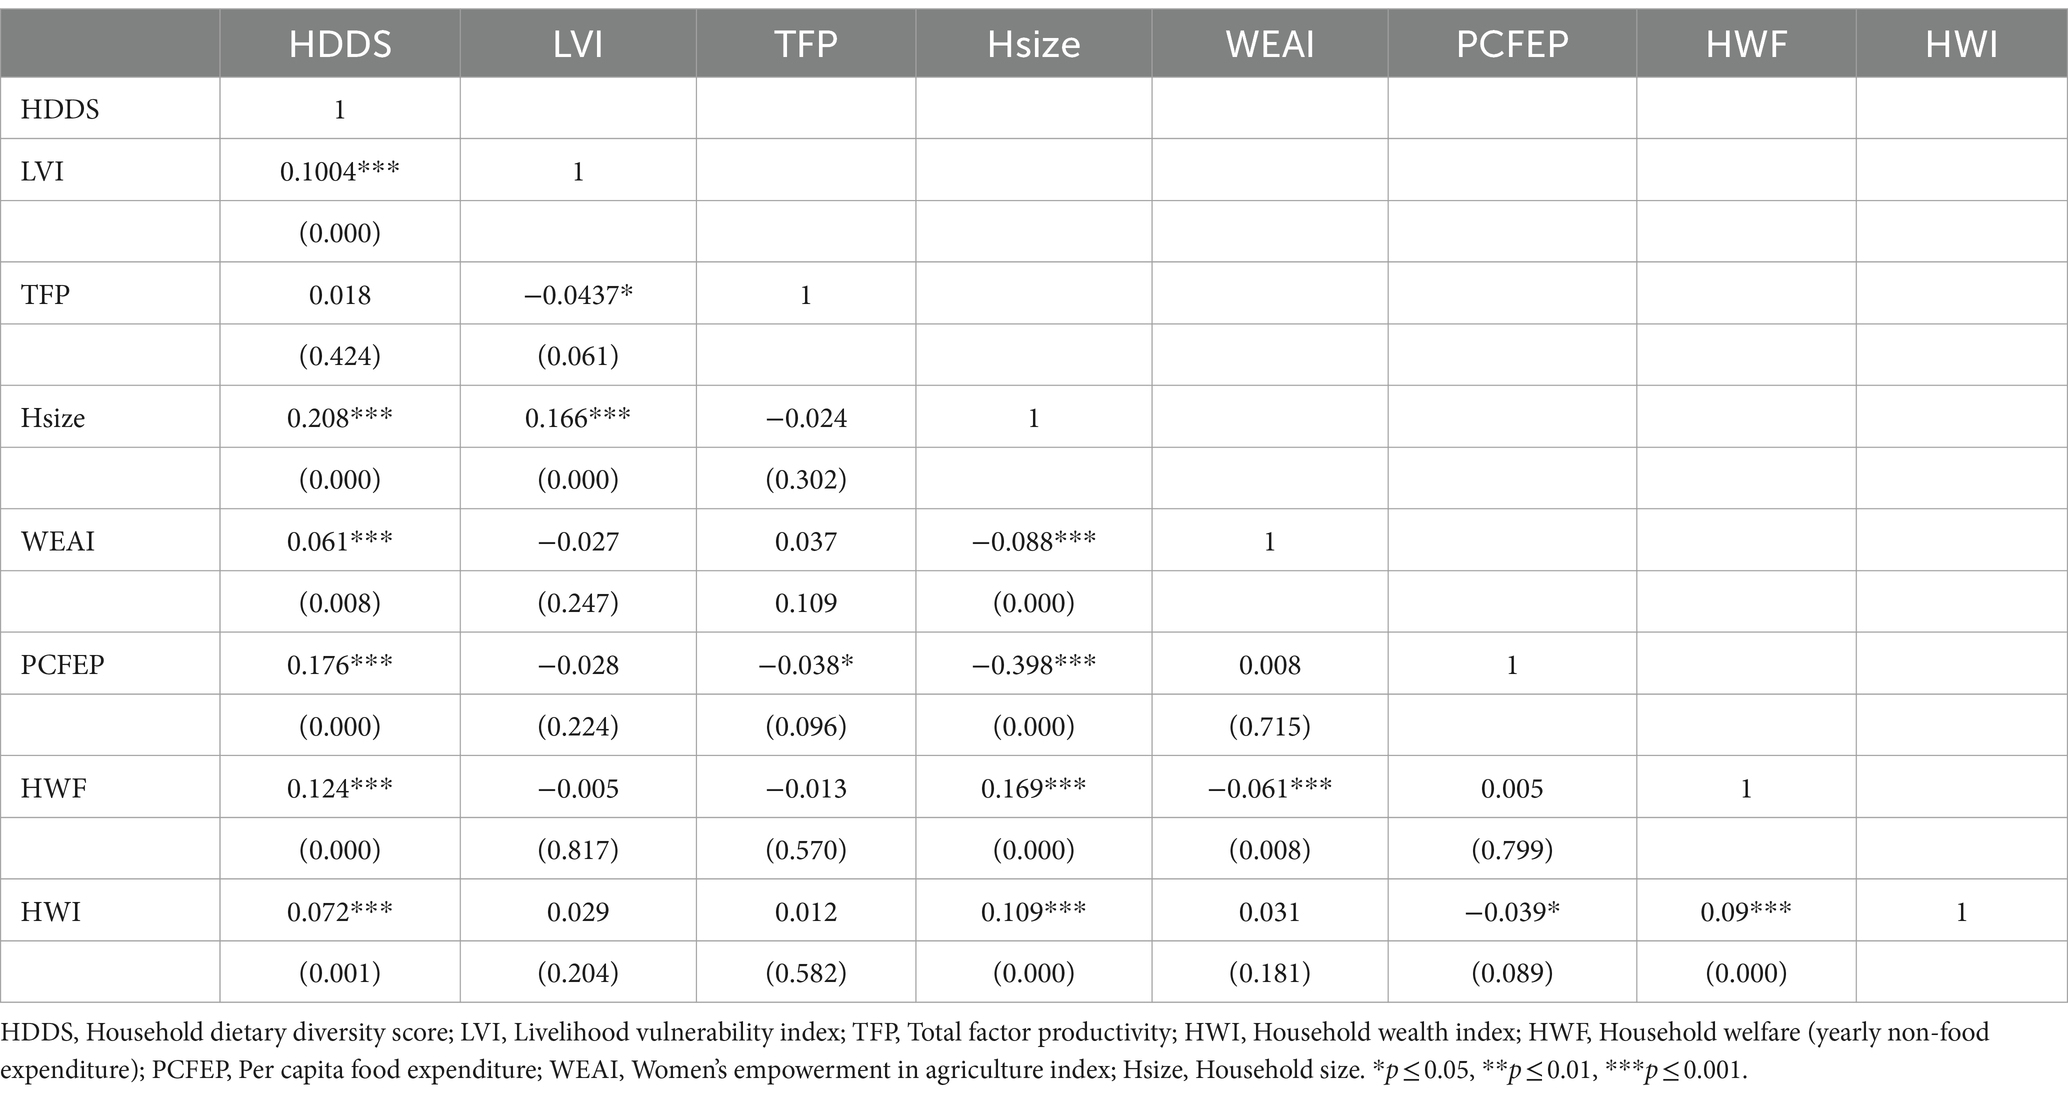
Table 5. Pearson’s correlation coefficient between the continuous variables.
Table 5 provides correlation coefficients for TFP with HDDS and LVI. The study found a positive correlation between TFP and HDDS, indicating that as TFP increases, the HDDS also tends to increase. On the other hand, there was a negative correlation between TFP and LVI, suggesting that higher TFP can lead to lower livelihood vulnerability.
Causal relationships between key variables may consist of direct and indirect effects. Direct causal effects are effects that go directly from one variable to another. Indirect effects occur when one or more variables mediate the relationship between two variables. Path diagrams can be used to visualize the structural equation model: Figure 3 shows that the variables (TFP, LVI, and HDDS) are interconnected. We find that TFP has a direct positive effect on the HDDS but has a negative effect on the LVI.
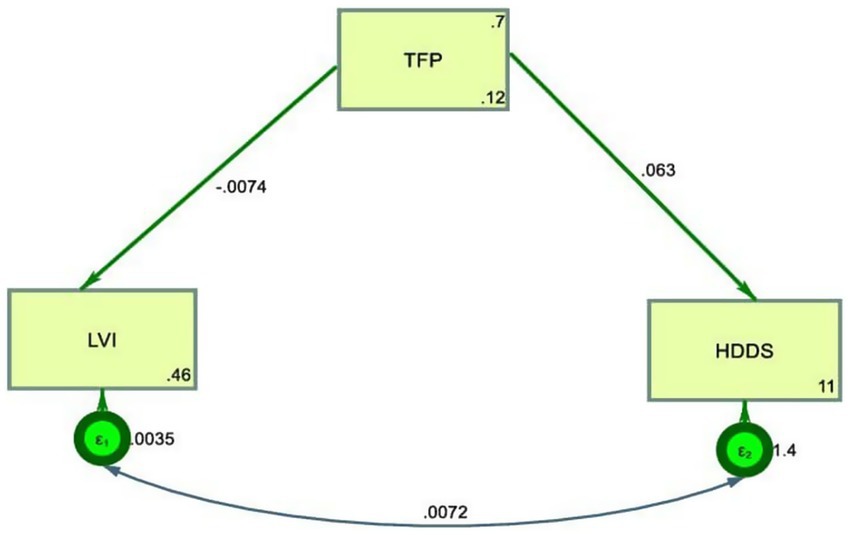
Figure 3. Path diagram of structural equation model.
The diagram illustrates how TFP significantly negatively influences the Livelihood Vulnerability Index (LVI), suggesting that increasing TFP can potentially reduce livelihood vulnerability among rice farming households in Bangladesh. Additionally, the diagram highlights a positive dependence of HDDS on TFP and LVI, indicating that higher TFP can lead to improved household dietary diversity, which is essential for better nutrient intake and overall food security status.
Table 6 presents the total causal effect. We found a significantly inverse relationship between the LVI and TFP (β = −0.007; p < 0.05) but a positive relationship between the HDDS and TFP.
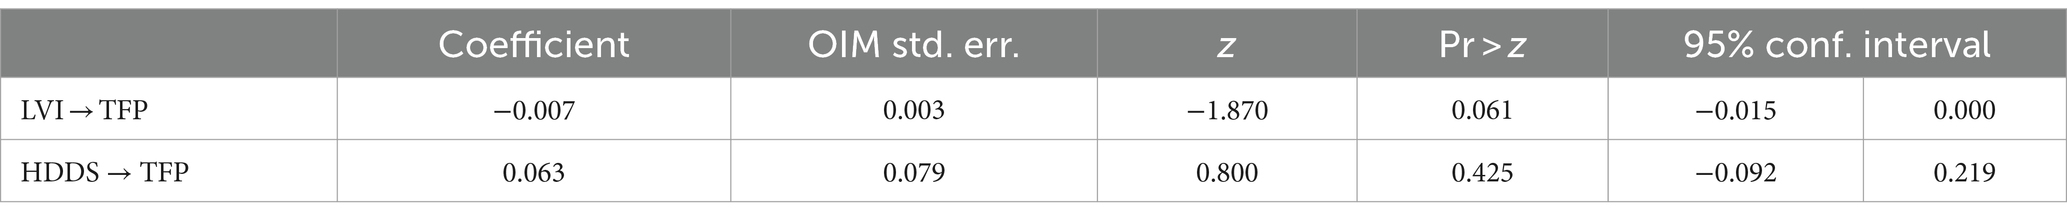
Table 6. Total effect.
Our regression results are presented in Table 7, which highlights the impact of TFP on the HDDS and LVI. Notably, we see that TFP has a significant positive effect on the HDDS, implying a one-unit increase in TFP, on average, increases the HDDS by 0.127 units. In addition, the WEAI also has a significantly positive effect on the HDDS. Table 6 also reveals that higher scores for the HWI, Hsize, PCFEP, and HWF are all associated with a higher HDDS levels.
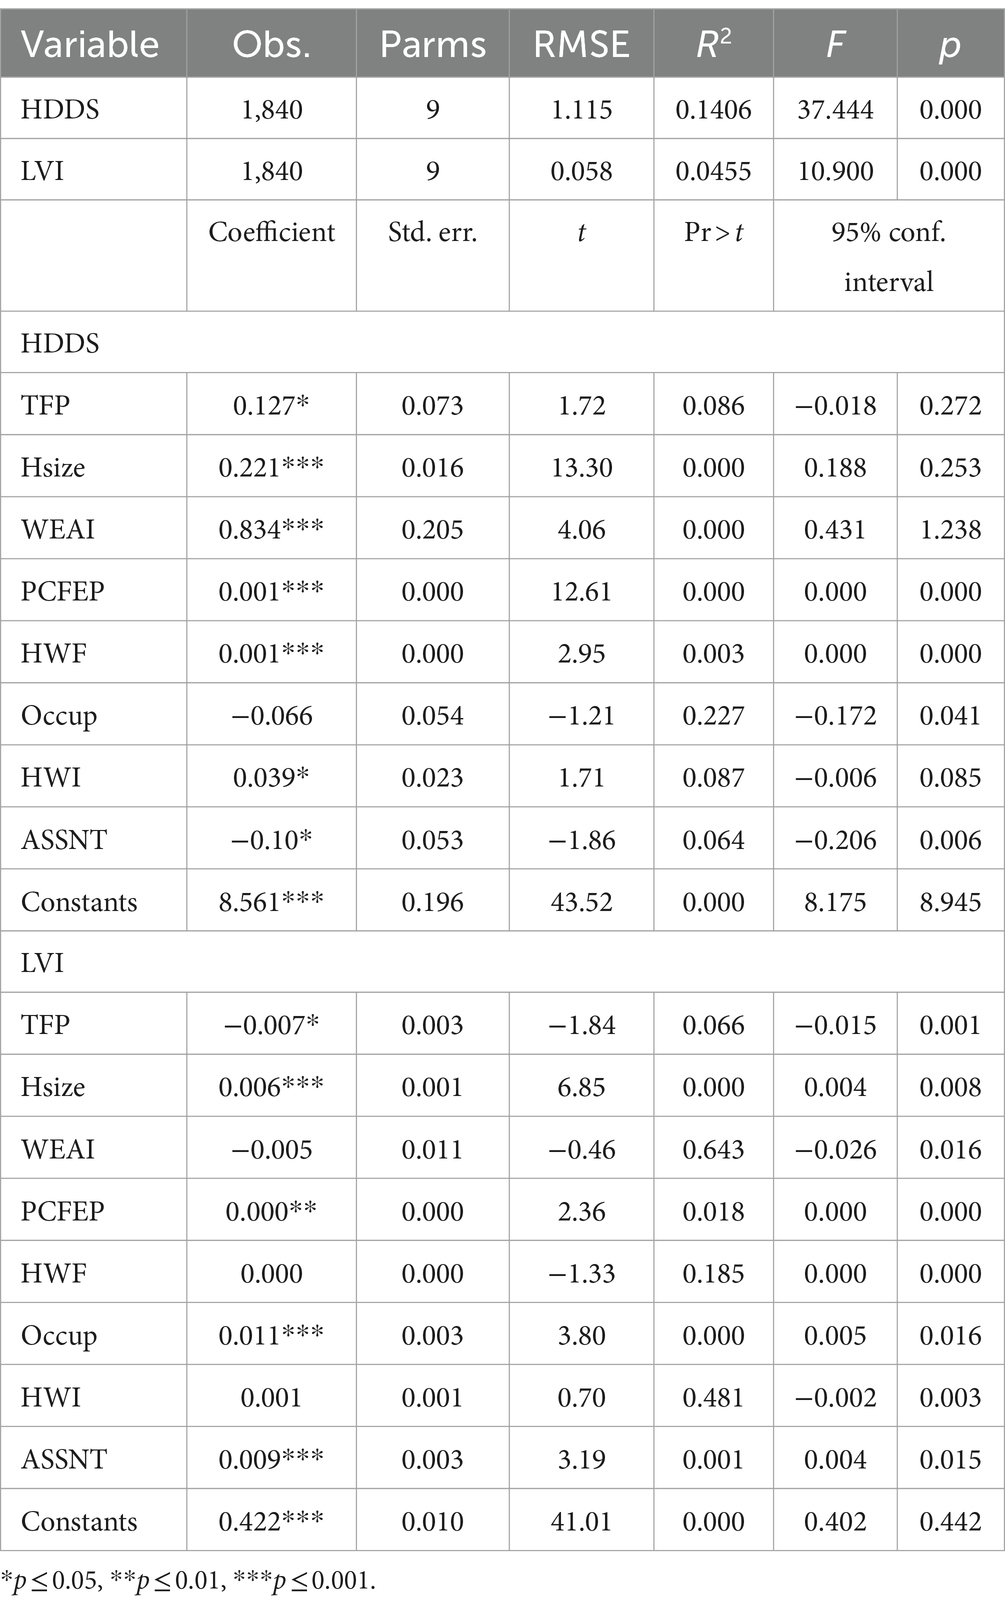
Table 7. Multivariate regression results.
The HDDS is an important nutrition outcome measuring the economic ability of a household to access a variety of foods (Huluka and Wondimagegnhu, 2019). Our results are in line with our a priori assumptions and highlight the fact that PCFEP is a key indicator of a household’s ability to buy enough staple and nutritious food. Our results show that PCFEP has a significant positive impact on the HDDS. We argue that the positive effects of Hsize on the HDDS may be attributed to the fact that large families typically have more non-farm income and a greater ability to purchase diversified food items. This result is in contrast to some prior studies that have found that Hsize has a negative impact on HDDS (Adesina and Zinnah, 1993; Mulmi et al., 2017; Ochieng et al., 2017).
Similarly, our finding that HWF has a positive impact on the HDDS makes intuitive sense, as it is a good proxy of household welfare, as confirmed by Chegini et al. (2021). Government social safety net programs represent one of the strategies to improve households’ food consumption. Hailu and Amare (2022) found that an effective safety net program significantly increases households’ calorie intake. In the present study, we found that ASSNT has a negative relationship with the HDDS, which means that the farm households receiving safety net support invest monies in non-food expenditure for income-generating activities.
Our results also clearly show that TFP significantly lowers the level of the LVI, with a one-unit increase in TFP decreasing the LVI by 0.007 units. Interestingly, the LVI is positively affected by Hsize, PCFEP, having a farming household, and ASSNT. Again, these results appear to be intuitively reasonable. Large households are better able to diversify their talents and, generate non-farm income when needed and lower their livelihood vulnerability levels. The LVI is used to measure the vulnerability of farm households to climate change and variability. Furthermore, the more households spend on food per capita, the lower their LVI. There is also obviously a direct relationship between ASSNT and a lower LVI. In addition, we found that PCFEP has a significant positive impact on farmers’ LVI. The coefficient for the Total Factor Productivity (TFP) variable is 0.1269, with a standard error of 0.0739. The t value for this coefficient is 1.720, and the p value is 0.0860. The results showed that TFP had a significant impact on both HDDS and LVI, underlining the importance of TFP in improving food security and reducing livelihood vulnerability.
Government safety nets have a clear and measurable impact on the lives of low-income families and reduce their food insecurity. Many safety net programs have been launched in the study area, such as old age allowance, widow allowance, vulnerable group development (VGD)/vulnerable group feeding (VGF), test relief, food for work, cash transfers, food transfers, price subsidies, job generation, housing for the homeless, an efficiency development fund for expatriate workers, Ekti Bari Ekti Khamar, and microcredit, among many others. We found that ASSNT has a positively significant (p < 0.01) association with the LVI. When rice farmers are exposed to the adverse impacts of natural hazards, injury, loss, or disruption to their livelihood, safety nets play a crucial role in protecting them.
This manuscript examines the relationship between TFP, LVI, and HDDS in rice farming households in Bangladesh. The study analyzes data from the Bangladesh Integrated Household Survey 2015 and 2018 using econometric methods such as the stochastic frontier model, multivariate regression analysis, and structural equation modeling. The results show that TFP significantly affects both LVI and HDDS. Higher TFP is associated with reduced LVI and increased HDDS among rice farming households, similar to previous studies (Alam et al., 2011, 2014; Hoq et al., 2021). This suggests that improving TFP can enhance food security and reduce vulnerability in these households. The multivariate regression analysis reveals that TFP, household wealth index, women’s empowerment in agriculture index, per capita food expenditure, household level welfare, and household size have a positive impact on HDDS, while TFP is negatively associated with LVI, along with per capita food expenditure and household size (Dua and Garg, 2019). The study also examines the correlation between TFP, HDDS, and LVI using Pearson’s correlation coefficients and structural equation modeling. The multivariate regression model used in the study identifies significant indicators related to HDDS and LVI, as well as the impact of TFP on these measures. Overall, the findings suggest that increasing TFP is crucial for improving food security (Saha et al., 2021), reducing livelihood vulnerability, and achieving sustainable development goals in countries like Bangladesh. Higher TFP leads to positive outcomes in terms of household dietary diversity and livelihood vulnerability, underscoring the importance of advancing agricultural policies to enhance TFP in order to achieve food security and reduce vulnerability in rice farming households. The study’s findings could be valuable for policymakers and professionals in formulating advanced agricultural policies to achieve food security and reduce livelihood vulnerability in the country.
The study on TFP and its impact on food security and livelihood vulnerability of rice farming households in Bangladesh offers valuable insights for policymakers and professionals in the agricultural sector. The investigation utilized a multivariate modeling approach and data from the Bangladesh Integrated Household Survey to analyze the relationship between TFP, HDDS, and LVI. The findings indicate that increasing TFP can reduce livelihood vulnerability and improve food security, contributing to sustainable development Goal 2. The study identified significant indicators related to household dietary diversity score and livelihood vulnerability index, highlighting the importance of TFP in influencing these measures. Specifically, TFP was found to have a positive association with household dietary diversity score and a negative association with livelihood vulnerability index, underscoring its crucial role in enhancing food security and reducing livelihood vulnerability. The study suggests that policymakers and professionals should prioritize implementing advanced agricultural policies that focus on increasing TFP to achieve food security and mitigate livelihood vulnerability in developing countries like Bangladesh. Recommendations may include enhancing access to technology-related services, closing gaps in women’s empowerment and technical efficiency, and promoting agricultural input intensification. However, the study is limited in its generalizability as it specifically focused on rice farming households in Bangladesh. Further research is needed to explore the intricacies of the relationship between TFP, food security, and livelihood vulnerability in more depth, possibly considering additional factors or variables that could influence these outcomes. Overall, the study provides a solid foundation for understanding the importance of TFP in improving food security and reducing LVI. It offers valuable insights for policymakers and professionals to guide future agricultural policies and interventions in Bangladesh and beyond.
Publicly available datasets were analyzed in this study. This data can be found at: https://www.ifpri.org/publication/bangladesh-integrated-household-survey-bihs-2018-2019.
PS: Writing – original draft, Software, Formal Analysis, Data curation, Conceptualization. MA: Writing – review & editing, Validation, Supervision, Methodology, Investigation, Conceptualization. IB: Writing – review & editing, Validation, Supervision, Methodology, Conceptualization. AM: Writing – review & editing, Validation, Methodology, Conceptualization.
The author(s) declare that financial support was received for the research, authorship, and/or publication of this article. This work was supported by Fryar Price Risk Management Center of Excellence, Agricultural Economics & Agribusiness Department, Dale Bumpers College of Agriculture Food & Life Sciences, and University of Arkansas System Division of Agriculture.
The authors declare that the research was conducted in the absence of any commercial or financial relationships that could be construed as a potential conflict of interest.
All claims expressed in this article are solely those of the authors and do not necessarily represent those of their affiliated organizations, or those of the publisher, the editors and the reviewers. Any product that may be evaluated in this article, or claim that may be made by its manufacturer, is not guaranteed or endorsed by the publisher.
Adesina, A., and Zinnah, M. M. (1993). This document is discoverable and free to researchers across the globe due to the work of AgEcon search. Help ensure our sustainability. Journal of gender, agriculture and food. J. Gender Agric. Food Secur. 1, 1–22.
Adu, D. T., Kuwornu, J. K. M., Anim-Somuah, H., and Sasaki, N. (2018). Application of livelihood vulnerability index in assessing smallholder maize farming households’ vulnerability to climate change in Brong-Ahafo region of Ghana. Kasetsart J. Soc. Sci. 39, 22–32. doi: 10.1016/j.kjss.2017.06.009
Ahmed, KA (2021). Bangladesh aims at doubling Rice productivity by 2050. Dhaka Tribune, Dhaka. Available at: https://www.dhakatribune.com/bangladesh/agriculture/2021/09/01/bangladesh-aims-at-doubling-rice-productivity-by-2050
Alam, MJ, Begum, I. A., and Rahman, S (2011). “Total factor productivity and the efficiency of Rice farms in Bangladesh: a farm level panel data comparison of the pre-and post-market reform period” in 85th Annual Conference, April 18–20, 2011, Warwick University, Coventry, UK.
Alam, M. J., Begum, I. A., Rahman, S., and Van Huylenbroeck, G. (2014). Tracing the impact of market reform on productivity growth of rice at the farm level in Bangladesh. J. Asia Pac. Econ. 19, 391–408. doi: 10.1080/13547860.2014.908533
Alemu, B. A., Nuppenau, E. A., and Boland, H. (1999). Technical efficiency of farming systems across agro-ecological zones in Ethiopia: an application of stochastic frontier analysis. Rural. Sociol. 48, 1–22.
Alkire, S., Meinzen-Dick, R., Peterman, A., Quisumbing, A., Seymour, G., and Vaz, A. (2013). The Women’s empowerment in agriculture index. World Dev. 52, 71–91. doi: 10.1016/j.worlddev.2013.06.007
Amuzu, J., and Kabo-bah, A. T. (2018). Households’ livelihood vulnerability to climate change and climate variability: a case study of the coastal zone, the Gambia. J. Environ. Earth Sci. 8, 35–46. doi: 10.13140/RG.2.2.36057.42081
Baily, M. N., Hulten, C., Campbell, D., Bresnahan, T., and Caves, R. E. (1992). Productivity dynamics in manufacturing plants. Brook. Pap. Econ. Act. Microeconomics 1992:187. doi: 10.2307/2534764
Bartelsman, E. J., and Dhrymes, P. J. (1998). Productivity dynamics: U.S. manufacturing plants, 1972-1986. J. Prod. Anal. 9, 5–34. doi: 10.1023/A:1018383629341
Bhuiyan, N I, and Paul, JMA (2004). Feeding the extra millions by 2025: Challenges for Rice research and extension in Bangladesh, Bangladesh Rice Research Institute, Gazipur, Bangladesh, 4–23.
Bishwajit, G., Sarker, S., Kpoghomou, M. A., Gao, H., Jun, L., Yin, D., et al. (2013). Self-sufficiency in Rice and food security: a south Asian perspective. Agric. Food Secur. 2, 1–6. doi: 10.1186/2048-7010-2-10
Chegini, R., Pakravan-Charvadeh, M. R., Rahimian, M., and Gholamrezaie, S. (2021). Is there a linkage between household welfare and income inequality, and food security to achieve sustainable development goals? J. Clean. Prod. 326:129390. doi: 10.1016/j.jclepro.2021.129390
Christopher, J., and O'Donnell, (2012). Nonparametric estimates of the components of productivity and profitability change in U.S. agriculture. Am. J. Agric. Econ. 94, 873–890. doi: 10.1093/ajae/aas023.ECG
Coelli, T.J., Prasada Rao, D. S., O’Donnell, C.J., and Battese, G.E. (2005). An Introduction to Efficiency and Productivity Analysis. New York, NY: Springer
Cordero-Ahiman, V., Otilia, E. S. E., and Garrido, A. (2017). Dietary diversity in rural households: the case of indigenous communities in sierra Tarahumara, Mexico dietary diversity in rural households: the case of indigenous communities in sierra. J. Food Nutr. Res. 5, 86–94. doi: 10.12691/jfnr-5-2-3
Dinesh, D., Hegger, D. L., Klerkx, L., Vervoort, J., Campbell, B. M., and Driessen, P. P. (2021). Enacting theories of change for food systems transformation under climate change. Glob. Food Sec. 31:100583. doi: 10.1016/j.gfs.2021.100583
Dirghayu, K. C., Shrestha, N., Shrestha, R., Sunuwar, D. R., and Poudyal, A. (2023). Household food security access and dietary diversity amidst COVID-19 pandemic in rural Nepal; an evidence from rapid assessment. PLoS One 18:e0293514. doi: 10.1371/journal.pone.0293514
Dua, P., and Garg, N. K. (2019). Determinants of labour productivity: comparison between developing and developed countries of Asia Pacific. Pac. Econ. Rev. 24, 5. doi: 10.1111/1468-0106.12294
Ganesh-Kumar, A, Prasad, S.K., and Pullabhotla, H. (2012). Supply and Demand for Cereals in Bangladesh, 2010-2030.
Gerlitz, J. Y., Macchi, M., Brooks, N., Pandey, R., Banerjee, S., and Jha, S. K. (2017). The multidimensional livelihood vulnerability index–an instrument to measure livelihood vulnerability to change in the Hindu Kush Himalayas. Clim. Dev. 9, 124–140. doi: 10.1080/17565529.2016.1145099
Hahn, M. B., Riederer, A. M., and Foster, S. O. (2009). The livelihood vulnerability index: a pragmatic approach to assessing risks from climate variability and change-a case study in Mozambique. Glob. Environ. Chang. 19, 74–88. doi: 10.1016/j.gloenvcha.2008.11.002
Hailu, A. G., and Amare, Z. Y. (2022). Impact of productive safety net program on food security of beneficiary households in Western Ethiopia: a matching estimator approach. PLoS One 17:e260817. doi: 10.1371/journal.pone.0260817
Headey, D., and Ecker, O. (2013). Rethinking the measurement of food security: from first principles to best practice. Food Secur. 5, 327–343. doi: 10.1007/s12571-013-0253-0
Hoq, M. S., Uddin, M. T., Raha, S. K., and Hossain, M. I. (2021). Welfare impact of market participation: the case of rice farmers from wetland ecosystem in Bangladesh. Environ. Challenges 5:100292. doi: 10.1016/j.envc.2021.100292
Hossain, Z., and Riad, M. (2021). Distriution of internal rural-urban migration in Bangladesh: application of probability models. SUST J. Sci. Technol. 31, 36–43.
Huluka, A. T., and Wondimagegnhu, B. A. (2019). Determinants of household dietary diversity in the Yayo biosphere Reserve of Ethiopia: an empirical analysis using sustainable livelihood framework. Cogent Food Agric. 5. doi: 10.1080/23311932.2019.1690829
Kennedy, G., Berardo, A., Papavero, C., Horjus, P., Ballard, T., Dop, M., et al. (2010). Proxy measures of household food consumption for food security assessment and surveillance: comparison of the household dietary diversity and food consumption scores. Public Health Nutr. 13, 2010–2018. doi: 10.1017/S136898001000145X
Kondo, K., Yamamoto, Y., and Sasaki, J. (2017). Total factor productivity of the Japanese Rice industry. Asian Econ. J. 31, 331–353. doi: 10.1111/asej.12134
Kundu, S., Banna, M. H. A., Sayeed, A., Sultana, M. S., Brazendale, K., Harris, J., et al. (2021). Determinants of household food security and dietary diversity during the COVID-19 pandemic in Bangladesh. Public Health Nutr. 24, 1079–1087. doi: 10.1017/S1368980020005042
Liu, W., Liu, J., Xu, J., Li, J., and Feldman, M. (2024). Examining the links between household livelihood resilience and vulnerability: disaster resettlement experience from rural China. Front. Environ. Sci. 11:1340113. doi: 10.3389/fenvs.2023.1340113
Magnani, R, Oot, L, Sethuraman, K, Kabir, G, and Rahman, S (2015). USAID office of food for peace food security country framework for Bangladesh (FY 2015–2019). 76. Available at: www.fantaproject.org
Mullen, J. (2007). Productivity growth and the returns from public Investment in R&D in Australian Broadacre agriculture. Aust. J. Agric. Resour. Econ. 51, 359–384. doi: 10.1111/j.1467-8489.2007.00392.x
Mulmi, P., Masters, W. A., Ghosh, S., Namirembe, G., Rajbhandary, R., Manohar, S., et al. (2017). Household food production is positively associated with dietary diversity and intake of nutrient-dense foods for older preschool children in poorer families: results from a nationally-representative survey in Nepal. PLoS One 12, 1–23. doi: 10.1371/journal.pone.0186765
Mutisya, M., Ngware, M. W., Kabiru, C. W., and Kandala, N. B. (2016). The effect of education on household food security in two informal urban settlements in Kenya: a longitudinal analysis. Food Secur. 8, 743–756. doi: 10.1007/s12571-016-0589-3
Nazma, S., and Saiful, I. (2012). National Situation of Food and Nutrition in Bangladesh. Working Paper - Prepared on behalf of the Association for Land Reform and Development (ALRD) for the Asian Alliance Against Hunger and Malnutrition (AAHM). Food Nutr. 2013, 1–31.
Neil, M, Hulten, C, Campbell, D, Bresnahan, T, and Richard, E (1992). Productivity dynamics in plants. Brookings Papers on Economic Activity: Microeconomics, 187–267.
O’Donnell, CJ (2008). An aggregate Quantityprice framework for measuring and decomposing productivity and profitability change. Working Paper Series, no. 1932–4398: 1–41.
Ochieng, J., Afari-Sefa, V., Lukumay, P. J., and Dubois, T. (2017). Determinants of dietary diversity and the potential role of men in improving household nutrition in Tanzania. PLoS One 12, 1–18. doi: 10.1371/journal.pone.0189022
Parker, L., Bourgoin, C., Martinez-Valle, A., and Läderach, P. (2019). Vulnerability of the agricultural sector to climate change: the development of a Pan-tropical climate risk vulnerability assessment to inform sub-National Decision Making. PLoS One 14:e0213641. doi: 10.1371/journal.pone.0213641
Parvin, G. A., and Ahsan, R. M. R. (2013). Impacts of climate change on food security of rural poor women in Bangladesh. Manag Environ. Q. Int. J. 24, 802–814. doi: 10.1108/MEQ-04-2013-0033
Ragasa, C., and Mazunda, J. (2018). The impact of agricultural extension Services in the Context of a heavily subsidized input system: the case of Malawi. World Dev. 105, 25–47. doi: 10.1016/j.worlddev.2017.12.004
Raiz, A., and Sajjadur Rahman, M. (2016). (Eds). Routledge Handbook of Contemporary Bangladesh. 1st Edn. Routledge. doi: 10.4324/9781315651019
Reddy, A. A. (2016). Food security indicators in India compared to similar countries. Curr. Sci. 111, 632–640. doi: 10.18520/cs/v111/i4/632-640
Reddy, A. A., Melts, I., Mohan, G., Rani, C. R., Pawar, V., Singh, V., et al. (2022). Economic impact of organic agriculture: evidence from a Pan-India survey. Sustain. For. 14. doi: 10.3390/su142215057
Ritchie, H., Reay, D. S., and Higgins, P. (2018). Quantifying, projecting, and addressing India’s hidden hunger. Front. Sustain. Food Syst. 2, 1–13. doi: 10.3389/fsufs.2018.00011
Saha, I., Durand-Morat, A., Nalley, L. L., Alam, M. J., and Nayga, R. (2021). Rice quality and its impacts on food security and sustainability in Bangladesh. PLoS One 16:e0261118. doi: 10.1371/journal.pone.0261118
Seaward, C (2016). El Niño in Ethiopia: Programme observations on the impact of the Ethiopia drought and recommendations for action. Oxfam El Nino Briefings, no. February. Available at: www.oxfam.org
Şeker, M., and Saliola, F. (2018). A cross-country analysis of Total factor productivity using Micro-level data. Central Bank Rev. 18, 13–27. doi: 10.1016/j.cbrev.2018.01.001
Sibhatu, K. T., Krishna, V. V., and Qaim, M. (2015). Production diversity and dietary diversity in smallholder farm households. Proc. Natl. Acad. Sci. USA 112, 10657–10662. doi: 10.1073/pnas.1510982112
Suphannachart, W. (2013). Total factor productivity of Main and second Rice production in Thailand. Appl. Econ. J. 20, 1–22. doi: 10.14456/aej.2013.1
Swindale, A., and Bilinsky, P. (2006). Household dietary diversity score (HDDS) for measurement of household food access: Indicator guide. Food Nutr. Tech. Assist. 11. doi: 10.1017/CBO9781107415324.004
Teklewold, H., Kassie, M., and Shiferaw, B. (2013). Adoption of multiple sustainable agricultural practices in rural Ethiopia. J. Agric. Econ. 64, 597–623. doi: 10.1111/1477-9552.12011
Villoria, N. (2019). Consequences of agricultural Total factor productivity growth for the sustainability of global farming: accounting for direct and indirect land use effects. Environ. Res. Lett. 14. doi: 10.1088/1748-9326/ab4f57
Wassie, SB (2019). Technical efficiency of major crops in Ethiopia: Stochastic frontier model efficiency of agricultural production technical efficiency of major crops in Ethiopia: Stochastic frontier model.
WFP (2009). Emergency Food Security Assessment Handbook. 2nd Edn., Italy: World Food Programme, 68–70.
Yang, M, and Stanley, TD (2012). Micro-credit and income: a literature review and Meta-analysis. Bulletin of Economics and Meta-Analysis, 35. Available at: https://www.hendrix.edu/uploadedFiles/Departments_and_Programs/Business_and_Economics/AMAES/Micro-CreditMeta-Analysis12-18(2).pdf
Yohannes, Y, Hoddinott, J., and Yohannes, Y (2002). Nutrition technical dietary diversity as a household food security Indicator: technical appendix John Hoddinott Indicator:Technical Appendix 136, 4. Available at: http://www.fantaproject.org/research/dietary-diversity-household-food-security
Keywords: climate vulnerability, dietary diversity, farm efficiency, total factor productivity, Bangladesh
Citation: Sarma PK, Alam MJ, Begum IA and McKenzie AM (2024) The effect of total factor productivity on the food security and livelihood vulnerability of farm households in Bangladesh. Front. Sustain. Food Syst. 8:1395897. doi: 10.3389/fsufs.2024.1395897
Edited by:
Christian Bux, University of Bari Aldo Moro, ItalyReviewed by:
Martinson Ankrah Twumasi, Sichuan Agricultural University, ChinaCopyright © 2024 Sarma, Alam, Begum and McKenzie. This is an open-access article distributed under the terms of the Creative Commons Attribution License (CC BY). The use, distribution or reproduction in other forums is permitted, provided the original author(s) and the copyright owner(s) are credited and that the original publication in this journal is cited, in accordance with accepted academic practice. No use, distribution or reproduction is permitted which does not comply with these terms.
*Correspondence: Mohammad Jahangir Alam, YWxhbWJhdTIwMDNAeWFob28uY29t
Disclaimer: All claims expressed in this article are solely those of the authors and do not necessarily represent those of their affiliated organizations, or those of the publisher, the editors and the reviewers. Any product that may be evaluated in this article or claim that may be made by its manufacturer is not guaranteed or endorsed by the publisher.
Research integrity at Frontiers
Learn more about the work of our research integrity team to safeguard the quality of each article we publish.