
94% of researchers rate our articles as excellent or good
Learn more about the work of our research integrity team to safeguard the quality of each article we publish.
Find out more
ORIGINAL RESEARCH article
Front. Sustain. Food Syst., 17 June 2024
Sec. Crop Biology and Sustainability
Volume 8 - 2024 | https://doi.org/10.3389/fsufs.2024.1389970
This article is part of the Research TopicAbiotic Stresses in Field Crops: Response, Impacts and Management under Climate Change ScenarioView all 15 articles
 D. Harish1,2
 Sneha Priya Pappula Reddy1,3
 Neeraj Kumar1*
 Chellapilla Bharadwaj1*
 Tapan Kumar1,4
 Swaroop Parida5
 Basavanagowda S. Patil1
 Sudhir Kumar1
 Pradeep K. Jain6
 Yogesh Kumar7
 Rajeev K. Varshney8
In chickpea breeding, drought is a major concern and a complex trait controlled by several genes. To develop drought-tolerant varieties, it is essential to use the available germplasm and genomic resources. Over the years, the landraces have proven to be a good source for the dissection of genes for different yield and yield-related traits. The present investigation for marker–trait associations (MTAs) and candidate gene identification was conducted by studying 125 chickpea landraces collected from the West Asia and North Africa (WANA) region, along with 4 varieties suitable for irrigated and rainfed environments. This study analyzed 13 physio-morphological traits in 2 consecutive years at two isolated locations (IARI, New Delhi, and Dharwad). A strong correlation coefficient was observed between the trait seed yield (SY) and biological yield (BY) under both conditions. The Drought Susceptibility Index (DSI) ranged from 0.02 to 1.84 and 0.10 to 2.04 at the IARI, New Delhi and Dharwad locations, respectively. The genotypic data of 6,367 single nucleotide polymorphisms (SNPs) distributed across the genome were used for genetic diversity study, population structure, and genome-wide association study (GWAS). The average polymorphic information content (PIC) value observed was 0.25, and the average linkage disequilibrium (LD) decay distance was 152,269 bp across the genome. A total of four subgroups were observed within the population for genotypic data. Fixed and random model Circulating Probability Unification (FarmCPU) was used for the GWAS analysis, which considered both fixed- and random-effect models. A total of 52 significant SNPs were reported in both irrigated and rainfed conditions at low locations; 7 SNPs were associated with more than one trait, which may have pleiotropic effects. Significant SNPs were annotated in the pulse database. The identified genomic region found in or near MTA under rainfed conditions encodes for guard cell hydrogen peroxide-resistant1 (GHR1), late embryogenesis-abundant, E3 ubiquitin-protein ligase, walls are thin1 (WAT1), and beta-galactosidase that are known to be associated with drought tolerance.
Chickpea (Cicer arietinum L.) is a globally cultivated legume, with an area of 15 million ha and a production of 15 million tons (FAOSTAT, 2021). It is a cool-season crop, predominantly grown in arid and semi-arid climatic conditions with residual soil moisture (Thudi et al., 2014). It is also a vital source of protein, dietary fiber, and essential minerals (Bar-El Dadon et al., 2017). In the past century, the average global temperature has increased by 1.2°C and is estimated to rise further by 3°C by 2,100 (Schneider et al., 2007). Due to these climatic changes, the frequency, severity, and duration of drought periods are estimated to increase progressively (Cramer et al., 2011). Among the 100 meta-analysis studies of 13 legumes, chickpea stands seventh with a significant difference in drought tolerance measured in terms of yield reduction (Daryanto et al., 2015). More than 50% of yield losses were reported by terminal drought or end-season drought alone (Ahmad et al., 2005). Over the past three decades, chickpea cultivation has shifted from cooler to warmer regions in India (Krishnamurthy et al., 2013) and the productivity of chickpea is expected to be further reduced. As per the Vision 2050 document of the Indian Council of Agricultural Research (ICAR)–Indian Institute of Pulses Research (IIPR), approximately 16–17.5 million tons of chickpeas need to be produced from an area of approximately 10.5 million ha with an average productivity of 1.5–1.7 tons/ha (Dixit et al., 2019). The chickpea genome (size ~700 Mb) has been sequenced, and the whole-length genome sequence is available for desi (Jain et al., 2013; Parween et al., 2015), kabuli (Varshney et al., 2013), and wild species, C. reticulum (Gupta et al., 2017). With the availability of well-developed genomic resources in chickpeas and the advances in the cost-effective next-generation sequencing technology, genome-wide association mapping is the best method to discover a large amount of variability available in the population. The availability and accessibility of genomic resources make it possible to identify unique alleles and haplotypes associated with agronomic traits (Varshney et al., 2019). The precise integration of genome-wide sequence information, to that of phenotypic variation for yield component trait, abiotic, or disease tolerance, allows capturing accessions with low-frequency variants (Roorkiwal et al., 2020). The QTL hotspot for drought tolerance with a phenotypic variation of >50% was identified on chromosome 4, by using QTL analysis along with SSR and GBS markers (Varshney et al., 2014; Jaganathan et al., 2015). The addition of more SNPs was done to fine map QTL-hotspot to ~300-kb region, and 26 genes were reported in the region with the help of QTL bin-mapping and gene enrichment strategies (Kale et al., 2015). The introgression of these QTL hotspots has led to increased seed yield and enhanced drought tolerance in three elite chickpea cultivars (Bharadwaj et al., 2021). Recent efforts were made by Li et al. (2018) to identify the marker–trait association for drought tolerance by incorporating GWAS and genomic selection (GS) in 132 chickpea varieties. In order to augment the available genomic resources in chickpeas and to accelerate the chickpea breeding program for drought tolerance, our present investigation of GWAS was carried out in 129 chickpea landraces (collected from the WANA region) for the identification of candidate genes for drought tolerance.
The experimental material consisted of 129 chickpea genotypes, including 125 landraces collected from the WANA (West Asia and North Africa) region, and 4 varieties. The experiment was conducted at two isolated locations, viz. IARI, New Delhi (28.0800N and 77.120°E), and Dharwad (15.45890N and 75.0078°E) during 2 consecutive years, 2017–18 and 2018–19, under irrigated and rainfed conditions, respectively. No supplementary irrigation was given for the rainfed environment. The supplementary irrigation was given at the critical growth stage (initiation of pod formation) under an irrigated environment. The month-wise rainfall data are provided in Supplementary Table S1. The 10 morphological traits, namely, days to 50% flowering (DFF), plant height (PH), number of primary branches (NPB), number of secondary branches (NSB), number of pods per plant (NPP), biological yield (BY), the Harvest Index (HI), 100 seed weight (100SW), seed yield (SY), and the Drought Susceptible Index (DSI) and three physiological traits, namely, relative water content (RWC), the Membrane Stability Index (MSI), and canopy temperature depression (CTD) were recorded for both the experimental trials, across the years. The seed yield and biological yield were recorded in 10 plants per genotype, and CTD was measured with the help of an infrared thermometer.
The Drought Susceptibility Index (DSI) was calculated as follows (Fischer and Maurer, 1978):
where YS and YN are the mean yields of individual genotypes under rainfed and irrigated conditions and yS and yN are the mean yields of all genotypes under rainfed and irrigated conditions.
The MSI was calculated using the formula (Blum and Ebercon, 1981) as below:
For the estimation of MSI, ~400 mg of fresh leaf sample was taken in a test tube containing 10 mL distilled water and kept in a water bath at 45°C for 30 min, and conductivity was measured (C1). Similarly, the test tubes were placed again at 100°C for 10 min and the conductivity (C2) was measured after allowing it to cool to room temperature.
The relative water content (RWC) was estimated according to Barrs and Weatherley (1962).
The fresh weight was recorded for the leaf samples of all genotypes, and then they were kept in a Petri dish filled with distilled water for 4 h, so as to record the turgid weight. Thereafter, the samples were placed in a dry-air oven set at 60°C for 72 h to record the dry weight of the sample.
Analysis variance across location and year is calculated in the R environment. The Best linear Unbiased Predictions (BLUPs) were calculated by using the phenotype version 0.1.0 package, and Metan version 1.16.0 was used to calculate the correlation coefficient and to draw a correlation plot (Olivoto and Lucio, 2020) in R version 4.1.1.
A total of 16,983 SNPs were filtered from 16 k Illumina GBS resequencing data for 129 genotypes. After excluding the markers with minor allele frequency (MAF) <0.05 in TASSEL version 5 (Bradbury et al., 2007), a total of 6,367 markers were retained for further genetic diversity and genome-wide association study.
The molecular genetics diversities such as gene diversity (GD), polymorphic information content (PIC), and heterozygosity were calculated using PowerMarker 3.25 (Liu and Muse, 2005). The population structure for 6,367 SNPs was analyzed with the 1 to 10 assumed number of subgroups (K) for each run with 100,000 Markov Chain Monte Carlo iteration and a burn-in 10,000 steps in Structure 2.3.4 (Pritchard et al., 2000). The optimum number of clusters was determined by plotting ΔK against the natural logarithms of probability data [LnP(K)] Structure Harvester (Earl and vonHoldt, 2012). The PCA was incorporated in the package Genomic Association and Prediction Integrated Tool Version 3 under the R environment (Wang and Zhang, 2021), and the analysis was performed. The extent of linkage disequilibrium between the SNP markers was analyzed by calculating the r2 values in TASSEL v5 (Bradbury et al., 2007). Only r2 values with p < 0.05 within each chromosome were considered for LD decay analysis. The non-linear regression curve was used for the estimation of LD decay (Hill and Weir, 1988). LD decay plot was drawn with the help of LD (r2) and physical distance (bp) by using the script in R version 4.1.1 (David et al., 2001).
The genome-wide association analysis for 6,367 SNPs was performed using a multilocus GWAS model, viz., Fixed and random model and Circulating Probability Unification (FarmCPU) (Liu et al., 2016) using GAPIT version 3 (Wang and Zhang, 2021) in R software. Both the fixed-effect model (FEM) and random-effect model (REL) are utilized in this model, and it is considered the most efficient as it eliminates confounding issues arising due to population structure, kinship, multiple testing, etc. (Gahlaut et al., 2021). To identify the significant SNPs, the Bonferroni-corrected p-value at 1 (−log p-value = 3.8) was considered as the threshold p-value (Kohli et al., 2020). Only the SNPs with above this value were declared as significant MTAs. A mixed linear model in TASSEL was to calculate the phenotypic variation explained (PVE) (Bradbury et al., 2007). The Manhattan plot was generated from qqman version 0.1.8 (Turner, 2018).
To explore putative candidate genes, LD decay along the individual chromosome was considered to retrieve sequence flanking significant MTAs, searched against the NCBI (National Center for Biotechnology Information) reference genome ASM33114v1. The Chickpea pulse database1 was used for the annotation of significant MTAs.
In total, 129 chickpea genotypes were evaluated for 10 morphological and 3 physiological traits under differing water regimes and were found to have a wide range of variability. The analysis of variance (ANOVA) of all morphological traits under irrigated and rainfed environments across the location and year was estimated, and a mean sum of squares and their significance are presented in Supplementary Table S2. The ANOVA reveals that the genotype–environmental interaction was significant at p < 0.001 for all the morphological traits except NPP, BY, and HI for genotype × year interaction in both irrigated and rainfed conditions. This indicates that the environmental influence on the performance of the genotypes. The genotypic × location interaction effect was significant for all the traits in both irrigated and rainfed conditions. This shows the genotypes studied had wide variability, and they performed differently across the locations. The DSI for IARI, New Delhi, environment varied from 0.02 to 1.84 while for the Dharwad environment was 0.10 to 2.04. Boxplot was drawn to compare the mean value of morphological traits under different environmental conditions, and the reduction in the mean value of all traits studied was observed in rainfed compared to the irrigated conditions in both locations (Figure 1). Pearson’s correlation analysis is summarized in Figure 2, which reveals the significant correlation among most of the traits in both rainfed and irrigated environments. Furthermore, the seed yield is positively associated with the traits NPB, NSB, NPP, BY, HI, and 100SW in both irrigated and rainfed environments and negatively associated with the DFF and PH. A strong correlation was observed between the trait SY and BY with correlation coefficients of 0.934, 0.932, 0.919, and 0.941 in the E1, E2, E3, and E4 environment, respectively, which showed that healthy plant biomass will retain yield even in drought condition (Kashiwagi et al., 2013; Li et al., 2018). The boxplot for three physiological traits, viz., RWC, MSI, and CTD is presented in Figure 3, reduced in the mean value of traits observed in rainfed condition compared to irrigated condition.
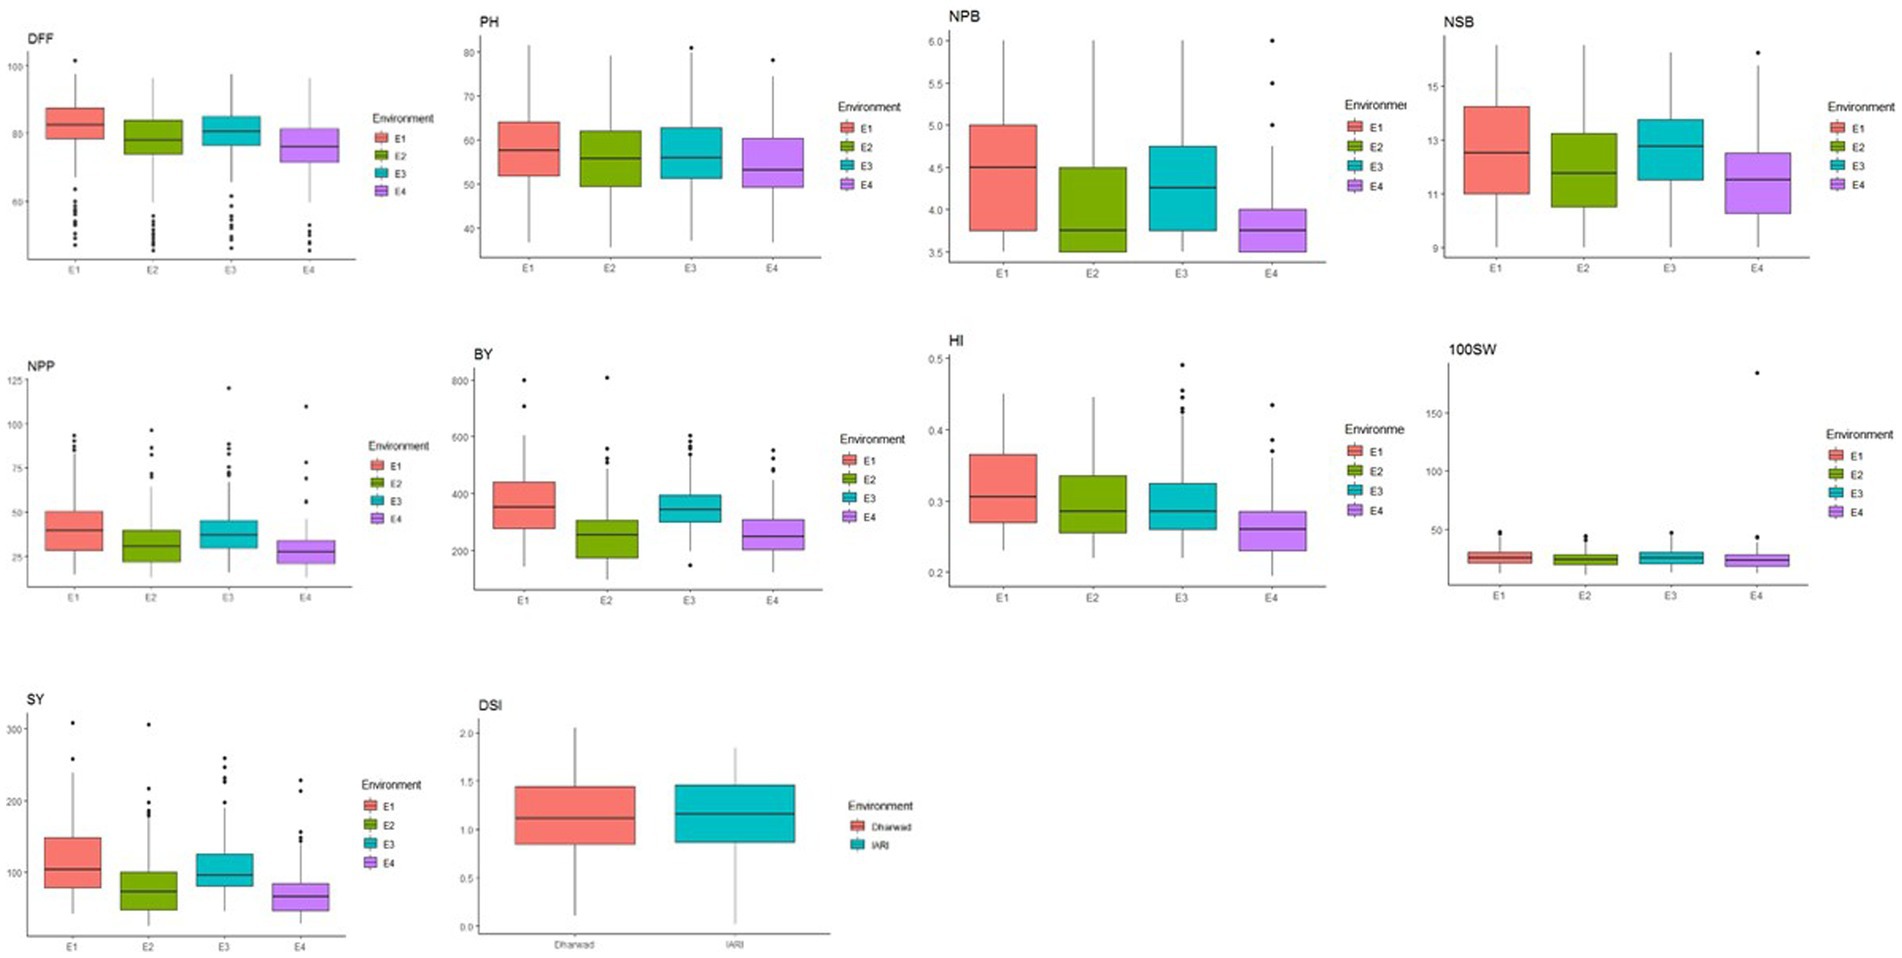
Figure 1. Box plot for morphological traits studied under different environments: E1, IARI irrigated; E2, IARI rainfed; E3, Dharwad irrigated; E4, Dharwad rainfed; DFF, days to 50% flowering; PH, plant height; NPB, number of primary branches; NSB, number of secondary branches; NPP, number of pods per plant; BY, biological yield; HI, Harvest Index; 100SW, 100 seed weight; SY, seed yield; DSI, Drought Susceptible Index.
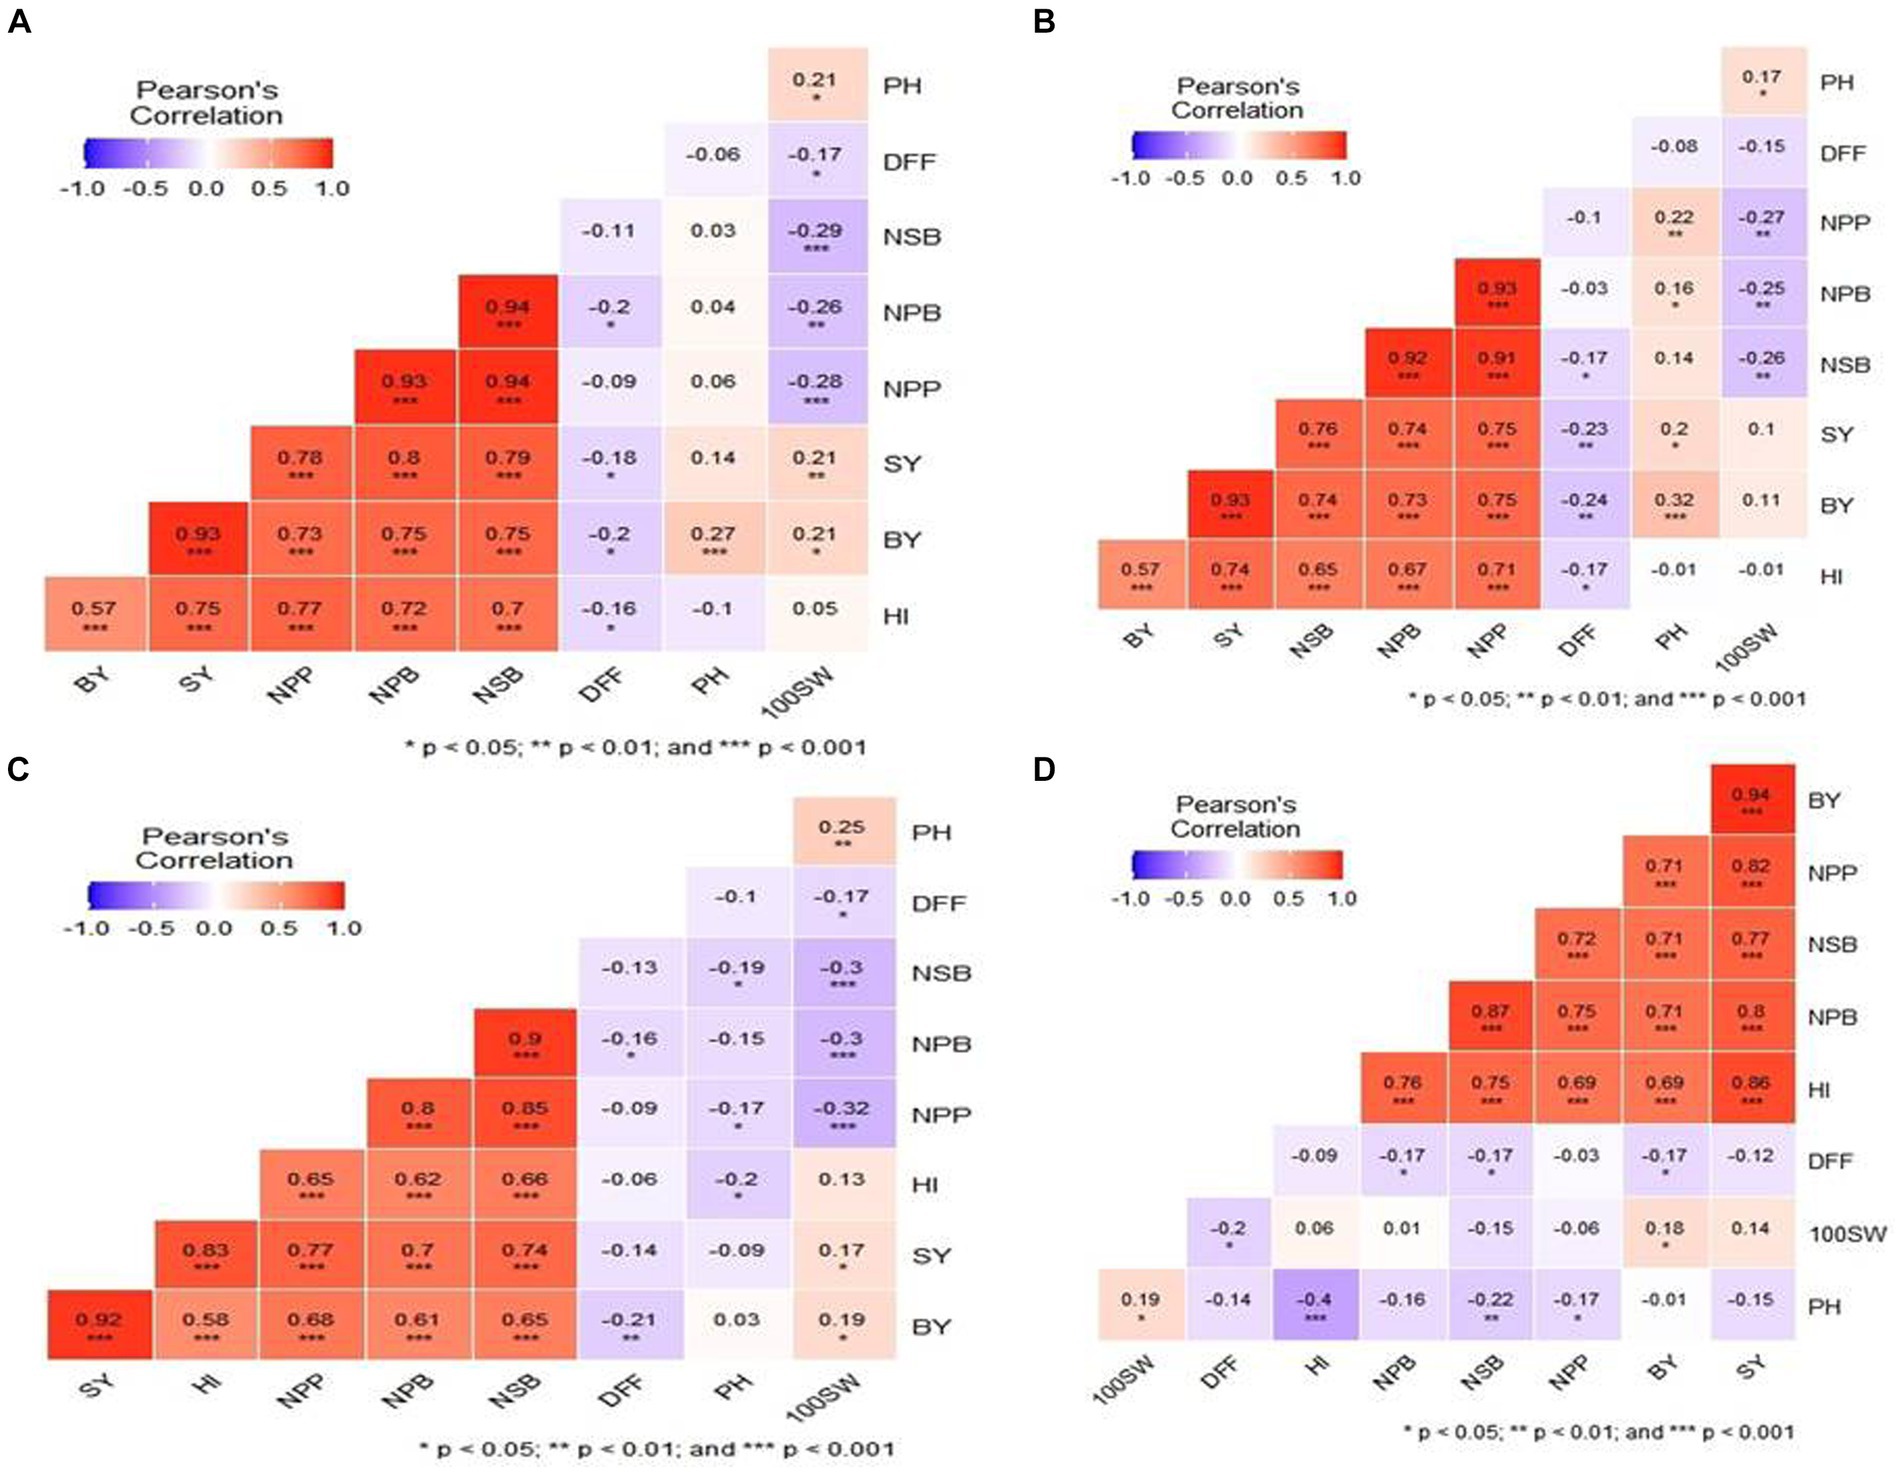
Figure 2. Correlation coefficient (r) plot for morphological traits in different water regimes. (A) IARI irrigated. (B) IARI rainfed. (C) Dharwad rainfed, and (D) Dharwad irrigated environment (top to bottom in clockwise).
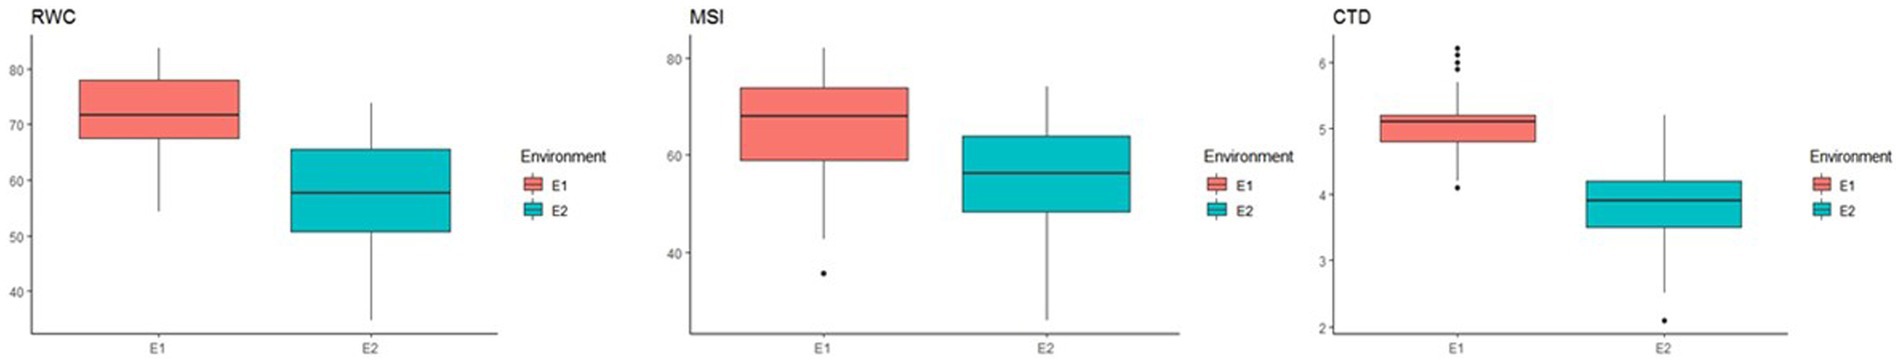
Figure 3. Box plot 3 physiological traits RWC (relative water content), MSI (Membrane Stability Index), and CTD (canopy temperature depression) at E1—IARI irrigated and E2—IARI rainfed.
A total of 6,367 SNPs were considered for the study after excluding the SNPs with minor allele frequency (MAF) of <0.05 from 16,983 SNPs. The distribution of SNPs across the chromosome ranged from 438 in chromosome 8 to 1,480 in chromosome 4. The percentage of transitions (A/G and C/T) was higher at 0.53% than 0.47% of A/C, A/T, G/C, and G/T transversions. The average genetic distance was 0.33 with a range from 0.095 to 0.611. The average PIC value was 0.25 with a range from 0.09 to 0.53, and the average heterozygosity was 0.11. The LD and LD decay of all 8 chickpea chromosomes are presented in Table 1. The average LD across the genome was 0.14, and in the individual chromosomes, it varied from 0.06 in chromosome 5 to 0.22 in chromosome 8. The maximum SNP pairs with a p-value of <0.05 were on chromosome 4 (12477), and the minimum SNP pairs were on chromosome 5 (697). The whole genome LD decay distance was 152,269 bp (Figure 4), above which LD decay was observed. The LD decay distance of individual chromosomes ranged from 81,535 on chromosome 5 to 225,588 on chromosome 6. The SNP density per chromosome ranged from 9.80SNPS/Mb in Chromosome 5 to 30.24 SNPs/Mb in Chromosome 4.
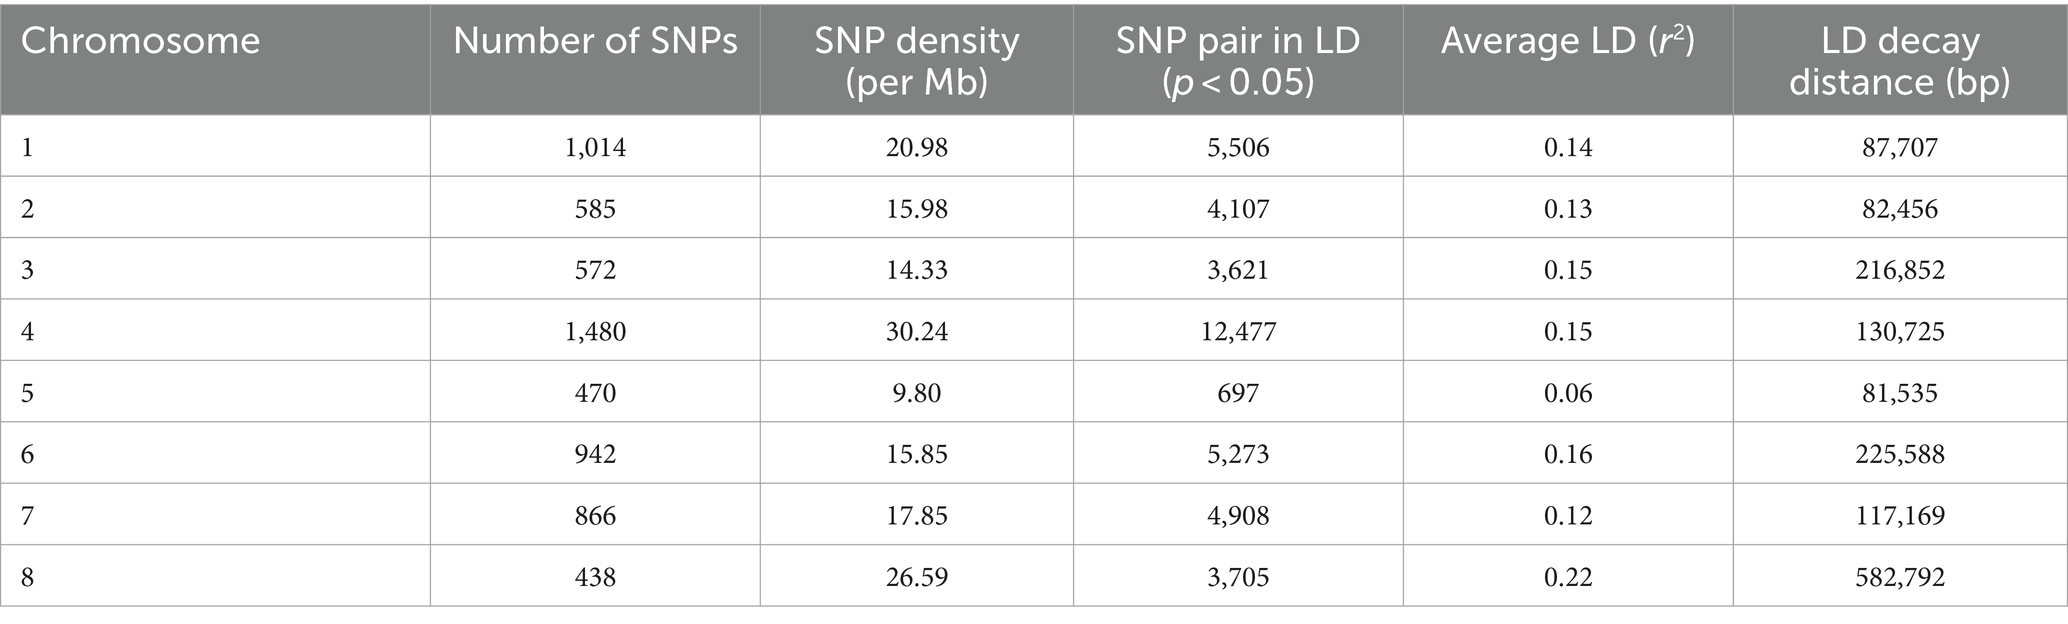
Table 1. Distribution of SNPs, SNP pairs (p < 0.05), LD (r2), and LD decay on all eight chromosomes of chickpea.
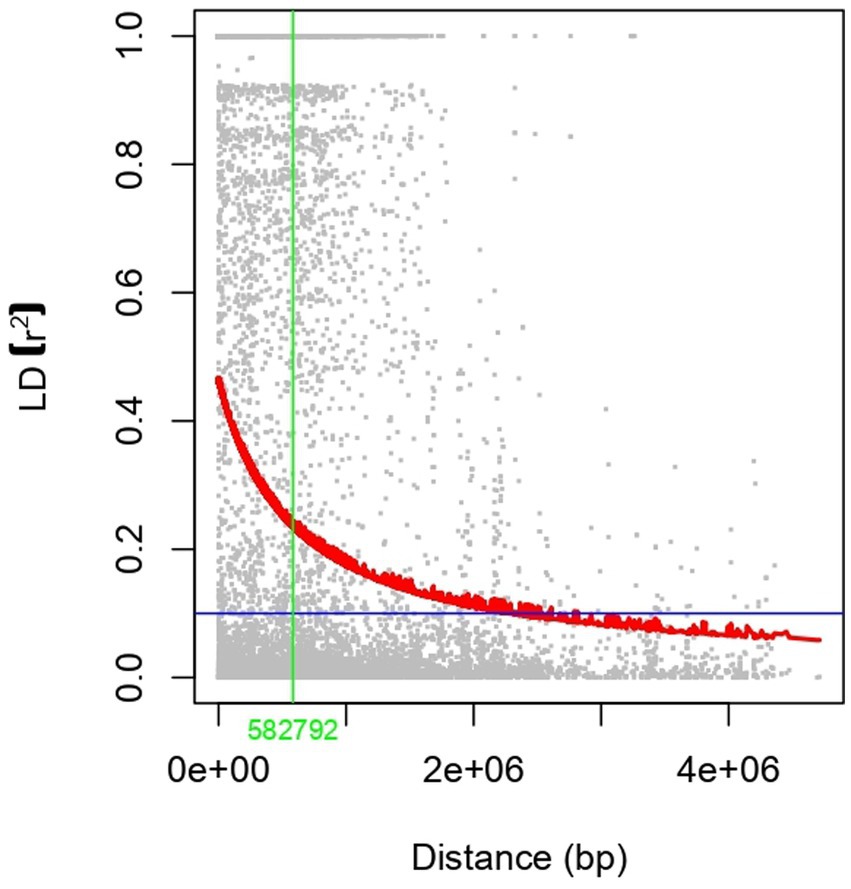
Figure 4. Genome-wide Linkage Disequilibrium plot of the entire genome of chickpea. The x-axis represents distance (bp), and the y-axis represents LD (r2). The intersection between the horizontal and vertical lines represents the LD decay distance.
The 129 chickpea genotypes were clustered into subpopulations based on the Bayesian clustering approach and plotted as cluster k and delta K. The maximum delta K was observed on cluster 4 (Figure 5), concluding that 129 chickpea genotypes were divided into 4 subpopulations by using the admixture method in STRUCTURE software and computing the result into online Structure HarveSter (Evanno et al., 2005). The individual genotypes were included in the subpopulation based on their highest share of the membership coefficient. Based on the membership coefficient, the four subpopulations namely SubPop1, SubPop2, SubPop3, and SubPop4 have 54, 42, 18, and 15 genotypes, respectively, in their clusters (Figure 5 and Supplementary Table S3). The fixation index of 0.56, 0.52, 0.44, and 0.58 was recorded in SubPop1, SubPop2, SubPop3, and SubPop4, respectively. The allele-frequency divergence of SubPop1 from SubPop2 was 0.19, from SubPop3 was 0.12, and from SubPop4 0.23; the divergence of SubPop2 from SubPop3 was 0.15 and from SubPop4 was 0.19; and the divergence of SubPop3 from SubPop4 was 0.17. The average distance between the individuals within the subpopulation was 0.18, 0.19, 0.23, and 0.19 in SubPop1, SubPop2, SubPop3, and SubPop4, respectively. The kinship matrix obtained from SNPs, varied from −0.52 to 2.07. The diversity among 129 chickpea genotypes, as shown in the kinship matrix heatmap (Figure 6A), by using PCA (Figure 6C) and percentage variation, explained each PCA (Figure 6B). The PCA and kinship showed the presence of a high level of diversity in the panel used.
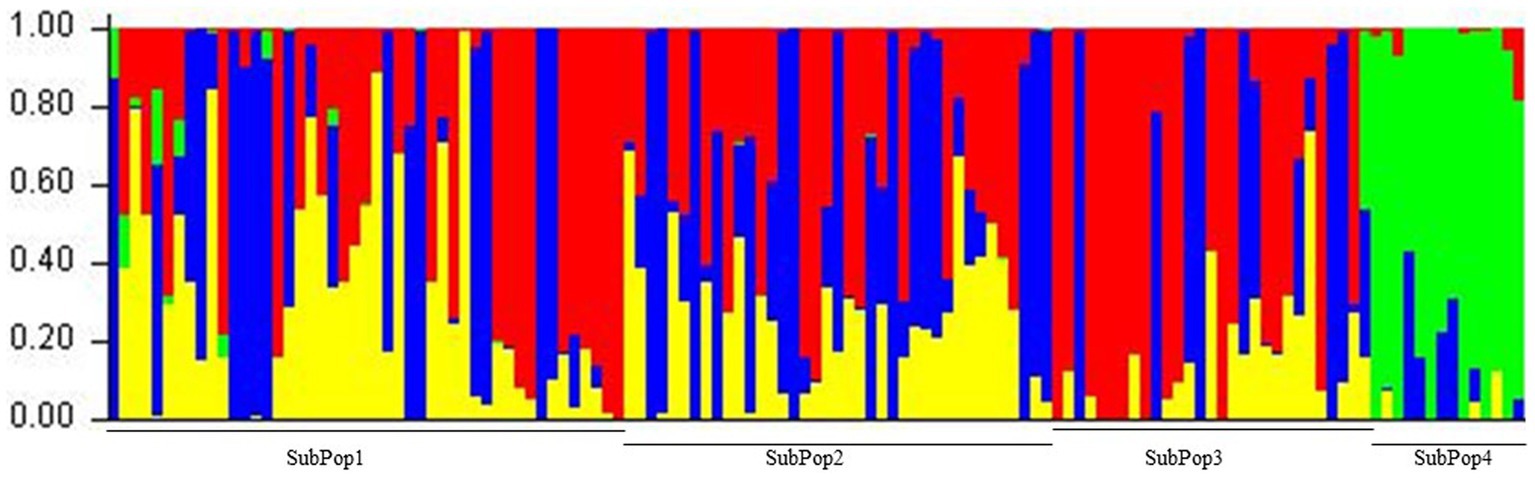
Figure 5. Population structure of 129 Chickpea genotypes. Delta K shows four subpopulation by Evanno’s method; the peak observed at k = 4.

Figure 6. Molecular diversity and genetic structure of 129 chickpea genotypes. (A) Kinship matrix heatmap. (C) Scree plot depicting significant PCs. (B) The 3D graph depicting the distribution of genotypes along the three (top to bottom in clockwise).
The analysis of significantly associated SNPs (p < 1.5E-04) resulted in a total of 49 SNPs for morphological traits, excluding NPB, and three for physiological traits, in both irrigated and rainfed environments at two locations (Table 2). For the morphological traits studied, 8 SNPs were reported for both irrigated and rainfed environments, 27 SNPs for the rainfed environment, and 10 SNPs for the irrigated environment. A maximum number of 21 SNPs showed significant association with 100SW explained 0.003–17.184% phenotypic variation followed by 10 SNPs with SY explained 0.002–28.75% phenotypic variation and 7 SNPs with NPP explained 0.001 to 30.969% phenotypic variation. In total, seven SNPs were found to be associated with more than one trait (Supplementary Table S4). Two significant SNPs for DSI, one each under IARI, New Delhi, located on Ca8:8904366 (Figure 7A) and Dharwad located on Ca1:7500524 (Figure 7B). For physiological traits studies, two SNPs were found to be significant for RWC (Ca3:13202989) and CTD (Ca4:25809665) in an irrigated environment, and one SNP for CTD (Ca5:31164539) for a rainfed environment at IARI, New Delhi (Figure 7C). The Manhattan plot for 100SW and SY under the rainfed condition for both the locations IARI, New Delhi, and Dharwad, are presented in Figure 8. The SNP located on Ca1:43273961 was found to be associated with a greater number of traits (NPB, NPP, BY, and SY) followed by SNP on Ca1:43273962, associated with NPB, NPP, and SY and SNP located on Ca8:13745335 associated with NPP, BY, and SY, which indicates the pleiotropic effect.
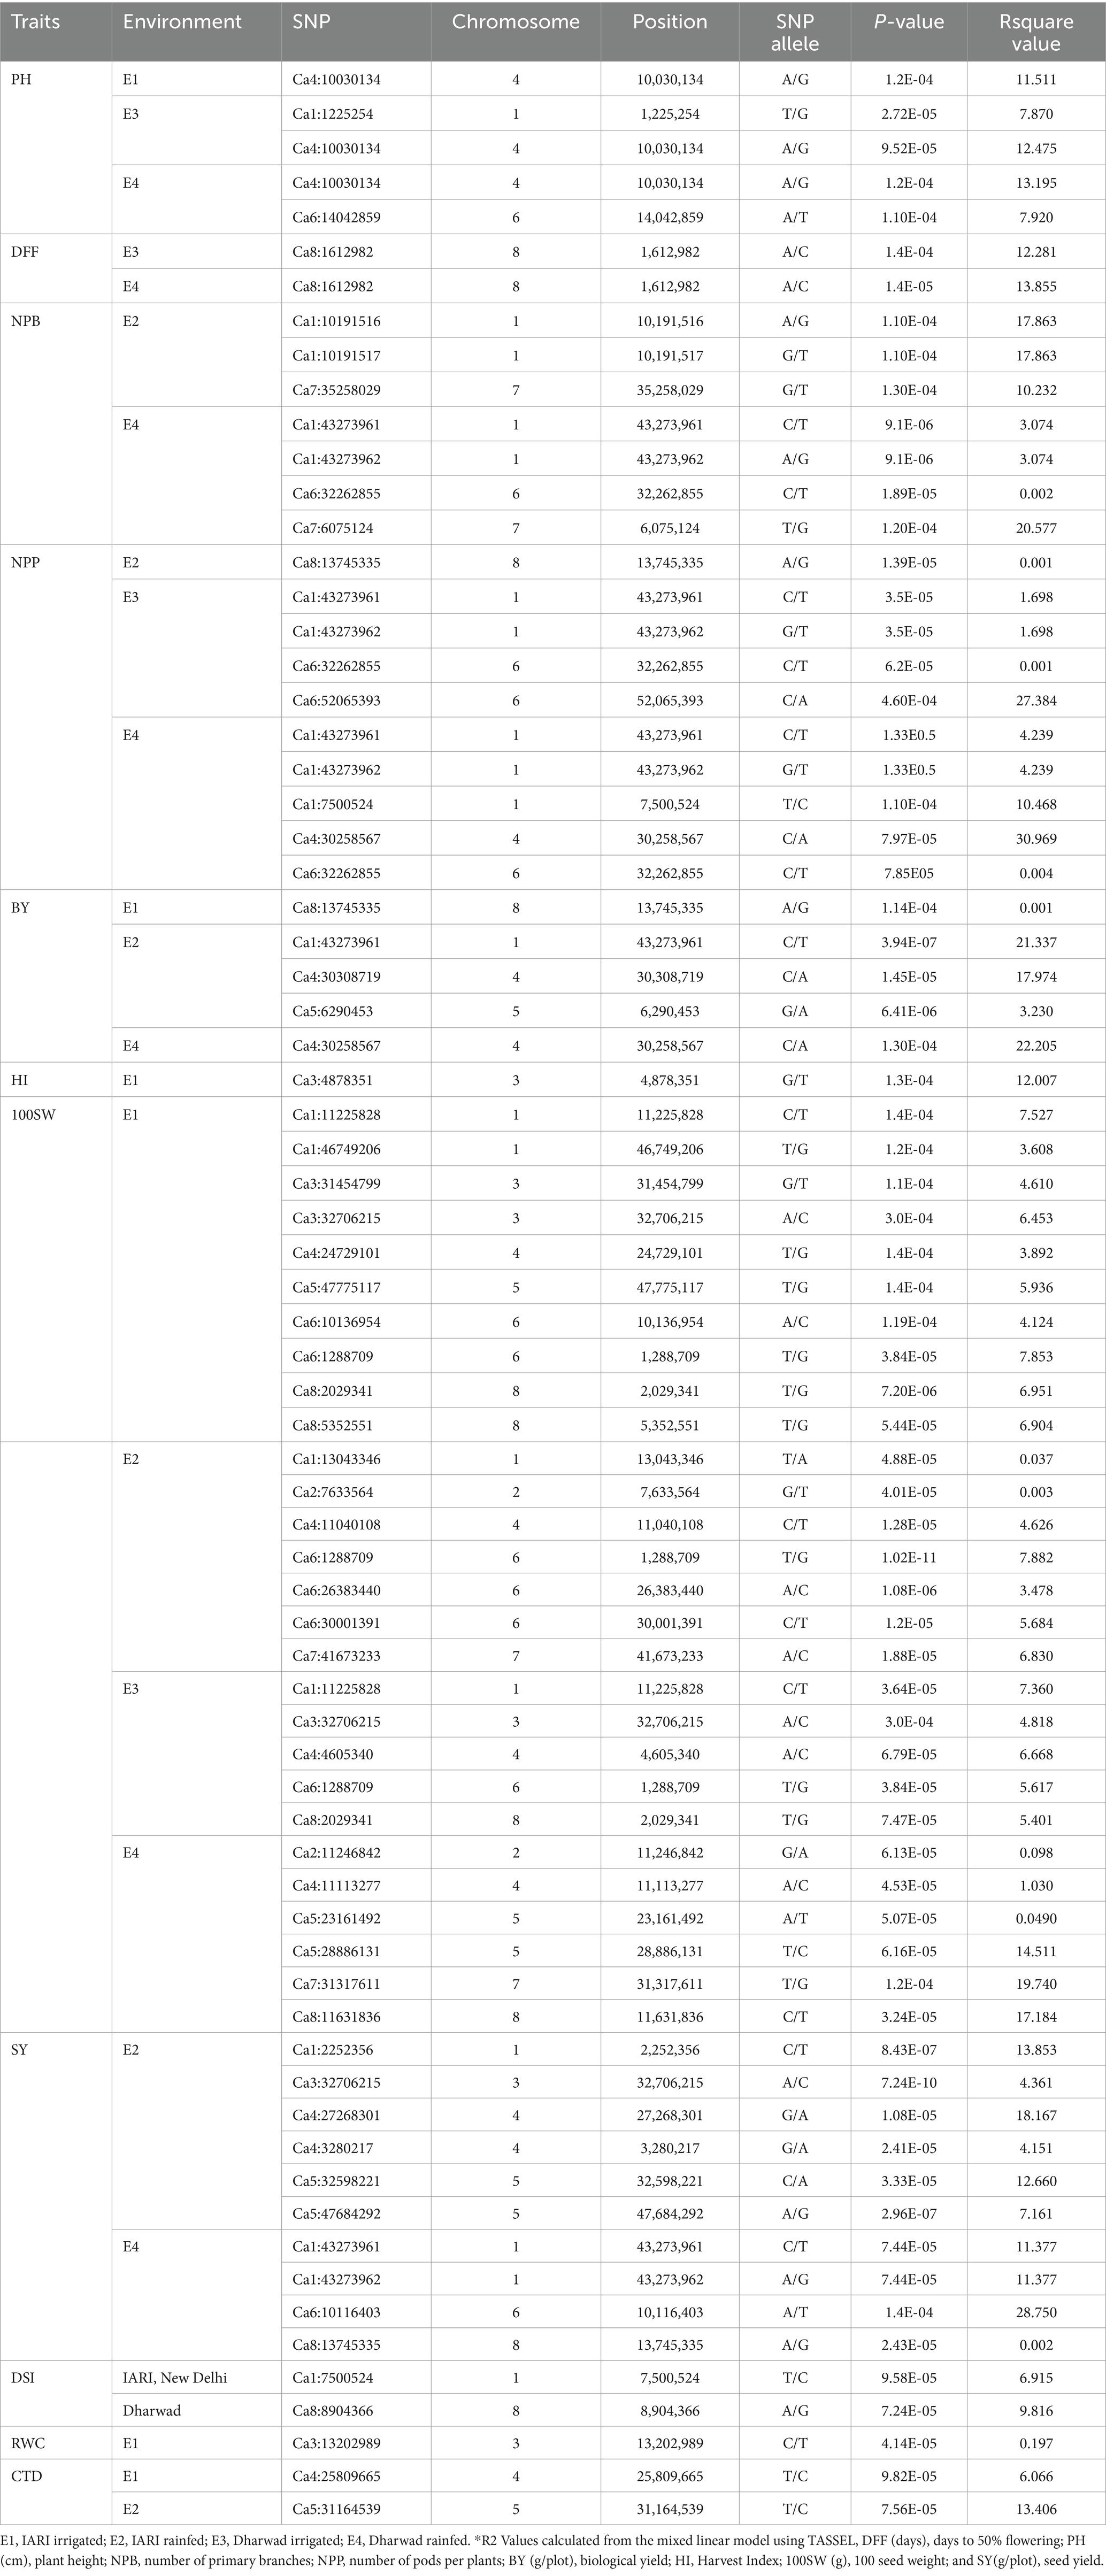
Table 2. Fifty-two SNPs which are associated with different traits.
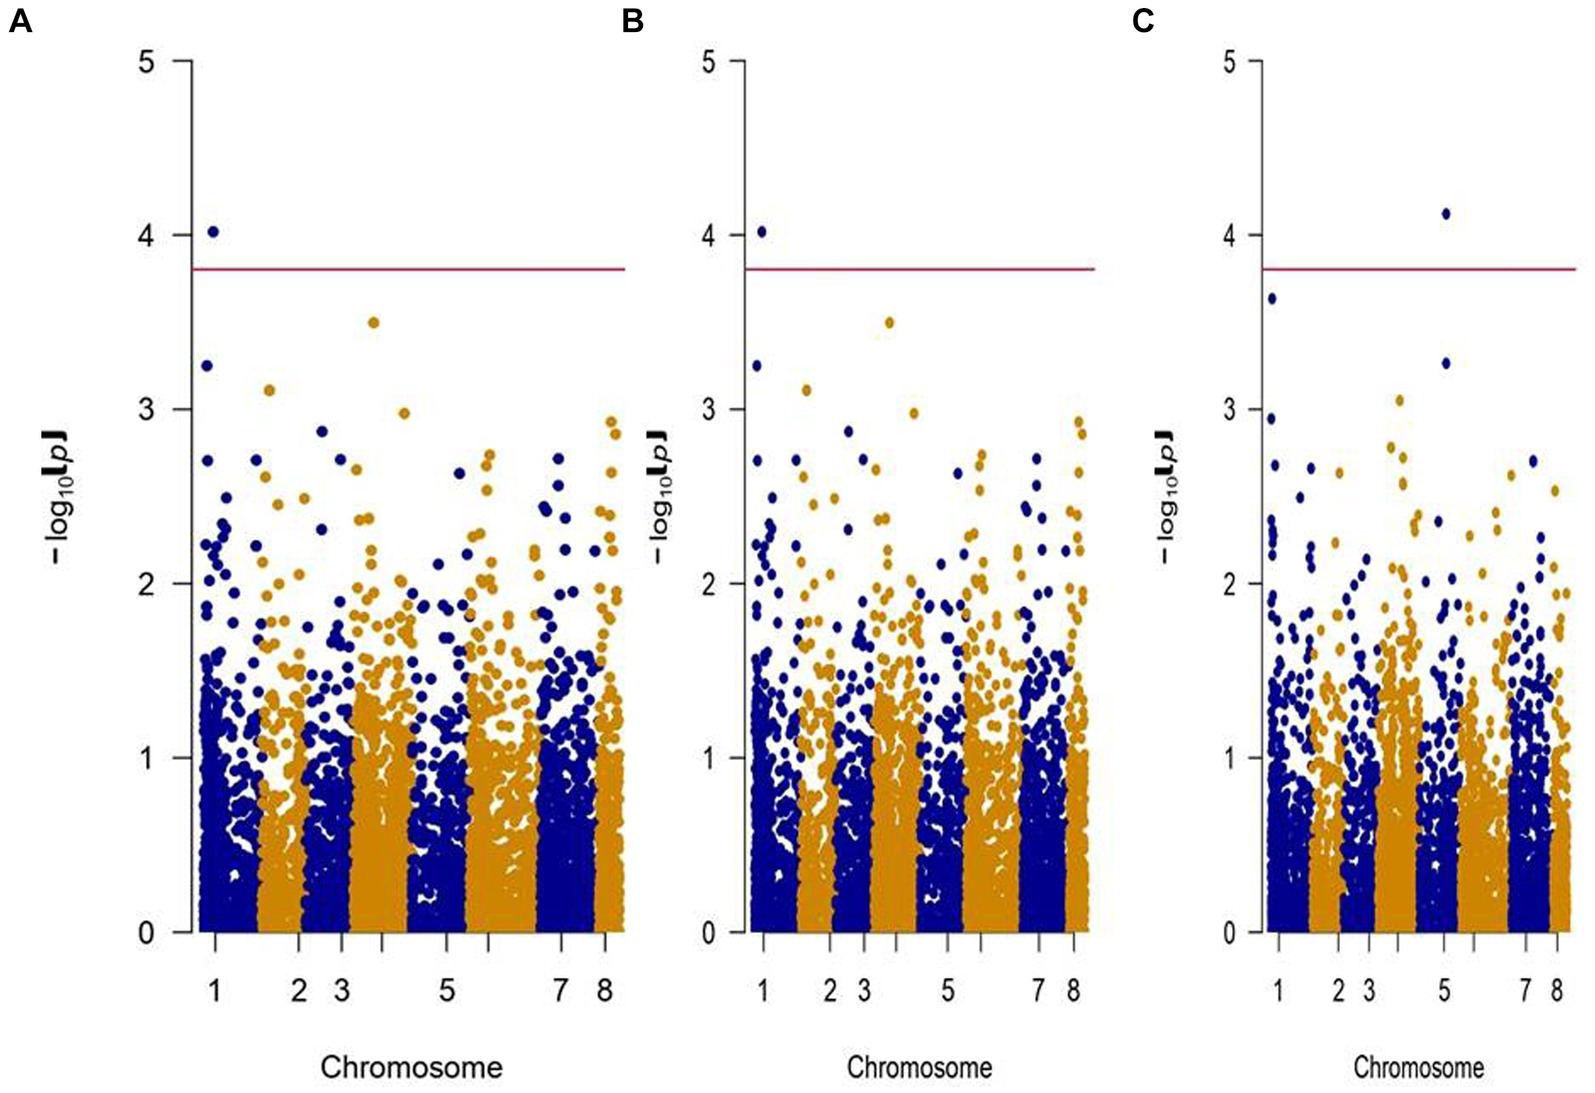
Figure 7. Manhattan Plot represents chromosome on the X-axis and –log (p) value on the Y-axis. (A) DSI—IARI, New Delhi. (B) DSI—Dharwad. (C) CTD—IARI, Rainfed (Left to Right).

Figure 8. Manhattan Plot represents chromosome on the X-axis and –log (p) value on the Y-axis. (A) IARI, RF-100SW. (B) IARI, RF-SY. (C) Dharwad, RF-100SW. (D) Dharwad, RF-SY.
The significant SNP associations with different traits were further used for the identification of putative candidates based on the position of SNPs. LD decay across individual chromosomes was considered to retrieve a flanking sequence of significant SNPs from the NCBI database and functionally annotated based on CDC Frontier v1 functional annotation (Varshney et al., 2013) from the pulse database (Supplementary Data S1). The identified MTA Ca1:7500524 associated with traits IARI_DSI (9.58E-05) and E4_NPP (p < 1.10E-04) explains 6.915 and 10.648% phenotypic variance found in or near probable coding region encodes for probable LRR receptor-like serine/threonine-protein kinase At4g20940 (Ca_08003), and another significant MTA for Dharwad_DSI (7.24E-05) located at Ca8:8904366 explains 9.816% phenotypic variance, colocalized with the gene encodes for threonine–tRNA ligase, mitochondrial 1-like (Ca_11521). The MTA Ca3:32706215 for E1_100SW (p < 3.0E-04), E1_100SW (p < 3.0E-04), and E2_SY (7.24E-10) explain the phenotypic variation of 6.453, 4.818, and 4.361%, respectively, colocalized with the gene zinc finger BED domain-containing protein DAYSLEEPER-like (Ca_12000). The MTA Ca4:30258567 had associations with E4_NPP (p < 7.97E-05) and E4_BY (p < 1.30E-04) explaining 30.969 and 22.205% phenotypic variations, respectively, and encodes for 11 kDa late embryogenesis abundant protein-like (Ca_14189). The MTA Ca5:28886131 for E4_100SW (p < 6.16E-05) explains the phenotypic variation of 14.511% and is colocalized in or near gene encodes for protein WAT1-related protein-like (Ca_17987). MTA Ca7:41673233 was found to be colocalized with gene encodes for the beta-galactosidase (Ca_17987) and was associated with E2_100SW (p < 1.88E-05) explaining the phenotypic variation of 6.830%. MTA Ca7:31317611 for E4_100SW (p < 1.2E-04) explains the phenotypic variation of 19.740%, found near or in gene encodes for putative proline-rich protein APG isolog, GDSL esterase/lipase APG (Ca_10127). MTA Ca1:2252356 for E2_SY (p < 8.43E-07) found in or near gene encodes for E3 ubiquitin-protein ligase AIRP2-like (Ca_00281) explains 13.853% phenotypic variance. MTA Ca5:47684292 for E2_SY (p < 2.96E-07) encodes with the protein FAR1-RELATED SEQUENCE 7-like and sugar transport protein 10-like (Ca_24737) explains 7.161% phenotypic variance. MTA Ca4:30308719 for E2_BY (p < 1.45E-04) found in or near gene encodes for UDP-glycosyltransferase (Ca_23901) explains a phenotypic variance of 17.974%. MTA Ca5:31164539 for E2_CTD (p < 7.56E-05) explains phenotypic variance of 13.406%, found in or near gene encodes for protein U-box domain-containing protein 44-like (Ca_04820), and is also capable of functioning as E3 ubiquitin-protein ligase (Raab et al., 2009).
The chickpea grown in the Indian subcontinent has a narrow genetic base (Bharadwaj et al., 2011b), and the use of various accessions/donor parents in the breeding program would increase the sensitivity of chickpea productivity toward biotic and abiotic stress (Muehlbauer and Sarker, 2017). The study on the linkage mapping in the intraspecific populations (desi × kabuli) from the STMs proved the potential of using genomic resources in chickpea breeding (Bharadwaj et al., 2011a). The breeding program could be accelerated by supplementing conventional breeding efforts with genomics-assisted breeding (GAB) (Varshney et al., 2007). Sequence cost curtailed as an advance in the next-generation sequencing technology (NGS) (Varshney et al., 2005) and the availability of chickpea draft genome (Jain et al., 2013; Varshney et al., 2013; Gupta et al., 2017) have led to the development of genotyping-by-sequencing-based marker, which can be effectively used for genome-wide association analysis for identification of marker–trait associations (MTAs).
The significance of the genotypic and environment main effect from analysis of variance implicates the presence of more variability in this germplasm for different traits, and also, the significance of interaction effects reveals the differential response of these genotypes across the environments. A strong correlation with SY and BY in all four environments implies that plant growth and development have a direct impact on seed yield. The strong correlations between seed and biomass in both the irrigated and stress treatments at vegetative and reproductive stages (Sachdeva et al., 2022). The DSI was the best used indices to identify drought-tolerant lines (Fischer and Maurer, 1978), in the earlier investigation, also used the DSI as a selection index to identify drought-tolerant genotypes in chickpeas (Sachdeva et al., 2018).
Half of SNPs studies have a PIC value of more than 0.25; this indicates sufficient diversity of these markers. The average PIC value of 0.32 was reported for SNP markers, and more than half of the SNP markers showed PIC values higher than 0.25; these SNP markers were used in chickpeas for genome diversity, population structure, and linkage analysis (Farahani et al., 2019). The average genetic distance between the individual was calculated between the genotypes, the average GD between genotypes was 0.32 with more than 81% of genotype pairs having a genetic distance above 0.25, implicating the presence of high genetic variability between the genotypes. The genome-wide LD decay estimated for the present investigation is on par with the previous association studies of chickpeas for complex yield traits (Kujur et al., 2015; Upadhyaya et al., 2016). The greater number of genotypes had a lower kinship value (<0.5) (a lower kinship value indicates diverse genotypes, while a higher kinship value indicates a similar genotype) (Dodds et al., 2015).
LD decay distance along individual chromosomes was considered to retrieve a flanking sequence of significant MTAs (p < 1.5E-04), selected region searched for the identification of candidate genes including start and stop position, BLAST sequence description, InterPro IDs, Gene ontology terms, and accessions in pulse database. “QTL-hotspot” harboring several drought-tolerant traits has been identified in the biparental mapping population ICCRIL03 (ICC 4958 × ICC 1882) and ICCRIL04 (ICC 283 × ICC 8261) (Varshney et al., 2014). Furthermore, this “QTL-hotspot” region was refined to ~14 cM from the original ~29 cM (Jaganathan et al., 2015); later, it was fine-mapped to ~300 Kb (13,239,546–13,547,009) (Kale et al., 2015); in this study, we do not find any significant MTAs in this QTL-hotspot. Gene present in or near significant MTAs associated with different traits under different environments was found to be encoded for different proteins; based on the available literature, some of the MTAs reported have been known to play a role in drought tolerance mechanisms. The protein probable LRR receptor-like serine/threonine-protein kinase At4g20940 [Guard 211 Cell Hydrogen Peroxide-Resistant1 (GHR1)], found in or near MTA for IARI_DSI and E4_NPP, is reported to be involved in drought tolerance in Arabidopsis by regulating the level of aliphatic glucosinolates (GLSs) by involving in auxin signaling and also stomatal regulation (Salehin et al., 2019); one QTL “QR3dsi02” for DSI explaining 13.00% phenotypic variation was reported in biparental mapping population ICC4958 × ICC 1882 (Jaganathan et al., 2015). The genomic region of MTA for E4_NPP and E4_BY encodes LEA (Late embryonic abundant protein). These proteins contribute toward antioxidant activity, metal ion binding, membrane and protein stabilization, hydration buffering, and DNA and RNA interaction and are known to protect plant metabolism against abiotic stresses (Shao et al., 2005). Genomic region with MTA for E4_100SW encodes WAT1 protein localized, which acts as an auxin transporter and is involved in the auxin homeostasis (Ranocha et al., 2013). MTA for E2_SY encodes with the protein FAR1-RELATED SEQUENCE 7-like and sugar transport protein 10-like. FRS genes like FRS7 and FRS12 and the loss of function could result in early flowering plants with overly elongated hypocotyls mainly in short days in Arabidopsis (Ritter et al., 2017). Two SNPs at different locations are found to be associated with the SY found with the protein sugar transporter. Earlier studies reported that the sugar transporter genes serve as signaling molecules in Arabidopsis (Wobus and Weber, 1999). In Arabidopsis, the sugar transporter gene induces subcellular modification, cellular signal alteration, enhanced biomass of Arabidopsis seeds, and early plant development (Wingenter et al., 2010). Investigation of drought tolerance in chickpeas using GWAS and genomic selection reported a significant association of SNPs in several auxin-related genes and sugar transporters with yield and yield-related traits under drought-prone environments (Li et al., 2018). MTA for E2_100SW encodes β-galactosidase protein that plays a major role in water stress. During senescence, the increase in the activity of β-galactosidase and loss of photosynthesis was observed in the leaves of Arabidopsis. In the background of loss of photosynthesis, this protein was found to be involved in the production of sugars that could serve for the execution of energy-dependent senescence (Pandey et al., 2017). The MTA for E4_100SW colocalized with the gene encodes putative proline-rich protein APG isolog and GDSL esterase/lipase APG. Some of the PRP genes such as the proline-rich protein-encoding gene (CcHyPRP) isolated from pigeon peas (Cajanus cajan) could be induced by various stresses (Priyanka et al., 2010). SNP marker-associated plant height under the rainfed condition located near GDSL esterases and lipases (GELPs) was reported in a study of GWAS for drought tolerance in multiple environments (Istanbuli et al., 2024). The overexpression of the GDSL-type pepper lipase gene in Arabidopsis during seed germination and plant growth showed drought tolerance and differential expression of drought- and abscisic acid (ABA)-inducible genes (Hong et al., 2008). MTA that encodes E3 ubiquitin-protein ligase AIRP2-like, AtAIRP2 in Arabidopsis, reported to play ABA-mediated drought stress responses (Cho et al., 2011). SNP associated with 100 seed weight encodes gene LRR receptor-like kinase family protein, and SNP associated with plant height encodes for E3 ubiquitin-protein ligase RNF185-like was reported in a study of high-resolution mapping of drought tolerance in chickpea using MAGIC population (Thudi et al., 2024). The MTA encoding to UDP-glycosyltransferases was found to be associated with E2_BY. Some of the UDP-glycosyltransferases, such as UGT79B2 and UGT79B3, contribute to cold, salt, and drought stress tolerance via modulating anthocyanin accumulation (Li et al., 2017). The protein U-box domain-containing protein 44, localized with the SNP associated with E2_CTD, has been reported to prevent premature senescence in Arabidopsis plants (Raab et al., 2009).
The present study demonstrates that several MTAs identified for different traits including yield, physiological, and drought indices recorded across locations, seasons, and different stress conditions. Identified genomic region colocalized with these MTAs encodes for proteins that are known for drought tolerance. However, to validate their functionality, further investigation via gene expression analysis or gene knock-out studies is imperative. Moreover, enhancing the scope of research by including large accessions and encompassing more locations and seasons could be considered to improve these findings. Once validated, these insights serve as good candidates for climate-resilient breeding for the improvement of drought tolerance in chickpeas.
The original contributions presented in the study are included in the article/Supplementary material, further inquiries can be directed to the corresponding authors.
DH: Data curation, Investigation, Methodology, Software, Validation, Writing – original draft. SPP: Investigation, Methodology, Writing – original draft. NK: Data curation, Formal analysis, Investigation, Methodology, Software, Validation, Writing – review & editing. CB: Conceptualization, Funding acquisition, Investigation, Methodology, Project administration, Resources, Supervision, Visualization, Writing – review & editing. TK: Data curation, Investigation, Methodology, Writing – review & editing. SP: Data curation, Methodology, Software, Writing – review & editing. BP: Formal analysis, Investigation, Methodology, Writing – review & editing. SK: Data curation, Investigation, Methodology, Writing – review & editing. PJ: Conceptualization, Data curation, Validation, Writing – review & editing. YK: Investigation, Methodology, Writing – review & editing. RV: Funding acquisition, Methodology, Resources, Supervision, Validation, Writing – review & editing.
The author(s) declare that financial support was received for the research, authorship, and/or publication of this article. DH received his funding for a doctoral fellowship from ICAR-IARI, whereas the experiment was partly supported by the funds of ICAR-IARI, CRP (12-143D) Molecular Breeding (Chickpea), DBT (24-752) and DBT AISRF (24-557) Programme.
DH acknowledges the funding support from the ICAR-IARI for his doctoral fellowship. All the authors acknowledge the funding from ICAR-CRP and DBT AISRF.
The authors declare that the research was conducted in the absence of any commercial or financial relationships that could be construed as a potential conflict of interest.
The reviewer AK declared a shared parent affiliation with the authors to the handling editor at the time of review.
All claims expressed in this article are solely those of the authors and do not necessarily represent those of their affiliated organizations, or those of the publisher, the editors and the reviewers. Any product that may be evaluated in this article, or claim that may be made by its manufacturer, is not guaranteed or endorsed by the publisher.
The Supplementary material for this article can be found online at: https://www.frontiersin.org/articles/10.3389/fsufs.2024.1389970/full#supplementary-material
Ahmad, F., Gaur, P. M., and Croser, J. (2005) in Chickpea (Cicer arietinum L.) in genetic resources, chromosome engineering, and crop improvement—Grain legumes. eds. R. J. Singh and P. P. Jauhar (Boca Raton, FL: CRC Press), 187–217.
Bar-El Dadon, S., Abbo, S., and Reifen, R. (2017). Leveraging traditional crops for better nutrition and health - the case of chickpea. Trends Food Sci. Technol. 64, 39–47. doi: 10.1016/j.tifs.2017.04.002
Barrs, H. D., and Weatherley, P. E. (1962). A re-examination of the relative turgidity technique for estimating water deficits in leaves. Aust. J. Biol. Sci. 15, 413–428. doi: 10.1071/BI9620413
Bharadwaj, C., Chauhan, S., Yadav, S., Tara, T., Singh, R., Kumar, J., et al. (2011a). Molecular marker-based linkage map of chickpea (Cicer arietinum) developed from desi × kabuli cross. Indian J. Agric. Sci. 80, 947–951.
Bharadwaj, C., Srivastava, R., Chauhan, S. K., Satyavathi, C. T., Kumar, J., Faruqui, A., et al. (2011b). Molecular diversity and phylogeny in geographical collection of chickpea (Cicer sp.) accessions. J. Genet. 92, 94–100. doi: 10.1007/s12041-011-0114-6
Bharadwaj, C., Tripathi, S., Soren, K. R., Thudi, M., Singh, R., Sheoran, S., et al. (2021). Introgression of “QTL-hotspot” region enhances drought tolerance and grain yield in three elite chickpea cultivars. Plant Genome 14:e20076. doi: 10.1002/tpg2.20076
Blum, A., and Ebercon, A. (1981). Cell membrane stability as a measure of drought and heat tolerance in wheat. Crop Sci. 21, 43–47. doi: 10.2135/cropsci1981.0011183X002100010013x
Bradbury, P. J., Zhang, Z., Kroon, D. E., Casstevens, T. M., Ramdoss, Y., and Buckler, E. S. (2007). TASSEL: software for association mapping of complex traits in diverse samples. Bioinformatics 23, 2633–2635. doi: 10.1093/bioinformatics/btm308
Cho, S. K., Ryu, M. Y., Seo, D. H., Kang, B. G., and Kim, W. T. (2011). The Arabidopsis RING E3 ubiquitin ligase AtAIRP2 plays combinatory roles with AtAIRP1 in abscisic acid-mediated drought stress responses. Plant Physiol. 157, 2240–2257. doi: 10.1104/pp.111.185595
Cramer, G. R., Urano, K., Delrot, S., Pezzotti, M., and Shinozaki, K. (2011). Effects of abiotic stress on plants: a systems biology perspective. BMC Plant Biol. 11, 163–176. doi: 10.1186/1471-2229-11-163
Daryanto, S., Wang, L., and Jacinthe, P. A. (2015). Global synthesis of drought effects on food legume production. PLoS One 10:e0127401. doi: 10.1371/journal.pone.0127401
David, L. R., Jeffry, M. T., Yoshihiro, M., Larissa, M. W., Sherry, R. W., John, D., et al. (2001). Structure of linkage disequilibrium and phenotypic associations in the maize genome. Proc. Natl. Acad. Sci. 98, 11479–11484. doi: 10.1073/pnas.201394398
Dixit, G. P., Srivastava, A. K., and Singh, N. P. (2019). Marching towards self-sufficiency in chickpea. Curr. Sci. 116, 239–242. doi: 10.18520/cs/v116/i2/239-242
Dodds, K. G., McEwan, J. C., Brauning, R., Anderson, R. A., Van Stijn, T. C., Kristjánsson, T., et al. (2015). Construction of relatedness matrices using genotyping-by-sequencing data. BMC Genomics 16:1047. doi: 10.1186/s12864-015-2252-3
Earl, D. A., and vonHoldt, B. (2012). Structure harvester: a website and program for visualizing structure output and implementing the Evanno method. Cons. Genet. Res. 4, 359–361. doi: 10.1007/s12686-011-9548-7
Evanno, G., Regnaut, S., and Goudet, J. (2005). Detecting the number of clusters of individuals using the software structure: a simulation study. Mol. Ecol. 14, 2611–2620. doi: 10.1111/j.1365-294x.2005.02553.x
FAOSATAT (2021). Crops and livestock products. Available at: http://www.fao.org/faostat/en/#data/QCL
Farahani, S., Maleki, M., Mehrabi, R., Kanouni, H., Scheben, A., Batley, J., et al. (2019). Whole genome diversity, population structure, and linkage disequilibrium analysis of chickpea (Cicer arietinum L.) genotypes using genome-wide DArTseq-based SNP markers. Genes 10:676. doi: 10.3390/genes10090676
Fischer, K. S., and Maurer, R. (1978). Drought resistance in spring wheat cultivars. I. Grain yield responses. Aust. J. Agric. Res. 29, 897–912. doi: 10.1071/AR9780897
Gahlaut, V., Jaiswal, V., Balyan, H. S., Joshi, A. K., and Gupta, P. K. (2021). Multi-locus GWAS for grain weight-related traits under rain-fed conditions in common wheat (Triticum aestivum L.). Front. Plant Sci. 12:758631. doi: 10.3389/fpls.2021.758631
Gupta, S., Nawaz, K., Parween, S., Roy, R., Sahu, K., Pole, A. K., et al. (2017). Draft genome sequence of Cicer reticulatum L., the wild progenitor of chickpea provides a resource for agronomic trait improvement. DNA Res. 24, 1–10. doi: 10.1093/dnares/dsw042
Hill, W. G., and Weir, B. S. (1988). Variances and covariance of squared linkaged is equilibria in finite populations. Theor. Popul. Biol. 33, 54–78. doi: 10.1016/0040-5809(88)90004-4
Hong, J. K., Choi, H. W., Hwang, I. S., Kim, D. S., Kim, N. H., Choi, D. S., et al. (2008). Function of a novel GDSL-type pepper lipase gene, CaGLIP1, in disease susceptibility and abiotic stress tolerance. Planta 227, 539–558. doi: 10.1007/s00425-007-0637-5
Istanbuli, T., Nassar, A. E., Abd El-Maksoud, M. M., Tawkaz, S., Alsamman, A. M., and Hamwieh, A. (2024). Genome-wide association study reveals SNP markers controlling drought tolerance and related agronomic traits in chickpea across multiple environments. Front. Plant Sci. 15:1260690. doi: 10.3389/fpls.2024.1260690
Jaganathan, D., Thudi, M., Kale, S., Azam, S., Roorkiwal, M., Gaur, P. M., et al. (2015). Genotyping-by-sequencing based intra-specific genetic map refines a “QTL-hotspot” region for drought tolerance in chickpea. Mol. Gen. Genomics. 290, 559–571. doi: 10.1007/s00438-014-0932-3
Jain, M., Misra, G., Patel, R. K., Priya, P., Jhanwar, S., Khan, A. W., et al. (2013). A draft genome sequence of the pulse crop chickpea (Cicer arietinum L.). Plant J. 74, 715–729. doi: 10.1111/tpj.12173
Kale, S., Jaganathan, D., Ruperao, P., Chen, C., Punna, R., Kudapa, H., et al. (2015). Prioritization of candidate genes in “QTL-hotspot” region for drought tolerance in chickpea (Cicer arietinum L.). Sci. Rep. 5:15296. doi: 10.1038/srep15296
Kashiwagi, J., Krishnamurthy, L., Gaur, P. M., Upadhyaya, H. D., Varshney, R. K., and Tobita, S. (2013). Traits of relevance to improve yield under terminal drought stress in chickpea (C. arietinum L.). Field Crop Res. 145, 88–95. doi: 10.1016/j.fcr.2013.02.011
Kohli, P. S., Kumar Verma, P., Verma, R., Parida, S. K., Thakur, J. K., and Giri, J. (2020). Genome wide association study for phosphate deficiency responsive root hair elongation in chickpea. Funct. Integr. Genomics 20, 775–786. doi: 10.1007/s10142-020-00749-6
Krishnamurthy, L., Kashiwagi, J., Upadhyaya, H. D., Gowda, C. L. L., Gaur, P. M., Singh, S., et al. (2013). Partitioning coefficient – a trait that contributes to drought tolerance in chickpea. Field Crop Res. 149, 354–365. doi: 10.1016/j.fcr.2013.05.022
Kujur, A., Bajaj, D., Upadhyaya, H. D., Das, S., Ranjan, R., Shree, T., et al. (2015). A genome-wide SNP scan accelerates trait-regulatory genomic loci identification in chickpea. Sci. Rep. 5:11166. doi: 10.1038/srep11166
Li, P., Li, Y. J., Zhang, F. J., Zhang, G. Z., Jiang, X. Y., Yu, H. M., et al. (2017). The Arabidopsis UDP-glycosyltransferases UGT79B2 and UGT79B3, contribute to cold, salt and drought stress tolerance via modulating anthocyanin accumulation. Plant J. 89, 85–103. doi: 10.1111/tpj.13324
Li, Y., Ruperao, P., Batley, J., Edwards, D., Khan, T., Colmer, T. D., et al. (2018). Investigating drought tolerance in chickpea using genome-wide association mapping and genomic selection based on whole-genome resequencing data. Front. Plant Sci. 9:190. doi: 10.3389/fpls.2018.00190
Liu, X., Huang, M., Fan, B., Buckler, E. S., and Zhang, Z. (2016). Iterative usage of fixed and random effect models for powerful and efficient genome-wide association studies. PLoS Genet. 12, 1–24. doi: 10.1371/journal.pgen.1005767
Liu, K., and Muse, S. V. (2005). PowerMarker: an integrated analysis environment for genetic marker analysis. Bioinformatics 21, 2128–2129. doi: 10.1093/bioinformatics/bti282
Muehlbauer, F. J., and Sarker, A. (2017). Economic importance of chickpea: production, value, and world trade in the chickpea genome. Cham: Springer, 5–12.
Olivoto, T., and Lucio, A. D. (2020). Metan: an R package for multi-environment trial analysis. Methods Ecol. Evol. 11, 783–789. doi: 10.1111/2041-210X.13384
Pandey, J. K., Dash, S. K., and Biswal, B. (2017). Loss in photosynthesis during senescence is accompanied by an increase in the activity of β-galactosidase in leaves of Arabidopsis thaliana: modulation of the enzyme activity by water stress. Protoplasma 254, 1651–1659. doi: 10.1007/s00709-016-1061-0
Parween, S., Nawaz, K., Roy, R., Pole, A. K., Suresh, B. V., Misra, G., et al. (2015). An advanced draft genome assembly of a desi type chickpea (Cicer arietinum L.). Sci. Rep. 5:12806. doi: 10.1038/srep12806
Pritchard, J. K., Stephens, M., and Donnelly, P. (2000). Inference of population structure using multilocus genotype data. Genetics 155, 945–959. doi: 10.1093/genetics/155.2.945
Priyanka, B., Sekhar, K., Reddy, V. D., and Rao, K. V. (2010). Expression of pigeonpea hybrid-441 proline-rich protein encoding gene (CcHyPRP) in yeast and Arabidopsis affords multiple abiotic stress 442 tolerance. Plant Biotechnol. J. 8, 76–87. doi: 10.1111/j.1467-7652.2009.00467.x
Raab, S., Drechsel, G., Zarepour, M., Hartung, W., Koshiba, T., Bittner, F., et al. (2009). Identification of a novel E3 ubiquitin ligase that is required for suppression of premature senescence in Arabidopsis. Plant J. 59, 39–51. doi: 10.1111/j.1365-313X.2009.03846.x
Ranocha, P., Dima, O., Nagy, R., Felten, J., Corratgé-Faillie, C., Novák, O., et al. (2013). Arabidopsis WAT1 is a vacuolar auxin transport facilitator required for auxin homoeostasis. Nat. Commun. 4:2625. doi: 10.1038/ncomms3625
Ritter, A., Inigo, S., Fernandez-Calvo, P., Heyndrickx, K. S., Dhondt, S., Shi, H., et al. (2017). The transcriptional repressor complex FRS7-FRS12 regulates flowering time and growth in Arabidopsis. Nat. Commun. 8:15235. doi: 10.1038/ncomms15235
Roorkiwal, M., Bharadwaj, C., Barmukh, R., Dixit, G. P., Gaur, P. M., Chaturvedi, S. K., et al. (2020). Integrating genomics for chickpea improvement: achievements and opportunities. Theor. Appl. Genet. 133, 1703–1720. doi: 10.1007/s00122-020-03584-2
Sachdeva, S., Bharadwaj, C., Patil, B. S., Pal, M., Roorkiwal, M., and Varshney, R. K. (2022). Agronomic performance of chickpea affected by drought stress at different growth stages. Agronomy 12:995. doi: 10.3390/agronomy12050995
Sachdeva, S., Bharadwaj, C., Sharma, V., Patil, B. S., Soren, K. R., Roorkiwal, M., et al. (2018). Molecular and phenotypic diversity among chickpea (Cicer arietinum) genotypes as a function of drought tolerance. Crop Pasture Sci. 69, 142–153. doi: 10.1071/CP17284
Salehin, M., Li, B., Tang, M., Katz, E., Song, L., Ecker, J. R., et al. (2019). Auxin-sensitive aux/IAA proteins mediate drought tolerance in Arabidopsis by regulating glucosinolate levels. Nat. Commun. 10:4021. doi: 10.1038/s41467-019-12002-1
Schneider, S. H., Semenov, S., Patwardhan, A., Burton, I., Magadza, C. H. D., Oppenheimer, M., et al. (2007). “Assessing key vulnerabilities and the risk from climate change. climate change 2007: impacts, adaptation and vulnerability” in Contribution of Working Group II to the Fourth Assessment Report of the Intergovernmental Panel on Climate Change. eds. M. L. Parry, O. F. Canziani, J. P. Palutikof, P. J. van der Linden, and C. E. Hanson (UK: Cambridge University Press, Cambridge), 779–810.
Shao, H. B., Liang, Z. S., and Shao, M. A. (2005). LEA proteins in higher plants: structure, function, gene expression and regulation. Colloids Surf. B 45, 131–135. doi: 10.1016/j.colsurfb.2005.07.017
Thudi, M., Gaur, P. M., Krishnamurthy, L., Mir, R. R., Kudapa, H., Fikre, A., et al. (2014). Genomics-assisted breeding for drought tolerance in chickpea. Funct. Plant Biol. 41, 1178–1190. doi: 10.1071/FP13318
Thudi, M., Samineni, S., Li, W., Boer, M. P., Roorkiwal, M., Yang, Z., et al. (2024). Whole genome resequencing and phenotyping of MAGIC population for high resolution mapping of drought tolerance in chickpea. Plant Genome 17:e20333. doi: 10.1002/tpg2.20333
Turner, S. (2018). Qqman: an R package for visualizing GWAS results using Q-Q and Manhattan plots. J. Open Source Soft. 3:731. doi: 10.21105/joss.00731
Upadhyaya, H. D., Bajaj, D., Narnoliya, L., Das, S., Kumar, V., Gowda, C. L., et al. (2016). Genome-wide scans for delineation of candidate genes regulating seed-protein content in chickpea. Front. Plant Sci. 7:302. doi: 10.3389/fpls.2016.00302
Varshney, R. K., Graner, A., and Sorrells, M. E. (2005). Genomics-assisted breeding for crop improvement. Trends Plant Sci. 10, 621–630. doi: 10.1016/j.tplants.2005.10.004
Varshney, R. K., Hoisington, D. A., Upadhyaya, H. D., Gaur, P. M., Nigam, S. N., Saxena, K., et al. (2007). “Molecular genetics and breeding of grain legume crops for the semi-arid tropics” in Genomics-assisted crop improvement. Vol II. Genomics applications in crops. eds. R. K. Varshney and R. Tuberosa (The Netherlands: Springer), 207–242.
Varshney, R. K., Pandey, M. K., Bohra, A., Singh, V. K., Thudi, M., and Saxena, R. K. (2019). Toward the sequence-based breeding in legumes in the post-genome sequencing era. Theor. Appl. Genet. 132, 797–816. doi: 10.1007/s00122-018-3252-x
Varshney, R. K., Song, C., Saxena, R. K., Azam, S., Yu, S., Sharpe, A. G., et al. (2013). Draft genome sequence of chickpea (Cicer arietinum) provides a resource for trait improvement. Nat. Biotechnol. 31, 240–246. doi: 10.1038/nbt.2491
Varshney, R. K., Thudi, M., Nayak, S. N., Gaur, P. M., Kashiwagi, J., Krishnamurthy, L., et al. (2014). Genetic dissection of drought tolerance in chickpea (Cicer arietinum L.). Theor. Appl. Genet. 127, 445–462. doi: 10.1007/s00122-013-2230-6
Wang, J., and Zhang, Z. (2021). GAPIT version 3: boosting power and accuracy for genomic association and prediction. Genom. Proteom. Bioinform. 19, 629–640. doi: 10.1016/j.gpb.2021.08.005
Wingenter, K., Schulz, A., Wormit, A., Wic, S., Trentmann, O., Hoermiller, I. I., et al. (2010). Increased activity of the vacuolar monosaccharide transporter TMT1 alters cellular sugar partitioning, sugar signaling, and seed yield in Arabidopsis. Plant Physiol. 154, 665–677. doi: 10.1104/pp.110.162040
Keywords: GWAS, candidate gene, genetic diversity, population structure, GAPIT, TASSEL
Citation: Harish D, Pappula Reddy SP, Kumar N, Bharadwaj C, Kumar T, Parida S, Patil BS, Kumar S, Jain PK, Kumar Y and Varshney RK (2024) Integrating multilocus genome-wide association studies in chickpea landraces to discern the genetics of drought tolerance. Front. Sustain. Food Syst. 8:1389970. doi: 10.3389/fsufs.2024.1389970
Edited by:
Md Khairul Alam, Bangladesh Agricultural Research Institute, BangladeshReviewed by:
Amar Kant Kushwaha, Central Institute for Subtropical Horticulture (ICAR), IndiaCopyright © 2024 Harish, Pappula Reddy, Kumar, Bharadwaj, Kumar, Parida, Patil, Kumar, Jain, Kumar and Varshney. This is an open-access article distributed under the terms of the Creative Commons Attribution License (CC BY). The use, distribution or reproduction in other forums is permitted, provided the original author(s) and the copyright owner(s) are credited and that the original publication in this journal is cited, in accordance with accepted academic practice. No use, distribution or reproduction is permitted which does not comply with these terms.
*Correspondence: Neeraj Kumar, bmVlcmFqMDQ5MEBnbWFpbC5jb20=; Chellapilla Bharadwaj, ZHJjaGJoYXJhZHdhakBnbWFpbC5jb20=,
Disclaimer: All claims expressed in this article are solely those of the authors and do not necessarily represent those of their affiliated organizations, or those of the publisher, the editors and the reviewers. Any product that may be evaluated in this article or claim that may be made by its manufacturer is not guaranteed or endorsed by the publisher.
Research integrity at Frontiers
Learn more about the work of our research integrity team to safeguard the quality of each article we publish.