 Andrés Felipe León-Burgos1,2*
 José Raúl Rendón Sáenz1
 Luis Carlos Imbachi Quinchua1
 Mayra Alejandra Toro-Herrera3Carlos Andrés Unigarro1Valentina Osorio1
 Helber Enrique Balaguera-López2*
- 1National Coffee Research Center-Cenicafé, Manizales, Colombia
- 2Facultad de Ciencias Agrarias, Departamento de Agronomía, Universidad Nacional de Colombia, Bogotá, Colombia
- 3Department of Plant Science and Landscape Architecture, University of Connecticut, Storrs, CT, United States
Coffee fruits are highly competitive compared to other functional sink organs. This can affect the vegetative growth of the shoot, dry mass partitioning, and the size and amount of healthy beans. Therefore, this research aimed to evaluate changes in vegetative growth, physical and sensory attributes of the coffee bean, and total crop yield in response to varying fruit load at the tree level established under full-sun cultivation. The experiment was carried out for two consecutive years under field conditions with coffee trees of the cultivar “Cenicafé 1.” Nine different fruit load intensities at the whole-plant level of 20, 30, 40, 50, 60, 70, 80, 90, and 100% were evaluated. The vegetative growth of leaves and branches, leaf area-to-fruit ratio, and dry mass accumulation were evaluated, and growth indices were calculated. Total coffee fruit production, size and distribution of healthy beans, and sensory analysis were determined. As expected, for coffee trees with a 100% fruit load, we found significant decreases in the total number of leaves, leaf area-to-fruit ratio, and branch growth; less dry mass allocated to leaves and branches with a negative correlation between this and the fruit dry mass accumulation; and lower distribution of large and healthy beans. Unexpectedly, annual and accumulated patterns of total production and sensory quality of coffee beverage were not affected by the high fruit load. The findings suggest that increased fruit load in coffee trees of the “Cenicafé 1” variety led to changes in vegetative growth, dry mass partitioning, and physical quality of the beans. However, there was no impact on production patterns and sensory attributes.
1 Introduction
Coffee is a C3 perennial species, and various climatic, genetic, and nutritional factors influence its growth under tropical conditions (DaMatta, 2004; León-Burgos et al., 2022; Toro-Herrera et al., 2023). A negative correlation has been shown to exist between the growth of reproductive organs, specifically fruits, and vegetative shoot growth (Rakocevic et al., 2020). As the fruit load increases, it affects the periodicity or magnitude of vegetative plant growth (Vaast et al., 2005; Chaves et al., 2012). In coffee plants with a high fruit load, branch growth, leaf area-to-fruit ratio, and leaf formation are affected, inhibiting vegetative growth in an annual production cycle and altering future crop production patterns (Bote and Vos, 2016; Almeida et al., 2021; Unigarro et al., 2022).
The high fruit load on coffee trees leads to a negative imbalance in which the demand from the sinks exceeds the amount of photoassimilates supplied by the source organs (DaMatta et al., 2008; Almeida et al., 2021). This imbalance can lead to changes in dry mass allocation and partition patterns within individual branches or throughout the entire plant (Vaast et al., 2005; DaMatta et al., 2008). Cannell (1985) found that fruiting branches accumulated over 40% more of the total dry mass (vegetative organs and fruits) than fruitless branches, reducing more the mass assigned to the leaves by more than half. Vaast et al. (2005) report that, during fruit filling, four times more of the branches’ total accumulation of dry mass is allocated to the fruits than to the vegetative organs. Also, Bote and Vos (2016) identified significant increases in leaf loss after slow fruit growth. Therefore, there was a reduction in leaf dry weight and specific leaf area in the coffee plants.
The strong competition for carbohydrate allocation between coffee fruits (Vaast et al., 2005; Cambou et al., 2021) has led to a hypothesis that the physical and sensory quality of the bean can be negatively affected (Läderach et al., 2011; Bote and Vos, 2017; Echeverria-Beirute et al., 2018). Regarding physical attributes, Vaast et al. (2006) report that, in coffee trees with high fruit loads, there is a lower distribution of large-sized beans than with low fruit loads. Likewise, Läderach et al. (2011) and Bote and Vos (2017) determined that high fruit load can alter sensory attributes of the coffee beverage, such as aroma, acidity, flavor, residual flavor, body, and balance, even changing the beverage’s final quality score. However, it is worth mentioning that these studies were conducted in agroforestry systems with coffee plants, and the impact of sun-grown coffee farming—the largest production system in Colombia—on the quality of the beans has not been addressed (Rendón, 2020; National Coffee Research Center-Cenicafé, 2021).
In Colombia, coffee farming there has been outstanding improvement in highly productive varieties, with fruit set percentages that can reach up to 80%, along with agronomic attributes such as genetic resistance to coffee leaf rust (Hemilia vastratix) and coffee berry disease—CBD (Colletotrichum kahawae) that enhance the production capacity of the plants (Maldonado and Giraldo, 2020; National Coffee Research Center-Cenicafé, 2021). According to reports on these cultivars, the shoot’s vegetative growth is continuous throughout the year and of greater magnitude, synchronizing with increases in water availability and decreasing in intensity during the main harvest periods (Arcila, 2007; Jaramillo, 2018). Also, it has been reported that production increases with the age of the plant, with a variation in the fruit load, which can eventually lead to an imbalance in the formation of source and sink organs during the productive cycle (Rendón, 2020). However, few studies show the effects of fruit load on the plant growth of highly productive varieties in the country (Unigarro et al., 2022).
In this study, we hypothesize that high fruit load (i) reduces the magnitude and speed of plagiotropic growth of vegetative organs and (ii) alters the patterns of total coffee cherry production and sensory attributes of the beverage. In this way, we aimed to evaluate the changes in vegetative growth, dry mass accumulation, crop yield, and physical and sensory attributes of the coffee bean/beverage in response to the fruit load intensity at the tree level in a full-sun coffee plantation in the central Colombian coffee zone.
2 Materials and methods
2.1 Climate, plant material, and treatments
This research was carried out under field conditions for two consecutive years with plants of Coffea arabica variety “Cenicafé 1” established at the Naranjal Experimental Station of the National Coffee Research Center (Cenicafé), located in Chinchiná, Caldas, Colombia (04° 58’ N; 75° 39’ W), at 1,383 m.a.s.l. Between April 2022 and November 2023—the study period—the following environmental conditions were reported: an average temperature of 21°C, an average maximum temperature of 26.20°C, 4,561 mm of accumulated precipitation, 2,342 h of accumulated sunlight, and an average relative humidity of 82.96% (Supplementary Table S1). The data was acquired from the meteorological stations set up by the National Federation of Coffee Growers of Colombia, available in Agroclima-Agroclimática cafetera (2023).
The variety is resistant to coffee leaf rust (Hemilia vastratix) and coffee berry disease—CBD (Colletotrichum kahawae) (Maldonado and Giraldo, 2020). Plants were selected at an approximate age of three years after establishment in the field, at which one of Colombia’s most abundant annual crop harvests occurs (Rendón, 2020). The full-sun coffee plantation was set up with a distance of 1.4 m between rows and 1.0 m between plants with one orthotropic branch or ramification. Agronomic practices were prioritized for commercial coffee production, including amendments, fertilizers, and pest and disease control (National Coffee Research Center-Cenicafé, 2021).
Before treatment application, the initial load crop was quantified during the phenological stage of fruit development-BBCH71 (slow growth phase) to define the trees with the highest fruit load, which presented around 1,910 fruits plant−1 (T1: 100% fruit load). Subsequently, the other treatments were assigned as follows: T2: 90% fruit load (1,719 fruits plant−1), T3: 80% (1,528 fruits plant−1), T4: 70% (1,337 fruits plant−1), T5: 60% (1,146 fruits plant−1), T6: 50% (955 fruits plant−1), T7: 40% (764 fruits plant−1), T8: 30% (573 fruits plant−1) and T9: 20% fruit load (382 fruits plant−1). Trees that exceeded the fruit load assigned for each treatment were thinned on each branch to homogenize the number of fruits. In total, 54 trees were selected based on their uniformity in height and number of productive plagiotropic branches. Finally, to monitor the measurements on each tree, four plagiotropic branches located in the canopy’s central region, typically the most productive zone, were chosen from each tree.
2.2 Growth measurements
2.2.1 Shoot vegetative growth
To measure the magnitude of vegetative growth, in 2022, the selected plagiotropic branches of each plant were sampled, with a frequency of every 45 days after the start of the treatments (60 days of fruit development-DFD) until the stage of physiological maturity of the fruits (195 DFD). Different parameters related to growth, including branch length, total number of leaves per branch (TNL), area per leaf (LA), and leaf area-to-fruit ratio on the branch (LAFR), were evaluated. The number of total leaves was estimated by directly counting each branch.
Leaf area was estimated by non-destructive methods, measuring the length of the leaf blade (not including the petiole) and the width of the middle part of each leaf using a ruler. Then, the resulting data were incorporated into Eq. 1 proposed by Unigarro-Muñoz et al. (2015):
Where ELA is the estimated leaf area, L leaf length, and W leaf width.
To determine the leaf area-to-fruit ratio (LAFR), the estimated leaf area of all leaves on the branch was added up and then divided by the number of fruits recorded on the same branch. The length of the branch was measured using a flexometer to measure the distance from the point where it connects to the orthotropic stem at the base to its highest point at the apex. Subsequently, the branch growth were estimated with the average absolute rate of branch length growth using the Eq. 2 proposed by León-Burgos et al. (2022):
Where V2 is the value of the branch length measured at 195 DFD (T2), and V1 is the value of the branch length measured at 60 DFD (T1).
2.2.2 Dry mass accumulation
The total dry mass per branch of the shoot organs (branches, leaves, and fruits) was determined at 195 DFD from 2022. The plants were separated and each organ was stored separately in labeled paper bags. The samples were dried in an oven at 65°C for 72 h until their weight was constant. Subsequently, they were weighed on an analytical balance with a precision of 0.01 g, where the branch dry mass (BDM), leaves dry mass (LDM), fruits dry mass (FDM), and total dry mass (TDM) were determined.
Then, the TDM partition was calculated as branch mass ratio (BMR = BDM/TDM), leaf mass ratio (LMR = LDM/TDM), and fruit mass ratio (FMR = FDM/TDM). Also, indirect growth measures were estimated, namely the leaf-area ratio (LAR = LA/TDM) and specific leaf area (SLA = LA/LDM), as previously proposed Hunt (1990).
2.3 Crop yield
The production of coffee cherry (g) was recorded using a dynamometer with a precision of 100 g. Only fully ripe red fruits were harvested from the tree every 18 days from May 2022 to November 2023. With this frequency, the total annual and accumulated production in the 2 years per plant and per treatment was estimated, as previously done by González-Osorio et al. (2023).
2.4 Physical and sensory attributes of the bean and coffee beverage
A standard post-harvest process was carried out: pulping less than 6 h after harvesting, separation of the mucilage through spontaneous fermentation, ending with mechanical drying at a temperature of 40°C. Beans with humidity between 11–12% from the 2022 harvest were selected for bean quality analyses.
Physical characteristics such as bean size and quantity of healthy beans were determined. The size was evaluated based on the ISO 4150 standard (2011) using several sieves with gradual decrease in diameter: number 18 (7.10 ± 0.18 mm), 17 (6.70 ± 0.17 mm), 16 (6.30 ± 0.17 mm), 15 (6.00 ± 0.16 mm), 14 (5.60 ± 0.16 mm), 13 (5.00 ± 0.15 mm), and 12 (4.75 ± 0.14 mm), according to what was reported by Cassamo et al. (2022). Samples of 250 g for each plant (six repetitions per treatment) were passed through the sieves. The weight of each portion retained by the sieve was calculated and converted into a percentage equivalent to the total mass of the beans (250 g). Then, beans were categorized into three groups based on their size: large (beans retained in sieves number 18 and 17), medium (beans retained in sieves number 16 and 15), and small (beans retained in sieves number 14, 13, and 12) as previously carried out by Vaast et al. (2006). In the same sample, the number of healthy beans was quantified, ruling out beans with defects such as those that were black, brocaded, and crushed with mechanical damage or alterations in color through direct observation (Osorio et al., 2021). Then, the mass of healthy beans (without defects) was weighed and converted into a percentage equivalent to the total mass used in each sampling.
Sensory analyses were carried out following the Specialty Coffee Association (SCA) protocol with the participation of five Q-Grader tasters. This methodology includes roasting the coffee beans, coffee proportion, grinding, temperature control, and water quality control. The samples were toasted (BRZ-2, Probat, Germany) at an average temperature of 208.7°C for 10 min. According to Osorio Pérez et al. (2023), the final cup quality score of the beverage was determined by adding the total sensory attributes. In this research, fragrance/aroma, flavor, acidity, body, balance, and the total score based on the SCA scale were the five sensory characteristics that were focused on.
2.5 Experimental design and statistical analysis
A completely randomized experimental design with nine treatments was used for data analysis. The experimental unit was considered a coffee plant, with one experimental unit per repetition and six repetitions per treatment (n = 6). A repeated measures analysis of variances was used using the F statistic (p < 0.05) to evaluate the effect of fruit development on measures of shoot vegetative growth. Subsequently, a multiple comparison test with Tukey–Kramer adjustment was applied (p < 0.05).
For the measurements of dry mass accumulation, physical and sensory attributes of the bean, and annual and cumulative coffee cherry production, an analysis of variances (ANOVA, p < 0.05) was used after meeting the assumptions of normality (Kolmogorov–Smirnov test) and homogeneity of variances (Levene test). Next, a Tukey test (p < 0.05) was conducted as a post hoc analysis to compare the means between the treatments. Likewise, a t-student test (p < 0.05) was applied to detect statistical differences in the production recorded in fruit loads between years. Regarding the growth of the branches, a linear regression model was adjusted with the fruit load as the independent variable. The model’s performance was assessed based on the coefficient of determination (R2), mean squared error (MSE), and the significance of the equation’s parameters according to the t-student test (p < 0.05). A Pearson correlation analysis was also carried out between the growth measures FMR, LMR, BMR, TDM, LAR, and SLA to find the linear relationships between these measures using the Corrplot statistical package (Wei and Simko, 2021).
Additionally, a multivariate approach was carried out between cumulative coffee production-CCP and growth measures. A hierarchical clustering analysis with Manhattan distance as a measure of dissimilarity and Ward’s clustering method as a measure of clustering was used to categorize fruit loads. Afterwards, the grouping mentioned above underwent a principal component analysis (PCA) and was graphed based on the fruit loads against the first and second principal components (PC1) and (PC2). The factoextra package (Kassambara and Mundt, 2020) was used for these analyses. All analyses were conducted in R software version 4.0.4 (Development Core Team R, 2019) with Stats and Agricolae statistical packages (Mendiburu, 2023). Sigmaplot version 10.0 (Inpixon, Systat Software Inc., United States) was used for the graphs.
3 Results
3.1 Effect of fruit load on shoot vegetative growth
The increase in fruit load generated changes in the growth measures evaluated based on the days of fruit development-DFD. It was shown that the leaf area-to-fruit ratio was the most sensitive measure of growth, with gradual and significant reductions (p < 0.0002) throughout the time of fruit development, influenced by the high fruit load (>60%) evaluated in this study (Figure 1). In contrast, the total number of leaves and area per leaf were only significantly influenced by the high fruit load at 195 DFD (Supplementary Figure S2).
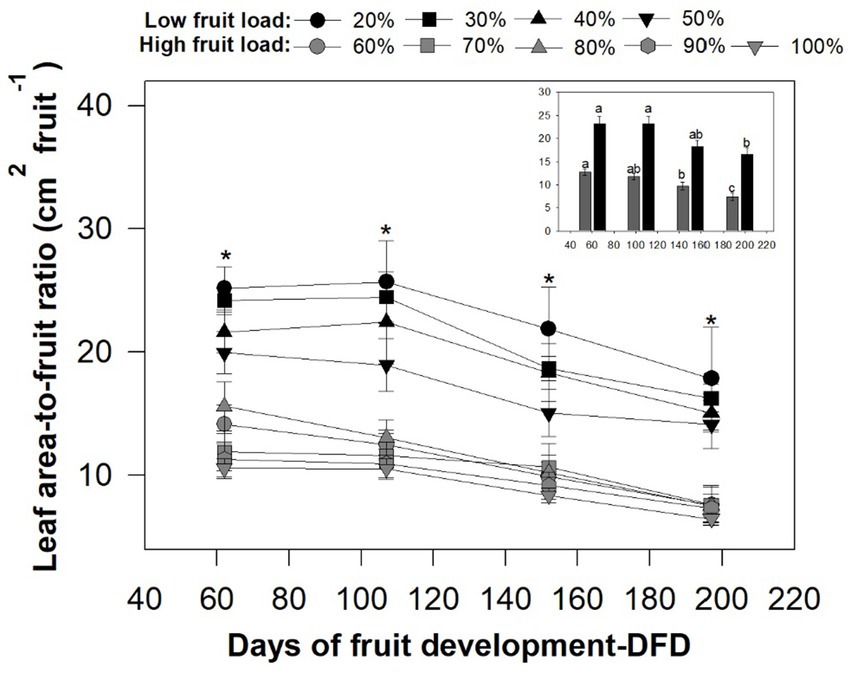
Figure 1. Effect of the fruit load on leaf area-to-fruit ratio-LAFR as a function of the days of fruit development-DFD. Each point represent the mean (n = 24) ± standard error. For each time of fruit development, the asterisks denote significant differences among means for low fruit load compared high fruit load according to the Tukey–Kramer test (p < 0.05). In the insets, mean values for low and high fruit load are shown. The different letters denote significant differences among time of fruit development according to the Tukey test (p < 0.05).
During the slow growth phase at 60 DFD, an average of 23 leaves per branch, with an area per leaf of 70.27 cm2 and an area-to-fruit ratio ranging between 10.51 and 25.17 cm2 fruit−1, were recorded. From 105 DFD (linear phase or accelerated growth), decreases of 4.5% on average were observed for the total number of leaves in all fruit loads (Supplementary Figure S2A). The opposite occurred for the leaf area and leaf area-to-fruit ratio measurements, with increases between 5 and 1%, respectively, for the trees with the lowest fruit load (20, 30, 40 and 50%). The other treatments showed reductions (Figure 1; Supplementary Figure S2). Subsequently, at 150 DFD (maximum growth in fruit mass), decreases are generalized for all treatments, with an average of 19 leaves per branch, an area per leaf of 62.20 cm2 and an area-to-fruit ratio ranging between 8.37 and 21.87 cm2 fruit−1 (Figure 1; Supplementary Figure S2).
When the fruit reached its physiological maturity, at 195 DFD, there were representative and significant changes in all the growth measures evaluated, which were influenced by the extent of fruit loading. For the lowest fruit loads (20, 30, 40 and 50%), increases of 1% were observed for the total number of leaves and 4% in the leaf area, compared to 150 DFD. From 60% fruit load, decreases of around 20% were recorded for the total number of leaves and 5% for the leaf area, compared to 150 DFD (Supplementary Figure S2). On the other hand, for the leaf area-to-fruit ratio, the trend of significant reductions was preserved in all fruit load intensities (Figure 1).
Figure 2 represents the influence of fruit load on the vegetative shoot growth variables evaluated in this study, comparing the magnitudes of growth of the total number of leaves, leaf area, and leaf area-to-fruit ratio at 195 DFD. In general, significant differences (p < 0.001) were observed regarding fruit loads. For example, when comparing fruit loads of 100 and 20%, there were reductions in the total number of leaves of 32 and 21% for leaf area, respectively. The opposite occurred for the leaf area-to-fruit ratio, where significant differences are shown from fruit loads of 60%, in contrast to trees with lower fruit load (20, 30, 40, and 50%), in which average values of 20.81 cm2 per fruit were determined. Trees with high fruit load (100%) show the most representative decreases for that variable with average values of 6.47 cm2 fruit−1 (Figure 2). These results show that the functional relationship of leaf area-to-fruit ratio is a growth measure that is very sensitive to increases in fruit load in coffee trees.
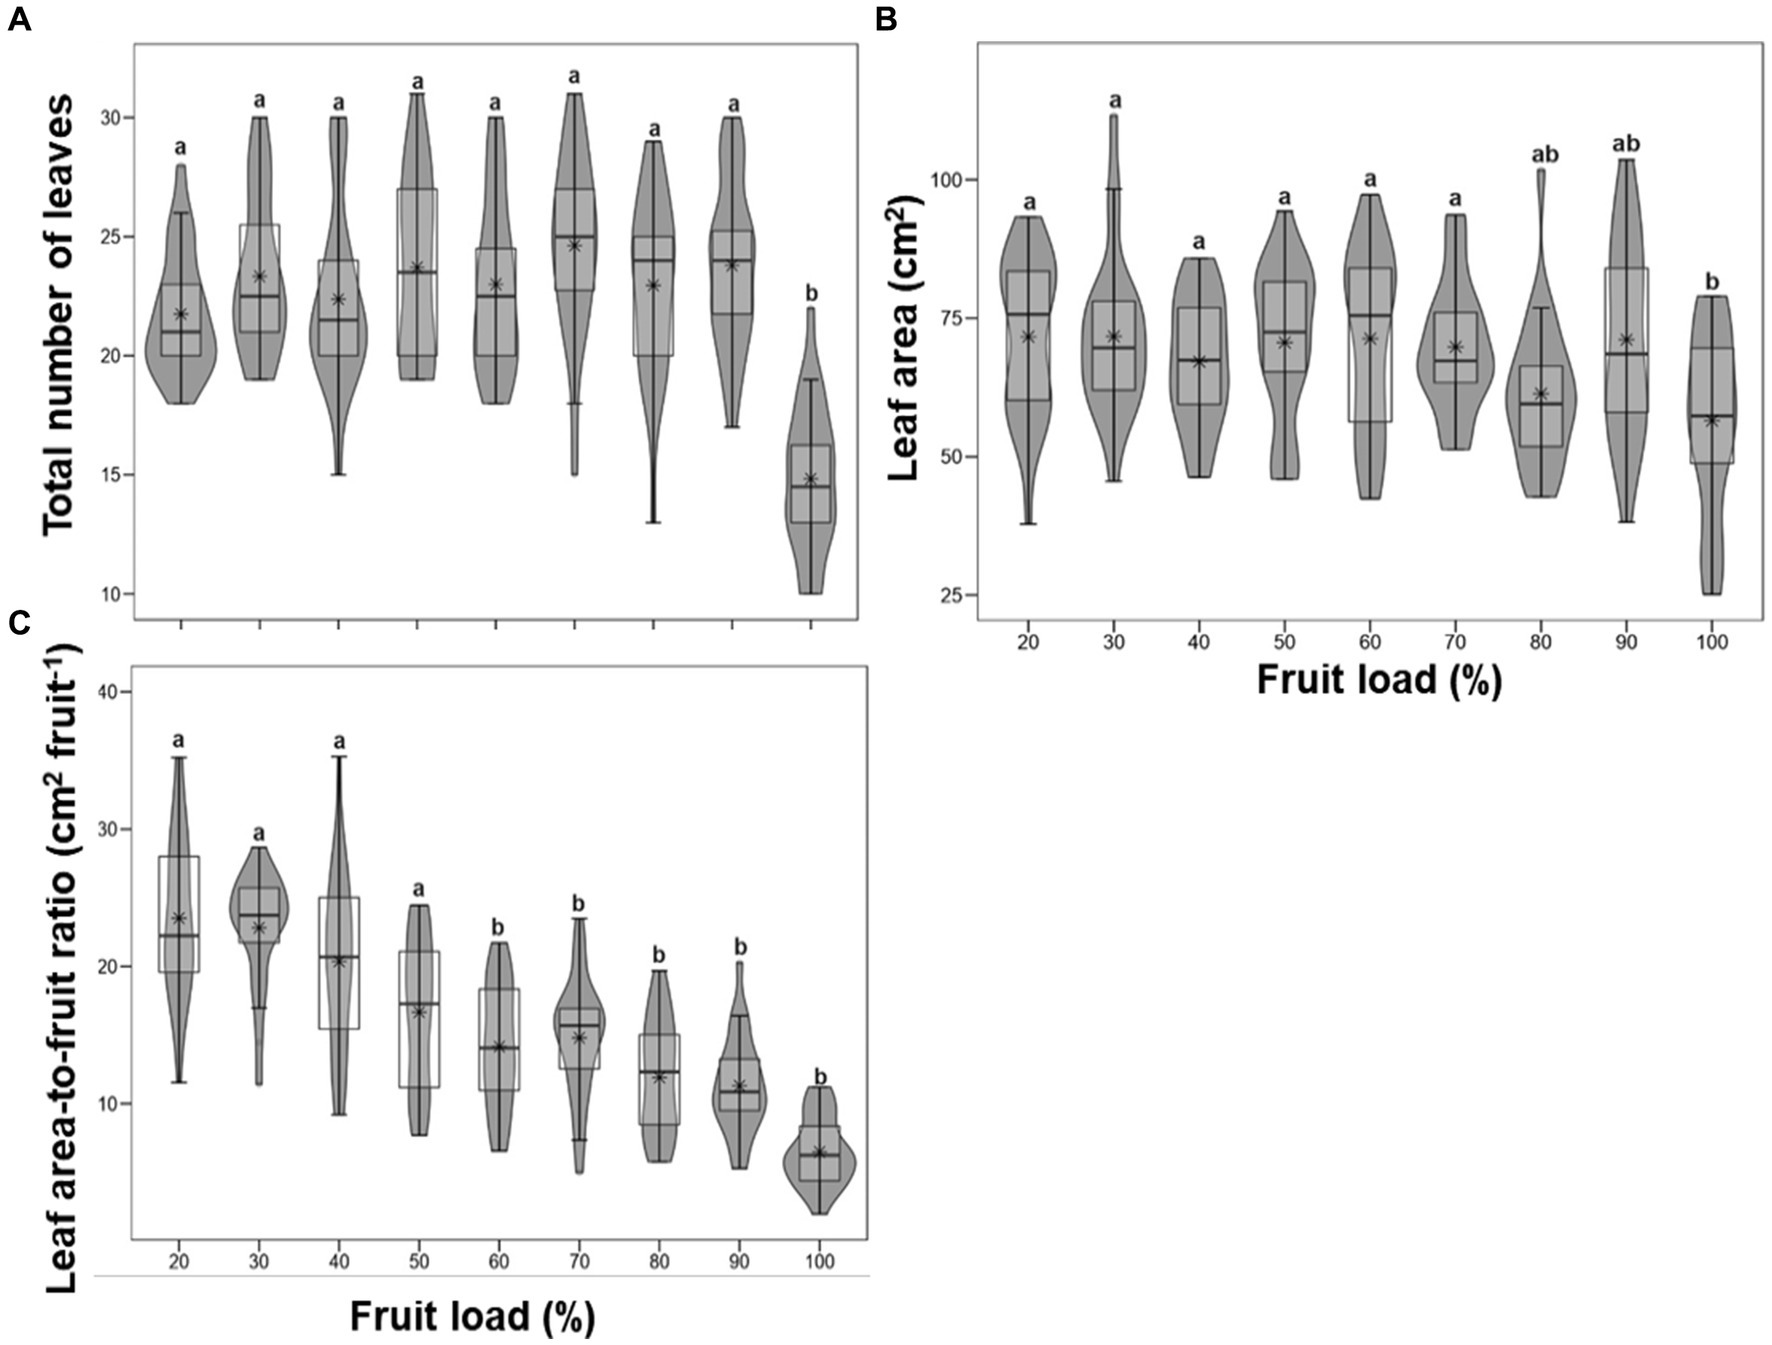
Figure 2. Effect of the fruit load on total number of leaves (A), leaf area (B) and leaf area-to-fruit ratio (C). Each asterisk represents the mean (n = 24). The different letters denote significant differences among treatments means according to the Tukey test (p < 0.05).
Regarding branch growth, average values of 0.52 mm d−1 were recorded at 195 DFD. However, the adjusted regression shows an inverse linear relationship depending on the fruit load, which suggests that, as the number of fruits on the trees increases, there is a delay in the growth of branch length, particularly in trees with fruit loads of 90 and 100%. This delay is reflected in the average growth rate of 0.40 mm d−1 (Figure 3). This inverse relationship suggests that, although both branches and fruits are sink organs, the fruits may have a greater capacity to import photoassimilates.
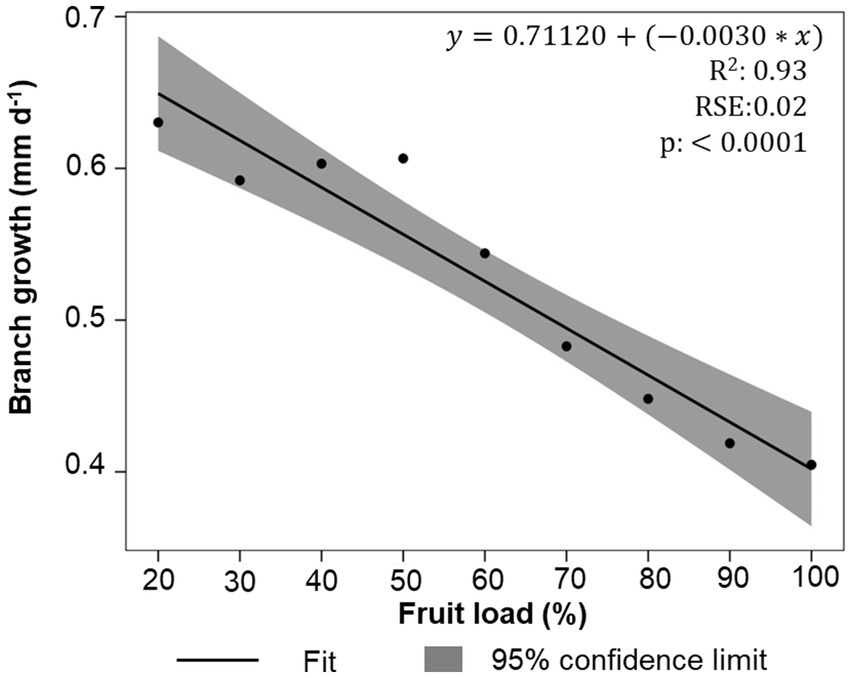
Figure 3. Fit of linear model of the growth in plagiotropic branches length as a function of the fruit load. Values are reported as means (n = 4). R2, coefficient of determination; RSE, residual standard error.
3.2 Changes on shoot dry mass accumulation by fruit load
Modifications in the TDM partition per branch were recorded in coffee trees in response to fruit load, mainly in the dry mass assigned to leaves and fruits. The lowest fruit loads (20, 30, and 40%) presented the greatest accumulation of dry mass in the leaves, estimated at around 24% on average, with significant differences (p < 0.001) for high loads of 90 and 100%, whose partition dry mass for leaves was on average 13%. Consequently, the greatest accumulation of fruit mass (66% on average) was recorded in trees with 100% fruit load, with statistical differences (p < 0.001) to the lower loads of 20, 30, and 40%, where 52% of the dry mass was from these organs. Regarding the branch dry mass, there were no significant statistical differences between fruit loads (Figure 4).
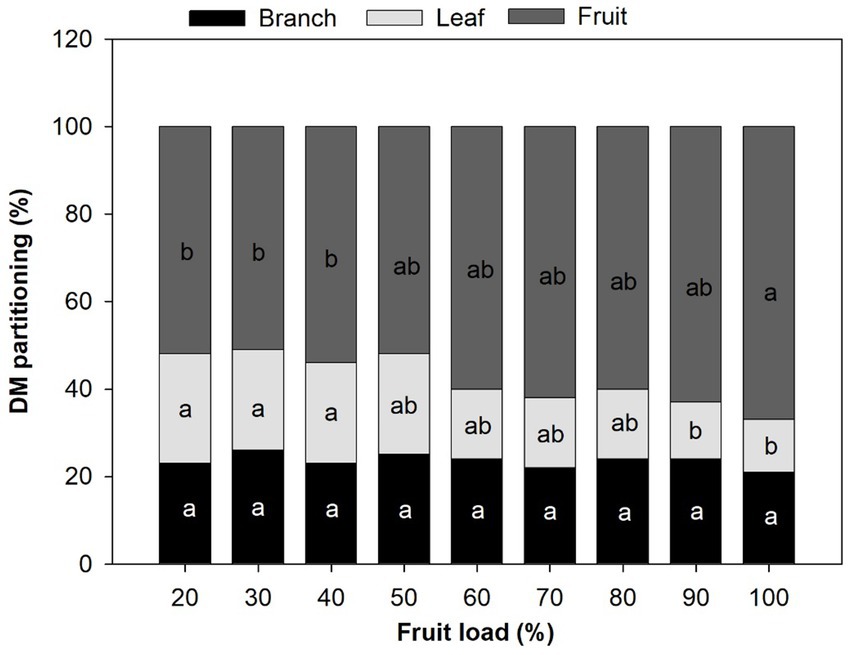
Figure 4. Effect of the fruit load on dry mass partitioning per branch. Each bar chart summarizes the mean (n = 12). The different letters denote significant differences among treatments means according to the Tukey test (p < 0.05).
The results described above demonstrate that the increase in fruit load is linked to a greater accumulation of mass in the fruits, and this modifies the TDM, as observed in Table 1, where the greatest accumulation of TDM (63.60 g on average) and significant differences (p < 0.004) are detected between the fruit loads of 80% and the load of 20% (44.90 g). The opposite occurred with LAR, where greater magnitude and statistical differences (p < 0.001) were reported for the fruit load of 20% compared to the high load of 100%, with decreases of 20% for this growth measure. The SLA, which establishes the balance of the total leaf area and the dry mass of the leaves per branch, recorded the highest values with significant statistical differences (p < 0.0007) for the fruit loads of 90 and 100% compared to the lower loads of 20, 30, and 40%, with lower SLA (Table 1). This result indicates that trees with high fruit loads of 90 and 100% had a lower proportion between leaf area and leaf mass, as mentioned above.
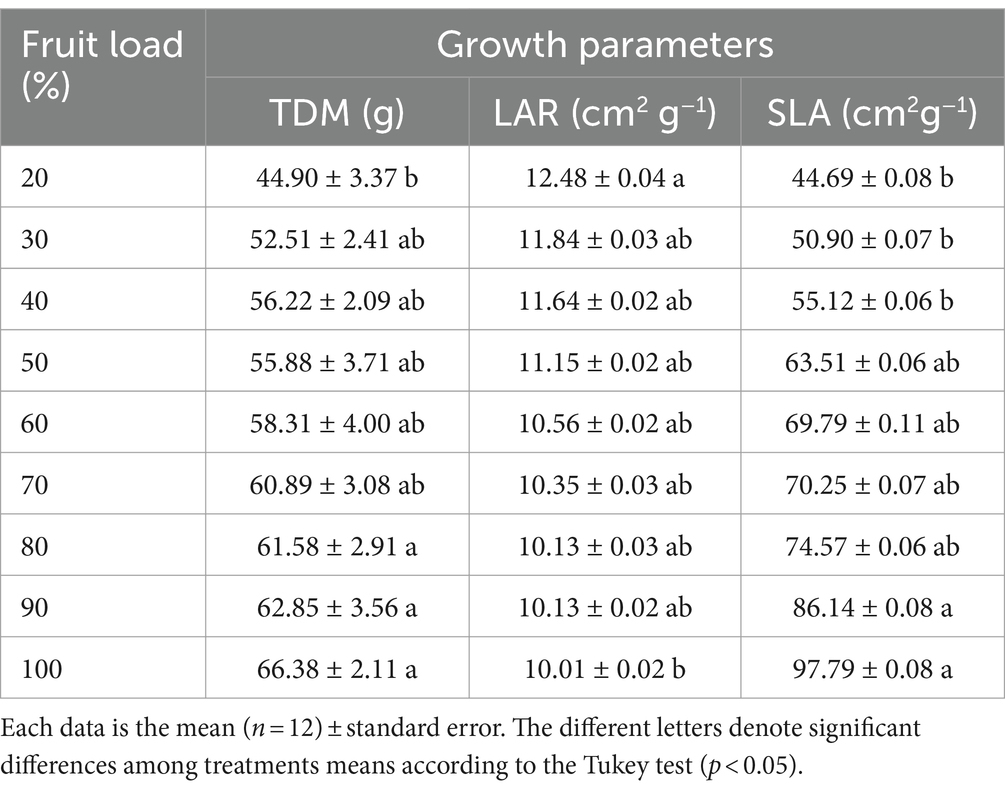
Table 1. Effect of the fruit load on total dry mass per branch-TDM, leaf area ratio-LAR and specific leaf area-SLA.
In general, there is a direct association between the growth measures FMR, LMR, BMR, TDM, LAR, and SLA with the different fruit load intensities. Indeed, it is confirmed that the FMR has a high, negative, and significant correlation with the LMR and BMR measures, and this same relationship is reported between LMR, BMR, and TDM. The opposite occurs for the TDM and FMR measures, where a positive and significant correlation was established. This same association was recorded between the LAR and LMR measurements. Finally, LAR has a high, negative, and significant correlation with TDM and FMR, and this same interaction is evident with SLA and LMR (Figure 5).
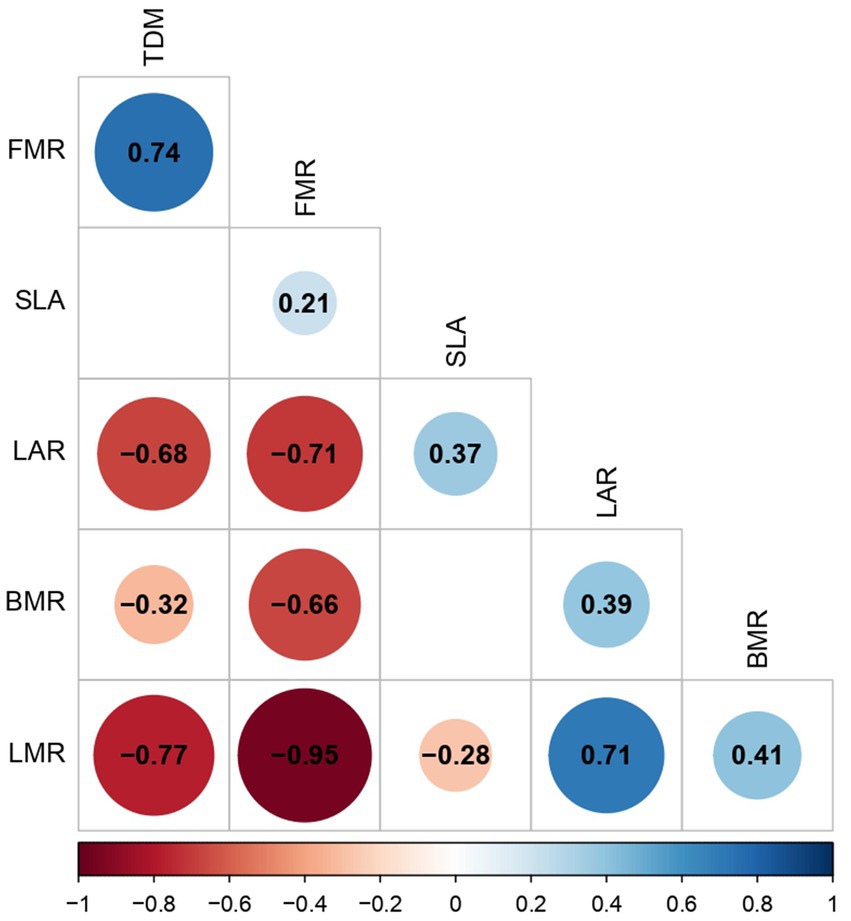
Figure 5. Pearson correlation analysis was calculated to evaluate the relationships between fruit load and measurements of accumulation of dry mass. Positive significant correlations (blue circles), negative significant correlations (red circles), and no correlation (white squares). Significant correlation: p < 0.05. BMR, branch mass ratio; FMR, fruit mass ratio; LAR, leaf area ratio; LMR, leaf mass ratio; SLA, specific leaf area; TDM, total dry mass.
3.3 Response of fruit load on physical and sensory attributes of the bean and coffee beverage
The fruit load had a significant effect on the physical characteristics of the beans, including the size distribution and quantity of healthy beans (Figure 6). For the 20% fruit load, 90% of the beans were classified as large with statistical difference (p < 0.040), compared to the 100% fruit load, in which 82% of the beans were classified as large. The percentage of healthy beans was consistent with the earlier findings, as the 20 and 30% fruit loads had averages of 82% healthy beans, while the 100% fruit load had an average of 74% healthy beans. The opposite was evident for the beans medium size, where the 100% fruit load recorded the highest proportion (16%), with significant differences (p < 0.016) to the 20, 30, and 40% fruit loads, which had an average of 9%. Meanwhile, for the small size, there were no statistical differences between the different fruit loads, with an average distribution of around 10% (Figure 6).
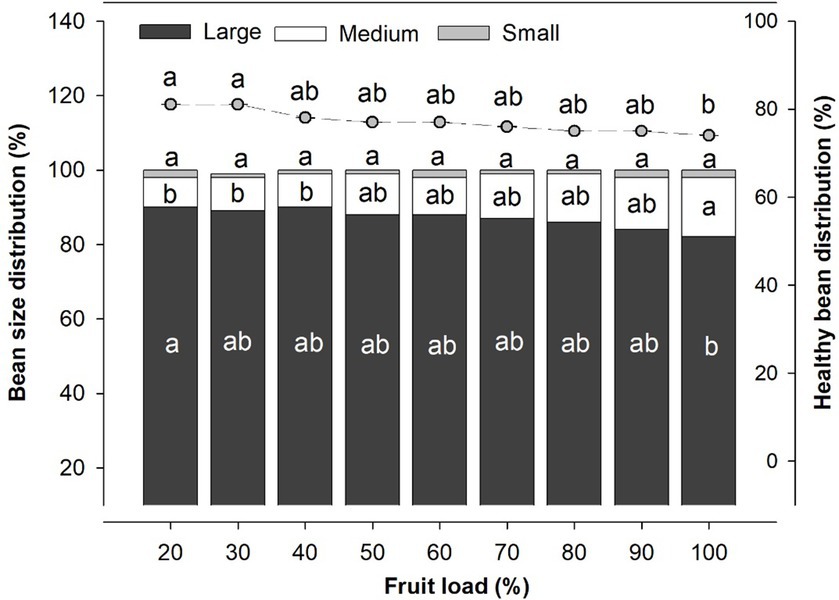
Figure 6. Physical attributes of the coffee bean in response at the varying fruit loads. Stacked bar chart correspond at the percentage of bean size distribution and the points represent the data of healthy beans. The bean size were categorized into three groups based on their size: large (beans retained in sieves number 18 and 17), medium (beans retained in sieves number 16 and 15), and small (beans retained in sieves number 14, 13, and 12). Each bar chart and the points summarizes the mean (n = 6). Vertical bar correspond at standard error. The different letters denote significant differences among treatments means according to the Tukey test (p < 0.05).
Table 2 shows the results of the sensory attributes determined with the different fruit loads. The results show that the fruit load did not have a significant effect on any of the five sensory attributes evaluated, nor on the final cup quality score of the coffee beverage. An average final cup quality score of 80.50 was recorded, and the following values were reported for the sensory attributes: aroma/fragrance 7.33, flavor 7.16, acidity 7.17, body 7.24, and balance 7.14.
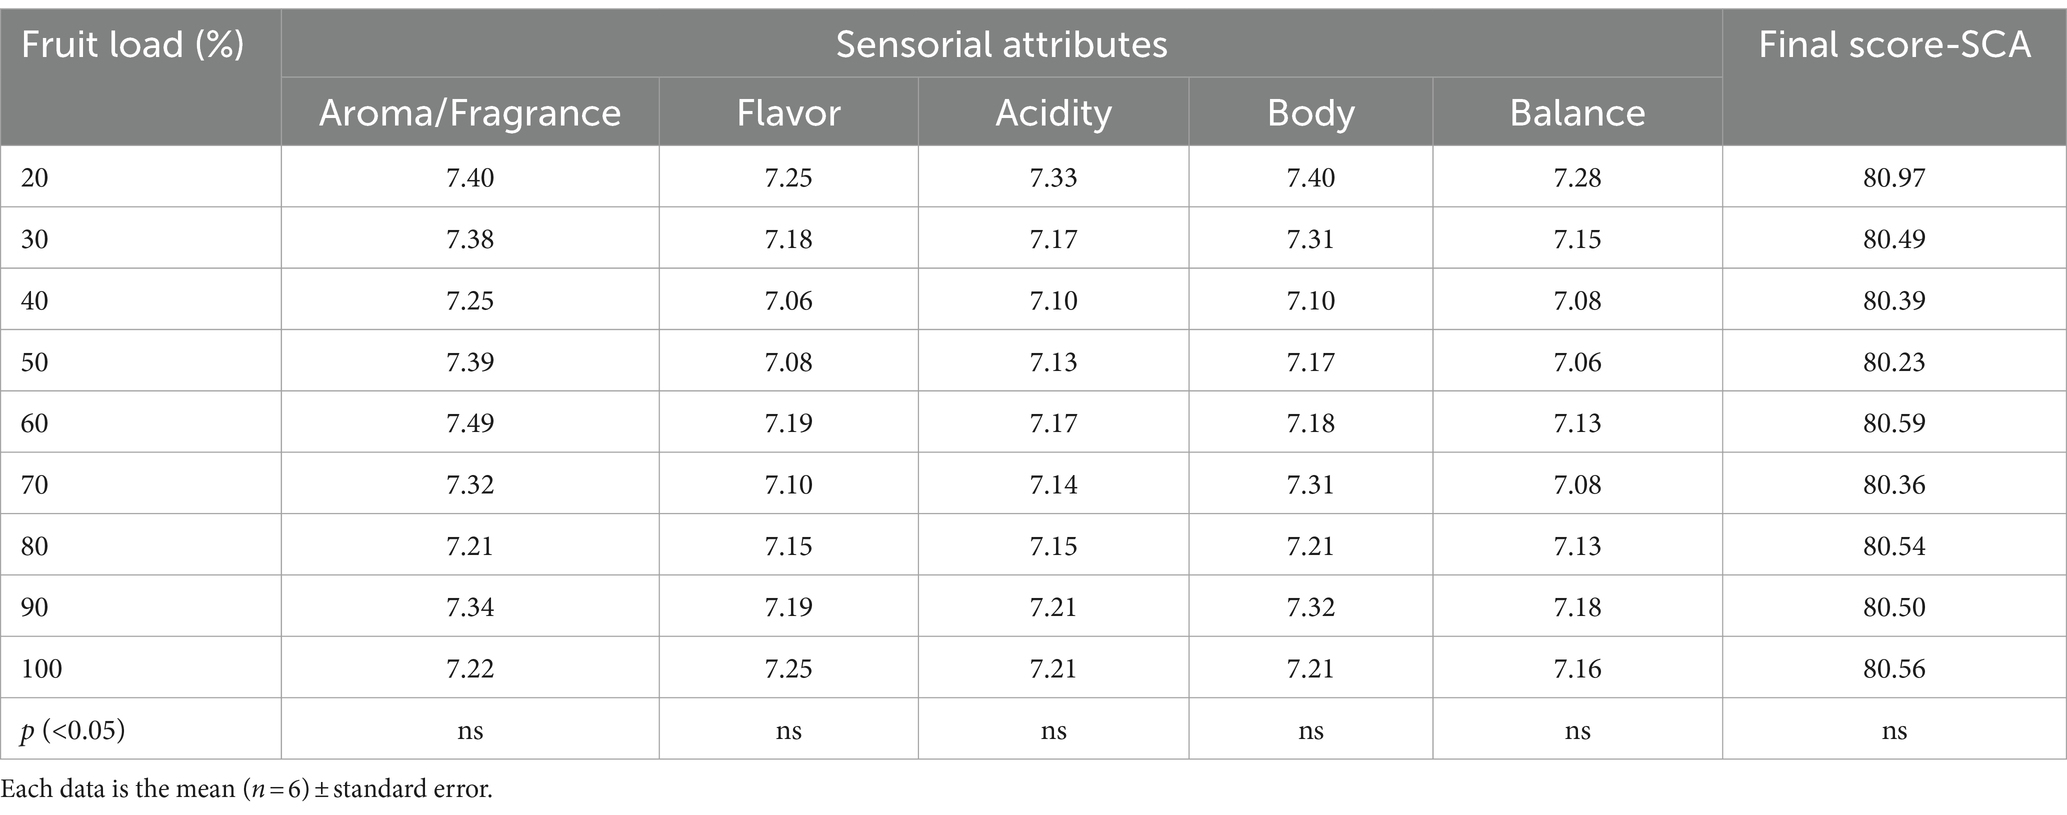
Table 2. Effect of the fruit load on sensorial attributes of the coffee beverage quality.
3.4 Effect of fruit load on crop yield and plant growth
The increase in fruit loading intensity did not alter the annual and cumulative patterns of total coffee cherry production. Significant differences (p < 0.027) and average gains of 8.4 kg plant−1 were demonstrated for the total accumulated production in the 100% fruit load compared to 20 and 30% fruit loads, for which 4.83 kg plant−1 was recorded. This same response was observed for annual production, with increases and statistical differences (p < 0.0005) between the fruit load of 100% for the year 2022 (4.07 kg plant−1 on average) and the fruit loads for the same year of less than 60%, where an average value of 2.40 kg plant−1 was recorded. The opposite occurred in 2023, when the fruit load did not have a significant effect on total production. The average production was 3.37 kg plant−1, although the response of slight increases was maintained as the fruit load increased from 60% (Figure 7).
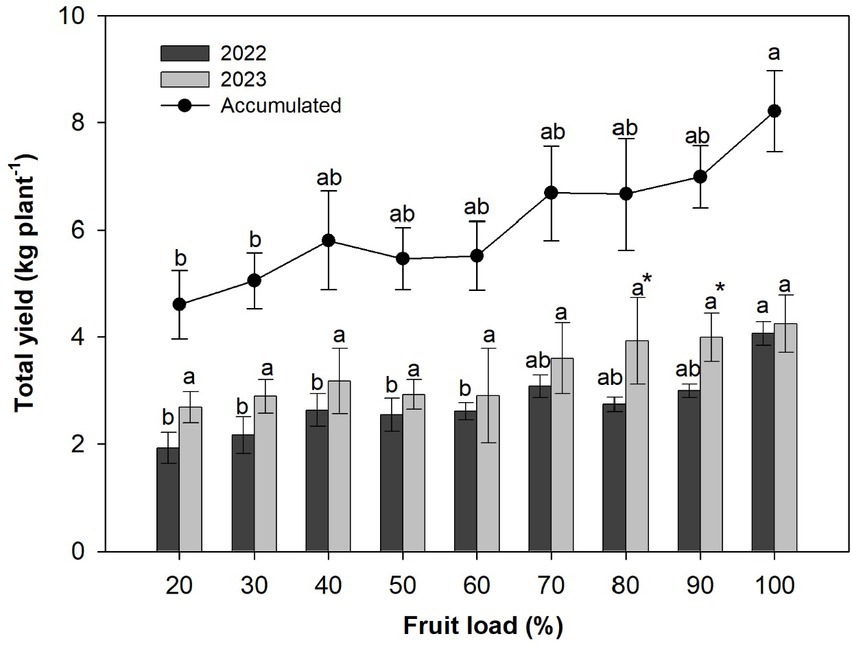
Figure 7. Total production of coffee cherries per plant in relation with fruit load. Bar chart correspond at the annual production for 2022 (dark color) and 2023 (light color). The points represent the accumulated production. Each bar chart and the points summarizes the mean (n = 6). Vertical bar correspond at standard error. The different letters denote significant differences among treatments means for each years, according to the Tukey test (p < 0.05). The asterisks represent significant difference among years for each treatments, according to the t-student test (p < 0.05).
Regarding the comparisons of production between the years, significant increases and differences (p < 0.010) were only recorded in 2023 for fruit loads of 80 and 90% compared to those recorded in 2022 (Figure 7). On the other hand, Figure 8 shows the data analyzed by PCA of the accumulated coffee cherry production and growth variables influenced by fruit loads. The first and second components explain around 85% of the accumulated variability of the data. The analysis revealed that TNL (13.40%), LA (13.23%), LAFR (12.59%), FMR (11.77%), and LMR (11.60%) were the key variables that explained the PC1 variability, encompassing a significant portion of the foliar measurements. The variables BMR (48%) and TDM (34%) explain the PC2 variability and group the dry mass accumulation measurements (Supplementary Figure S3).
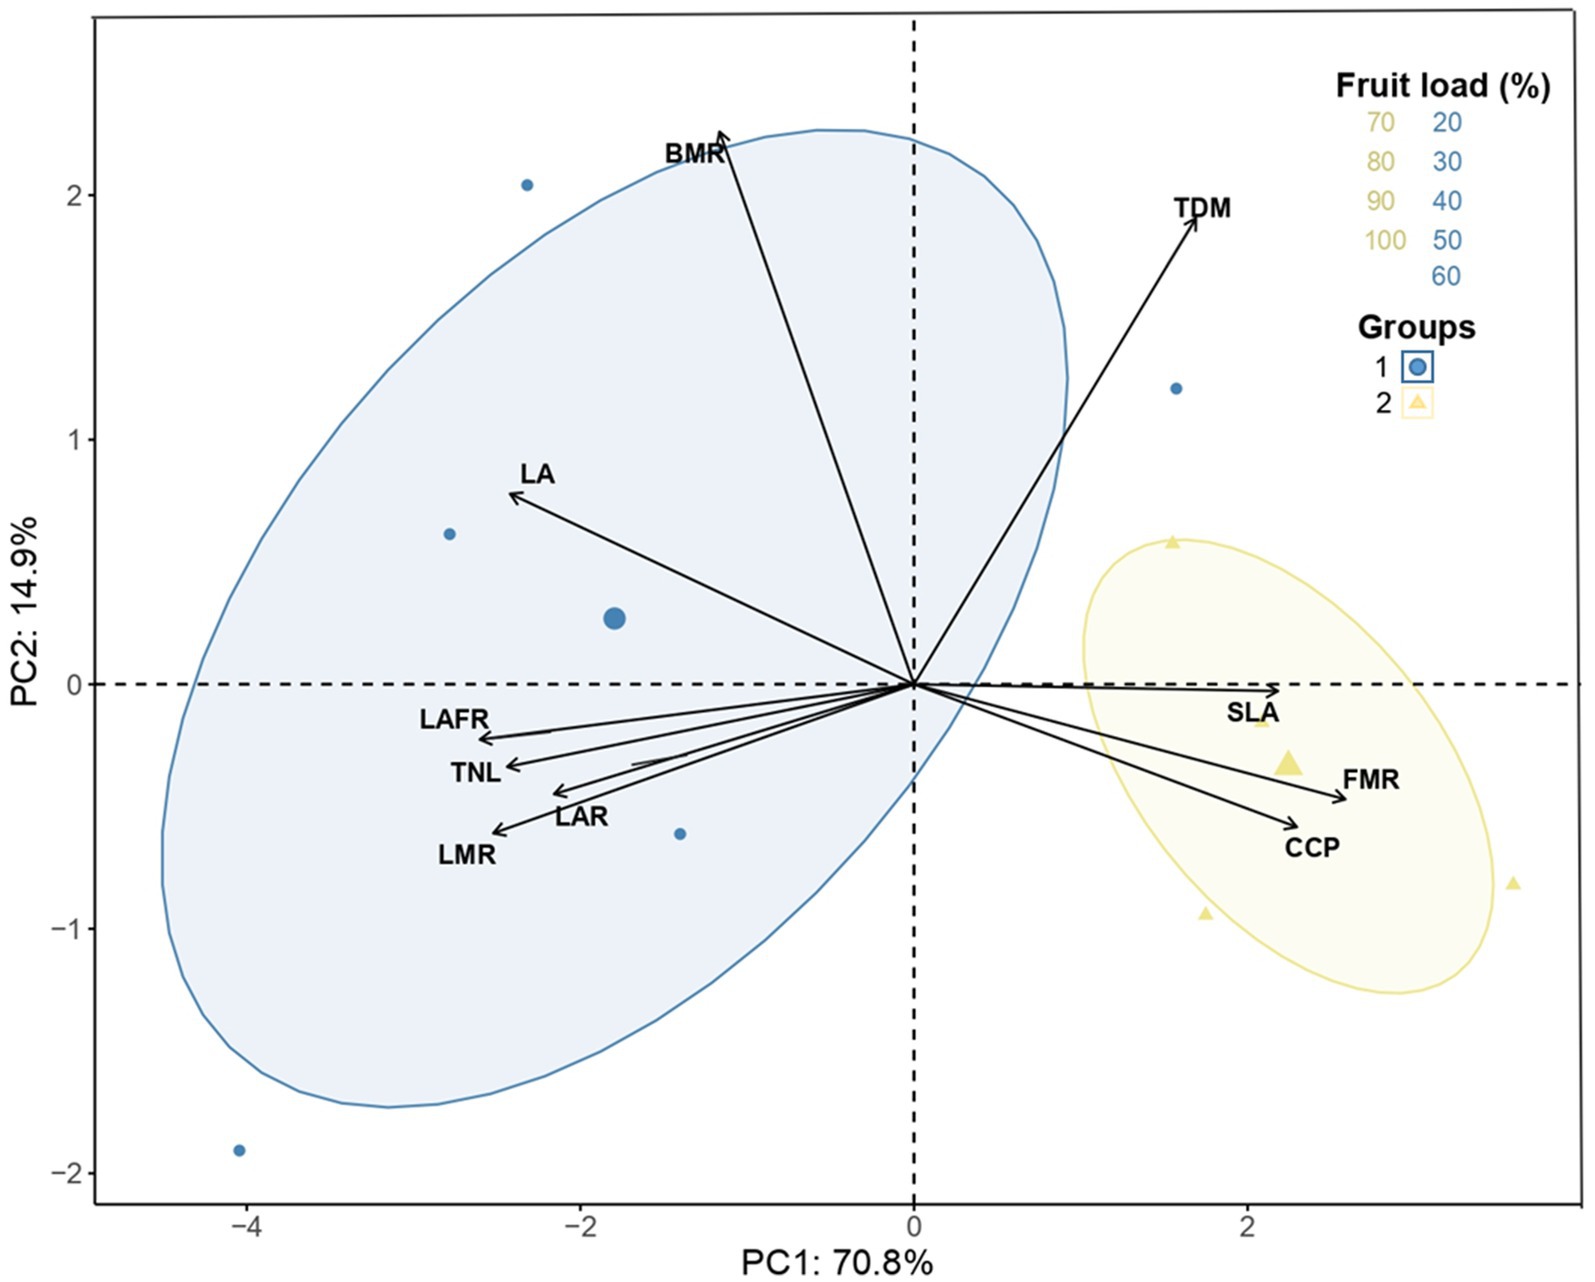
Figure 8. Principal component analysis (PCA) and grouped among accumulated production, fruit load and growth measures in relation with the first (PC1) and second (PC2) component. BMR, branch mass ratio; FMR, fruit mass ratio; LA, Leaf area; LAR, Leaf area ratio; LAFR, Leaf area-to-fruit ratio; LMR, Leaf mass ratio; CCP, Cumulative Coffee Production; SLA, specific leaf area; TDM, total dry mass; TNL, total number of leaves.
According to the confidence ellipses in the biplot, two groups were created according to the intensity of fruit load. The first group includes fruit loads of 20, 30, 40, 50, and 60%, while the second group includes fruit loads of 70, 80, 90, and 100%. In this way, the results support the negative correlation reported between vegetative vs. reproductive growth, where trees with high fruit load had a positive relationship with the CCP and FMR variables, and those with low fruit load with LAFR, LA, and TNL. The differentiation in accumulated coffee cherry production of trees with high fruit load compared to those with low fruit load was demonstrated, which explains why increases in fruit load above 70% in this study affected the growth of the plants without affecting coffee cherry production patterns (Figure 8).
4 Discussion
In our research, we evaluate the changes influenced by variations in the intensity of fruit load at the tree level on vegetative growth, dry mass accumulation, physical and sensory attributes of the coffee bean and beverage, as well as the response in crop yield. These results can serve as a guide to understanding the impact on the growth of coffee trees established in full-sun field conditions, particularly in years with high production during the crop production cycle (Flórez et al., 2016; Rendón, 2020). By manipulating the sink organs through varying fruit load intensities, it becomes apparent that fruits are dominant sinks with a high capacity for importing photoassimilates, especially when compared to other functional sink organs like expanding leaves and vegetative branches (Almeida et al., 2021; Toro-Herrera et al., 2023).
The changes in the growth of shoot vegetative organs with the different intensities of fruit loading evaluated in this study maintain a relationship with the days of fruit development-DFD (Figure 1; Supplementary Figure S2), as has been previously described by Castro and Marraccini (2006) and Ocampo et al. (2010). In the linear phase of fruit growth (from 105 to 150 DFD), it has been reported that fruits require high amounts of carbohydrates and nutrients to meet the carbon needs required during the processes, compared to the slow growth phase. These carbohydrates are needed for expansion and cell elongation of the endosperm (Vaast et al., 2005; Ocampo et al., 2010; Chaves et al., 2012). Based on the above, the decline in both the total number of leaves and the leaf area during the linear phase of fruit growth (Supplementary Figure S2) indicates that there is a greater sink strength on the part of the fruits for the allocation of photoassimilates, which may come at the expense of vegetative growth (DaMatta et al., 2008; Bote and Vos, 2016). Likewise, the source-sink relationship, expressed indirectly with the leaf area-to-fruit ratio, was modified at 150 DFD for fruit loads greater than 50% (10.56 cm2 fruit−1 on average) compared to fruit loads less than 40% (19.62 cm2 fruit−1 on average) (Figure 1).
At 195 DFD, when coffee fruits reached physiological maturity (Arcila-Pulgarín et al., 2002), significant modifications were determined in all vegetative growth measurements in relation to fruit load (Figure 1; Supplementary Figure S2). Reductions and statistical differences in the growth of the total number of leaves, leaf area, and leaf area-to-fruit ratio with 100% fruit load (Figure 2) have been reported in previous studies of C. arabica plants (DaMatta et al., 2008; Bote and Vos, 2016; Unigarro et al., 2022). In fact, the leaf area ratio of 6.47 cm2 per fruit recorded at this time at 100% fruit load was similar to those determined by Vaast et al. (2005) and DaMatta et al. (2008). These studies suggest an imbalance between the source and sink organs in coffee trees. It was also evident that, with high fruit loads, branch growth is suppressed (Figure 3), with values less than 0.40 mm d−1, a result consistent with what was reported by Almeida et al. (2021). All these findings confirm that, in trees with high fruit load, competition between fruits and plagiotropic growth of vegetative organs leads to a decrease in the leaf area-to-fruit ratio below the standard 20 cm2 fruit−1 for C. arabica (DaMatta et al., 2008; Bote and Vos, 2016), which is linked to the response in reduction of shoot vegetative growth (Echeverria-Beirute et al., 2018; Rakocevic et al., 2020).
Modifications in dry mass partitioning and allocation patterns in trees with 100% fruit loads (Figure 4) have been previously reported by Cannell (1985) and Vaast et al. (2005). This study showed that the mass assigned to the fruits is twice the amount accumulated in the leaves and branches, which is consistent with the findings of Vaast et al. (2005). Also, the negative correlations found between the dry mass allocated to the fruits and the dry mass allocated to leaves (r = −0.96) and branches (r = −0.65) (Figure 5) confirm the inverse relationship reported between vegetative and reproductive growth (Rakocevic et al., 2020). Additionally, the findings suggest that coffee fruits are active sinks, which compete for the import of carbon and allocation of resources. Likewise, we found a positive correlation (r = 0.74) between the dry mass allocated to the fruits and the total dry mass (Figure 5), a result that explains the significant increases in the accumulation of total dry mass for the fruit loads greater than 80% (Table 1).
Significant alterations were demonstrated in the LAR and SLA growth measurements as a function of fruit load (Table 1). As expected, decreases were reported in the magnitude of leaf formation (Figure 2A) and, consequently, in leaves dry mass accumulation (Figure 4). This is linked to the negative correlation between the dry mass allocated to the fruits and LAR (r = −0.73) and a positive correlation with SLA (r = 0.55). Bote and Vos (2016) found that, as the fruit load increases in C. arabica coffee trees, there is a decrease in leaf dry weight and modifications in the SLA. The authors attributed these outcomes to the impact of fruits on the loss and delays in leaf formation. These findings highlight the need for further investigation and analysis because these measurements are associated with the ability to intercept solar radiation per unit of leaf area, which has a potential impact on plant photosynthetic efficiency (Taiz et al., 2015; Chang and Zhu, 2017).
In our study, we showed that the different fruit loads affected the size distribution of coffee beans (Figure 6). The lower ratio of larger beans for the fruit load of 100% confirms the intense competition among fruits for the distribution of photoassimilates, as previously reported by Vaast et al. (2006) and Cambou et al. (2021). While there were variations in the size distribution of medium and large beans across fruit loads, it is worth noting that there were no alterations in the proportion of small beans, which are considered of inferior quality and penalized with lower prices in the global market (Osorio et al., 2021; Cassamo et al., 2022). It was also corroborated that the magnitude of healthy beans statistically decreased in the 100% fruit load compared to 20 and 30% fruit loads (Figure 6). This result is associated with reports that high fruit load in coffee trees that can lead to fruit malformation due to beans being poorly or partially filled, resulting from intense competition among fruits for the translocation of carbohydrates during the accelerated growth phase (DaMatta et al., 2008; Chaves et al., 2012).
It was demonstrated in this study that the increase in fruit load did not alter the sensory attributes or the final score according to the SCA scale, which defines the quality of the coffee beverage (Table 2). This finding is relevant because it differs from the studies by Vaast et al. (2006), Läderach et al. (2011), and Bote and Vos (2016), which reported modifications in the sensory attributes of the coffee beverage influenced by the high fruit load. However, it is important to note that these studies were validated in agroforestry systems with coffee, and findings revealed that the amount of shade provided by trees plays a significant role in determining the sensory quality of coffee (Koutouleas et al., 2022). On the other hand, in full-sun established crops, alterations in the sensory attributes of coffee are typically linked to post-harvest processes, including the presence of specific amounts of immature fruit, bean drying and humidity levels, and variations in fermentation or roasting times (Sanz-Uribe et al., 2017; Osorio Pérez et al., 2022; Peñuela-Martínez et al., 2022).
The total crop yields, as well as the annual and cumulative patterns of coffee cherry production, were not affected by the high fruit load in this study, contrary to what was expected (Figure 7). At 100% fruit load, greater cumulative production was shown than with low fruit loads (20 and 30%). However, the 100% fruit load had a negative impact on the vegetative growth of the plants (Figure 8). Also, it is highlighted that the yield for the 100% fruit load is consistent with that reported for the variety used in this study (Flórez et al., 2016). The significance of these crop yield findings lies in the confirmation that the biennial effects previously noted in studies by Chaves et al. (2012) and Bote and Vos (2016) are not evident under the conditions of coffee cultivation in Colombia using the Cenicafé 1 variety. The reason for this may be that coffee fruits have own photosynthetic activity, which is believed can contribute around 12% to carbon requirements during the accelerated growth phase and to make up about 20% of the plant’s total photosynthetic area with a high fruit load (Vaast et al., 2005; Ocampo et al., 2010). Likewise, it has been confirmed that carbon reserves (structural and non-structural carbohydrates) are remobilized from other regions of the tree, such as the reserves stored in the stem of previous growing seasons, which can to provide assimilated for years of higher production in C. arabica trees (Cambou et al., 2021; Toro-Herrera, 2022).
The processes of photosynthetic activity and the stimuli for to remobilize assimilated from reserve organs, influenced by coffee fruits, could be a “survival” strategy promoted by C. arabica plants (Avila et al., 2020; Cambou et al., 2021). In particular, these mechanisms may be promoted to address the imbalance in the source-sink relationship reported in coffee plantations established in full-sun field conditions (Toro-Herrera, 2022). However, further studies are required to elucidate in detail these mechanisms and their contribution at ages or years where greater production or a representative increase in fruit load at the tree level is concentrated.
5 Conclusion
Taken together, the results of our study suggest that increased fruit loads on C. arabica “Cenicafé 1” variety trees modified the vegetative growth, dry mass partitioning, and physical quality of the beans. We have provided evidence to support the hypothesis that a high fruit load reduces the magnitude and speed of the plagiotropic growth of vegetative organs. However, our hypothesis regarding the alterations in the total production patterns of coffee cherries and sensory attributes of the coffee beverage was not corroborated. Therefore, increased fruit load for “Cenicafé 1” variety trees does not alter total crop yields and beverage quality. Finally, the negative correlation between elevated fruit load and vegetative growth was corroborated. Hence, we confirm that coffee fruits are highly competitive compared to other functional sink organs, such as expanding leaves and growing vegetative branches.
Data availability statement
The data analyzed in this study is subject to the following licenses/restrictions: N/A. Requests to access these datasets should be directed to ZmVsaXBlbGVvbmIyN0BnbWFpbC5jb20=.
Author contributions
AL-B: Conceptualization, Formal analysis, Funding acquisition, Investigation, Methodology, Project administration, Software, Supervision, Visualization, Writing – original draft, Writing – review & editing. JS: Conceptualization, Funding acquisition, Project administration, Supervision, Writing – review & editing, Writing – original draft. LQ: Conceptualization, Formal analysis, Software, Writing – review & editing, Writing – original draft. MT-H: Conceptualization, Formal analysis, Visualization, Writing – original draft, Writing – review & editing. CU: Conceptualization, Methodology, Writing – review & editing, Writing – original draft. VO: Conceptualization, Methodology, Writing – review & editing, Writing – original draft. HB-L: Conceptualization, Formal analysis, Methodology, Supervision, Writing – original draft, Writing – review & editing.
Funding
The author(s) declare financial support was received for the research, authorship, and/or publication of this article. This work was supported by the National Coffee Research Center (Cenicafé) (Crossref Funder ID 100019597), project FIT102035, funded by the Colombian Federation of Coffee Growers.
Acknowledgments
The authors would like to thank the Federación Nacional de Cafeteros de Colombia (FNC) and the National Coffee Research Center (Cenicafé) for funding this study. Thanks, Alexander Jaramillo Jiménez, Jenny Paola Pabon, Paola Andrea Calderon, and Jhon Felix Trejos, for your support for measurements and to Ninibeth Sarmiento for help with the climatic data.
Conflict of interest
The authors declare that the research was conducted in the absence of any commercial or financial relationships that could be construed as a potential conflict of interest.
Publisher’s note
All claims expressed in this article are solely those of the authors and do not necessarily represent those of their affiliated organizations, or those of the publisher, the editors and the reviewers. Any product that may be evaluated in this article, or claim that may be made by its manufacturer, is not guaranteed or endorsed by the publisher.
Supplementary material
The Supplementary material for this article can be found online at: https://www.frontiersin.org/articles/10.3389/fsufs.2024.1379207/full#supplementary-material
Abbreviations
BDM, branch dry mass; BMR, branch mass ratio; DFD, days of fruit development; ELA, estimated leaf area; FMR, fruit mass ratio; FDM, fruits dry mass; LA, leaf area; LAFR, leaf area-to-fruit ratio; LL, leaf length; LMR, leaf mass ratio; LW, leaf width; LAR, leaf-area ratio; LDM, leaves dry mass; CCP, cumulative coffee production; SLA, specific leaf area; TDM, total dry mass; TNL, total number of leaves.
References
Agroclima-Agroclimática cafetera. (2023). Website, Available at: https://agroclima.cenicafe.org/ (Accesed on December 12, 2023).
Almeida, W. L., Ávila, R. T., Pérez-Molina, J. P., Barbosa, M. L., Marçal, D. M. S., de Souza, R. P. B., et al. (2021). The interplay between irrigation and fruiting on branch growth and mortality, gas exchange and water relations of coffee trees. Tree Physiol. 41, 35–49. doi: 10.1093/treephys/tpaa116
Arcila, PJ, (2007). Crecimiento y desarrollo de la planta de café, Sistemas de producción de café en Colombia, ed. PJ Arcila, VF Farfan, BA Moreno, Salazar GLF, and GE Hincapié, (National Coffee Research Center-Cenicafé), 21–60
Arcila-Pulgarín, J., Buhr, L., Bleiholder, H., Hack, H., Meier, U., and Wicke, H. (2002). Application of the extended BBCH scale for the description of the growth stages of coffee (Coffea spp.). Ann. Appl. Biol. 141, 19–27. doi: 10.1111/j.1744-7348.2002.tb00191.x
Avila, R. T., Martins, S. C. V., Sanglard, L. M. V. P., dos Santos, M. S., Menezes-Silva, P. E., Detman, K. C., et al. (2020). Starch accumulation does not lead to feedback photosynthetic downregulation in girdled coffee branches under varying source-to-sink ratios. Trees 34, 1–16. doi: 10.1007/s00468-019-01893-8
Bote, A. D., and Vos, J. (2016). Branch growth dynamics, photosynthesis, yield and bean size distribution in response to fruit load manipulation in coffee trees. Trees 30, 1275–1285. doi: 10.1007/s00468-016-1365-x
Bote, A. D., and Vos, J. (2017). Tree management and environmental conditions affect coffee (Coffea arabica L.) bean quality. NJAS-Wageningen J. Life Sci. 83, 39–46. doi: 10.1016/j.njas.2017.09.002
Cambou, A., Thaler, P., Clément-Vidal, A., Barthès, B. G., Charbonnier, F., Van den Meersche, K., et al. (2021). Concurrent starch accumulation in stump and high fruit production in coffee (Coffea arabica). Tree Physiol. 41, 2308–2325. doi: 10.1093/treephys/tpab075
Cannell, M. G. (1985). Physiology of the coffee crop, Coffee: Botany, biochemistry and production of beans and beverage Clifford, Ed M. N (Springer US), 108–134
Cassamo, C. T., Mangueze, A. V. J., Leitão, A. E., Pais, I. P., Moreira, R., Campa, C., et al. (2022). Shade and altitude implications on the physical and chemical attributes of green coffee beans from Gorongosa Mountain. Mozambique. Agronomy. 12:2540. doi: 10.3390/agronomy12102540
Castro, R. D., and Marraccini, P. (2006). Cytology, biochemistry and molecular changes during coffee fruit development. Braz. J. Plant Physiol. 18, 175–199. doi: 10.1590/S1677-04202006000100013
Chang, T.-G., and Zhu, X.-G. (2017). Source–sink interaction: a century old concept under the light of modern molecular systems biology. J. Exp. Bot. 68, 4417–4431. doi: 10.1093/jxb/erx0002
Chaves, A. R. M., Martins, S. C. V., Batista, K. D., Celin, E. F., and DaMatta, F. M. (2012). Varying leaf-to-fruit ratios affect branch growth and dieback, with little to no effect on photosynthesis, carbohydrate or mineral pools, in different canopy positions of field-grown coffee trees. Environ. Exp. Bot. 77, 207–218. doi: 10.1016/j.envexpbot.2011.11.011
DaMatta, F. M. (2004). Ecophysiological constraints on the production of shaded and unshaded coffee: a review. Field Crop Res. 86, 99–114. doi: 10.1016/j.fcr.2003.09.001
DaMatta, F. M., Cunha, R. L., Antunes, W. C., Martins, S. C. V., Araujo, W. L., Fernie, A. R., et al. (2008). In field-grown coffee trees source–sink manipulation alters photosynthetic rates, independently of carbon metabolism, via alterations in stomatal function. New Phytol. 178, 348–357. doi: 10.1111/j.1469-8137.2008.02367.x
Development Core Team R (2019). R: A language and environment for statistical computing. Vienna, Austria: R Foundation for Statistical Computing.
Echeverria-Beirute, F., Murray, S. C., Klein, P., Kerth, C., Miller, R., and Bertrand, B. (2018). Rust and thinning management effect on cup quality and plant performance for two cultivars of Coffea arabica L. J. Agric. Food Chem. 66, 5281–5292. doi: 10.1021/acs.jafc.7b03180
Flórez, C. P., Maldonado, C. E., Cortina, H. A., Moncada, M. P., Montoya, E. C., Ibarra, L. N., et al. (2016). Cenicafé 1: Nueva variedad de porte bajo altamente productiva resistente a la roya y al CBD con mayor calidad física del grano. Avances Técnicos Cenicafé. 469, 1–8. doi: 10.38141/10779/0469b
González-Osorio, H., Sadeghian, S., Medina, R., and Furia, L. (2023). Response of granulated polyhalite on yield and quality of coffee (Coffea arabica). Commun. Soil Sci. Plant Anal. 54, 1525–1536. doi: 10.1080/00103624.2023.2171051
Kassambara, A., and Mundt, F. (2020). Factoextra: Extract and visualize the results of multivariate data analyses. Available at: https://CRAN.R-project.org/package=factoextra.R package version 1.0.7.
Koutouleas, A., Sarzynski, T., Bordeaux, M., Bosselmann, A. S., Campa, C., Etienne, H., et al. (2022). Shaded-coffee: a nature-based strategy for coffee production under climate change? A review. Front. Sustain. Food Syst. 6:877476. doi: 10.3389/fsufs.2022.877476
Läderach, P., Oberthür, T., Cook, S., Estrada Iza, M., Pohlan, J. A., Fisher, M., et al. (2011). Systematic agronomic farm management for improved coffee quality. Field Crop Res. 120, 321–329. doi: 10.1016/j.fcr.2010.10.006
León-Burgos, A. F., Ramírez, C., Sáenz, J. R. R., Imbachi-Quinchua, L. C., Unigarro-Muñoz, C. A., and Balaguera-López, H. E. (2022). Fitting growth curves of coffee plants in the nursery stage of growth: a functional approach. Agronomía Colombiana 40, 344–353. doi: 10.15446/agron.colomb.v40n3.101333
Maldonado, C. E., and Giraldo, L. Á. (2020). Resistencia genética a la enfermedad de la cereza del café en variedades cultivadas en Colombia. Revista Cenicafé. 71, 68–90. doi: 10.38141/10778/1121
Mendiburu, F. (2023). Agricolae: statistical procedures for agricultural research. Available at: https://CRAN.R-project.org/package=agricolae. R package version 1, 3–7
National Coffee Research Center-Cenicafé. (2021). Guía más agronomía, más productividad, más calidad (ed.3a). Cenicafé
Ocampo, A., Riaño, H., López, R., and López, F. (2010). Intercambio de dióxido de carbono y cambios bioquímicos del pericarpio durante el desarrollo del fruto del cafeto. Revista Cenicafé. 61, 327–343. doi: 10.38141/rev.cenicafe61-4
Osorio, V., Pabón, J., Calderón, P. A., and Imbachi, L. C. (2021). Calidad física, sensorial y composición química del café cultivado en el departamento del Huila. Revista Cenicafé 72:e72201. doi: 10.38141/10778/72201
Osorio Pérez, V., Álvarez-Barreto, C. I., Matallana, L. G., Acuña, J. R., Echeverri, L. F., and Imbachí, L. C. (2022). Effect of prolonged fermentations of coffee mucilage with different stages of maturity on the quality and chemical composition of the bean. Fermentation 8:519. doi: 10.3390/fermentation8100519
Osorio Pérez, V., Matallana Pérez, L. G., Fernandez-Alduenda, M. R., Alvarez Barreto, C. I., Gallego Agudelo, C. P., and Montoya Restrepo, E. C. (2023). Chemical composition and sensory quality of coffee fruits at different stages of maturity. Agronomy 13:341. doi: 10.3390/agronomy13020341
Peñuela-Martínez, A. E., Sanz-Uribe, J. R., Guerrero, A., and Ramírez, C. A. (2022). Siete prácticas en el beneficio para obtener café de buena calidad - Proceso 7P®. Avances Técnicos Cenicafé. 546, 1–8. doi: 10.38141/10779/0546
Rakocevic, M., Braga, K. S. M., Batista, E. R., Maia, A. H. N., Scholz, M. B. S., and Filizola, H. F. (2020). The vegetative growth assists to reproductive responses of Arabic coffee trees in a long-term FACE experiment. Plant Growth Regul. 91, 305–316. doi: 10.1007/s10725-020-00607-2
Rendón, S. J. R. (2020). Administración de sistemas de producción de café a libre exposición solar, in Manejo Agronómico de los Sistemas de Producción de Café, ed. National Coffee Research Center, 34–71. doi: 10.38141/10791/0002_2
Sanz-Uribe, J. R., Yusianto, Menon, Peñuela, A., Oliveros, C., Husson, J., Brandon, C., et al., (2017). Postharvest processing-revealing the green bean, The craft and science of coffee, B. Folmer (Elsevier), 51–76
Taiz, L., Zeiger, E., Maller, I A., and Murphy, A. (2015). Plant physiology and development. 6th edition. Massachusetts, USA. Sinauer Associates Inc Publisher. 692
Toro-Herrera, M. A. (2022). Source-sink patterns on coffee trees related to annual climate variability: An approach through isotopes, carbohydrates, and spectral analysis (Doctoral dissertation). (Minas Gerais): Universidade Federal de Lavras.
Toro-Herrera, M. A., Pennacchi, J. P., Vieira, D. A., Costa, V. E., Honda Filho, C. P., Barbosa, A. C. M. C., et al. (2023). Source-sink patterns on coffee trees related to annual climate variability: an approach through stable isotopes analysis. Ann. Appl. Biol. 184, 183–195. doi: 10.1111/aab.12872
Unigarro, M., Bejarano, L. M. D., and Acuña, J. R. (2022). Effect of fruit load of the first coffee harvests on leaf gas exchange. Pesquisa Agropecuária Tropical. 51:e69865. doi: 10.1590/1983-40632021v5169865
Unigarro-Muñoz, C. A., Hernández-Arredondo, J. D., Montoya-Restrepo, E. C., Medina-Rivera, R. D., Ibarra-Ruales, L. N., Carmona-González, C. Y., et al. (2015). Estimation of leaf area in coffee leaves (Coffea arabica L.) of the Castillo® variety. Bragantia 74, 412–416. doi: 10.1590/1678-4499.0026
Vaast, P., Angrand, J., Franck, N., Dauzat, J., and Génard, M. (2005). Fruit load and branch ring-barking affect carbon allocation and photosynthesis of leaf and fruit of Coffea arabica in the field. Tree Physiol. 25, 753–760. doi: 10.1093/treephys/25.6.753
Vaast, P., Bertrand, B., Perriot, J.-J., Guyot, B., and Génard, M. (2006). Fruit thinning and shade improve bean characteristics and beverage quality of coffee (Coffea arabica L.) under optimal conditions. J. Sci. Food Agric. 86, 197–204. doi: 10.1002/jsfa.2338
Wei, T, and Simko, V. (2021). R package ‘corrplot’: visualization of a correlation matrix. Available at: https://github.com/taiyun/corrplot. R package version 0.92.
Keywords: bean size, Coffea arabica L, crop yield, dry mass accumulation, leaf area-to-fruit ratio, sensorial attribute
Citation: León-Burgos AF, Sáenz JRR, Quinchua LCI, Toro-Herrera MA, Unigarro CA, Osorio V and Balaguera-López HE (2024) Increased fruit load influences vegetative growth, dry mass partitioning, and bean quality attributes in full-sun coffee cultivation. Front. Sustain. Food Syst. 8:1379207. doi: 10.3389/fsufs.2024.1379207
Edited by:
Fábio Luiz Partelli, Federal University of Espirito Santo, BrazilReviewed by:
Benoit Bertrand, Institut National de la Recherche Agronomique (INRA), FranceWillian Dos Santos Gomes, Federal University of Espirito Santo, Brazil
Copyright © 2024 León-Burgos, Sáenz, Quinchua, Toro-Herrera, Unigarro, Osorio and Balaguera-López. This is an open-access article distributed under the terms of the Creative Commons Attribution License (CC BY). The use, distribution or reproduction in other forums is permitted, provided the original author(s) and the copyright owner(s) are credited and that the original publication in this journal is cited, in accordance with accepted academic practice. No use, distribution or reproduction is permitted which does not comply with these terms.
*Correspondence: Helber Enrique Balaguera-López, aGViYWxhZ3VlcmFsQHVuYWwuZWR1LmNv; Andrés Felipe León-Burgos, ZmVsaXBlbGVvbmIyN2dtYWlsLmNvbQ==