- 1School of Economics, Nanjing University of Finance and Economics, Nanjing, Jiangsu, China
- 2State Key Laboratory of Earth Surface Processes and Resource Ecology (ESPRE), Beijing Normal University, Beijing, China
- 3School of Natural Resources, Faculty of Geographical Science, Beijing Normal University, Beijing, China
- 4School of Economics and Management, Nanchang Hangkong University, Nanchang, Jiangxi, China
Introduction: The ecological and environmental pollution problem at the source of agriculture cannot be ignored, and the manifestation of the fertilizer reduction effect of pro-environmentally agricultural technologies (PEATs) will help motivate farmers to adopt technology, thereby promoting sustainable agricultural development.
Methods: From the dual perspectives of farmers’ perception and behavior effects, this paper uses 607 survey data of Chinese farmers, and an endogenous switching regression model is employed to identify the influencing factors of farmers’ adoption of PEATs and manifest its fertilizer reduction effect.
Results and discussion: The results of the perception survey show that the farmers’ recognition of the fertilizer reduction effect of PEATs is not high, and the technical effect needs to be further demonstrated. Moreover, the estimated results suggest that PEATs can significantly reduce the fertilizer application of farmers. Specifically, if farmers who have adopted PEATs do not adopt them, they will apply more chemical fertilizers, the farmers who have not adopted PEATs will use less chemical fertilizer if they do. Overall, the main influencing factors for farmers adopting PEATs include education level, government officials, cultivated land area, soil fertility, information access channels, and the distance of home-agricultural technology station. This study aims to provide empirical evidence for the formulation of strategies and plans to promote sustainable agricultural development.
1 Introduction
There is a consensus that chemical fertilizers play an important role in addressing global hunger and malnutrition, achieving increased production and income for farmers, and effectively ensuring food security (Erisman et al., 2008; Guo et al., 2022; Schulte-Uebbing et al., 2022), especially for developing countries (Wang et al., 2018; Shahzad et al., 2019; Lin et al., 2022). For example, fertilizer contributes over 40% of China’ s crop yields growth, making it possible for China to feed 22% of the world’s population with 9% of the world’s cultivated land (Huang et al., 2010; Lu et al., 2015; Hu et al., 2019). Nevertheless, the excessive and uncontrolled use of chemical fertilizers has led to serious environmental problems, such as non-point source pollution, water pollution, soil quality degradation, greenhouse gas emissions (Trimpler et al., 2016; Wang et al., 2018; Guo et al., 2022; Anik et al., 2023). As the world’s largest consumer of chemical fertilizers, China’s use of agricultural chemical fertilizer application increased from 8.84 million tons to 50.79 million tons between 1978 and 2023 (National Bureau of Statistics of China (NBSC), 2023), with fertilizer application intensity far exceeding international standards (Guo et al., 2022). Furthermore, the chemical fertilizer utilization rate for major food crops was only 40.2%, lower than in the EU and other developed countries. Therefore, how to reduce fertilizer application requires more policy intervention and empirical study.
In order to address the adverse effects of excessive use of chemical fertilizers, a global consensus has been reached on promoting sustainable agricultural development strategies (Shahzad et al., 2019; Schulte-Uebbing et al., 2022; Zhou et al., 2023). In view of this, policy-and technology-led solutions are designed to reduce fertilizer use. On the one hand, subsidies and tax tools are used to advocate for farmers to reduce fertilization, while laws and regulations are designed to regulate and restrict the use of fertilizer to farmers (Brady, 2003; Wang et al., 2018; Lin et al., 2022). In such cases, in 2015, China released a detailed document entitled “action plan for zero-growth in fertilizer use by 2020” (see Jin and Zhou, 2018). On the other hand, some PEATs dedicated to improving soil fertility and improving fertilizer utilization efficiency have been developed and promoted by relevant departments and institutions (Egodawatta et al., 2012; Jordan-Meille et al., 2012; Kuang et al., 2023).
It is worth noting that the implementation of policies and technical solutions to reduce fertilizers application cannot be separated from farmers. As the user of cultivated land, farmers are also the decision-making subject of chemical fertilizer reduction, and play an important role in promoting the sustainable development of agriculture (Bopp et al., 2019; Lai et al., 2020; Kuang et al., 2023). In China, lots of work and effort have been put into promoting PEATs, but the actual promotion effect is not satisfactory. Specifically, farmers still follow the “heavy utilization, light protection” approach to cultivated land utilization, and the actual adoption rate of PEATs is not high (Lai et al., 2020; Kuang et al., 2023; Qing et al., 2023), even stay at the cognitive level of “whether they have heard of it” (Liu et al., 2019; Rust et al., 2021). Undoubtedly, this goes against the original intention of designing a plan to reduce fertilizer use. So, what exactly is the reason that inhibits farmers from adopting PEATs?
After reviewing previous studies, we found that existing studies mainly reveal the reasons why farmers are unwilling to adopt PEAT from two aspects. For one thing, the transformation of farmers from the traditional agricultural production mode to the sustainable agriculture is a complex behavioral decision-making process (Baumgart-Getz et al., 2012; Ward et al., 2018; Kuang et al., 2023), which is influenced by multi-dimensional factors (Burton, 2014; Wang et al., 2018; Pham et al., 2022). However, existing studies do not agree on the influence mechanism of PEATs adoption, and even have opposite results. For another thing, farmers do not agree that PEATs are effective, and even have doubts about this (Abdallah et al., 2021).
Therefore, the potential contribution of this article lies in answering the question of whether adopting PEATs can reduce chemical fertilizer application from the perspectives of farmer perception and behavioral adoption. Furthermore, an endogenous switching regression model that can solve the problems of sample selection and endogeneity is employed for unbiased estimation, revealing the impact mechanism of PEATs adoption by farmers.
2 Methodology
2.1 Study area
The Poyang Lake Plain is mainly distributed in the northern part of Jiangxi Province, China, located at 27°32′-30°06′ N and 115°01′-117°34′ E. The Poyang Lake Plain is formed by the impact of the Poyang Lake water body, covering a land area of 38760.6 km2, accounting for 23.2% of Jiangxi Province, while the cultivated land area accounts for 37.3% of Jiangxi Province. The humid subtropical monsoon climate brings abundant rainfall and sufficient heat and light, convenient irrigation resources and long farming culture create favorable agricultural development conditions for the region, which also brings wealth to the local farmers (Kuang et al., 2023). The Poyang Lake Plain has always been a major grain producing area in Jiangxi Province and one of the important rice producing areas in China (Li et al., 2012). The rice planting area in this region accounts for more than half of the total crop planting area in Jiangxi Province, and 86% of the grain crop planting area in Jiangxi Province is concentrated here (Kuang et al., 2023).
2.2 Sampling procedure
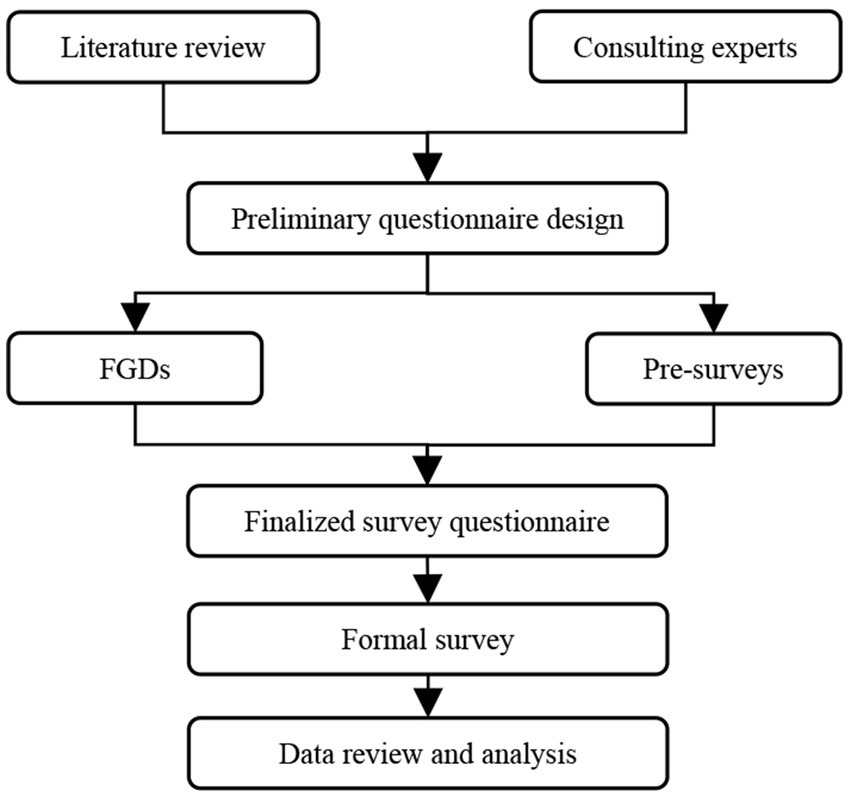
The sampling procedure was carried out in accordance with the four stages shown in Figure 1. The first stage, the preliminary questionnaire was designed. After literature review and expert consultation, we designed the preliminary survey questionnaire. In the second stage, the final survey questionnaire was determined. In October 2020, 50 farmers in Poyang County were selected to test the preliminary questionnaire. Local government officials and villagers were invited to participate in the focus group discussion (FGDs). After FGDs and pre-survey, the preliminary questionnaire was modified and improved, and the final survey questionnaire was determined. The third stage, a formal survey is conducted. In December 2020, we organized a field survey of farmers in the Poyang Lake Plain. The fourth stage, data review and analysis was carried out. We conducted a logical relationship check on the collected survey data, eliminating incomplete and contradictory questionnaire data, and the valid data was used for subsequent analysis.
In field investigation, the method of combining simple random sampling and stratified random sampling is used to obtain the survey data of farmers. Specifically, based on the results of advanced grain production counties in China and Jiangxi Province from 2004 to 2014,1 we preferentially selected six Counties around the Poyang Lake as sample points. Moreover, township population, size, and geographical location were considered as a sampling basis, and 2 sample townships were selected from each county. Then, 3 sample villages were randomly selected from each township, 15–20 farmers in each selected village were randomly invited to participate in the questionnaire. As mentioned above, we conducted this survey in October 2020 and distributed 630 questionnaires. After reviewing the questionnaire data, we finally obtained 607 valid farmer survey data.
2.3 Econometric model
This study will explore deeply from the perspectives of farmers’ perception and behavior adoption. Therefore, the fertilizer application of the farmers was selected as a focus variable, and the following models were constructed.
In Eq. (1), where represents the amount of chemical fertilizer applied by farmers in planting rice; indicates the influencing factors of chemical fertilizer application (e.g., personal, household and cultivated land resource characteristics); is set as the production decision of whether farmers adopt PEATs, indicates that farmers have adopted PEATs, and indicates that farmers have not adopted PEATs; and are the corresponding estimated coefficients; is the random error term.
If the decision of farmers adopting PEATs is exogenous, then can accurately assess the impact of PEATs. However, farmers’ adoption behavior decision-making of PEATs is also affected by factors (e.g., personal, household and cultivated land resource characteristics), making farmers’ PEATs adoption behavior not entirely exogenous, leading to the existence of self selection problems in the model. If the problem of sample self selection is ignored and the ordinary least square method (OLS) is continued for estimation, it will easily lead to biased estimation (Lokshin and Sajaia, 2004; Kuang et al., 2023).
Due to the fact that deciding whether to adopt PEATs is a self choice made by farmers after analyzing expected benefits, there are some unobservable factors such as personal preferences and management skills of farmers, which simultaneously affect their adoption behavior and the level of behavioral effects. In other words, there is a problem of sample self selection. Therefore, we cannot consider the decision variable PEAT in model (1) as an exogenous variable. If the problem of sample self selection is ignored, model (1) uses the least squares method (OLS) to estimate, and the estimated results of the model will be biased. After reviewing existing literature, many scholars have used propensity score matching (PSM) to solve the problem of selectivity bias. However, this method cannot solve the endogeneity problem of omitted variables caused by unobservable factors. In addition, some scholars have attempted to use instrumental variable method (IV) to estimate, but this method did not consider the heterogeneity of treatment effects. Many scholars use the endogenous switching regression (ESR) model to explore the behavioral effects of farmers. Besides inheriting the advantages of the propensity score matching (PSM) method and instrumental variable method, ESR model also has its unique advantages. Specifically, it not only addresses the sample selectivity bias and endogenous problems resulting from both observable and unobservable factors, but also corrects the setting bias or missing variables in the equation by introducing inverse Mills ratio coefficients (Lokshin and Sajaia, 2004; Ma and Abdulai, 2016). Furthermore, the full information maximum likelihood estimation is employed to implement counterfactual analysis, which will ameliorate the problem of models missing valid information (Khanal et al., 2018). ESR model includes the following equations:
Behavioral response equation of farmers to PEATs:
Behavioral effect equation of farmers not adopted PEATs:
Behavioral effect equation of farmers adopted PEATs:
In Eqs. (2–4), where indicates the influencing factor of farmers’ response to PEATs; represents identification variable; and represent the behavioral effects of farmers who did not adopt and adopt PEATs, respectively; and are the influencing factors of behavioral effects; , , , are the corresponding coefficients to be estimated; , , are the random standard error terms for each equation.
Based on the construction of the counterfactual analysis framework, the average treatment effect of the behavioral effect of farmers adopting PEATs in both the real and counterfactual scenarios was estimated.
Farmers without adopting PEATs (observed):
Farmers with adopting PEATs (observed):
Farmers without adopting PEATs (counterfactual):
Farmers with adopting PEATs (counterfactual):
Thus, Eqs 5, 7 were employed to derive the average treatment results for the fertilizer reduction effects of farmers who did not adopt PEATs (ATU), the calculated equation is shown in Eq. (9).
Similarly, Eqs 6, 8 were used to estimate the average treatment results for the fertilizer reduction effects of farmers who did adopt PEATs (ATT), the calculated equation is shown in Eq. (10).
2.4 Selection of variables
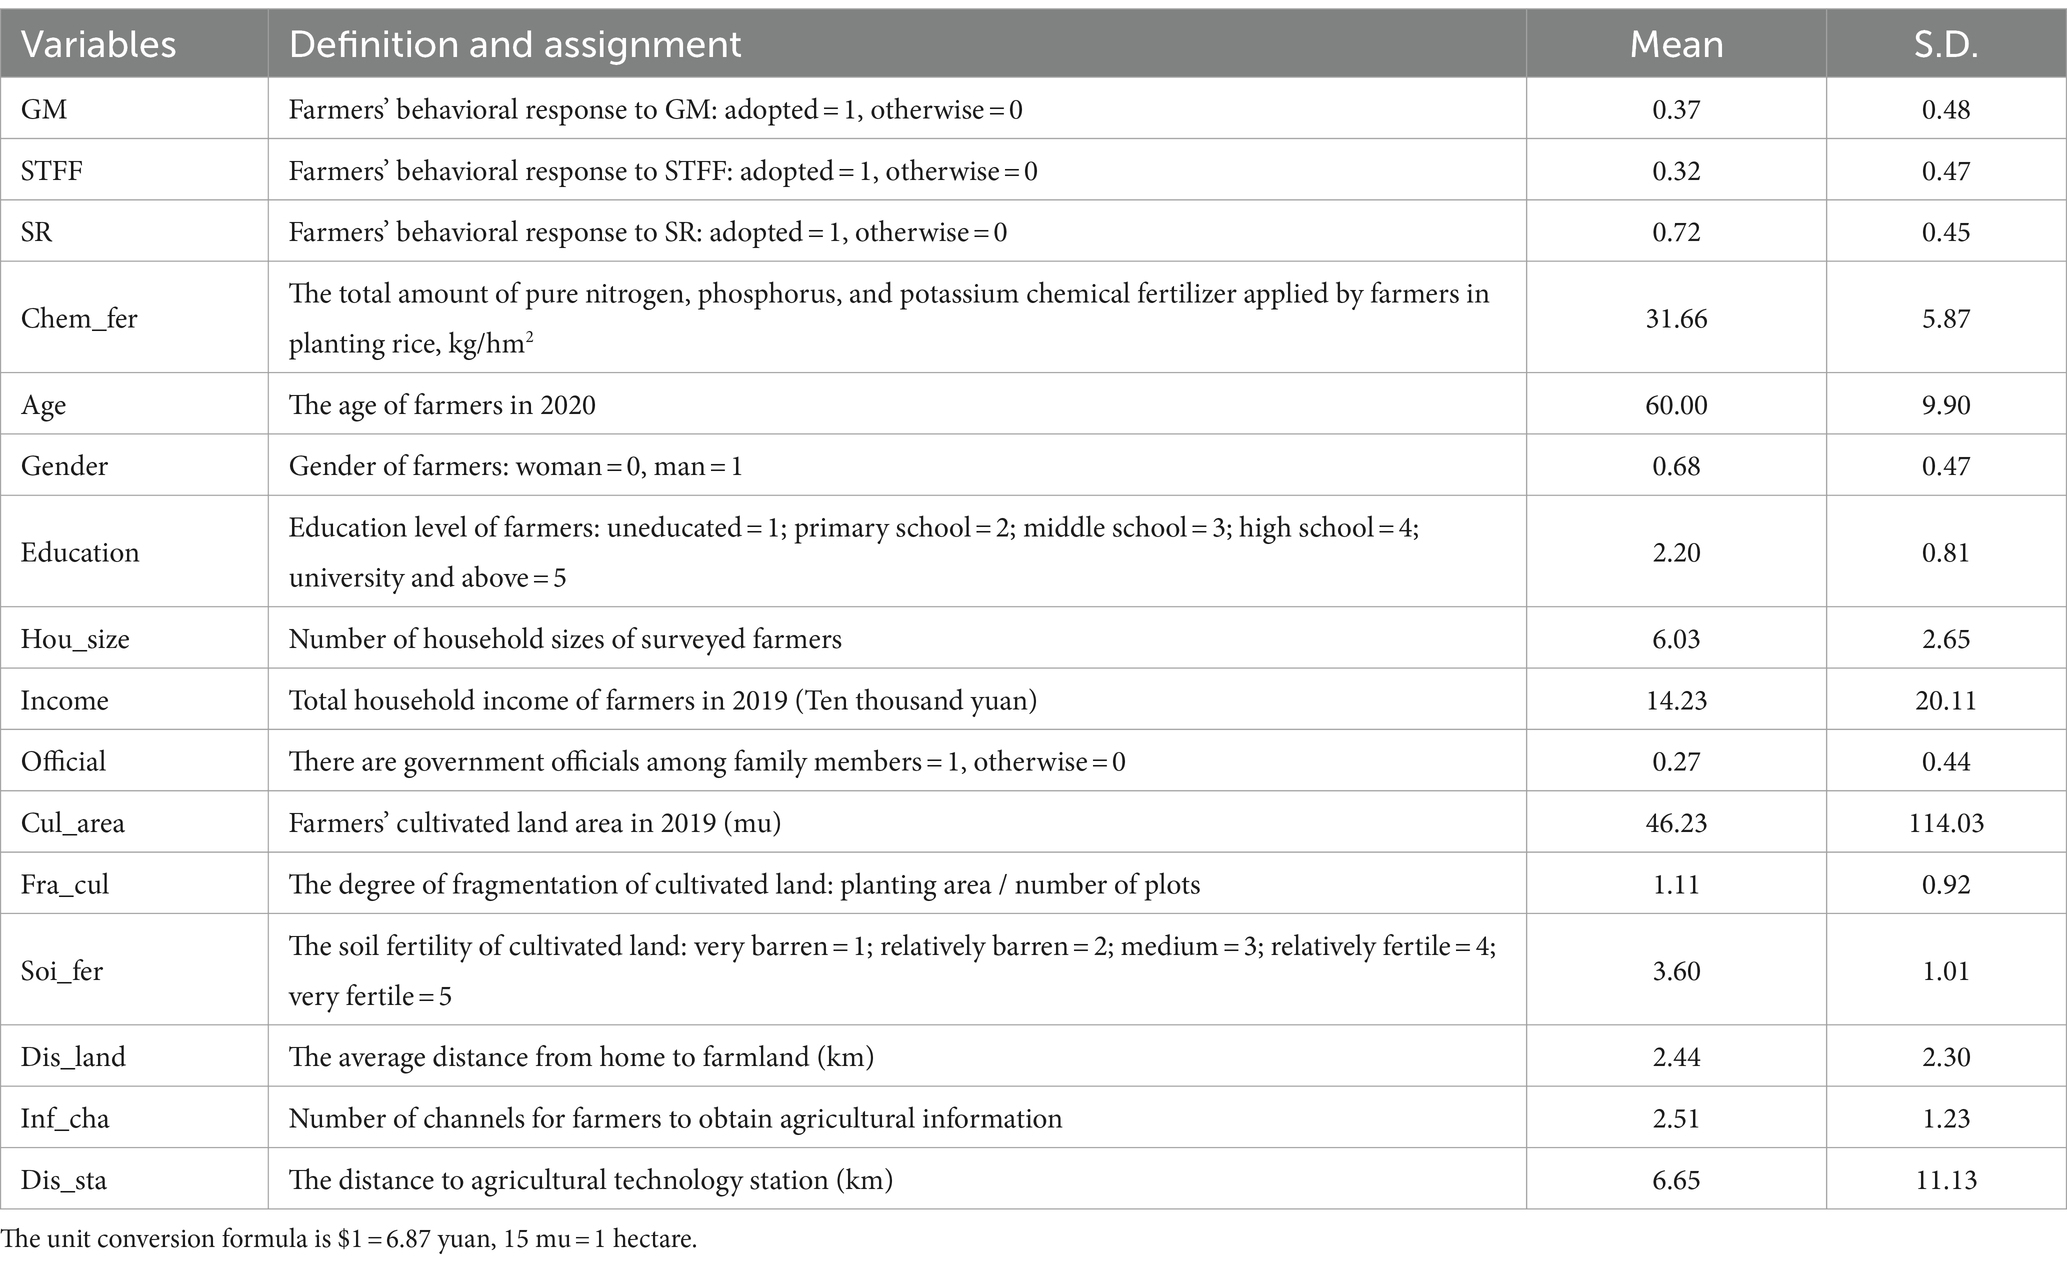
Dependent variable. Given that it is not possible for farmers to apply only single element fertilizers (e.g., Nitrogen, Phosphorus and Potassium fertilizer) when planting rice, exploring only single element fertilizers often masks the true effect of PEATs in reducing chemical fertilizer application. Therefore, the amount of pure chemical fertilization was set as the explanatory variable.
Key independent variables. PEATs are a generic term that includes multiple types of agricultural technologies, and farmers may also adopt more than one of these agricultural technologies. Learning from the processing method of Kuang et al. (2023), this study will focus on three production stages of growing rice (before, during and postpartum), and select a PEATs commonly used by farmers in each production stage. Therefore, three kinds of PEATs, namely green manure (GM), soil testing and formula fertilization (STFF) and straw returning to field (SR), were set as the key independent variables.
Control variables. According to existing studies (Khonje et al., 2018; Wossen et al., 2019; Xie and Huang, 2021; Kuang et al., 2023), this study selected 3–4 control variables from three aspects: personal characteristics, family characteristics, and farm characteristics of the surveyed farmers. Specifically, age, gender, education (personal characteristics), population, income, government officials (family characteristics), cultivated land area, cultivated land fragmentation, soil fertility, and cultivation distance (farm characteristics) were set as control variables.
Identification variables. “Information acquisition channels” and “the distance to agricultural technology station” are set as identification variables. The reason is that information channels such as agricultural technology stations are the main sources for farmers to receive the latest agricultural information, especially for new agricultural technologies such as PEATs. In other words, these two identification variables have a direct and important impact on farmers’ adoption of PEATs. Moreover, the commuting distance from home to the agricultural technology stations is objectively exists, and the impact on fertilizer application is weak. The variable setting and descriptive statistical results were shown in Table 1.
3 Results
3.1 Farmers’ perceived benefits of PEATs
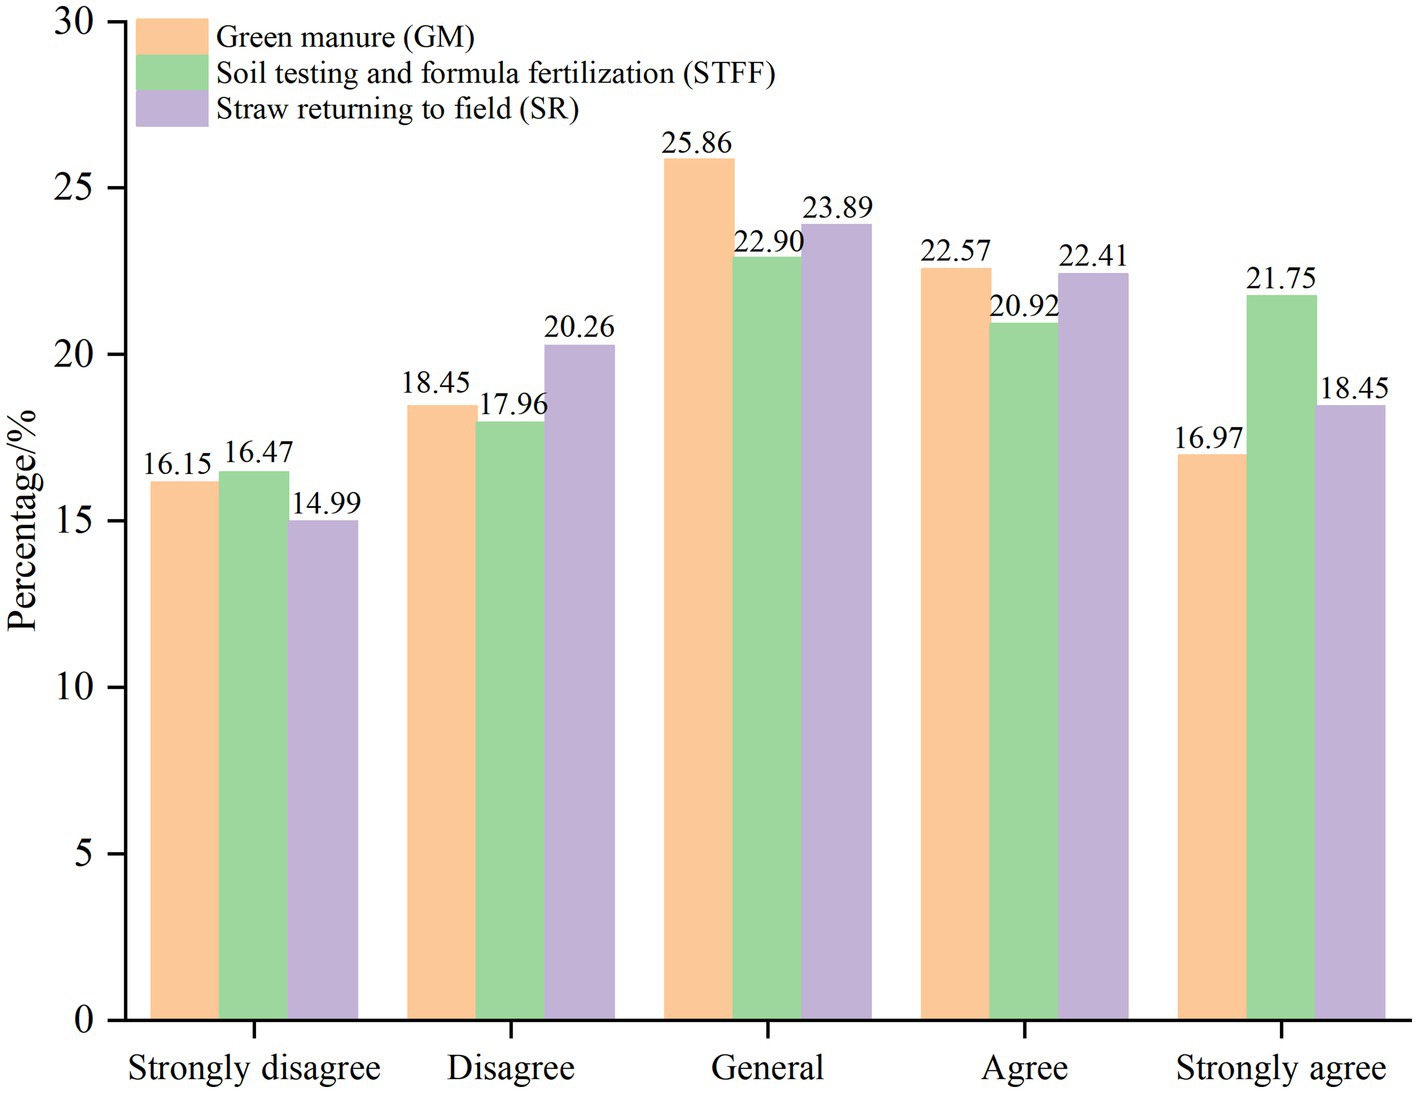
Each interviewed farmer was asked to evaluate the fertilizer reduction effects of three types of PEATs separately, and an evaluation option with five levels of agreement was designed. As shown in Figure 2, farmers feel that the proportion of GM in reducing fertilizer application is not obvious (including “disagree” and “strongly disagree,” similarly hereinafter), general, and obvious (including “agree” and “strongly agree,” similarly hereinafter) is 34.60, 25.86, and 39.54%, respectively. Moreover, 34.43% of farmers believe that STFF has a poor effect on reducing chemical fertilizer application, 42.67% of farmers believe that the effect is good, and 22.90% of farmers still believe that the effect is general. Similarly, farmers believe that the proportion of SR in reducing fertilizer application is not obvious, general, and obvious is 35.25, 23.89, and 40.86%, respectively. Overall, about 40% of farmers believe that PEATs can significantly reduce fertilizer usage, while the proportion of those who consider the effect to be average and insignificant is about 25 and 35%, respectively.
3.2 Difference test of fertilizer application among rice farmers
According to the statistical results of fertilizer application of rice farmers, overall, the pure amount of chemical fertilizer applied by most rice farmers is 25 ~ 40 kg/mu, with a small number of farmers applying less than 25 kg/mu, while a large number of farmers applying more than 40 kg/mu, or even more than 60 kg/mu. Table 2 presents the statistical results of mean difference in chemical fertilizer application under different adoption scenarios. The chemica fertilizer application level of farmers who did not adopt PEATs was significantly higher than the sample average. According to the T-test results of independent samples, farmers who adopted different types or degrees of PEATs can reduce the application of nitrogen, phosphorus, and potassium fertilizers. However, the results in Table 2 do not infer that PEATs have an impact on fertilizer application. The influence of observable factors (such as the personal, family and land characteristics of farmers) and unobservable factors still needs to be further explored.
3.3 The econometric results of ESR model
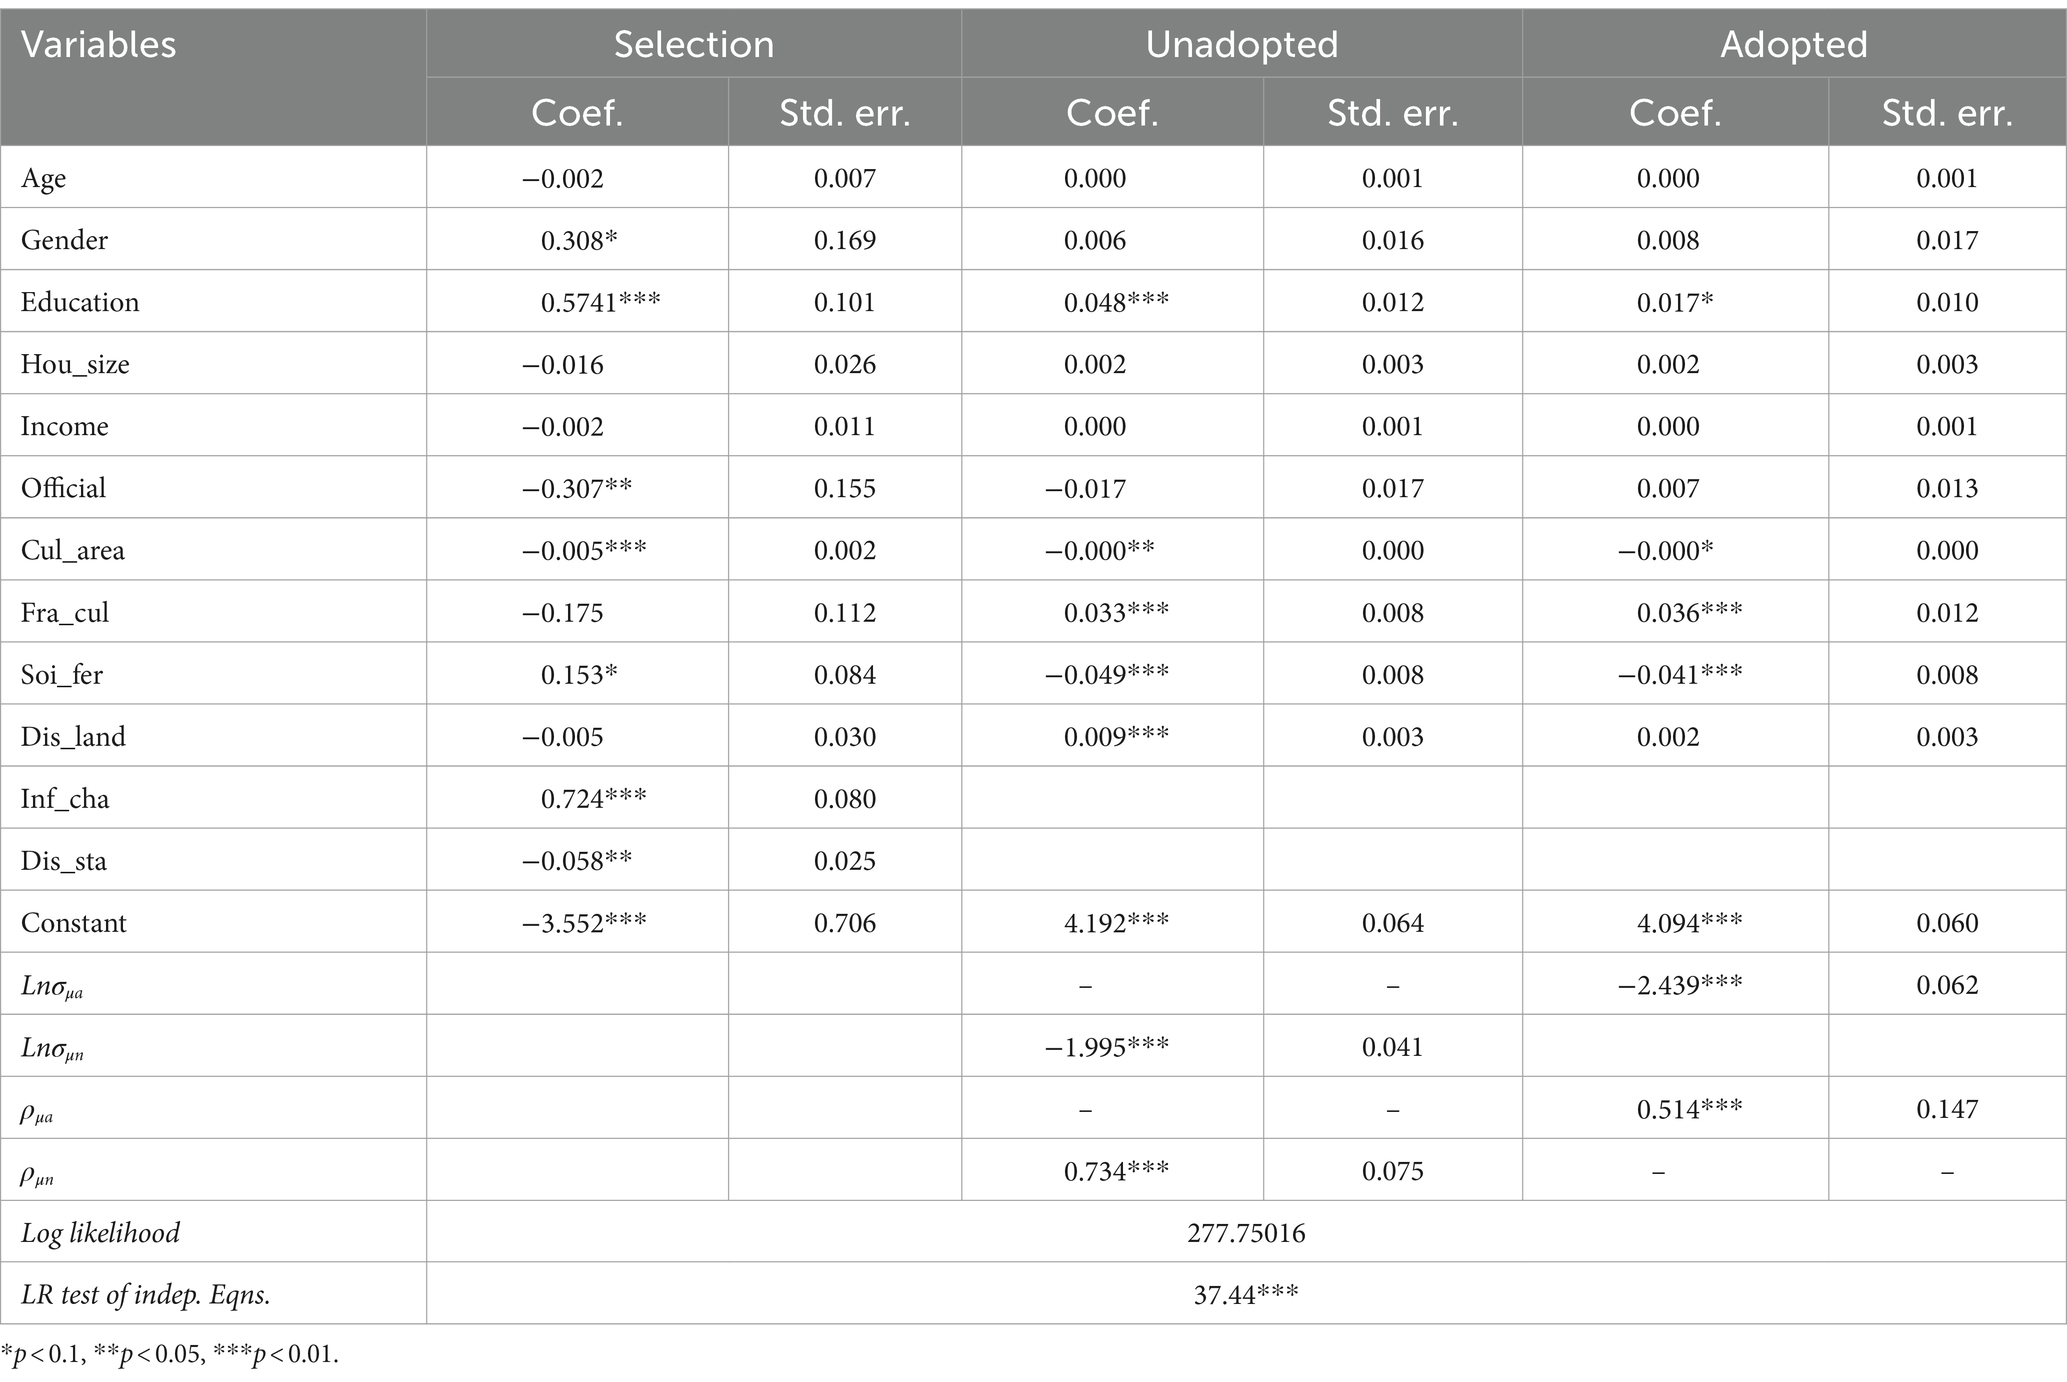
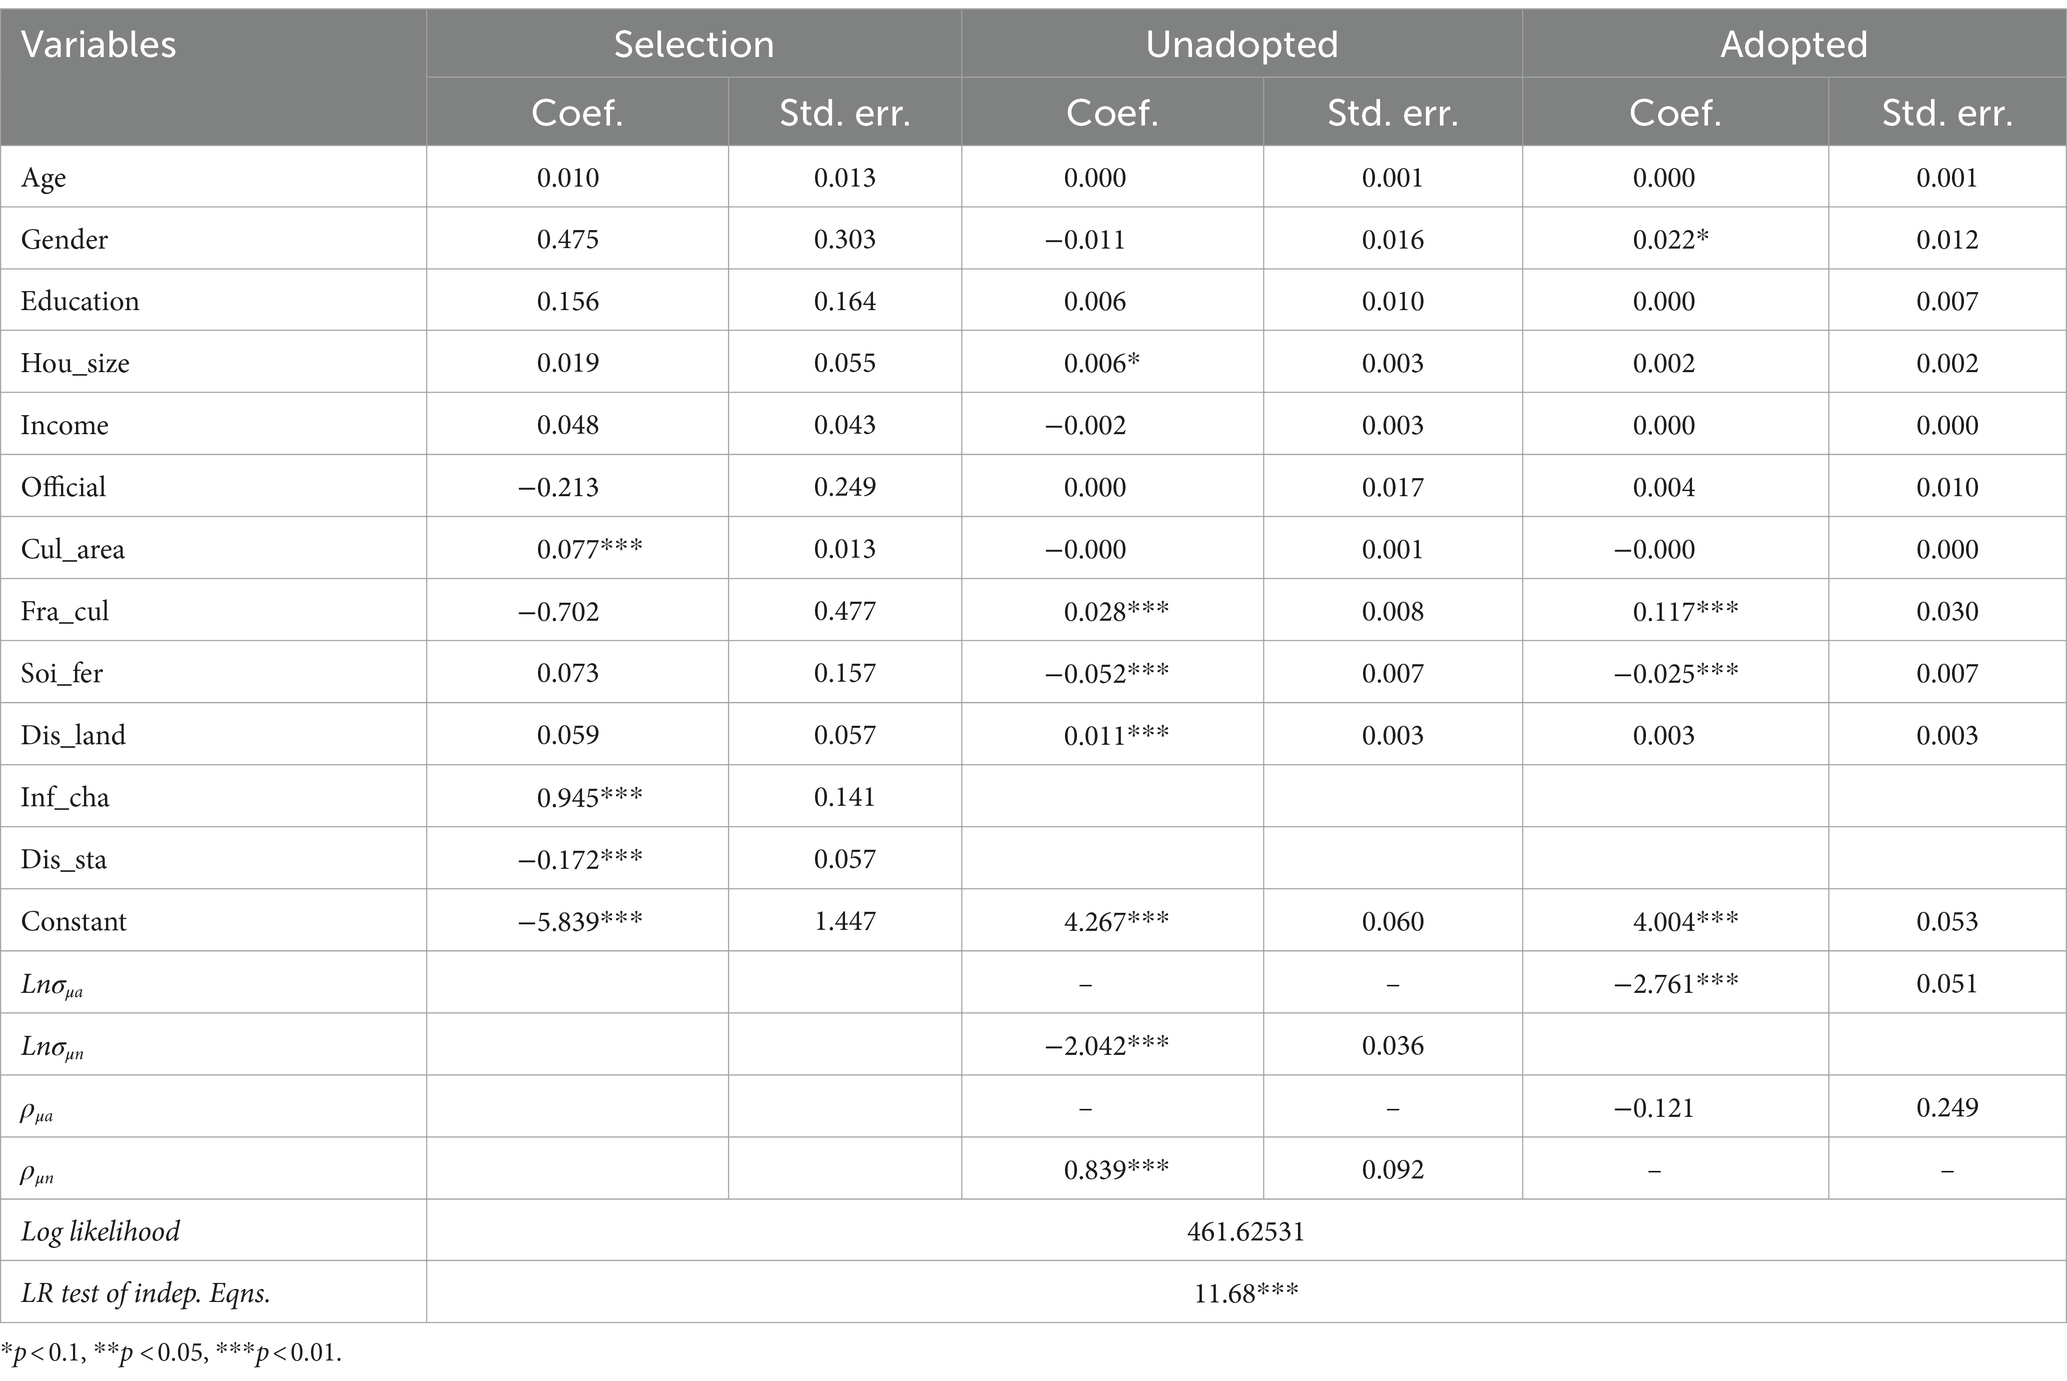
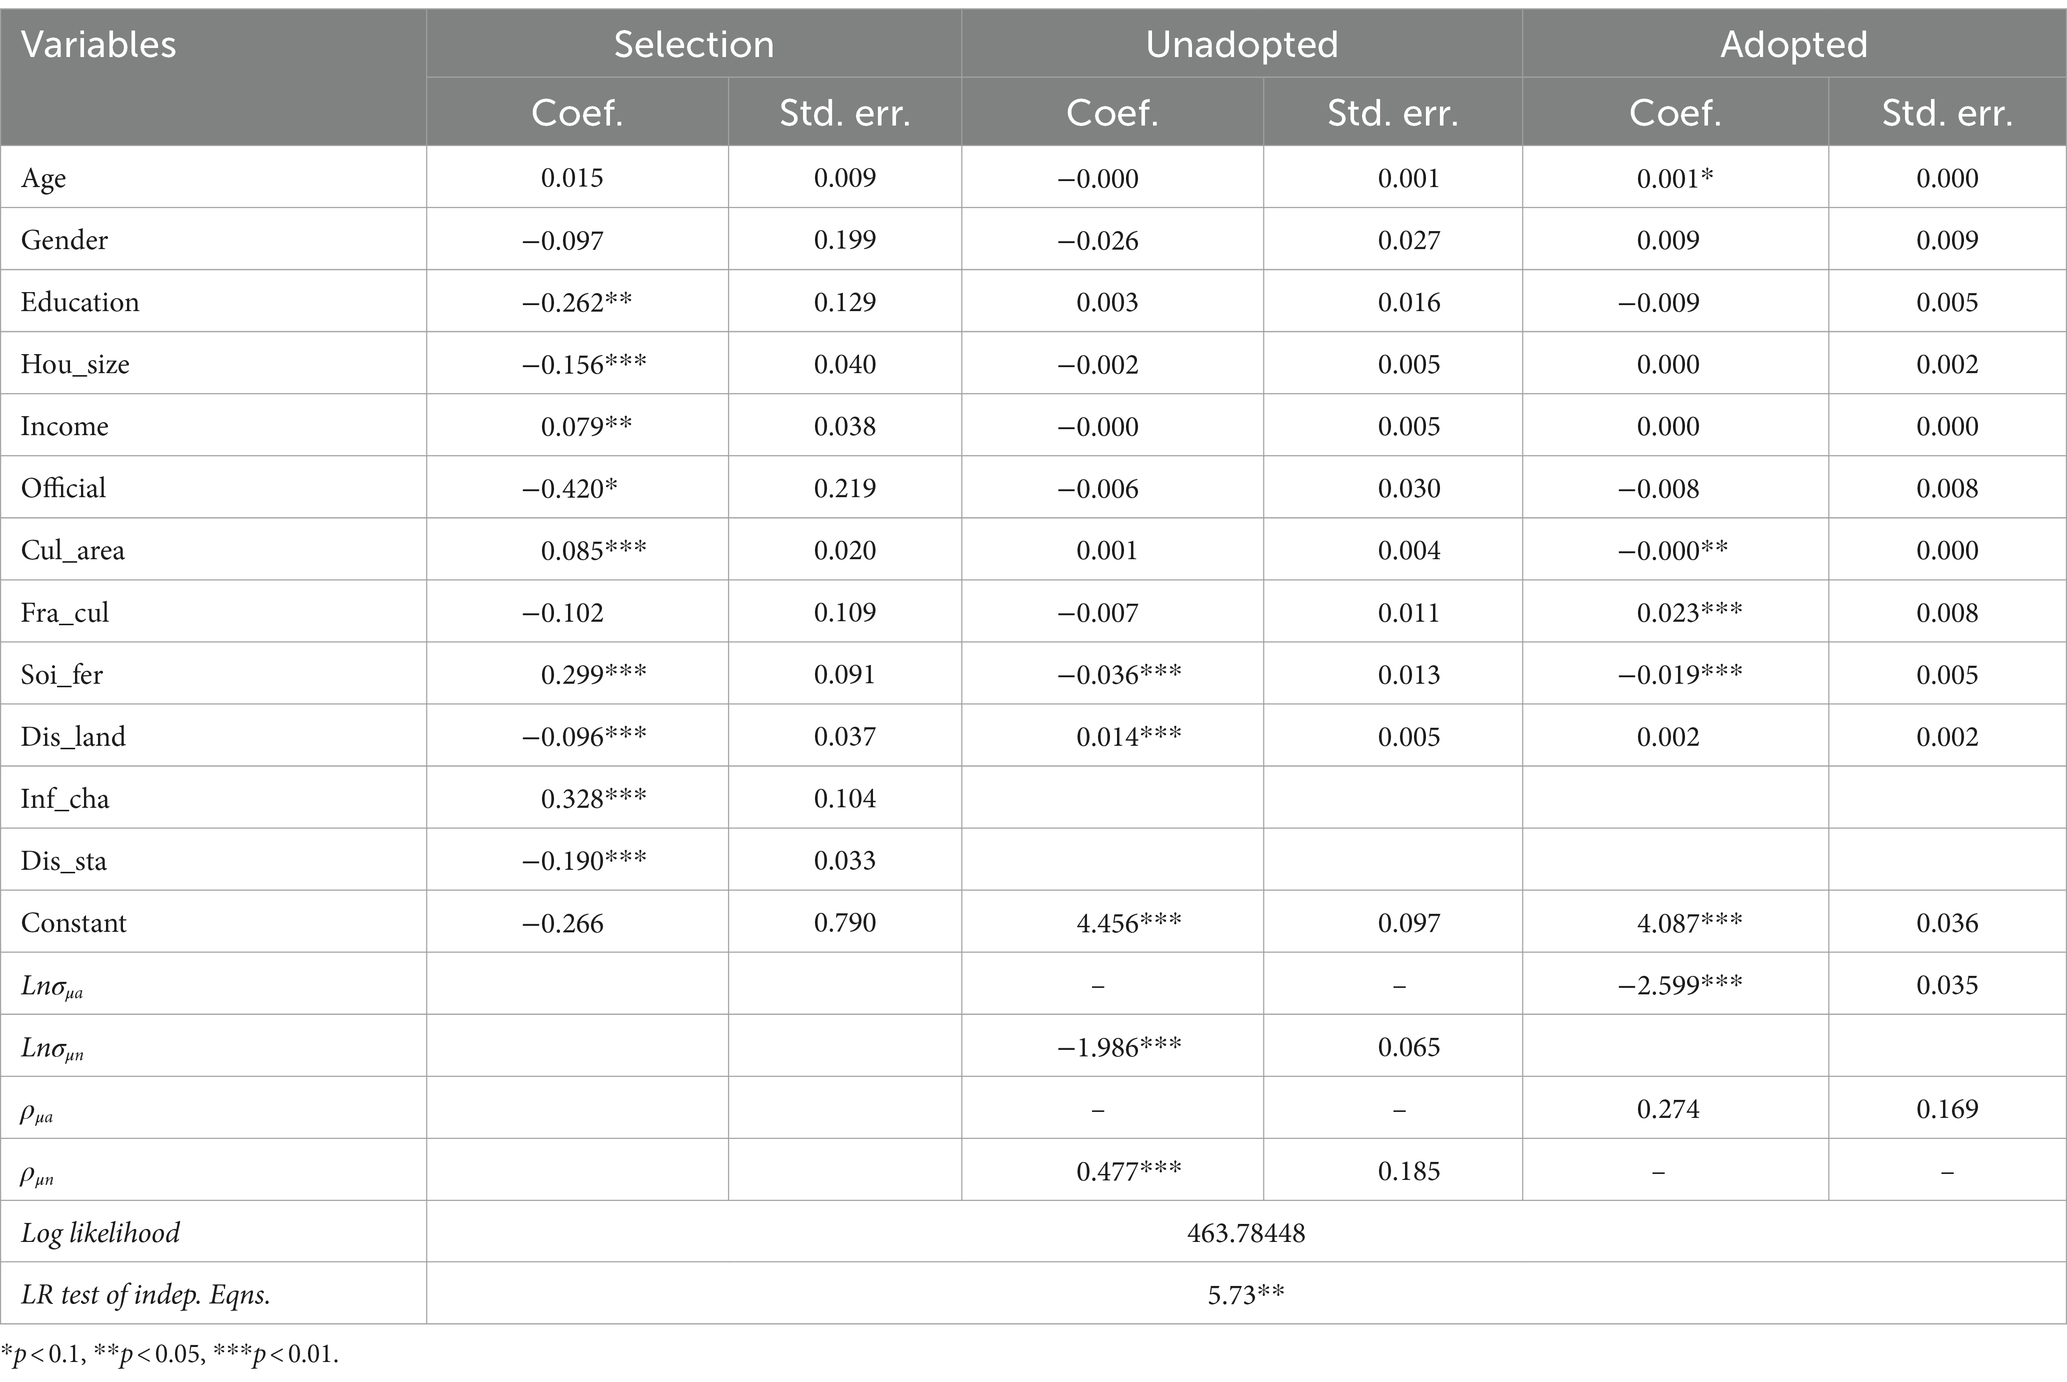
Tables 3–5 present the econometric regression results of the model. The 2–3 columns of each table provide the estimated results of the selection equation, while the 4–7 columns provide the result equations for the farmer groups who did not adopt or adopted PEATs. Specifically, both identified variables were significant in all three models, indicating that the identification effect of the variables is good. The estimation results of or are significant, which proves the existence of sample self selection problem (Lokshin and Sajaia, 2004; Ma and Abdulai, 2016; Kuang et al., 2023). In other words, ignoring this issue may lead to biased estimation results.In other words, the problem needs to be addressed with the ESR model to obtain more plausible estimation results.
3.4 Quantitative analysis of farmers’ response to GM
Table 3 presents the estimated results of farmers adopting GM and its impact on chemical fertilizer application. The results show that gender, education level, government officials, cultivated land area, soil fertility, information access channels, and the distance from home to agricultural technology stations are the main influencing factors for farmers to adopt GM. Specifically, farmers with male, higher education, better soil fertility and more diverse information acquisition channels are more likely to adopt GM. Conversely, farmers with family members including government officials, large-scale planting and homes farther away from agricultural stations are less likely to adopt GM.
As shown in Table 3, the impact of GM adoption by farmers on chemical fertilizer application was estimated. The estimated results of the cultivated land fragmentation variable indicate that farmers with a higher degree of farmland fragmentation use more chemical fertilizers. Similarly, this significant positive impact also occurs in the variables of education and the distance from home to farmland. Conversely, the negative effect of the cultivated land area variable on fertilizer application indicates that farmers with larger farm areas are more inclined to use more chemical fertilizer. Moreover, soil fertility has a positive driving effect on farmers to reduce the application of chemical fertilizer.
3.4.1 Quantitative analysis of farmers’ response to STFF
The influencing factors of farmers adopting STFF and its impact on fertilizer application are estimated in Table 4. In the selection equation, the main influencing factors for farmers to adopt STFF include cultivated land area, information acquisition channels, and distance from home to agricultural technology stations. In other words, farmers with larger cultivated land area, more information access channels, and closer homes to agricultural technology stations are more likely to adopt STFF.
Table 4 also presents the estimation results of the result equations for different adoption groups of STFF. For all farmers (adopted or not adopted), the cultivated land fragmentation and soil fertility variables have significant positive and negative effects on fertilizer application, respectively. In other words, farmers with greater cultivated land fragmentation or poorer soil are more inclined to use more chemical fertilizer. In addition, for farmers who adopt STFF, men are more likely to apply more chemical fertilizer. For unadopted farmers, farmers with larger household populations or farther away from the cultivated land tend to apply more chemical fertilizer.
3.4.2 Quantitative analysis of farmers’ response to SR
Table 5 shows the estimated results of the farmers’ responses to SR. The results indicate that farmers adopting was mainly influenced by education, cultivated land area, family population, income, soil fertility, officials, the distance from home to land, information acquisition channels, and the distance from home to agricultural technology stations. Specifically, farmers with higher income, greater cultivated land area, more information access channels, and better soil fertility are more inclined to adopt SR. Conversely, farmers with high education, large family population, government officials in families, farther away from land, and farther away from agricultural technology stations have lower probability of adopting SR.
From Table 5, we also found the results of farmers’ response to SR on fertilizer application. Soil fertility has a significant negative effect on chemical fertilizers application, indicating that farmers with more fertile land have a higher probability of using less chemical fertilizer. For unadopted farmers, the distance from home to cultivated land has a significant positive influence on chemical fertilizer application, suggesting that farmers who are farther away from farmland use more fertilizer. For adopted farmers, farmers with greater age and cultivated land fragmentation use more chemical fertilizer, while farmers with larger cultivation areas use less chemical fertilizer.
3.5 Estimating the behavioral effects of farmers adopting PEATs
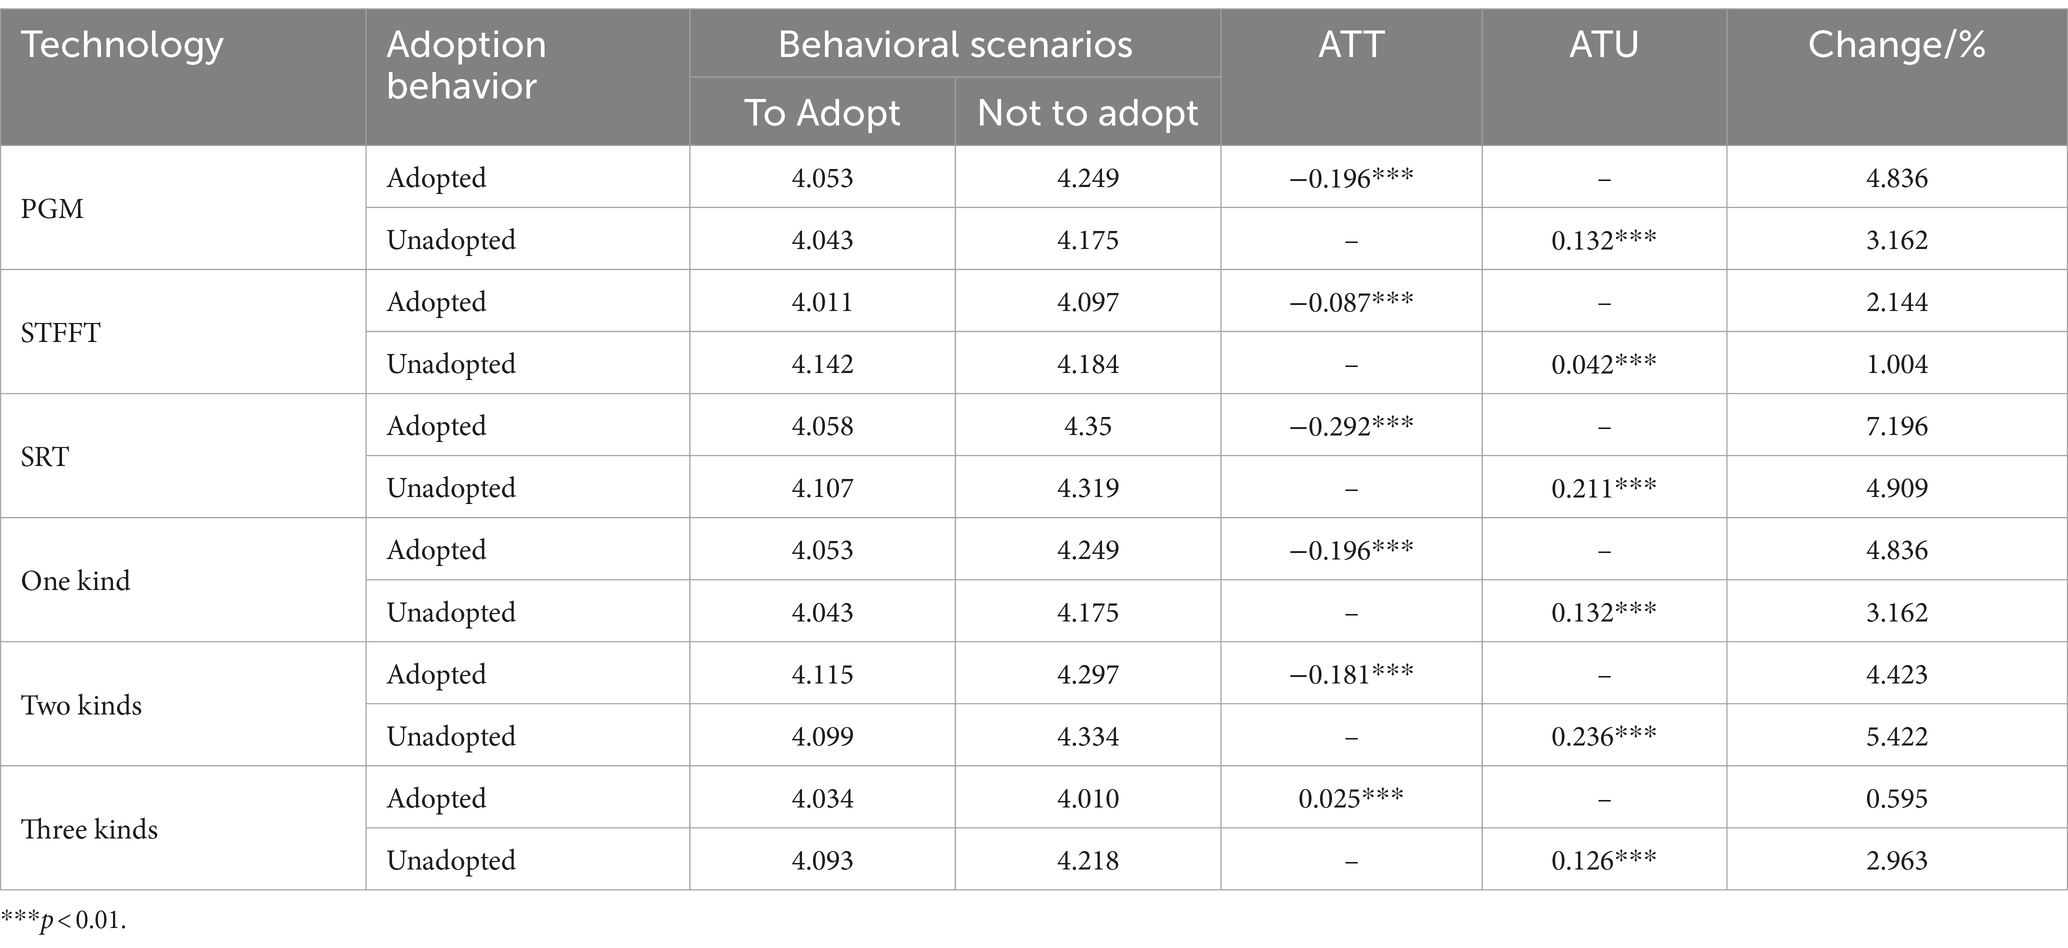
The effect results of PEATs on chemical fertilizer application is presented in Table 6. Overall, the adoption of PEATs will help farmers reduce chemical fertilizer use. Specifically, the estimation results indicate that if farmers who have adopted GM, STFF, and SR choose not to adopt the corresponding types of PEATs, the chemical fertilizer application will increase by 4.84, 2.14, and 7.20%, respectively. Furthermore, for farmers who have not actually adopted PGM, STFFT and SRT, if they adopt the corresponding types of PEATs in the future, the chemical fertilizer application will reduce by 3.16, 1.00 and 4.91%, respectively.
Is the robustness of the results of PEATs having significant fertilizer reduction effects? This is a key issue that this study focuses on. In addition, since farmers may not only adopt one PEATs, this study will again explore the effect of adoption behavior on chemical fertilizer application from the “adoption degree” dimension. As shown in Table 6, the three adoption degree of PEATs have been verified to have significant fertilizer reduction effects, indicating that farmers adopting one or more PEATs can achieve the effect of reduced chemical fertilizer application. Specifically, for farmers who have already adopted one, two, and three types of PEATs, if they do not adopt the corresponding degree of PEATs, the chemical fertilizer application will increase by 4.84, 4.42, and 0.60%, respectively. Correspondingly, for farmers who have not actually adopted one kind, two kinds, and three kinds, if they adopt the corresponding degree of PEATs in the future, their chemical fertilizer will increase by 3.16, 5.42 and 2.96%, respectively. Farmers who did not adopt one, two and three types of PEATs, if they decided to adopt the corresponding degree of PEATs, fertilizer use would increase by 3.16, 5.42 and 2.96%, respectively.
4 Discussion
The results indicate that adopting PEATs by farmers can effectively reduce the use of chemical fertilizers. Specifically, green manure can improve surface coverage, enhance the gas regulation function of the farmland system, reduce nutrient loss to the environment, and improve soil organic matter content, thereby achieving chemical fertilizer reduction (Egodawatta et al., 2012; Hong et al., 2019; Chang et al., 2022). Based on the results of soil testing, STFF achieves precision fertilization, improves soil fertility, meets the needs of crops for various nutrients, and improves the utilization rate of fertilizers by crops, so as to realize the reduction of chemical fertilizer usage (Jordan-Meille et al., 2012; Zebarth et al., 2012; Wu et al., 2022). SR can release rich nutrient elements from crop straw, maintain a balance of nutrients, increase soil organic matter, improve soil nutrient content, and enhance soil fertility, thereby reducing chemical fertilizer application (Malhi et al., 2011; Islam et al., 2022; Liu et al., 2023). In addition, we also need to note that the perception level of farmers that PEATs can significantly reduce fertilizer use still needs to be improved. Descriptive statistical results indicate that a large proportion of farmers still believe that the reduction effect of PEATs on fertilizer is not significant, which is also the reason why Chinese farmers generally have low enthusiasm for adopting PEATs.
Our results suggest that different factors influence different PEATs. Due to the different application conditions of different PEATs, farmers have different preferences for technology (Zhao and Zhou, 2021; Kotu et al., 2022; Pham et al., 2022), which is very normal and easy to understand. Nevertheless, we have found some similar results, which will help us reveal the regularity of farmers’ adoption of PEATs behavior decision-making. Specifically, farmers with easier access to information or closer to agricultural technical stations have a higher probability of adopting PEATs. Similar studies have pointed out that information asymmetry is an important reason why farmers are reluctant or afraid to adopt new agricultural technologies (Aker et al., 2016; Ullah et al., 2020). Therefore, providing more farmers with timely agricultural information and technical guidance is an important task for the agricultural technology extension department, which will encourage farmers to actively adopt PEATs (Shikuku, 2019; Campenhout et al., 2021; Li et al., 2021).
Generally speaking, expanding farm size drives farmers to achieve economies of scale, internalizes the cost of farmland construction, motivate farmers to improve soil fertility through increasing investment, and thus increase the adoption rate of PEATs (Cao et al., 2020; Xie and Huang, 2021). Interestingly, The results show that expanding cultivated land area does not necessarily promote farmers to adopt PEATs, and even has an inhibitory effect. This finding is supported by Gong et al. (2016), Abera et al. (2020), and Kuang et al. (2023), suggesting that expanding farmland scale cannot achieve economies of scale, but has negative scale effects, and does not promote farmers to adopt PEATs. The possible reason is that almost all large-scale farmers choose agricultural machinery to reduce the expensive labor input, while some PEATs (such as GM) are easy to damage agricultural machinery, resulting in incompatibility with agricultural mechanization (Kuang et al., 2023). Furthermore, as the results of this study show, farmers’ perceived benefits of PEATs need to be improved, and some farmers do not recognize the effectiveness of the technology.
Finally, although this article reveals some important findings, it cannot be ignored that there are still some limitations. The estimated results of farmers adopting PEAT to reduce fertilizer use may be overestimated. Because farmers may adopt more than these three types of PEATs when planting rice. In other words, some farmers have also adopted other PEATs, which has an impact on chemical fertilizer application. Therefore, this article has done the following three tasks. Firstly, three commonly used PEATs by farmers were selected from the three production stages (before, middle and after) of planting rice. Secondly, examine the impact of PEATs on fertilizer reduction from the dimensions of “adoption or non adoption” and “degree of adoption.” Thirdly, this article explores the fertilizer reduction effects of farmers adopting PEATs from two perspectives: perception surveys and behavioral effect estimation. In general, how to scientifically and reasonably reveal the driving mechanism of farmers’ response to PEATs and demonstrate technology benefits are still the focus of follow-up research (Kuang et al., 2023), which will be related to how to get through the last kilometer of farmers adopting PEATs.
5 Conclusions and policy suggestions
By highlighting the chemical fertilizer reduction effect of PEATs and identifying obstacle factors, we aim to incentivize farmers to adopt PEATs, thereby achieving green and sustainable agricultural development. Our perception survey results indicate that some farmers acknowledge that PEATs have good fertilizer reduction effects, while a large proportion of farmers still hold a skeptical attitude towards this. The estimated results indicate that the adoption of PEATs can significantly reduce the use of chemical fertilizer by farmers. Specifically, if farmers who actually adopt PEATs do not adopt them in the future, the chemical fertilizer application will increase; If farmers who have not actually adopted PEATs adopt them in the future, the chemical fertilizer application will be reduced. Furthmore, there are differences in the influencing factors of different types of PEATs. Overall, farmers’ adoption of PEATs is mainly influenced by factors such as education level, government officials, cultivated land area, soil fertility, information access channels and distance from home to agricultural machinery stations. Finally, the effect of PEATs on chemical fertilizer reduction was different among farmers’ endowments, which is mainly manifested as farmers with higher cultivated land fragmentation, more distant their homes from the cultivated land will choose to apply more chemical fertilizer, and farmers with better soil fertility apply less chemical fertilizer.
Therefore, the following three policy suggestions are proposed. Firstly, increase technical publicity and reduce the threshold for information acquisition. Cognition is the precursor of behavior, and solving the problem of information asymmetry is a key issue for agricultural technology promotion. Therefore, it is recommended to establish a PEATs promotion and publicity system led by the technology promotion department and participated by multiple entities. Secondly, promote the moderate scale management of cultivated land. It is suggested that government departments take the lead, taking villages as a unit, reduce the cultivated land fragmentation through land adjustment and land leveling, and encourage farmers to conduct moderate scale operations through land transfer. Thirdly, manifest the behavioral effects of PEATs. It is suggested to select a group of farmers or new agricultural business entities with high grain production efficiency under the leadership of the government, establish PEATs promotion and demonstration bases, organize farmers to visit and experience the benefits of PEATs, so as to encourage farmers to actively adopt PEATs.
Data availability statement
The data analyzed in this study is subject to the following licenses/restrictions: Data will be made available on request. Requests to access these datasets should be directed to a3VhbmdmeUBtYWlsLmJudS5lZHUuY24=.
Author contributions
FK: Conceptualization, Funding acquisition, Investigation, Project administration, Writing – original draft, Writing – review & editing. JL: Software, Visualization, Writing – original draft, Writing – review & editing. JJ: Conceptualization, Funding acquisition, Project administration, Supervision, Writing – review & editing. CL: Conceptualization, Funding acquisition, Writing – review & editing. XQ: Investigation, Methodology, Writing – review & editing.
Funding
The author(s) declare financial support was received for the research, authorship, and/or publication of this article. This research was supported by the National Natural Science Foundation of China Fund Project (grant number: 72304132; 42271203; 72064030).
Conflict of interest
The authors declare that the research was conducted in the absence of any commercial or financial relationships that could be construed as a potential conflict of interest.
Publisher’s note
All claims expressed in this article are solely those of the authors and do not necessarily represent those of their affiliated organizations, or those of the publisher, the editors and the reviewers. Any product that may be evaluated in this article, or claim that may be made by its manufacturer, is not guaranteed or endorsed by the publisher.
Footnotes
1. ^According to the available information, China conducted the selection of national and provincial advanced counties in grain production every year since 2004, and 2014 was the last year.
References
Abdallah, A., Abdul-Rahaman, A., and Issahaku, G. (2021). Sustainable agricultural practices, farm income and food security among rural households in Africa. Environ. Dev. Sustain. 23, 17668–17701. doi: 10.1007/s10668-021-01407-y
Abera, W., Assen, M., and Budds, J. (2020). Determinants of agricultural land management practices among smallholder farmers in the Wanka watershed, northwestern highlands of Ethiopia. Land Use Policy 99:104841. doi: 10.1016/j.landusepol.2020.104841
Aker, J. C., Ghosh, I., and Burrell, J. (2016). The promise (and pitfalls) of ICT for agriculture initiatives. Agric. Econ. 47, 35–48. doi: 10.1111/agec.12301
Anik, A. R., Eory, V., Begho, T., and Rahman, M. M. (2023). Determinants of nitrogen use efficiency and gaseous emissions assessed from farm survey: a case of wheat in Bangladesh. Agric. Syst. 206:103617. doi: 10.1016/j.agsy.2023.103617
Baumgart-Getz, A., Prokopy, L. S., and Floress, K. (2012). Why farmers adopt best management practice in the United States: a meta-analysis of the adoption literature. J. Environ. Manag. 96, 17–25. doi: 10.1016/j.jenvman.2011.10.006
Bopp, C., Engler, A., Poortvliet, P. M., and Jara-Rojas, R. (2019). The role of farmers’ intrinsic motivation in the effectiveness of policy incentives to promote sustainable agriculturalpractices. J. Environ. Manag. 244, 320–327. doi: 10.1016/j.jenvman.2019.04.107
Brady, M. (2003). The relative cost-efficiency of arable nitrogen management in Sweden. Ecol. Econ. 47, 53–70. doi: 10.1016/j.ecolecon.2002.11.001
Burton, R. J. F. (2014). The influence of farmer demographic characteristics on environmental behaviour: a review. J. Environ. Manag. 135, 19–26. doi: 10.1016/j.jenvman.2013.12.005
Campenhout, B. V., Spielman, D. J., and Lecoutere, E. (2021). Information and communication technologies to provide agricultural advice to smallholder farmers: experimental evidence from Uganda. Am. J. Agric. Econ. 103, 317–337. doi: 10.1002/ajae.12089
Cao, H., Zhu, X., Heijman, W., and Zhao, K. (2020). The impact of land transfer and farmers’ knowledge of farmland protection policy on pro-environmental agricultural practices: the case of straw return to fields in Ningxia, China. J. Clean. Prod. 277:123701. doi: 10.1016/j.jclepro.2020.123701
Chang, S., Yi, X., Sauer, J., Yin, C., and Li, F. (2022). Explaining farmers’ reluctance to adopt green manure cover crops planting for sustainable agriculture in Northwest China. J. Integr. Agric. 21, 3382–3394. doi: 10.1016/j.jia.2022.09.005
Egodawatta, W. C. P., Sangakkara, U. R., and Stamp, P. (2012). Impact of green manure and mineral fertilizer inputs on soil organic matter and crop productivity in a sloping landscape of Sri Lanka. Field Crop Res. 129, 21–27. doi: 10.1016/j.fcr.2012.01.010
Erisman, J. W., Sutton, M. A., Galloway, J., Klimont, Z., and Winiwarter, W. (2008). How a century of ammonia synthesis changed the world. Nat. Geosci. 1, 636–639. doi: 10.1038/ngeo325
Gong, Y., Baylis, K., Kozak, R., and Bull, G. (2016). Farmers’ risk preferences and pesticide use decisions: evidence from field experiments in China. Agric. Econ. 47, 411–421. doi: 10.1111/agec.12240
Guo, J., Li, C., Xu, X., Sun, M., and Zhang, L. (2022). Farmland scale and chemical fertilizer use in rural China: new evidence from the perspective of nutrient elements. J. Clean. Prod. 376:134278. doi: 10.1016/j.jclepro.2022.134278
Hong, X., Ma, C., Gao, J., Su, S., Li, T., Luo, Z., et al. (2019). Effects of different green manure treatments on soil apparent N and P balance under a 34-year double-rice cropping system. J. Soils Sediments 19, 73–80. doi: 10.1007/s11368-018-2049-5
Hu, L., Zhang, X., and Zhou, Y. (2019). Farm size and fertilizer sustainable use: an empirical study in Jiangsu, China. J. Integr. Agric. 18, 2898–2909. doi: 10.1016/S2095-3119(19)62732-2
Huang, J., Yang, J., and Rozelle, S. (2010). China’s agriculture: drivers of change and implications for China and the rest of world. Agric. Econ. 41, 47–55. doi: 10.1111/j.1574-0862.2010.00487.x
Islam, M. U., Guo, Z., Jiang, F., and Peng, X. (2022). Does straw return increase crop yield in the wheat-maize cropping system in China? A meta-analysis. Field Crop Res. 279:108447. doi: 10.1016/j.fcr.2022.108447
Jin, S., and Zhou, F. (2018). Zero growth of chemical fertilizer and pesticide use: China’s objectives, progress and challenges. J. Resour. Ecol. 9, 50–58. doi: 10.5814/j.issn.1674-764x.2018.01.006
Jordan-Meille, L., Rubaek, G. H., Ehlert, P. A. I., Genot, V., Hofman, G., Goulding, K., et al. (2012). An overview of fertilizer-P recommendations in Europe: soil testing, calibration and fertilizer recommendations. Soil Use Manag. 28, 419–435. doi: 10.1111/j.1475-2743.2012.00453.x
Khanal, U., Wilson, C., Lee, B. L., and Hoang, V. (2018). Climate change adaptation strategies and food productivity in Nepal: a counterfactual analysis. Clim. Chang. 148, 575–590. doi: 10.1007/s10584-018-2214-2
Khonje, M. G., Manda, J., Mkandawire, P., Tufa, A. H., and Alene, A. D. (2018). Adoption and welfare impacts of multiple agricultural technologies: evidence from eastern Zambia. Agric. Econ. 49, 599–609. doi: 10.1111/agec.12445
Kotu, B. H., Oyinbo, O., Hoeschle-Zeledon, I., Nurudeen, A. R., Kizito, F., and Boyubie, B. (2022). Smallholder farmers’ preferences for sustainable intensification attributes in maize production: evidence from Ghana. World Dev. 152:105789. doi: 10.1016/j.worlddev.2021.105789
Kuang, F., Li, J., Jin, J., and Qiu, X. (2023). Do green production technologies improve household income? Evidence from rice farmers in China. Land 12:1848. doi: 10.3390/land12101848
Lai, Z., Chen, M., and Liu, T. (2020). Changes in and prospects for cultivated land use since the reform and opening up in China. Land Use Policy 97:104781. doi: 10.1016/j.landusepol.2020.104781
Li, Y., Fan, Z., Jiang, G., and Quan, Z. (2021). Addressing the differences in farmers’ willingness and behavior regarding developing green agriculture—a case study in XiChuan County, China. Land 10:316. doi: 10.3390/land10030316
Li, P., Feng, Z., Jiang, L., Liu, Y., and Xiao, X. (2012). Changes in rice cropping systems in the Poyang Lake region, China during 2004-2010. J. Geogr. Sci. 22, 653–668. doi: 10.1007/s11442-012-0954-x
Lin, Y., Hu, R., Zhang, C., and Chen, K. (2022). The role of public agricultural extension services in driving fertilizer use in rice production in China. Ecol. Econ. 200:107513. doi: 10.1016/j.ecolecon.2022.107513
Liu, J., Qiu, T., Pe Uelas, J., Sardans, J., Tan, W., Wei, X., et al. (2023). Crop residue return sustains global soil ecological stoichiometry balance. Glob. Chang. Biol. 29, 2203–2226. doi: 10.1111/gcb.16584
Liu, Y., Ruiz-Menjivar, J., Zhang, L., Zhang, J., and Swisher, M. E. (2019). Technical training and rice farmers’ adoption of low-carbon management practices: the case of soil testing and formulated fertilization technologies in Hubei, China. J. Clean. Prod. 226, 454–462. doi: 10.1016/j.jclepro.2019.04.026
Lokshin, M., and Sajaia, Z. (2004). Maximum likelihood estimation of endogenous switching regression models. Stata J. 4, 282–289. doi: 10.1177/1536867X0400400306
Lu, Y., Jenkins, A., Ferrier, R. C., Bailey, M., Gordon, I. J., Song, S., et al. (2015). Addressing China’s grand challenge of achieving food security while ensuring environmental sustainability. Sci. Adv. 1:e1400039. doi: 10.1126/sciadv.1400039
Ma, W., and Abdulai, A. (2016). Does cooperative membership improve household welfare? Evidence from apple farmers in China. Food Policy 58, 94–102. doi: 10.1016/j.foodpol.2015.12.002
Malhi, S. S., Nyborg, M., Solberg, E. D., Dyck, M. F., and Puurveen, D. (2011). Improving crop yield and N uptake with long-term straw retention in two contrasting soil types. Field Crop Res. 124, 378–391. doi: 10.1016/j.fcr.2011.07.009
National Bureau of Statistics of China (NBSC). (2023). Jiangxi statistical yearbook. China Statistics Press, Beijing.
Pham, H., Chuah, S., and Feeny, S. (2022). Coffee farmer preferences for sustainable agricultural practices: findings from discrete choice experiments in Vietnam. J. Environ. Manag. 318:115627. doi: 10.1016/j.jenvman.2022.115627
Qing, C., Zhou, W., Song, J., Deng, X., and Xu, D. (2023). Impact of outsourced machinery services on farmers’ green production behavior: evidence from Chinese rice farmers. J. Environ. Manag. 327:116843. doi: 10.1016/j.jenvman.2022.116843
Rust, N. A., Jarvis, R. M., Reed, M. S., and Cooper, J. (2021). Framing of sustainable agricultural practices by the farming press and its effect on adoption. Agric. Hum. Values 38, 753–765. doi: 10.1007/s10460-020-10186-7
Schulte-Uebbing, L. F., Beusen, A. H. W., Bouwman, A. F., and de Vries, W. (2022). From planetary to regional boundaries for agricultural nitrogen pollution. Nature 610, 507–512. doi: 10.1038/s41586-022-05158-2
Shahzad, A. N., Qureshi, M. K., Wakeel, A., and Misselbrook, T. (2019). Crop production in Pakistan and low nitrogen use efficiencies. Nat. Sustain. 2, 1106–1114. doi: 10.1038/s41893-019-0429-5
Shikuku, K. M. (2019). Information exchange links, knowledge exposure, and adoption of agricultural technologies in northern Uganda. World Dev. 115, 94–106. doi: 10.1016/j.worlddev.2018.11.012
Trimpler, K., Stockfisch, N., and Märländer, B. (2016). The relevance of N fertilization for the amount of total greenhouse gas emissions in sugar beet cultivation. Eur. J. Agron. 81, 64–71. doi: 10.1016/j.eja.2016.08.013
Ullah, A., Arshad, M., Kächele, H., Zeb, A., Mahmood, N., and Müller, K. (2020). Socioeconomic analysis of farmers facing asymmetric information in inputs markets: evidence from the rainfed zone of Pakistan. Technol. Soc. 63:101405. doi: 10.1016/j.techsoc.2020.101405
Wang, Y., Zhu, Y., Zhang, S., and Wang, Y. (2018). What could promote farmers to replace chemical fertilizers with organic fertilizers? J. Clean. Prod. 199, 882–890. doi: 10.1016/j.jclepro.2018.07.222
Ward, P. S., Bell, A. R., Droppelmann, K., and Benton, T. G. (2018). Early adoption of conservation agriculture practices: understanding partial compliance in programs with multiple adoption decisions. Land Use Policy 70, 27–37. doi: 10.1016/j.landusepol.2017.10.001
Wossen, T., Alene, A., Abdoulaye, T., Feleke, S., and Manyong, V. (2019). Agricultural technology adoption and household welfare: measurement and evidence. Food Policy 87:101742. doi: 10.1016/j.foodpol.2019.101742
Wu, H., Li, J., and Ge, Y. (2022). Ambiguity preference, social learning and adoption of soil testing and formula fertilization technology. Technol. Forecast. Soc. Chang. 184:122037. doi: 10.1016/j.techfore.2022.122037
Xie, H., and Huang, Y. (2021). Influencing factors of farmers’ adoption of pro-environmental agricultural technologies in China: meta-analysis. Land Use Policy 109:105622. doi: 10.1016/j.landusepol.2021.105622
Zebarth, B. J., Snowdon, E., Burton, D. L., Goyer, C., and Dowbenko, R. (2012). Controlled release fertilizer product effects on potato crop response and nitrous oxide emissions under rain-fed production on a medium-textured soil. Can. J. Soil Sci. 92, 759–769. doi: 10.4141/cjss2012-008
Zhao, D., and Zhou, H. (2021). Livelihoods, technological constraints, and low-carbon agricultural technology preferences of farmers: analytical frameworks of technology adoption and farmer livelihoods. Int. J. Environ. Res. Public Health 18:13364. doi: 10.3390/ijerph182413364
Keywords: sustainable agriculture, PEATs, the fertilizer reduction effect, Chinese farmers, endogenous switching regression model
Citation: Kuang F, Li J, Jin J, Liu C and Qiu X (2024) How to manifest the fertilizer reduction effect of pro-environmental agricultural technologies? From the perspective of farmers’ perception and behavioral adoption. Front. Sustain. Food Syst. 8:1377040. doi: 10.3389/fsufs.2024.1377040
Edited by:
Ademola Braimoh, World Bank Group, United StatesReviewed by:
Wei Wang, Sichuan Agricultural University, ChinaNilhari Neupane, International Water Management Institute (Nepal), Nepal
Copyright © 2024 Kuang, Li, Jin, Liu and Qiu. This is an open-access article distributed under the terms of the Creative Commons Attribution License (CC BY). The use, distribution or reproduction in other forums is permitted, provided the original author(s) and the copyright owner(s) are credited and that the original publication in this journal is cited, in accordance with accepted academic practice. No use, distribution or reproduction is permitted which does not comply with these terms.
*Correspondence: Jianjun Jin, ampqaW5AYm51LmVkdS5jbg==
 Foyuan Kuang
 Jiatong Li2,3