 Benjamín Leiva
 Adrián Vargas2
 Fernando Casanoves
 Jeremy Haggar
- 1Observatorio Económico Sostenible, Universidad del Valle de Guatemala, Guatemala City, Guatemala
- 2Centro Agronómico Tropical de Investigación y Enseñanza (CATIE), Turrialba, Costa Rica
- 3Universidad de la Amazonia, Florencia, Caquetá, Colombia
- 4Natural Resources Institute, University of Greenwich, Kent, United Kingdom
Increasing costs of coffee production relative to coffee prices has led to concern across the industry of lack of profitability of coffee production especially for smallholders who comprise a large majority of producers. This study compares coffee production costs and income over a decadal interval of 2008 versus 2019 for coffee farmers in some of the main coffee growing regions of Costa Rica and Guatemala. Costs and income were collected by farmer recall using a standard questionnaire with trained research surveyors. Net income as assessed by EBITDA (earnings before interest, taxes, depreciation and amortization) increased by about 30% in Costa Rica, but declined to a third of its 2008 level in Guatemala. Agronomic costs of production per hectare increased by 31% in Costa Rica and 62% in Guatemala, mostly due to increased labor costs (higher daily wage rates), while fertilizer usage increased but unit costs remained stable. Gross income was stable in Guatemala but increased in Costa Rica due to receiving significantly higher prices for their coffee in 2019 compared to 2008, while in Guatemala prices declined. Nevertheless, the response was not uniform between farms in Costa Rica while high and medium productivity groupings of farms had higher EBITDA, low and very low productivity farms experienced a decline similar to Guatemala. The difference in performance of farm groups in Costa Rica was due to a decline in production per hectare of the lower productivity group; while the difference between Guatemala and Costa Rica was firstly due to price differences, and secondarily due to lower productivity of some farm groups. The investment of Costa Rican farmers was undoubtedly supported by the substantially increased price received by farmers (as compared to Guatemala), reflected in the increase in export price of coffee from Costa Rica relative to Guatemala. This shows the importance of farmers receiving higher prices for their produce in enabling them to cover increasing production costs, invest in increasing productivity and maintain profitability.
1 Introduction
Coffee production is estimated to provide livelihoods for between 12.5 to 25 million farmers and their families (Enveritas, 2019; ICO, 2019), of which about 95% are smallholders with farms less than 5 hectares (Enveritas, 2019). Although global coffee production has increased by 65% since 1990, prices continue to be highly volatile. Since the end of the International Coffee Agreement and market liberalization at the beginning of the 1990s coffee prices crashed in the early 2000s recovered toward the end of that decade and then again between 2009 and 2019 declined by 30% (ICO2019). In 2018 prices dropped below US$1.00 per pound for the first time since the price crash of the early 2000s. Coffee producers were struggling to cover their operating costs during the period of 2016–2019, due to rising input, compliance and transaction costs (ICO, 2019). Even for the 2015/16 harvest, before prices declined further, between 25 and 50% of farmers across Colombia, Honduras and Guatemala were experiencing negative profits, being unable to cover their full economic costs of production. Rising costs and falling prices have resulted in up to half of coffee producing smallholders living below the extreme poverty line in some countries (ICO 2020). While coffee prices have recovered somewhat over the 2020–2022 period, price volatility is inherent and systemic in coffee production, with farmers facing prices below production costs a few years in every decade.
Over longer time frames (1970–2019) there is no significant trend of prices increasing nor decreasing (ICO, 2019), but costs of production have increased sharply since 2010 thus reducing profits for producers (Sachs et al., 2019). Cordes et al. (2021) found that average coffee income was below a living income for all top ten coffee producing countries except Brazil. The main drivers of poor economic performance appeared to vary between countries, while in Colombia and Guatemala high production costs were important (and in general for Latin America), in Uganda low farmgate prices and small farm size, and Ethiopia low coffee productivity were key factors.
Central America is one of the main coffee growing regions of the world producing approximately 10% of global production but specializing in high quality arabica coffees supporting about 290,000 farmers and is a major source of income and employment in rural areas (CEPAL, 2002). Guatemala is the eighth largest coffee producer globally and fourth largest producer of Arabica coffee. Both Guatemala and Costa Rica have a reputation for producing very high quality and specialty coffees. The countries share some macro variables that make the comparative analysis relevant, such as inflation rates, tax burden, being in the same region, and open market economies. Moreover, both countries are exposed to changes in commodity and input prices and are dependent on importing fertilizers and other inputs and exporting their production. Agroclimatic conditions for production are similar in the two countries and coffee production systems are similar derived from traditional shaded agroforestry systems with varying degrees of intensification, but not high input, irrigated monocultures as in Vietnam or parts of Brazil. Nevertheless, socioeconomic conditions in the two countries are distinct with Guatemala having one of the highest poverty and inequality rates in Latin America (The World Bank, 2024a), the highest poverty level in Central America while Costa Rica has higher levels of overall income, a relatively equitable distribution of wealth and high levels of education and social welfare (The World Bank, 2024b). Thus, the two countries have similar conditions for coffee production but within distinct economic and social conditions.
Since the dissolution of the International Coffee Agreement in 1989 that buffered price fluctuations, there have been price crashes between 1991–1993, 2000–2003 (Bacon, 2008), and substantial fluctuations subsequently. The fall in coffee prices between 2000 and 2003 led to a 25% reduction in coffee production across Central America and the loss of half a million jobs (Castro et al., 2004). Addressing the financial instability among coffee producers remains an on-going challenge with many different industry and development programs attempting to address the issue. There are various initiatives between industry and development organizations seeking to determine what is a living income for coffee farmers such as the IDH (2020) Task Force for a Living Income report, while Fairtrade International (https://www.fairtrade.net/issue/living-income) have established a Living Income Reference Price for some countries. Most recently the International Coffee Organization with United Nations Industrial Development Organization launched a report on the sustainability and resilience of global coffee value chains and proposed the establishment of a Global Coffee Fund address the financial instability of the sector (ICO and UNIDO, 2024).
Changes in costs of production summarized by Sachs et al. (2019) indicate considerable differences between countries, perhaps due to different levels of investment in labor compared to inputs. Is it stated that both increases in labor costs and inputs costs were drivers of reduced profitability. It might be expected that higher wage economies such as Costa Rica would be at a disadvantage to lower wage economies such as Guatemala. Nevertheless, clear data on changes in production costs over time appear to be lacking. Overall, past studies lack comparable data at farm level across time to ascertain the main causes and responses to the perceived decline in profitability of coffee production in countries whose primary producers are smallholders.
In this study we aim to determine the changes in the on-farm economics of coffee production over a decadal period between 2008 and 2019 under the distinct socioeconomic conditions of Guatemala and Costa Rica to understand the factors that may be contributing to falling profitability or enabling farmers to maintain their incomes.
2 Methods and data
2.1 Methods
The study applied the Committee for Sustainability Assessment (COSA) method for multi-criteria assessment of sustainability in coffee (Giovannucci and Potts, 2008) to characterize farms and evaluate coffee production costs and income from coffee on farms across Guatemala and Costa Rica. This is a method that can be implemented in between half to one day per farm; while this limits the depth of evaluation it also permits larger sample sizes to be undertaken.
Two surveys were undertaken, one in 2008/09, the other in 2019/20. The 2008/09 survey was conducted across all the main coffee growing regions in each country, was structured to compare farms with sustainability certification and those without and included a total of 237 farms in Costa Rica and 273 farms in Guatemala (Soto et al., 2011). Certified farms were selected from lists provided by certification bodies and traders in-country, and non-certified farms were identified from the same communities with similar characteristics.
The 2019/20 survey selected farms from the 2008/09 data-base but focused on three of the main coffee growing regions in each country covering a range of agro-environmental conditions, as described in Haggar et al. (2021). In Costa Rica, farms were located in: (i) Turrialba-Orosi (low-medium altitude, high rainfall, standard commercial grade coffee); (ii) Valle Occidental (mid-high altitude, seasonal climate with high quality coffee), and (iii) Los Santos Tarrazú (high altitude, seasonal climate, and coffee quality that is considered the best in the country). In Guatemala, farms were located in: West (departments of Quetzaltenango, Retalhuleu, and San Marcos) low-high altitude, high rainfall, commercial grade coffee; Mid (department of Solola) high altitude, medium rainfall, high quality coffee; and East (departments of Guatemala, Sacatepequez and Chimaltenango) high altitude, low rainfall, and very high coffee quality. A total of 180 farms (90 per country, 30 per region) were initially selected from a list used in a previous study in 2008/09. Where these farms were not available or interested in participating they were replaced by nearby farms of similar characteristics (56 in total). Ethical standards of prior consent and confidentiality were followed as appropriate for socioeconomic surveys and farmers were at complete liberty to decline to participate (as a few did).
Two surveyors experienced in farm verification processes conducted the farmer questionnaires, but different surveyors were used for the two evaluation periods. Surveyors received training, conducted trial interviews, and interview responses were reviewed periodically to ensure quality with feedback provided. All variables were quality checked in order to identify values out of acceptable or standardized ranges. All the values identified as outliers were reviewed or corrected with the producer in a second visit or phone call.
In both surveys we used the COSA questionnaires to register all coffee agronomic practices and estimate the costs of those practices during the previous year, (2008 and 2019) as well as the amount of coffee produced, harvest costs and value of sales for the harvest prior to and after the period evaluated for its agronomic costs (i.e., 2007/08 and 2008/09, and 2018/19 and 2019/20 harvests). The actual timing of the survey varied as the agronomic year and start and end of harvest varied across the different regions with some completing harvest in November and others until April. The COSA format is designed to facilitate the reconstruction of costs from farmer recall by working through the practices for the farming year; this is supported by the registers of activities and use of records farmers are required to maintain when they are certified, but are less common for non-certified farmers.
To make the monetary values of both surveys comparable, the values from the 2008/09 survey were multiplied by 1.1874, which reflects the change in the composite Consumer Price Index between 2008 and 2019. Moreover, for each survey the data for production and price was averaged between two adjoining harvests given the known tendency for biennial production, i.e., a good year is generally followed by a poorer year in terms of production per hectare. This avoids excessive fluctuations. The averages are from the 2007/08 and 2008/09, and 2018/19 and 2019/20 harvests, which are referred to 2008 and 2019 for simplicity. Price and production of cherry coffee was used for all farms. When a farm sold coffee in another presentation, standard conversions were used to transform back to cherry.
2.2 Data analysis
To study a coffee farm’s profits in a given year consider that
where is profits per hectare, is total income per hectare and is total costs per hectare. In this study EBIDTA (earnings before interest, taxes, depreciation and amortization) is used as a proxy for profits. Expressing the equation with a normalization by plantation size facilitates comparability between farms, and allows for a simple conversion to totals profits, income and cost by multiplying by area. Moreover, consider that
where is the average price and the average production sold per hectare for the harvest for which the production costs were evaluated, and the previous harvest. Costs can be analyzed in different ways to obtain a better picture of underlying dynamics. An initial and relatively simple way is to decompose costs among input costs and labor costs, with
where are input costs per hectare and LC are labor costs per hectare. For input costs, the materials (e.g., fertilizer, pesticides, etc.) and equipment (e.g., machetes, tractors, etc.) for all practices were registered noting the volume or number of the product and the cost per unit. For labor costs, the number of person-days and cost per day were registered for all activities. All person-days were considered as a cost, regardless if they generated a monetary payment or if they were family work. Another way to decompose costs is between activities, with
where contains the costs per hectare of all agronomic activities (i.e., establishment, pruning, manual weed control, conservation, shade management, fertilization, and pesticides), are harvesting costs per hectare, and are fixed costs per hectare. These costs contain input and labor costs, with all person-days considered as a cost as specified above. Costs of labor for the harvest and processing were calculated (including picking, wet processing, and drying) based on a cost per volume of harvest (as this is how these services are usually paid). The amount and price of materials, tools and equipment used in harvest and processing were registered; in the case of minor equipment that lasts more than a year, total cost was divided by life-span as an estimate. Additional costs were registered including, fuel used (for machinery), transport costs, and administration costs. Fixed costs such as equipment depreciation, maintenance and administrative costs were considered yet played a relatively small part in overall costs. Farms where costs were incomplete or substantially deviated from the normal range of values were eliminated from the analysis.
Based on the 2019 dataset a coffee plantation typology of production strategies was formed for each country using multivariate cluster analysis based on the shade LAI and coffee yield as indicators of sustainability and productivity outcomes of the management strategy of the plantation (Haggar et al., 2021). Cluster analysis of plantations per country was conducted using LAI and coffee productivity (kg ha−1), previously standardized, using the Ward method with Euclidean distance. The resulting clusters represent the coffee plantation production strategies that reflects the strategy in terms of intensification and sustainability. Four production strategies were differentiated for each country representing high, medium, low and very low productivity plantations, with varying shade levels (Appendix Table A1). Production strategies significantly differed in the levels of agronomic investment, coffee yield, and shade levels, amongst other factors (Haggar et al., 2021), and can be summarized as follows.
High Productivity Medium Shade (HPMS), were high yielding plantations producing between 12 and 20 tonnes of coffee cherries per hectare annually, with high investment in agronomic production over US$2000 per hectare. Most plantations had between 40 and 60% shade (LAI 0.5–1.1).
Medium Productivity Low/Medium Shade (MPLS/MS) plantations produced between 6 and 12 tonnes (Costa Rica) and 4–12 tonnes (Guatemala) of coffee cherries per hectare per year. Annual agronomic costs in Costa Rica were almost as high as Hprod-Mshade systems, but only about US$1,100 per hectare in Guatemala. Shade levels in both countries were 20–60% (LAI 0.1–1.0), although on average higher in Guatemala.
Low Productivity High Shade (LPHS) was characterized by having high shade over 60% (LAI > 1.0), while productivity ranged from <1 tonne to 9 tonnes of coffee cherries per hectare per year. Annual agronomic costs were on average half that of the Medium Productivity systems, US$1277 per hectare in Costa Rica and US$689 per hectare in Guatemala.
Very Low Productivity Low/Medium Shade (VLPLS/MS) systems had annual yields from <1 tonne up to 6 tonnes of coffee cherries per hectare and shade levels less than 60% (LAI <1.0), although on average higher for Guatemala. Agronomic production costs were very similar to that for the LPHS system.
Differences in EBITDA between 2008 and 2019 by country were made using t-tests. The subset of data that only includes farms for which there is data for both dates were compared using paired t-tests. Paired t-tests were also used to compare the differences in the components of economic costs and income between 2008 and 2019. ANOVA with Tukey means comparison was used to compare the EBITDA in 2019 of farm typology groupings, and the change in EBITDA 2008–2019 for each group.
Moreover, to further study the determinants of EBITDA a regression analysis is made on EBITDA per hectare, production per hectare, price, and unit costs. OLS with robust standard errors are used to regress each of these variables on altitude, farm area, producer age, certification of coffee (dummy), participation in a producer association (dummy), and survey year (dummy).
3 Results
3.1 Change in EBIDTA across sampling groups
The absolute value of EBIDTA from coffee production in 2019 and 2008, and the differences between them were very similar whether calculated using all data from the two surveys, only from farms in the same regions, or only farms in common between the two surveys (Table 1). In Costa Rica the comparison of farms in 2008 and 2019 using all data gave a weakly significant increase in EBIDTA which might have been influenced by the 2008 data covering a wider geographic area than the 2019 data. The values for farms in the same regions and farms in common gave similar absolute values but the slight increase in EBIDTA was no longer significant. In Guatemala all comparisons showed a highly significant decline in EBIDTA with income in 2019 only 30% of that in 2008 (Table 1). For further exploration of the factors that contribute to this difference we have used the comparison between the same farms to ensure changes between the time periods are not influenced by differences between the farms included. This limits the sample size to 69 farms for Costa Rica for each year, and 38 for Guatemala.
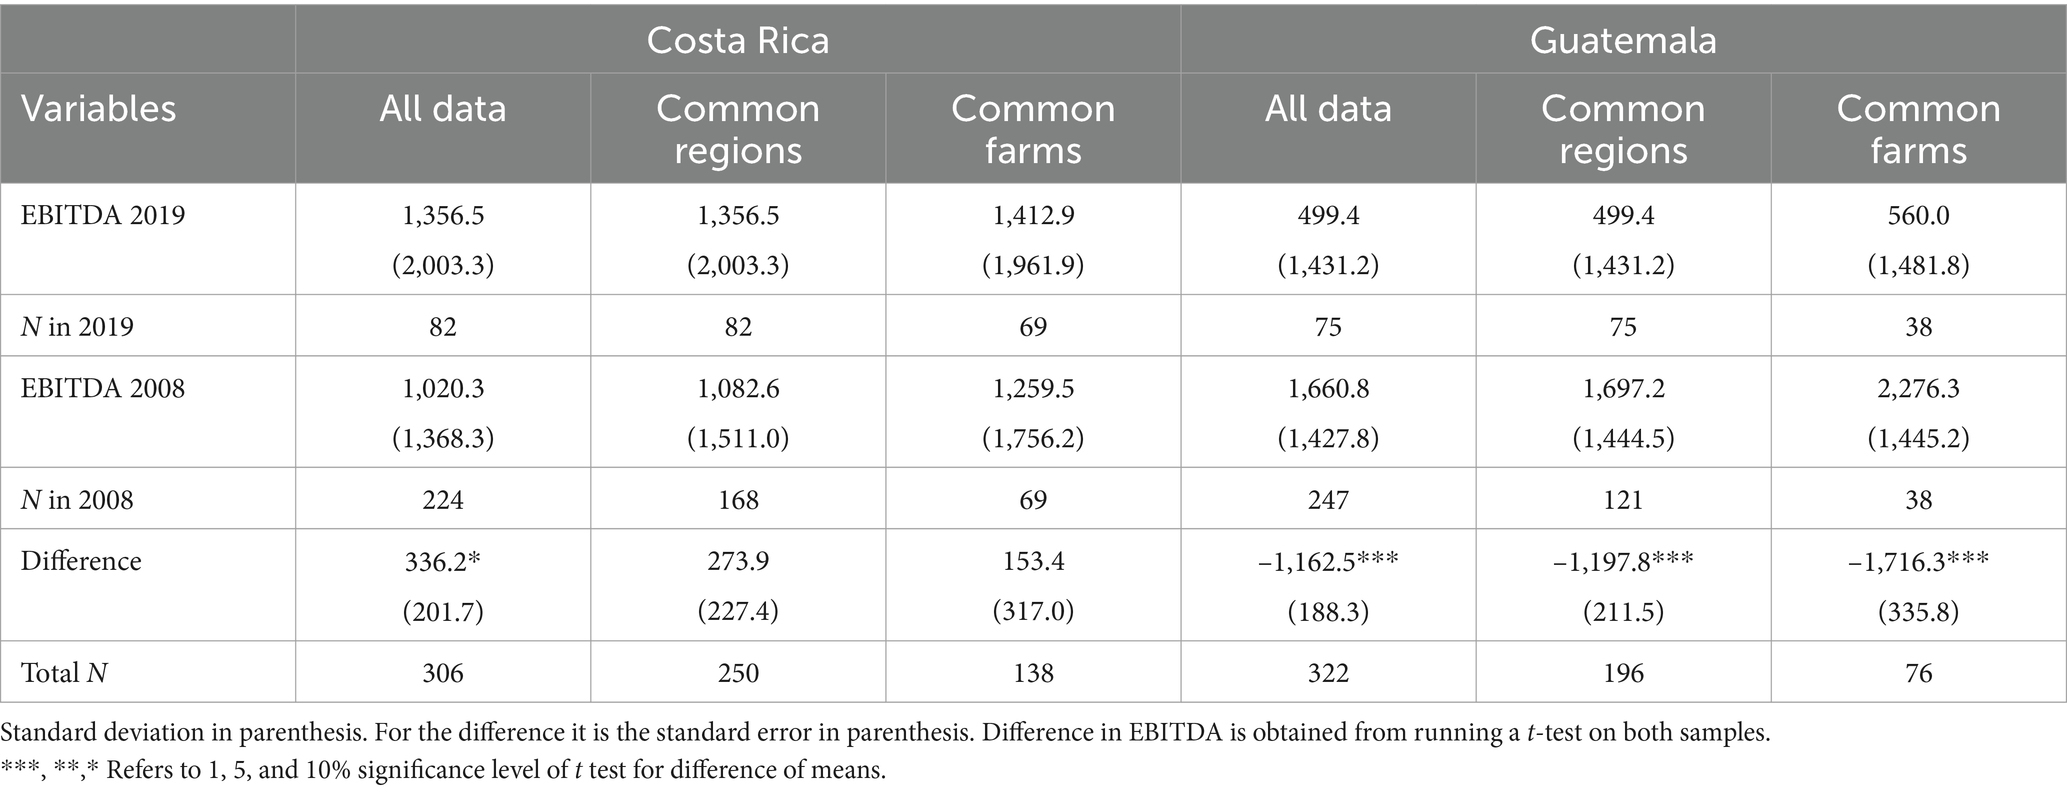
Table 1. EBIDTA - earnings before interest, taxes, depreciation and amortization - (USD per hectare) from coffee production averaged for all farms surveyed in each country in each year, those farms found in the regions in common between the two survey years, and those farms in common between the two surveys.
3.2 Drivers of changes in EBITDA
In 2008 the mean EBITDA from coffee producers in Guatemala was 180% that of Costa Rica, but by 2019 it had fallen to only 40%. This change is due to a large and statistically significant drop in EBITDA in Guatemala (i.e., a drop of 75%) compared to a small and non-statistically significant increase of EBITDA in Costa Rica (Figure 1A).
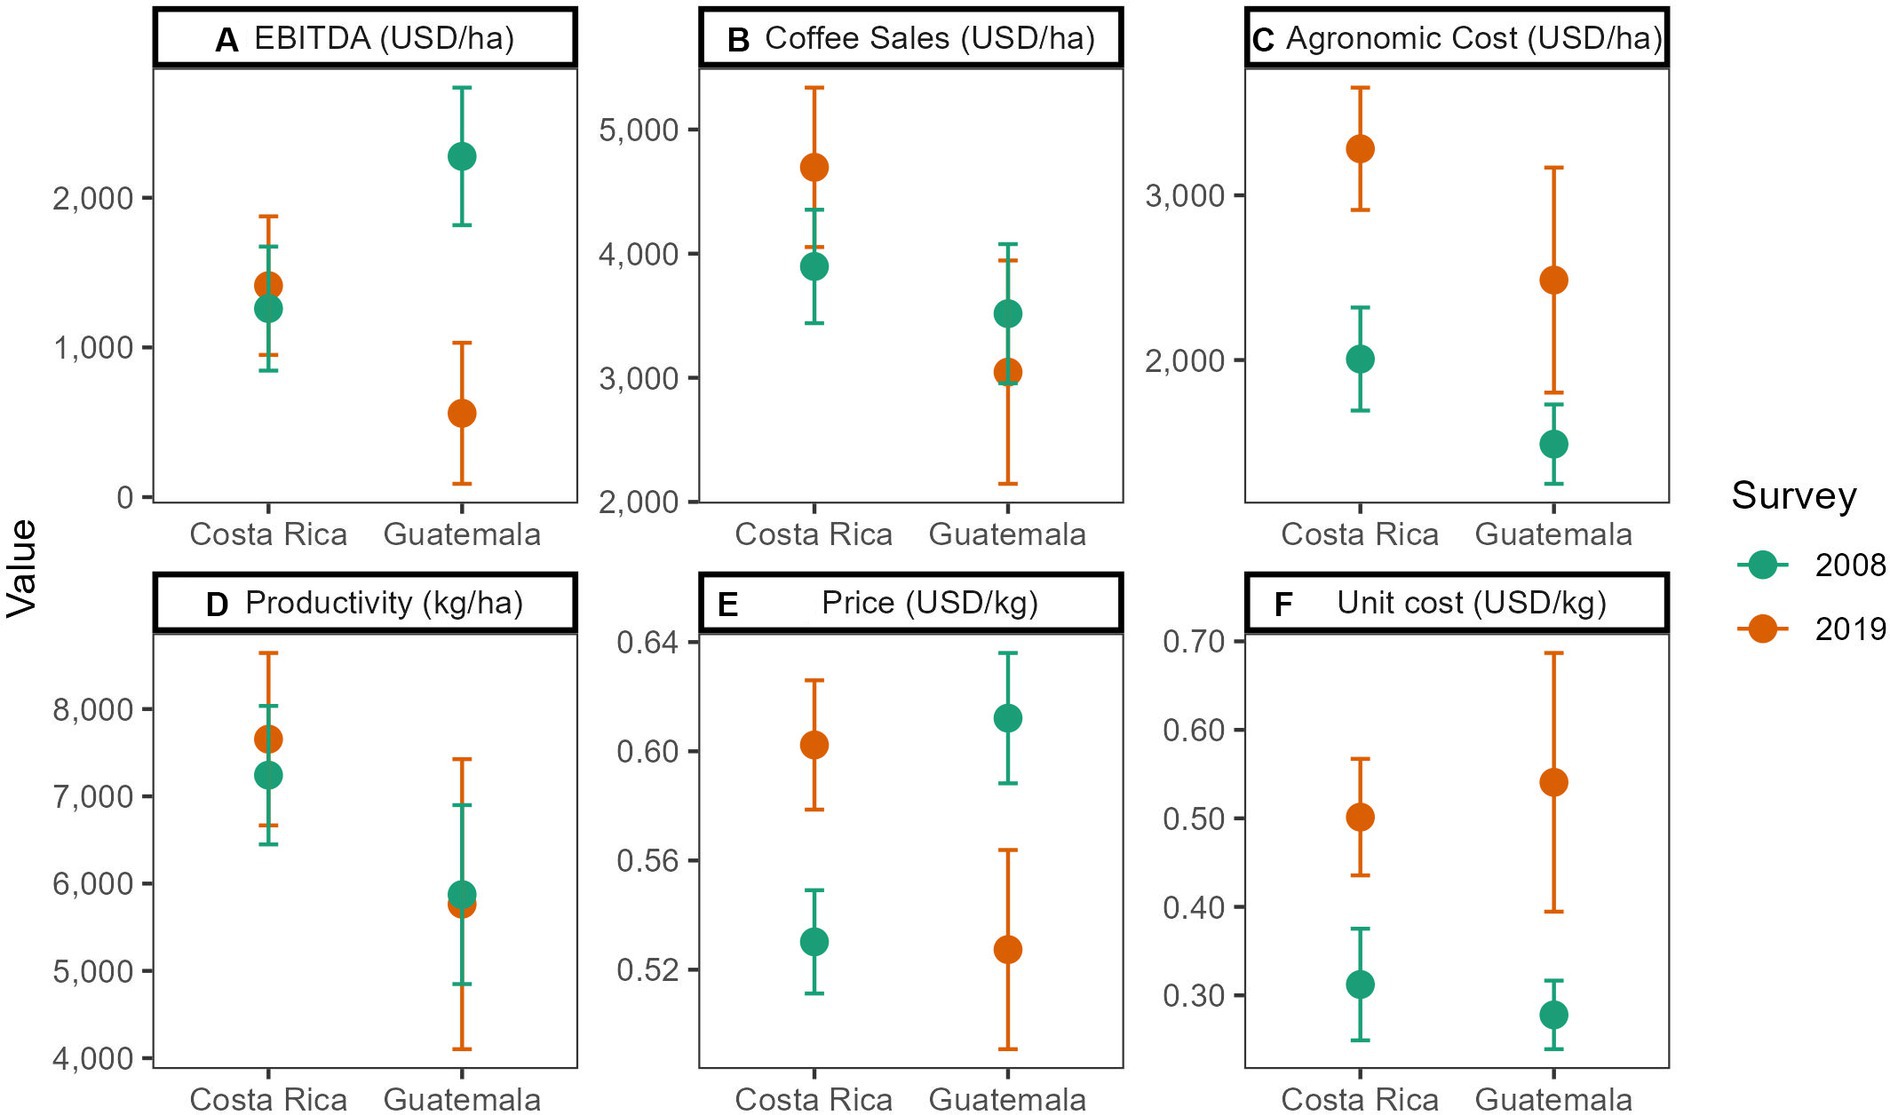
Figure 1. EBITDA, coffee sales, agronomic costs, production per hectare, price and unit cost for Costa Rica and Guatemala in 2008 and 2019 (same farms; error bars represent 95% confidence intervals).
The contrasting dynamic of EBITDA seems to come from coffee sales falling in Guatemala and rising in Costa Rica, despite the changes being not statistically significant (Figure 1B). Costs rose in both countries by similar amounts in absolute and relative terms, which were statistically significant (Figure 1C). In Guatemala agronomic costs increased by USD 995 and 66% while in Costa Rica the increase was of USD 1276 and 64%.
Although not significantly, gross income from coffee sales rose in Costa Rica but fell in Guatemala due to changes in coffee prices (Figure 1E), while productivity remained unchanged in both countries. Guatemala experienced a statistically significant drop in price of 13.8%, while Costa Rica had a statistically significant increase of 13.6%. Thus, while in 2008 Guatemala farmers obtained $0.082/kg of coffee cherries more than Costa Rican farmers (15.4% difference), by 2019 this had inverted with Costa Rican farmers receiving $0.075/kg of coffee cherries more than Guatemala (14.2% difference). Both agronomic costs per ha and unit costs per kg of coffee increased in both countries with statistical significance and by similar amounts (Figures 1C,F). What is different between countries is that Guatemala also experienced an increase in variability of unit and agronomic costs suggesting differing responses among farmers in the country. A deeper understanding of this variability can be found exploring the main components of the total agronomic cost per hectare as presented in Figure 2.
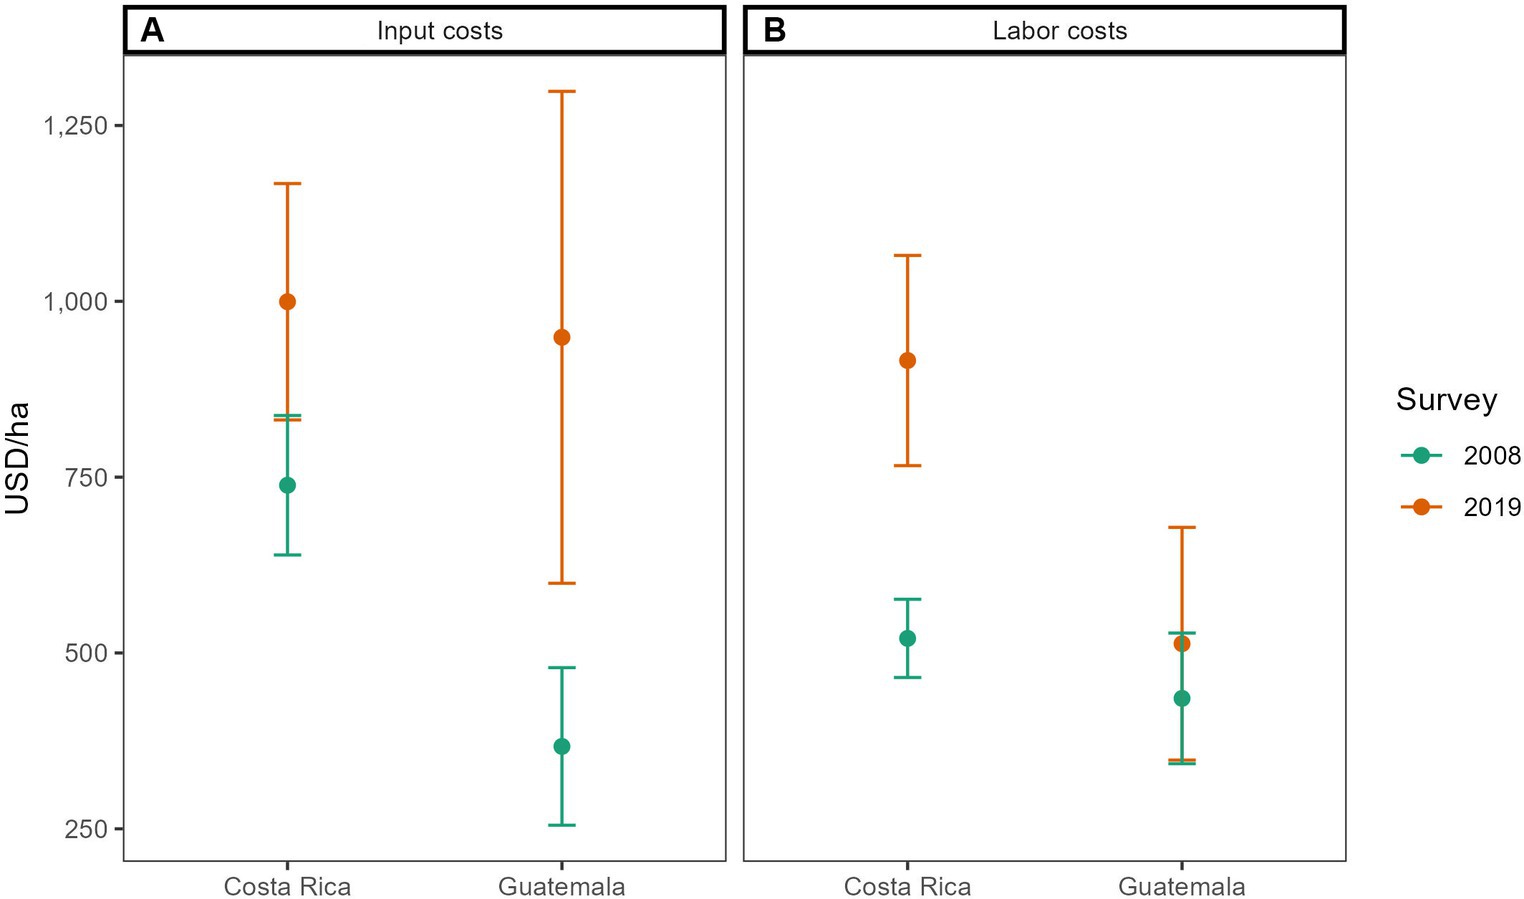
Figure 2. Input and labor costs per hectare for Costa Rica and Guatemala in 2008 and 2019 (same farms; error bars represent 95% confidence intervals).
Mean input costs increased in both countries with statistical significance, yet rose considerably more in Guatemala (158%) than Costa Rica (35%) (Figure 2A). Moreover, the variability in Guatemala increased sharply, indicating that the increased investment in inputs was not uniform across farms. On the other hand, mean labor costs increased significantly only in Costa Rica by 76%, while variability increased in both countries (Figure 2B). This suggests that the increase in agronomic cost in Costa Rica was driven by labor costs, while Guatemala’s increase in levels and variability was mostly driven by input costs.
Further insights can be found exploring the components of the total cost per hectare as presented in Figure 3.
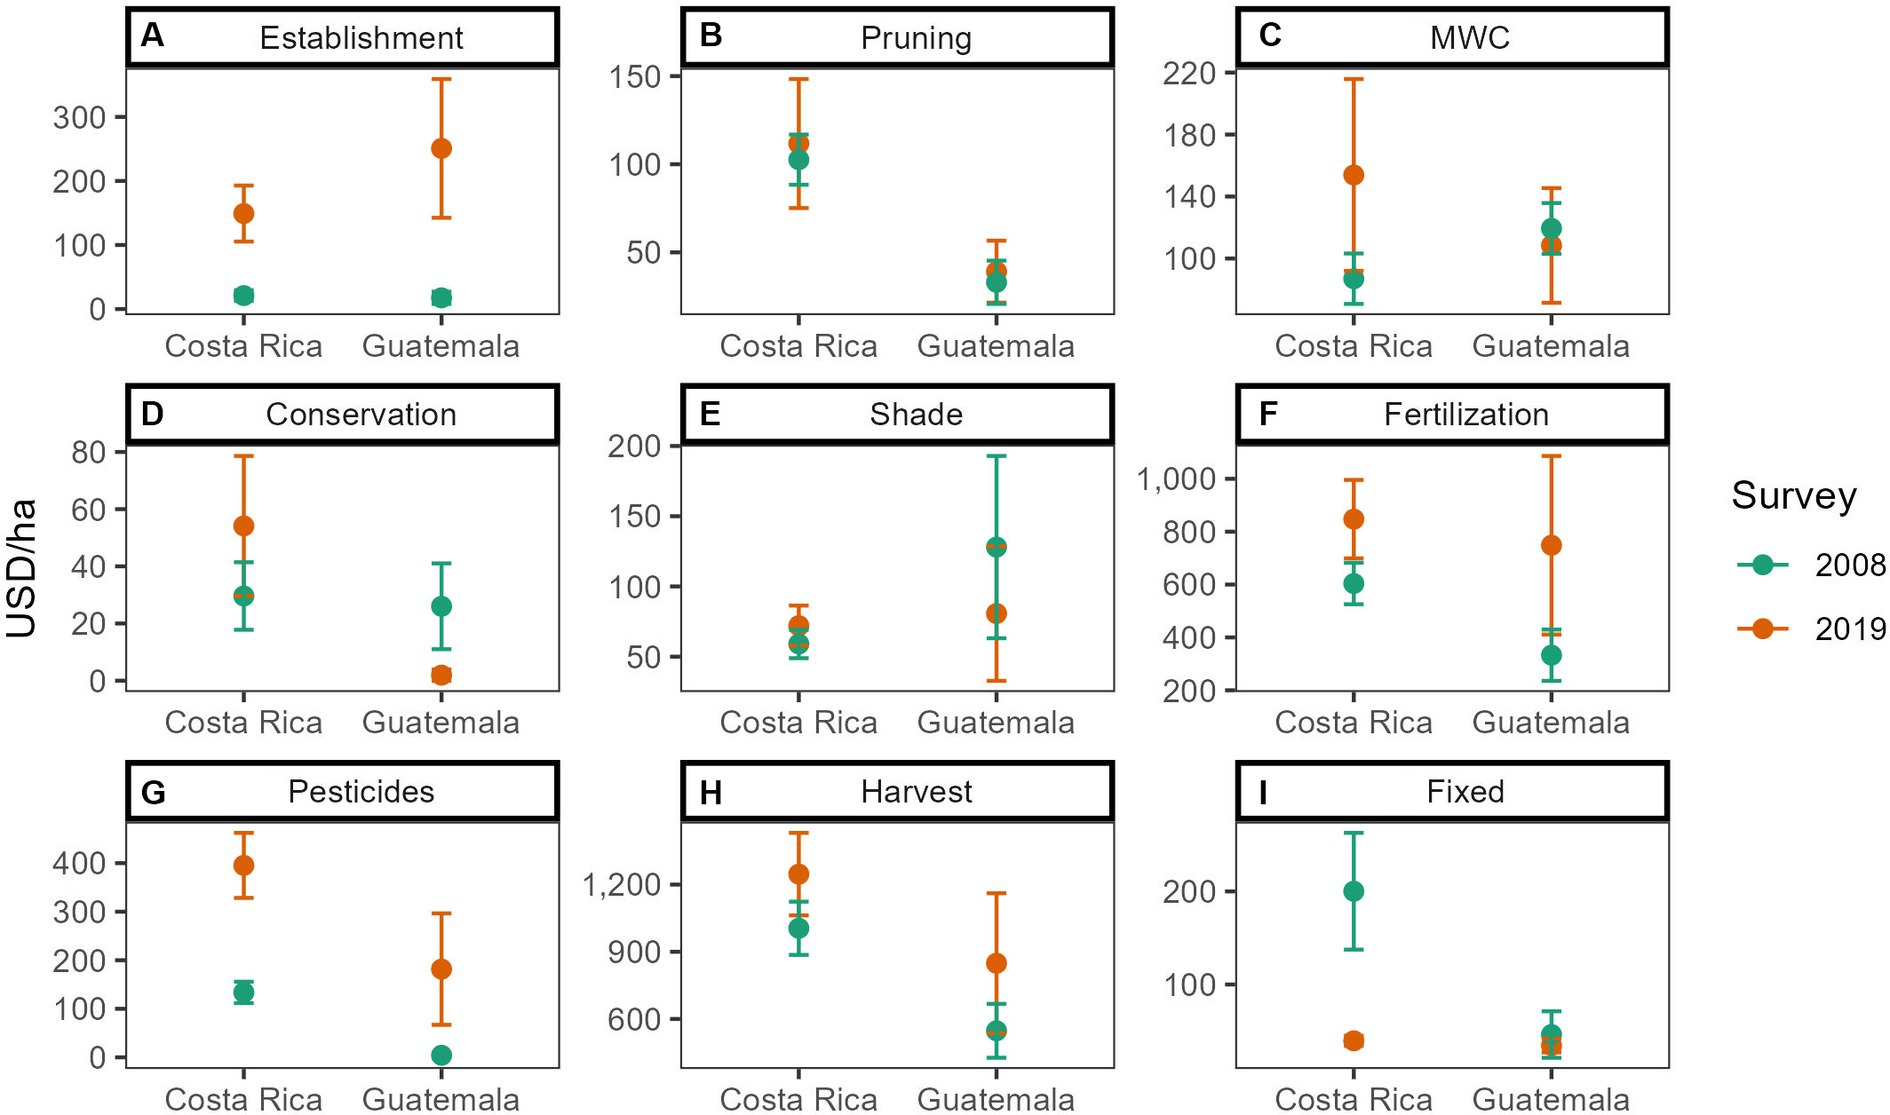
Figure 3. Decomposition of total cost per hectare for Costa Rica and Guatemala in 2008 and 2019 (same farms; error bars represent 95% confidence intervals).
Statistically significant increases in mean costs are found for both countries in the establishment of new plantations, the use of fertilization, and the use of pesticides. These increases in means are accompanied by a notable increase in variability, especially in Guatemala. In the case of fertilization in Guatemala, the increase in variability makes the increase statistically significant only at the 10% level of significance. Establishment costs increased by 1,516% in Guatemala and 669% in Costa Rica, fertilizer cost by 123% in Guatemala and 40% in Costa Rica, and pesticide costs by 4,126% in Guatemala and 196% in Costa Rica. Harvest cost also increased, albeit with lower statistical significance, by 53% in Guatemala and 24% in Costa Rica. This may in part be due to a larger percentage increase in production per hectare in Guatemala than Costa Rica, although overall production costs per hectare was higher in Costa Rica than Guatemala (Figure 1D). Lastly, in Costa Rica there was a notable increase in manual weed control costs, which while not statistically significant explains the larger increase in labor costs in Costa Rica (Figure 3C).
3.3 Farm characteristics associated with differences in EBITDA
Multiple regression models showed the same differences between survey years in production per hectare, unit cost of production, price, and resulting EBITDA as indicated above (Table 2). Production per hectare was significantly and positively associated with altitude in both countries and with certification in Guatemala but was negatively associated with farmers being part of an association in Guatemala (Table 2A). Coffee price was positively associated with altitude and farm size in Costa Rica, and with certification in Guatemala (Table 2B). Costs of production of a kilogram of coffee were negatively associated with altitude in Costa. These effects combined led to higher altitude and larger farm size significantly and positively affecting EBIDTA in Costa Rica, and certification significantly and positively affecting EBIDTA in Guatemala. There was a weakly significant negative effect of association on EBIDTA in Guatemala which is likely an effect of the low production per hectare of associated farmers, but it is not possible to determine whether this is because low productivity farmers tend to be members of associations, or being a member of an association somehow leads to lower productivity. It should be noted that in many cases to be certified farmers need to be members of an association (and there is a certain correlation between the two rho = 0.33), but that the variance associated with certification has been allocated as a separate variable.
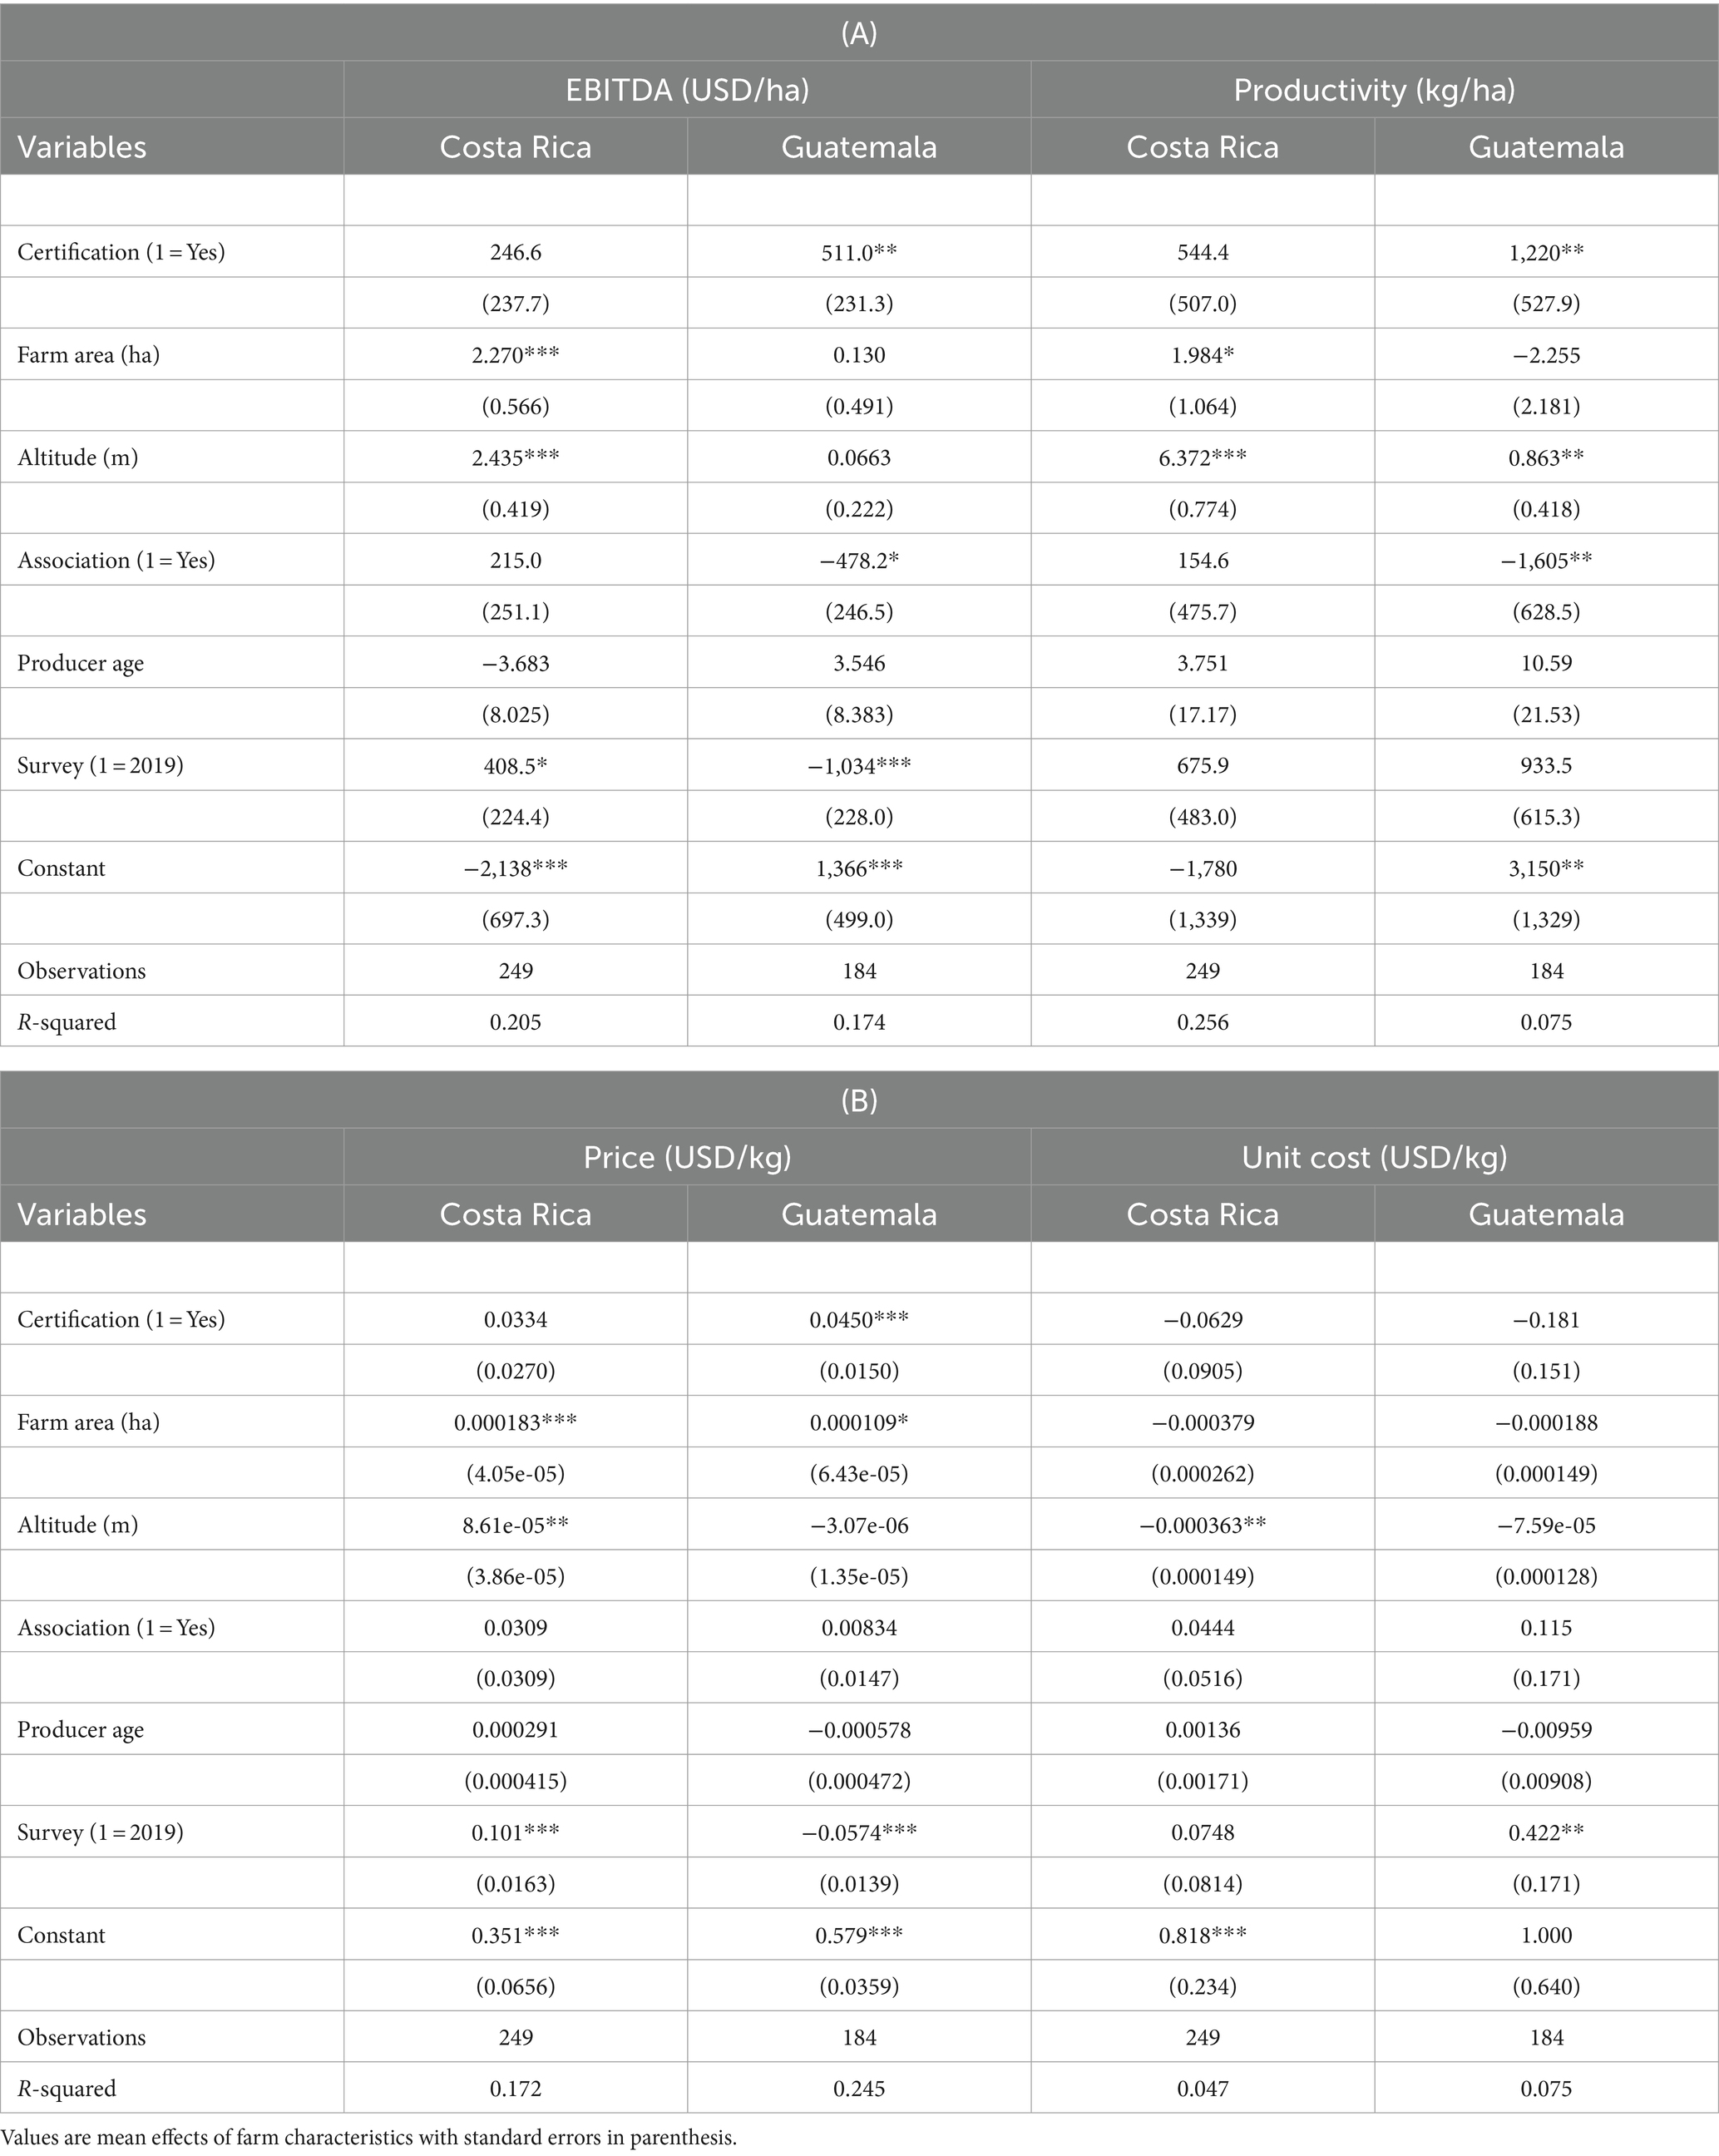
Table 2. Influence of farm characteristics on (A) EBITDA and coffee productivity, and (B) coffee price and unit costs of production based on all farms in regions present in both surveys.
3.4 Changes in EBIDTA and economics of production for different farm typology groups
The EBIDTA of farms in different typology groups representing different production strategies were significantly different in both countries (Table 3A), and thus indicate that the responses described above were not uniform across all farm types. High productivity Medium Shade had the highest EBIDTA in both countries although not statistically different from Medium Productivity Medium Shade in Guatemala. Low Productivity High Shade EBIDTA was not statistically different from Medium Productivity Medium/Low Shade in both countries, but was significantly higher than Very Low Productivity Low Shade in Costa Rica. Differences in EBIDTA between typology groups were closely related to productivity (as productivity was the main factor the groups were based upon). The price received for coffee was similar across typology groups except for Very Low Productivity Low Shade in Costa Rica which received a significantly lower price than Low Productivity High Shade. Unit costs of producing a kilogram of coffee were significantly higher for very low productivity groups in both countries compared to high and medium productivity groups.
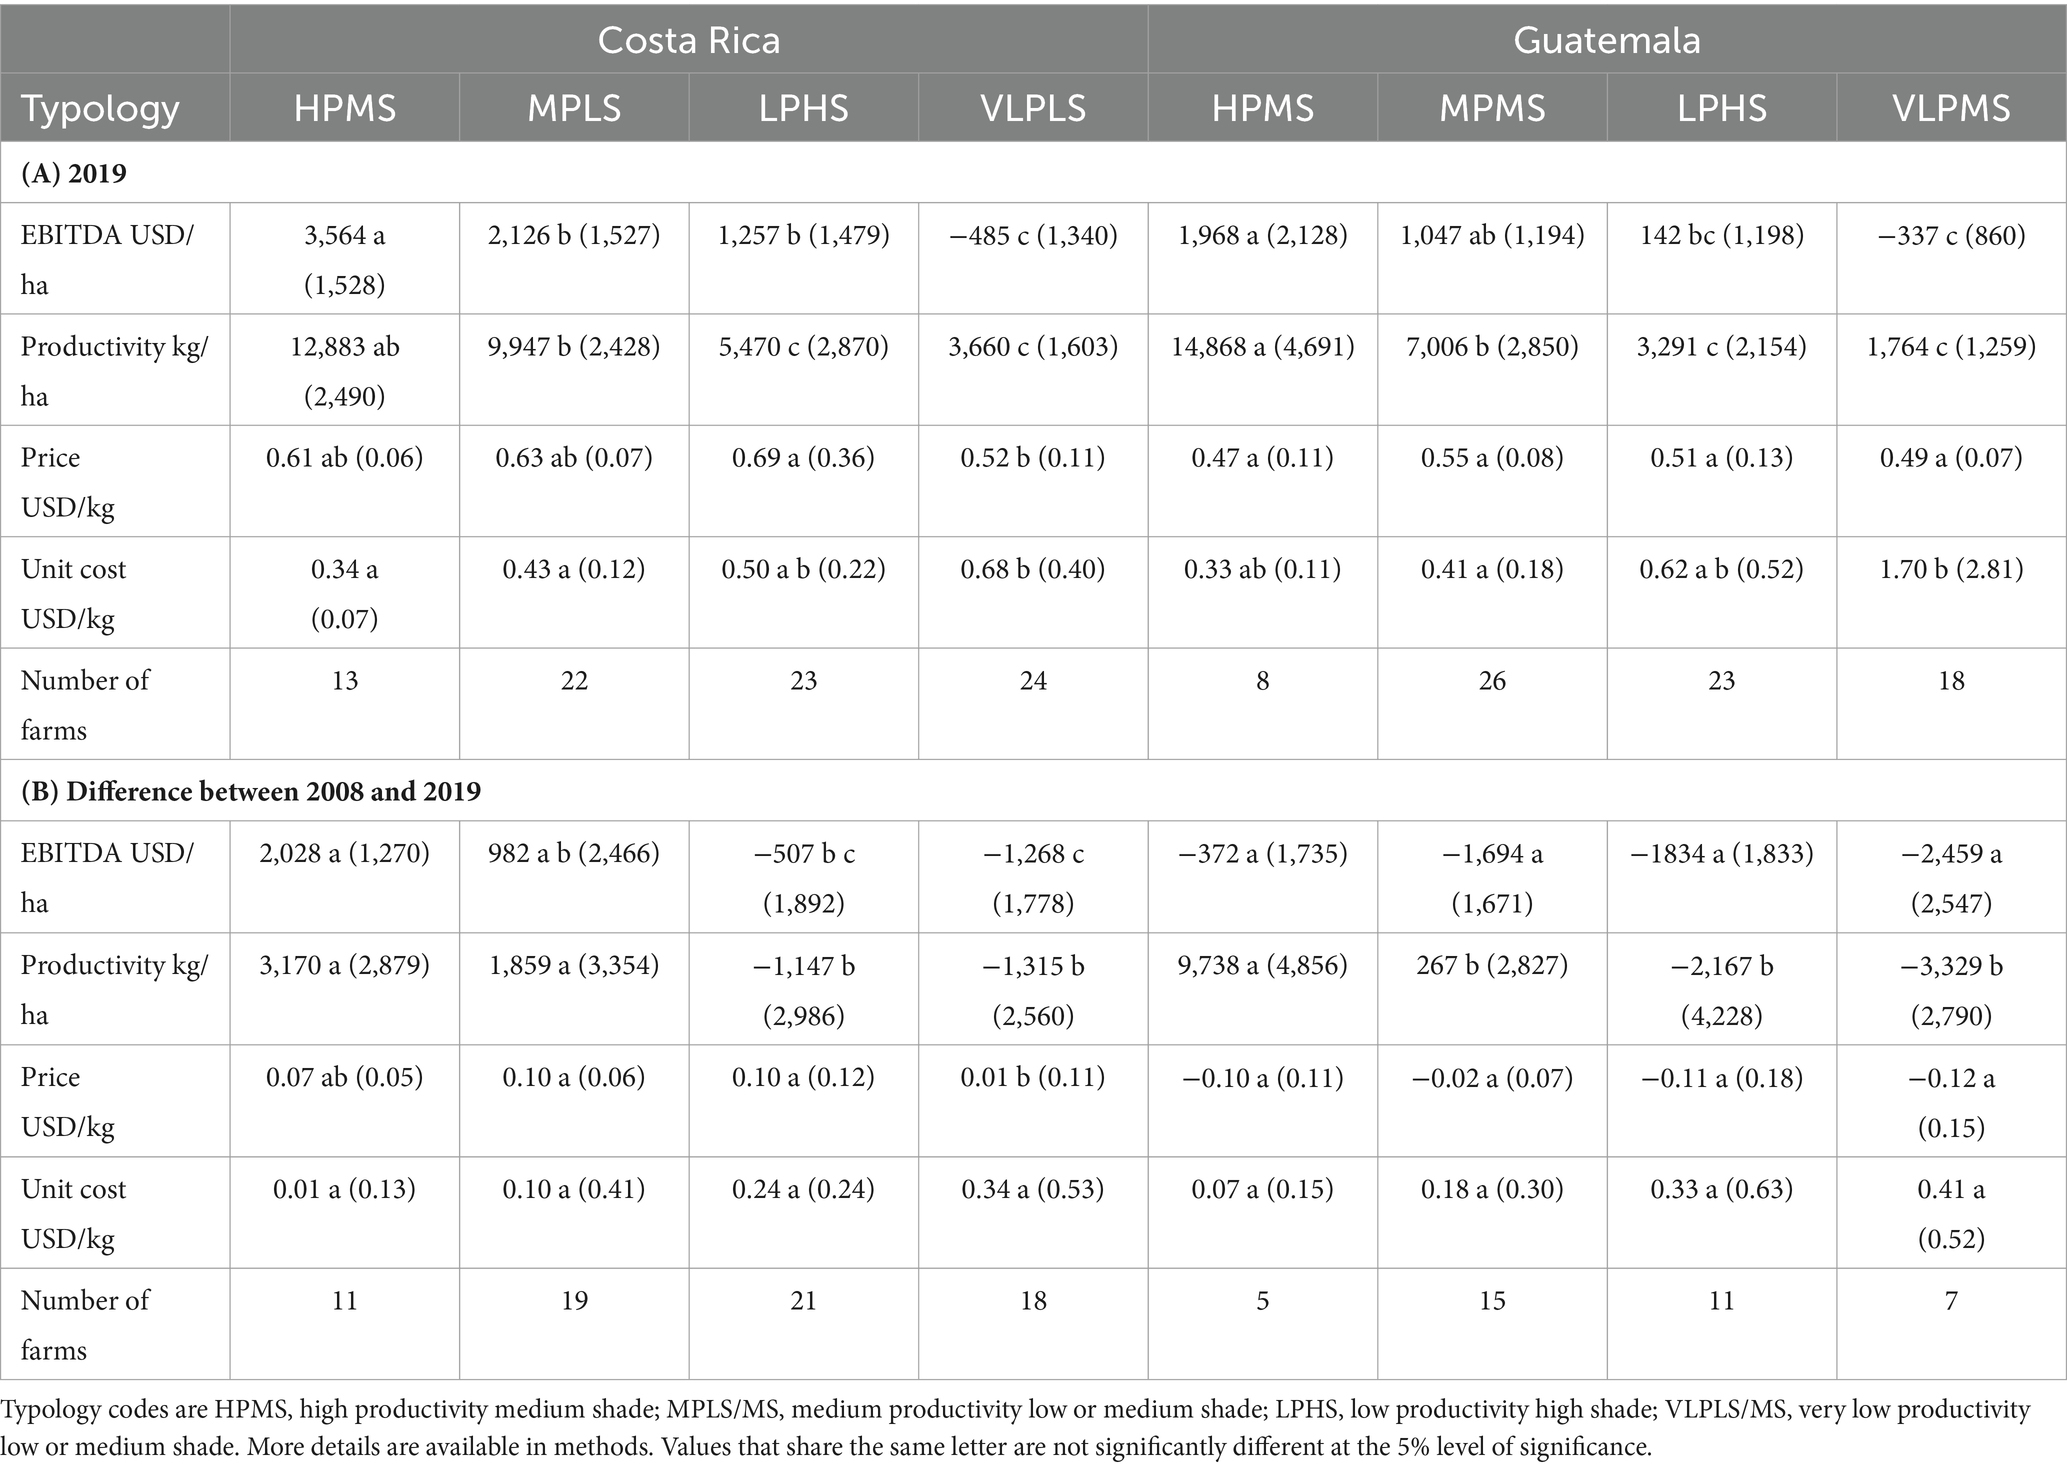
Table 3. Economic performance of coffee farms by typology grouping for (A) all farms in 2019 and (B) change between 2008 and 2019 for those farms in both surveys.
Changes in EBIDTA between 2008 and 2019 were only positive for High and Medium productivity farms in Costa Rica (Table 3B). The other typology groups in Costa Rica and all Guatemalan groups in Guatemala had reduced EBIDTA between these two dates. There were no statistically significant differences between typology groups in Guatemala probably due to the small sample size for paired farms. The changes in EBIDTA were again partially related to changes in productivity with high and medium productivity groups in both countries experiencing increases in productivity compared to declines for Low and very low productivity groups (although not statistically significant for medium productivity from those with reduced productivity in Guatemala). All groups in Costa Rica except the very low productivity group had significant increases in price received for coffee, while all the groups in Guatemala experienced declines in price received.
4 Discussion
As claimed by other studies (e.g., ICO, 2019; Sachs et al., 2019) agronomic costs of production per hectare have increased by about 30–60% due to both increases in labor and input costs in both countries, even when costs are dollarized and adjusted for inflation. However, these differences integrate both increased unit costs and increased investment in production. The daily rate for labor increased by 31% (from US$ 5.2 to 6.8/day) in Guatemala and 71% in Costa Rica (from US$ 9.3 to 15.9/day). While the cost of the main fertilizers used decreased by 10–22% in Guatemala and 11–29% in Costa Rica, with very similar costs in the two countries [it should be noted that there was a sharp rise in fertilizer prices in 2008 prior to the economic crash (Hedebrand and Laborde, 2022)]. The decrease in unit costs of fertilizer but increase in total fertilizer costs indicates that in both countries farmers increased the rate of fertilization. Although production per hectare on average remained the same in both countries there was high and medium productivity farms increased their productivity while on low and very low productivity farms productivity declined. This may represent two different responses by farmers to increasing costs, one to reduce investment in production and the other to increase investment, especially in fertilizer, to boost production and thus increase income. Analysis by Lalani et al. (2023) found that the high productivity group was the most profitable across a range of input and labor cost scenarios.
Both countries were investing considerably more in establishment of coffee plantations in 2019 than 2008, possibly due to impacts of the coffee rust outbreak in 2013. Furthermore, Guatemalan farms are investing relatively more than their Costa Rican counterparts. This indicates that Guatemalan farms have a larger area of new as yet unproductive coffee, which would reduce farm-level production per hectare of coffee plantation. As this probably only affects a proportion of farms it probably also contributes to the high variability in cost per kilogram produced due to the additional costs from establishment of new plantings being included in some cases.
The positive economic impact of Costa Rican farmers intensifying production appears to contradict conclusions from the systematic review of Jezeer et al. (2017) that lower intensity production systems were more profitable. The economic performance of the production strategies from the typology were analyzed by Lalani et al. (2023) demonstrating that high input but also moderately shaded coffee generated the highest net, but if there was a 50% fall in coffee prices then high input production had the greatest losses. In contrast low-input highly shaded coffee had lower returns under the labor and input cost variations tested but generated the lowest losses if coffee prices crashed. It needs to be assessed whether the higher use of fertilizer by Costa Rican farmers can be sustained with the doubling of fertilizer costs that occurred in 2022 (Hedebrand & Laborde, 2022), which was greater than the 50% increase modeled by Lalani et al. (2023).
Other factors that appear to support reducing production costs and increasing EBIDTA are higher altitude and larger farm size (both in Costa Rica), and certification in Guatemala. Haggar et al. (2017) also found in Nicaragua that farmers under some certifications achieved a greater EBIDTA than their matched peers. Unfortunately, altitude and farm size are not factors farmers can easily change, and certification requires investment and close alliance with private traders or trading farmer cooperatives. Nevertheless, Wollni and Zeller (2007) found that farmers in Costa Rica do benefit from price differentials associated with specialty markets and that cooperative association was an important means for them to access those markets.
In terms of impact on EBIDTA, the differences in prices received by farmers in Costa Rica and Guatemala probably has the greatest impact. In 2008 farmers in Guatemala reported farm gate prices 10% higher than in Costa Rica, but by 2019 this had substantially reversed. The 2008 differences in the farm gate prices are similar to those reported on the ICO website (https://www.ico.org/new_historical.asp accessed August 2022), with prices of USD 1.11 vs. USD 1.06 per lb. green coffee in Guatemala and Costa Rica, respectively (note our prices are quoted as USD per kg of coffee cherries), and thus not a sampling effect. Unfortunately no comparable data are available for 2019. Estimates of average export prices taken from the United Nations COMTRADE database (https://comtrade.un.org/data/, accessed July 2022) indicate that the average coffee export prices for Guatemala and Costa Rica were USD 2.81 versus USD 3.07 per kilo green coffee in 2008, and USD 3.09 versus USD 4.38 per kilo green coffee in 2019. It should be noted that these prices have not been adjusted for inflation, unlike the prices shown in Figure 3, if a similar adjustment is made to these prices it would also show a lower inflation-adjusted price in 2019 of USD 2.06 for Guatemala yet still a higher one of USD 3.69 for Costa Rica in agreement with the data used in this study. Thus the farm-gate prices reported to us by farmers correspond to and are likely a result of differences in export prices. The USDA Global Agricultural Information Network annual reports indicate similar export prices for 2019 of USD 3.33–3.66 per kilo for Guatemala and USD 4.35 per kilo for Costa Rica (https://www.fas.usda.gov/data/costa-rica-coffee-annual-6, https://www.fas.usda.gov/data/guatemala-coffee-annual-5); this against world market prices for “other milds” as reported by ICO (https://www.ico.org/new_historical.asp accessed August 2022) for 2008 and 2019 of USD 3.07 and USD 2.87 per kilo green coffee. Thus, both countries had managed to improve export prices compared to market trends, though Costa Rica managed to increase its export price differential substantially more during this period.
Nevertheless, production and export of coffee in Costa Rica has declined (from over 2.2 million sacks in early 2000s, to 1.8 million 2011/2012 to just over 1.4 million sacks 2018/19), while in Guatemala it has more or less been maintained fluctuating between 3.2 and 4.0 million sacks between 2000 and 2019 (https://www.ico.org/new_historical.asp accessed August 2022). Indeed in 2018/19 Guatemala maintained production of about 3.7 million sacks, while Costa Rican production was below average compared to the previous decade. This may have increased prices internally in Costa Rica as exporters competed for coffee to meet their contracts with buyers. The Specialty Coffee Transaction Guide: 2022 (www.transactionguide.coffee) developed by researchers from Emory University summarizes contract values for specialty coffee between 2019 and 2022 calculated a median price for Costa Rica of USD 3.65 per pound compared to USD 3.00 for Guatemala, this despite Guatemala having a slightly higher median quality score. It has been noted that Costa Rican producers have invested in many micro-mills to process and sell high quality micro-lots at substantially higher prices, but also maintaining a reputation for environmental and social standards as well as product quality (USDA, 2022). Thus, Costa Rican farmers and their organizations have taken the next step from simply accessing markets that provide specialty prices (as reported by Wollni and Zeller, 2007) to now adding further value through micro-processing for direct sales to specialist roasters. As Jacobi et al. (2024) found in Colombia and Bolivia, direct sales of coffee to international buyers or even local markets provide the greatest economic benefits to farmers.
5 Conclusion
Without doubt increased production costs, and above all labor costs have affected the economics of coffee production in the two countries studied. However, it is notable that while labor costs in Costa Rica are about double that in Guatemala, Costa Rican farmers have been able to maintain their profitability better than Guatemalan farmers. In part this seems to be due to some groups of Costa Rican farmers having achieved higher productivity through higher investment, indeed only high and medium productivity farms had increased EBITDA. However, this investment has been substantially supported by increases in prices received by most Costa Rican farmers, while prices received in Guatemala declined. Indeed, high productivity Guatemalan farmers who invested in increasing productivity did not benefit economically due to the lower price they received for their coffee. Higher prices in Costa Rica have been supported by a reduction in the volume of coffee offered by Costa Rica, but also by higher social and environmental standards, and increases in direct sales and sales of processed coffee. This demonstrates the role of buyers and consumers paying prices that appropriately compensate the costs of production and provide a living income to farmers. Ultimately the higher prices received by Costa Rican farmers is probably what has enabled them to maintain or even increase coffee productivity while paying substantially higher wages compared to other countries in the region such as Guatemala.
Data availability statement
The raw data supporting the conclusions of this article will be made available by the authors, without undue reservation.
Ethics statement
Ethics procedures of the University of Greenwich and the Centro Agronómico Tropical de Investigación y Enseñanza were followed, ensuring prior informed consent of all participants.
Author contributions
BL: Formal analysis, Investigation, Methodology, Writing – original draft, Writing – review & editing. FC: Data curation, Formal analysis, Investigation, Methodology, Supervision, Writing – review & editing. AV: Data curation, Formal analysis, Investigation, Writing – review & editing. JH: Conceptualization, Funding acquisition, Methodology, Writing – original draft, Writing – review & editing.
Funding
The author(s) declare that financial support was received for the research, authorship, and/or publication of this article. The 2019/20 data was collected as part of research was funded by the UK Research and Innovation Biotechnology and Biological Sciences Research Council (UKRI/BBSRC), from the Global Challenges Research Fund (GCRF) under the Agri-systems research to enhance rural livelihoods in developing countries programme, grant number BB/S01490X/1. The 2008 data was collected by the EC funded project “CAFNET: Connecting, enhancing and sustaining environmental services and market values of coffee agroforestry in Central America, East Africa and India” EuropeAid/ENV/2006/114-382/TPS.
Acknowledgments
The study was led by Gabriela Soto and Eduardo Corrales. Both surveys received the institutional support of the National Coffee Association of Guatemala (ANACAFE) and the Institute for Coffee in Costa Rica (ICAFE), as well as the many coffee farmers who gave their time to enable us to conduct this research.
Conflict of interest
The authors declare that the research was conducted in the absence of any commercial or financial relationships that could be construed as a potential conflict of interest.
Publisher’s note
All claims expressed in this article are solely those of the authors and do not necessarily represent those of their affiliated organizations, or those of the publisher, the editors and the reviewers. Any product that may be evaluated in this article, or claim that may be made by its manufacturer, is not guaranteed or endorsed by the publisher.
References
Bacon, C. (2008). “Confronting the coffee crisis: can fair trade, organic and specialty coffees reduce the vulnerability of small-scale farmers in northern Nicaragua?” in Confronting the coffee crisis: Fair trade, sustainable livelihoods and ecosystems in Mexico and Central America. eds. C. M. Bacon, V. E. Mendez, S. R. Gliessman, and J. A. Fox (Cambridge, MA: MIT), 155–178.
Castro, F., Montes, E., and Raine, M. (2004). “La crisis cafetalera: Efectos y estrategias para hacerle frente” in Sustainable development working paper 23 (The World Bank: Washington).
CEPAL (2002). Centroamérica: El impacto de la caída de los precios de café en 2001. Chile: Comisión Económica para América Latina y el Caribe.
Cordes, KY, Sagan, M, and Kennedy, S. (2021). “Responsible coffee sourcing: towards a living income for producers,” Columbia Center on Sustainable Investment. Available at: https://scholarship.law.columbia.edu/cgi/viewcontent.cgi?article=1198&context=sustainable_investment_staffpubs
Enveritas. (2019). How many coffee farmers are there? Global coffee farm study. Available at: https://carto.com/blog/enveritas-coffee-poverty-visualization/ (Accessed June 16, 2023).
Giovannucci, D., and Potts, J. (2008). Seeking sustainability: COSA preliminary analysis of sustainability initiatives in the coffee sector. Winnipeg, Canada: IISD, 37.
Haggar, J., Casanoves, F., Cerda, R., Cerretelli, S., Gonzalez, S., Lanza, G., et al. (2021). Shade and agronomic intensification in coffee agroforestry systems: trade-off or synergy? Front. Sustain. Food Syst. 5:645958. doi: 10.3389/fsufs.2021.645958
Haggar, J., Soto, G., Casanoves, F., and de Melo, V. E. (2017). Environmental-economic trade-offs and benefits of sustainably certified coffee farms. Ecol. Indic. 79, 330–337. doi: 10.1016/j.ecolind.2017.04.023
Hedebrand, C, and Laborde, D (2022). High fertilizer prices contribute to rising global food security concerns. Available at: https://www.ifpri.org/blog/high-fertilizer-prices-contribute-rising-global-food-security-concerns (Accessed June 16, 2023).
ICO. (2019). Coffee development report 2019: growing for prosperity – economic viability as the catalyst for a sustainable coffee sector. Available at: https://www.internationalcoffeecouncil.org/eng/coffee-development-report.php
ICO and UNIDO. (2024) Sustainability and resilience of the coffee global value chain: towards a coffee investment vehicle. Available at: https://www.unido.org/news/unido-and-ico-publish-report-sustainability-resilience-coffee-global-value-chain-towards-global-investment-vehicle (Accessed June 21, 2024).
IDH. (2020) Task force for coffee living income. Available at: https://www.idhsustainabletrade.com/publication/task-force-for-coffee-living-income-report-summary (Accessed June 21, 2024).
Jacobi, J., Lara, D., Opitz, S., de Castelberg, S., Urioste, S., Irazoque, A., et al. (2024). Making specialty coffee and coffee-cherry value chains work for family farmers’ livelihoods: a participatory action research approach. World Dev. Perspect. 33:100551. doi: 10.1016/j.wdp.2023.100551
Jezeer, R. E., Verweij, P. A., Santos, M. J., and Boot, R. G. A. (2017). Shaded coffee and cocoa – double dividend for biodiversity and small-scale farmers. Ecol. Econ. 140, 136–145. doi: 10.1016/j.ecolecon.2017.04.019
Lalani, B., Lanza, G., Leiva, B., Mercado, L., and Haggar, J. (2023). Shade versus intensification: trade-off or synergy for profitability in coffee agroforestry systems? Agric. Syst. 214:103814. doi: 10.1016/j.agsy.2023.103814
Sachs, J, Cordes, KY, Rising, J, Toledano, P, and Maennling, N. (2019). Ensuring economic viability and sustainability of coffee production. Columbia Center Sustain. Invest. doi: 10.2139/ssrn.3660936
Soto, G., Haggar, J, Le Coq, JF, Gonzalez, C, Soto, A, Casanoves, F, et al., (2011). Environmental and socioeconomic impact of organic coffee certification in Central America as compared with other certification seals. Pp. 120–123 in eds D Neuhoff, S Mok Sohn, C Ssekyewa, N Halberg, I Rasmussen, and J Hermansen, Organic is Life - Knowledge for Tomorrow. Volume 1 - Organic Crop Production. Proceedings of the Third Scientific Conference of the International Society of Organic Agriculture Research (ISOFAR)
The World Bank. (2024a). The World Bank in Guatemala: overview. Available at: https://www.worldbank.org/en/country/guatemala/overview
The World Bank. (2024b). The World Bank in Costa Rica: overview. Available at: https://www.worldbank.org/en/country/costarica/overview
USDA. (2022). Costa Rica: coffee annual. Report Number CS2022-CS0008. Available at: https://fas.usda.gov/data/costa-rica-coffee-annual-6
Wollni, M., and Zeller, M. (2007). Do farmers benefit from participating in specialty markets and cooperatives? The case of coffee marketing in Costa Rica. Agric. Econ. 37, 243–248. doi: 10.1111/j.1574-0862.2007.00270.x
Appendix
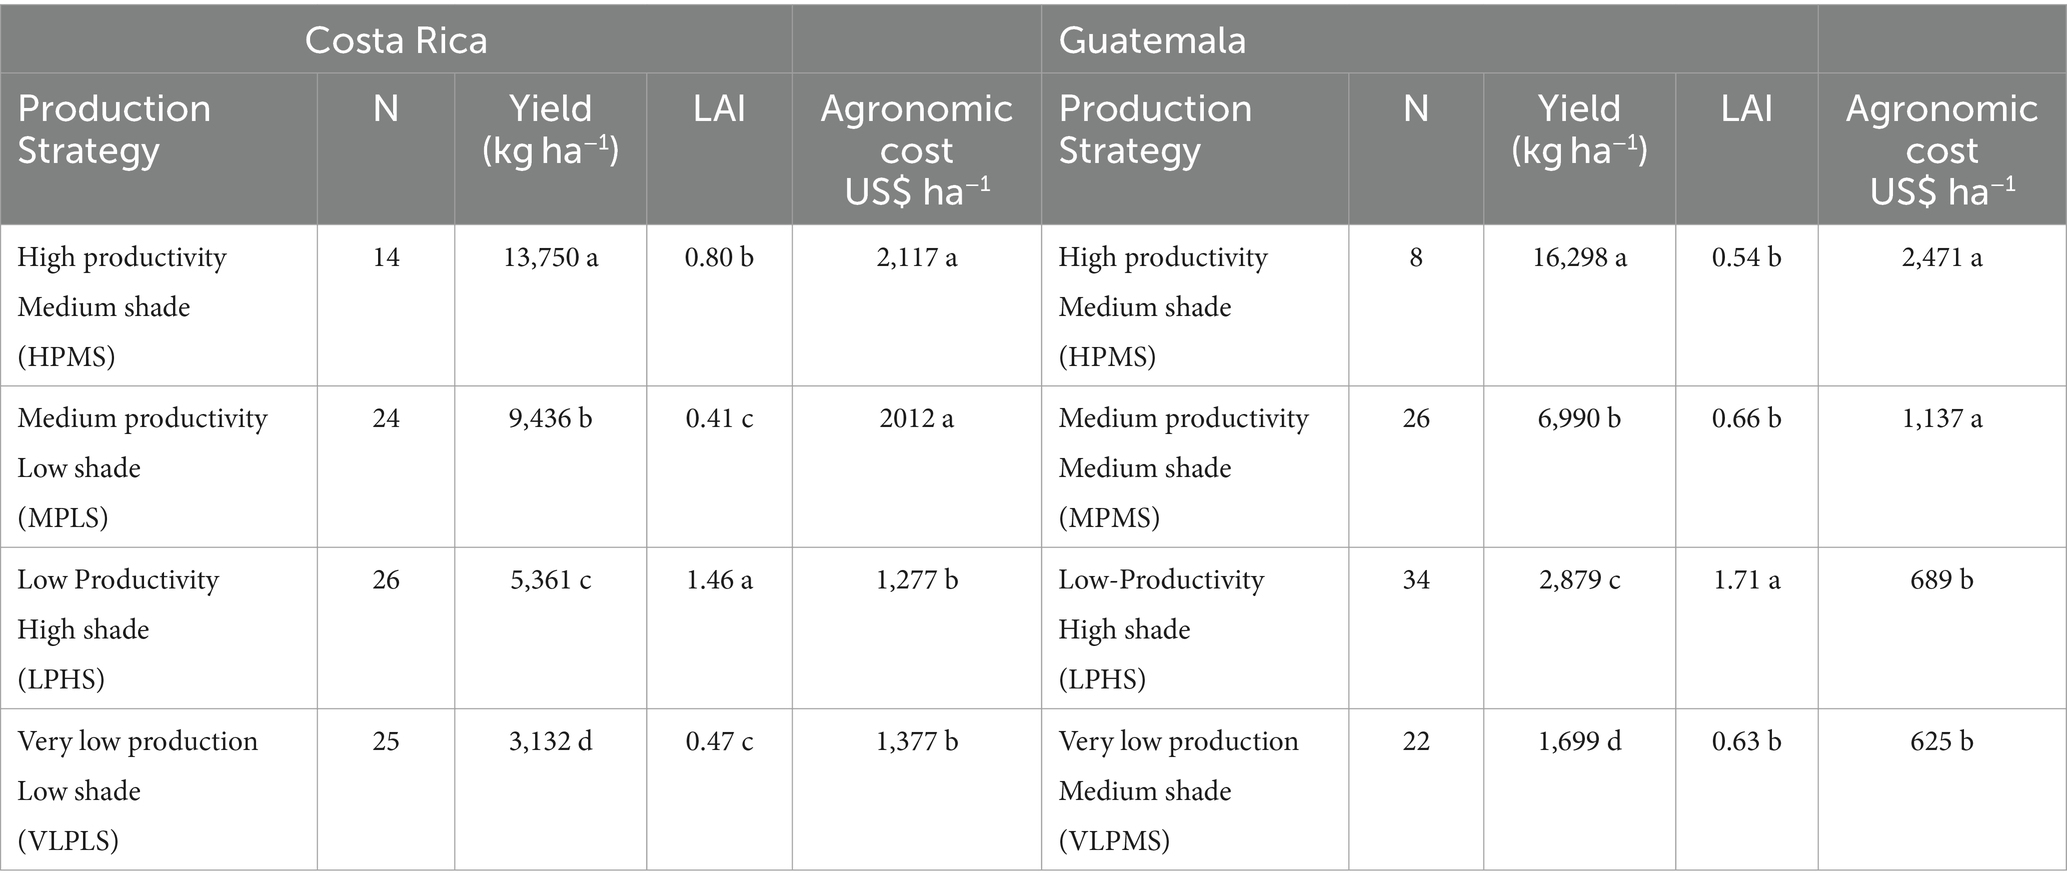
Table A1. Coffee production strategy according to productivity and shade level as assessed by LAI (Leaf Area Index) (N = number of farms in the group) [adapted from Haggar et al. (2021)].
Keywords: agronomic costs, coffee prices, Guatemala, Costa Rica, EBITDA, productivity
Citation: Leiva B, Vargas A, Casanoves F and Haggar J (2024) Changes in the economics of coffee production between 2008 and 2019: a tale of two Central American countries. Front. Sustain. Food Syst. 8:1376051. doi: 10.3389/fsufs.2024.1376051
Edited by:
Stephen Whitfield, University of Leeds, United KingdomReviewed by:
Hanis Hazwani Ahmad, Kolej Universiti Islam Perlis, MalaysiaCharles P. Staver, Independent researcher, Xalapa, Mexico
Copyright © 2024 Leiva, Vargas, Casanoves and Haggar. This is an open-access article distributed under the terms of the Creative Commons Attribution License (CC BY). The use, distribution or reproduction in other forums is permitted, provided the original author(s) and the copyright owner(s) are credited and that the original publication in this journal is cited, in accordance with accepted academic practice. No use, distribution or reproduction is permitted which does not comply with these terms.
*Correspondence: Jeremy Haggar, ai5wLmhhZ2dhckBncmVlbndpY2guYWMudWs=