 Jiaqi Zheng
 Huijing Yang
 Shanghong Li
 Li Chai3,4*
- 1Faculty of Business and Economics (Business School), University of Hong Kong, Hong Kong SAR, China
- 2School of Ecology and Environment, Renmin University of China, Beijing, China
- 3International College Beijing, China Agricultural University, Beijing, China
- 4College of Economics and Management, China Agricultural University, Beijing, China
The sustainable dietary transitions must account for the varied culinary traditions and regional food cultures to ensure a balanced and culturally sensitive approach. This study aims to explore the impact of regional preferences on culinary culture and examine ways to achieve environmentally friendly dietary transitions in China by considering the differences in the environmental burdens of various cuisines. We investigate the eight Chinese culinary traditions and depict their respective popularity in China at the city level via POI characterization based on ArcGIS. Water, carbon, and ecological footprints are selected to investigate the environmental performance of each type of cuisine. Results show that the eight cuisines vary significantly in spreads of influence and environmental performances. Chuan cuisine is the most widely disseminated cuisine with a relatively low environmental burden. The remaining seven cuisines have limited spreads of influence and are mainly distributed in small cultural regions and the surrounding areas. Hui Cuisine, Zhe Cuisine, and Min Cuisine have the worst environmental performances. This study reveals the significant impact of regional cuisines on the environmental footprint of diets and highlights the necessity of considering this impact when promoting dietary transition, especially in culturally diverse countries.
1 Introduction
Numerous studies have shown that the current dietary practices and food production systems are not sustainable (van Dooren et al., 2014). A strong trade-off relationship has been found between human health and the environment (Zhang and Chai, 2022), and diet not only can affect human health but also affect the environment (Bajželj et al., 2014; Hallström et al., 2015; Davis et al., 2016). It is estimated that food systems produce around 30% of the global greenhouse gasses, and food production, such as the expansion of farmland and pastures, has contributed to the diminishment of 5.5 million hectares of forest per year, which accounts for 2/3 of the total global forest loss (von Braun et al., 2021). Besides, the freshwater withdrawals for agricultural products account for 70% of the total global freshwater withdrawals (Foley et al., 2011). As Springmann et al. (2018) predicted, the environmental burden of the food system may increase by 50–90% between 2010 and 2050 and even exceed the prescribed planetary boundary.
The global human diet has included more animal-based food in recent decades (Komarek et al., 2021), which implies a more severe problem of environmental burden. Plant-based food is more sustainable than animal-based food (Tilman and Clark, 2014). Double pyramid studies also show that food recommended for human health is more environmentally sustainable in most cases (Buchner et al., 2010; Ruini et al., 2015).
The SDGs of the United Nations have long placed food and agriculture at the heart of human needs and nutrition. The transition of dietary structure is inevitable, and changing consumption habits and improving production efficiency are the main goals of this transition (Davis et al., 2016). In numerous dietary pattern assessments, Mediterranean diets (Burlingame and Dernini, 2011; Willett et al., 1995) and vegetarian diets (Baroni et al., 2006; van Dooren et al., 2014) are sustainable. A global shift toward Mediterranean-style diets and other plant-based diets can significantly advance environmental sustainability (Duchin, 2008).
The proposal of a planetary health diet (Willett et al., 2019) provided a scientific reference for the further transition of the global dietary structure and the win-win strategy to achieve human health and environmental sustainability. Numerous existing studies have shown that excessive animal-based food consumption can adversely affect environmental health (Volta et al., 2021), and plant-based human diets can significantly reduce the problems of agricultural air emissions pollution (Himics et al., 2022). A preference for vegetarianism and a reduction in animal-based food, especially ruminant food, can significantly reduce greenhouse gas emissions (Berners-Lee et al., 2012).
Most authoritative studies focus on a global perspective and ignore the uniqueness of each region’s food culture, and switching to healthy diet, as usually accepted in academia, may not benefit the environment (Grabs, 2015; He et al., 2019; Ibarrola-Rivas and Nonhebel, 2022). Culture is the mind’s collective programming (Hofstede, 2011) that sets one group apart from others, influenced by societal dynamics and the region’s unique multi-dimensional factors, such as climate, the process and degree of economic development, and the region’s historical development. Food culture is no exception. Food consumption is related mainly to the identity and social status of consumers, which reflects a new human self-image and awareness (Beeton, 2003), tied to cultural influence. Existing studies also tend to be idealistic. For instance, although Mediterranean and vegetarian dietary patterns are recommended, low salt intake and high fish intake are the most difficult other dietary patterns to achieve (van Dooren et al., 2014), especially for those inland and less developed regions.
Changes in dietary preferences vary widely across regions (springmann et al., 2016), and the changes in dietary structures in developing countries can offer the most substantial absolute benefits to the environment. Some studies have focused on the uniqueness of Chinese regional food cultures and conducted related environmental impact studies (Liu et al., 2023). China has various domestic food cultures with a long development history as the second-largest economy globally and one of the largest consumers of food and agricultural biomass (Ye et al., 2022). China has a diverse food culture due to a combination of historical, cultural, geographical, and other influences (Li et al., 2024). China’s eight culinary traditions, shaped over time with local flair, are broadly embraced by its society as key representative of Chinese food culture (Jiang et al., 2021; Zhang and Ma, 2020). Although there are also significant gaps among Chinese regional food cultures, numerous studies also highlight the differences and convergences between the Chinese and Western diets, especially in the intake of different kinds of food materials (He et al., 2019; Li et al., 2024). With the rapid urbanization and economic and social development in China, the dietary preferences of the Chinese have also gradually shifted to animal-based food (Lu et al., 2015). Between 1980 and 2009, pork and beef consumption increased 3-fold and 10-fold, respectively (Huang et al., 2017). On the premise of meeting existing needs, China still has the potential to reduce greenhouse gas emissions by 5–28% through dietary transitions (Song et al., 2017). Further proposals can be designed to be more in line with local eating habits based on regional differences in food consumption (Ibarrola-Rivas and Nonhebel, 2022).
According to the literature review, current research usually adopts a global perspective, ignoring the uniqueness and local characteristics of food cultures across China. Although some studies have begun to focus on the environmental impacts of specific factors such as differences in dietary consumption and demographic changes, and have realized China’s special identity in global climate action, they have neglected the deeper cultural foundations behind dietary consumption. China’s eight cuisines culture is a notable representative of the diversity of food culture to be chosen as a case study. Given the complexity of the human decision-making process regarding dietary preferences (Liu et al., 2022) and the difficulty quantifying food culture, we characterized China’s food culture through the POI data distribution of restaurants of the eight Chinese culinary traditions. We strive to make up for the issue of over-idealization and neglect of cultural factors in existing studies by comparing the environmental footprint contribution rates of different cuisines based on characterizing culture. We will further provide our constructive advice on sustainable food system transition from the perspective of respecting cultural diversity.
2 Methodology
2.1 Preference index
Amap is one of the mainstream map services in the Chinese Mainland region. Amap provides geographic location information and category information of public service facilities to the public as an electronic map service provider. For catering facilities, Amap labels catering facilities according to the classification standards of eight Chinese culinary traditions to optimize consumers’ dining experience. This study uses districts within municipalities and prefecture-level cities as the basic unit, which is more accurate than provinces and autonomous regions data in China. Due to the unavailability of county-level data caused by missing restaurant labels, using city-level data enables a better representation of the geographical distribution of the eight major Chinese cuisines across mainland China while ensuring data accuracy. Furthermore, due to the lack of data for Hong Kong, Macau, and Taiwan, this study focuses solely on data from mainland China.
Economic development and population distribution in various regions of China are highly uneven, so the difference in the number of restaurants cannot reflect the preference of different areas for the eight Chinese culinary traditions. To more intuitively show the popularity of different cuisines in different regions, we adopt the ratio method to show the proportion of restaurants of a specific cuisine within a particular region.
The specific process is as follows. We first captured the number and geographical distribution of restaurants with different labels on Amap in 2021, then calculated the popularity of the eight cuisines in different regions based on the districts and prefecture-level cities of the municipalities, and visualized the results on the map. We believe that the number of restaurants in an area can reflect the taste preferences of people in the region. Therefore, we set the districts of prefecture-level cities or municipalities directly under the central government as the basic units. r is defined to represent people’s preference index for a specific cuisine to measure people’s preference for one cuisine. The higher the r-value, the higher the priority of people for the cuisine, and vice versa. M represents the sum of all restaurants marked as any one of the eight Chinese culinary traditions in the region by Amap, and N represents the number of restaurants of a particular cuisine in the region. The regional preference index (r) of cuisine in a prefecture-level city or a municipality directly under the central government can be expressed as N divided by M.
2.2 Data acquisition
We chose a cookbook (Niu and Niu, 2021) popular in China as the source of the recipes. The recipes in this book accurately include each dish’s methods, dosage, and ingredients, which can help us restore the most widely accepted dishes. According to the recipes provided in this book, we selected the most popular 10 dishes from the eight Chinese culinary traditions to represent the corresponding cuisines. We make a preliminary description of each dish according to the raw materials and dosage marked on the menu, calculate the calorie contained in each raw material according to the grams of each raw material, and add up the calorie of the whole dish for subsequent calculation.
2.3 Carbon footprint, water footprint, and ecological footprint
Carbon footprint, water footprint, and ecological footprint provide decision-makers with an overall perspective on the comprehensive impact of various human burdens, enabling them to have a deeper understanding of the complexity of the environment (Fang et al., 2014). Using carbon footprint, water footprint, and ecological footprint can effectively measure the impact of the eight Chinese culinary traditions on the environment and figure out the impact of Chinese food culture on the environment. We choose calories as the basic unit to reduce the error caused by the consumption difference between different cuisines.
We obtain the data of unit carbon footprint, water footprint, and ecological footprint from the following two databases: Double Pyramid Healthy food for people, sustainable food for the plant, and Drivers of the growing water, carbon, and ecological footprints of the Chinese food from 1961 to 2017 (Barilla Center for Food and Nutrition, 2010; Cao et al., 2020; Ruini et al., 2015). Then, the carbon footprint, water footprint, and ecological footprint of each dish are calculated according to the practices and dosage in the recipe. According to the number of calories required by each dish, a weighted summary is performed to calculate the ratio of each dish’s carbon footprint, water footprint, ecological footprint, and calories. The ratio of three footprints and calories of representative dishes of different cuisines can help us characterize the environmental preferences of the eight cuisines. To avoid the influence of outliers on the results, we used three footprints of representative dishes of different cuisines and the median calorie ratio for horizontal comparison. We hope to compare the impact of different cuisines on the environment from the three dimensions of carbon footprint, water footprint, and ecological footprint to have a more comprehensive understanding of different cuisines.
2.4 K-means clustering algorithm
Clustering is a pattern that helps us find the way of data collection and the similarity of each data cluster (Sivaguru and Punniyamoorthy, 2020). K-means is a popular cluster analysis method that helps identify patterns in data collection and the similarities between different data clusters, providing a powerful tool for analyzing multidimensional data. This analysis method divides m points in n-dimension into K clusters and minimizes the sum of squares in the clusters (Hartigan and Wong, 1979). In this study, we aim to identify similar characteristics from multidimensional data. Specifically, we want to comprehensively consider information with K means from three dimensions—carbon footprint, water footprint, and ecological footprint—rather than analyzing each environmental footprint in isolation, enabling us to identify the cuisine cultures with the most similar environmental burdens.
To achieve this goal, we set each of the eight cuisines into eight datasets, denoted by ni (i is an integer and 0 < i ≤ 8) and clustered the eight Chinese traditional cuisines in terms of three dimensions: carbon footprint, water footprint and environmental footprint, denoted by di (i is an integer and 1 < i ≤ 3).
In the known observation set , each observation is a three-dimensional real vector ( , , ), We use k means cluster to partition our obtained eight sets of observations into k sets ( k and k is an integer) and to minimize the within-cluster sum of squares (WCSS), where within-cluster sum of squares is defined as the sum of squared distances within each member of the cluster and its centroid.
where Si represents the cluster combination, μi is the mean value of all points in Si.
When the clustering combination Si satisfies the above equation, each observation within Si can be considered as the most similar under the three dimensions of carbon footprint, water footprint, and environmental footprint, which means that these observations must have some kind of similarity. In this study this can be concluded as these observations have similar environmental burden.
In order to maximize the differentiation between the cluster combinations and also to make the results more convincing, we need to find the appropriate k. We use the WCSS as a metric to find the best number of clusters that can be formed for a given data set. Since WCSS is measured for k, if an increase in K-values after a specific point does not cause a significant decrease in WCSS, then this k value here is considered optimal, which is the number of groups we expect.
To ensure the accuracy of clustering results, we set the number of clusters as the number of 8 dishes and then determine the number of clusters according to the value of the elbow method to minimize the difference of dishes within a group and maximize the difference between groups. The influence of the same group of cuisines on the environment is similar. There is a correlation between the cuisines with the same characteristics, which may be the correlation between the raw materials or the correlation between the structures.
2.5 Hypothesis
Cultural significantly influence people’s food choices. Existing research has demonstrated the guiding role of local food culture on people’s dietary preferences in contexts of cross-cultural culinary exchanges, such as those involving religion and immigration (Mekoth and Thomson, 2018; Lillekroken et al., 2024). With China’s economic development, eight Chinese culinary traditions have gradually transcended regional boundaries, becoming popular nationwide, thereby diversifying the food choices of Chinese people. The interactions between different regional cuisine cultures and local food traditions present an important area of study. Thus, we hypothesize that local traditional culinary culture continues to dominate regional preferences for different cuisines. Then, we propose that, given the influence of geographical factors on the formation of food culture, variations in the use of raw materials, taste preferences, and other factors contribute to differences in the environmental impact of various cuisines.
3 Results
3.1 Preference index
As shown in Figure 1, the overall diet regional preference chart of Chuan cuisine is the most obvious. Additionally, judging from the differences between inland and coastal areas, dietary preferences in inland areas are widely and proportionally influenced by Chuan cuisine, and dietary preferences in coastal areas have more obvious geographical diversity characteristics. In Figure 1B, Chuan cuisine still has obvious advantages in the eastern coastal areas, especially in the coastal areas of Jiangsu and Zhejiang.
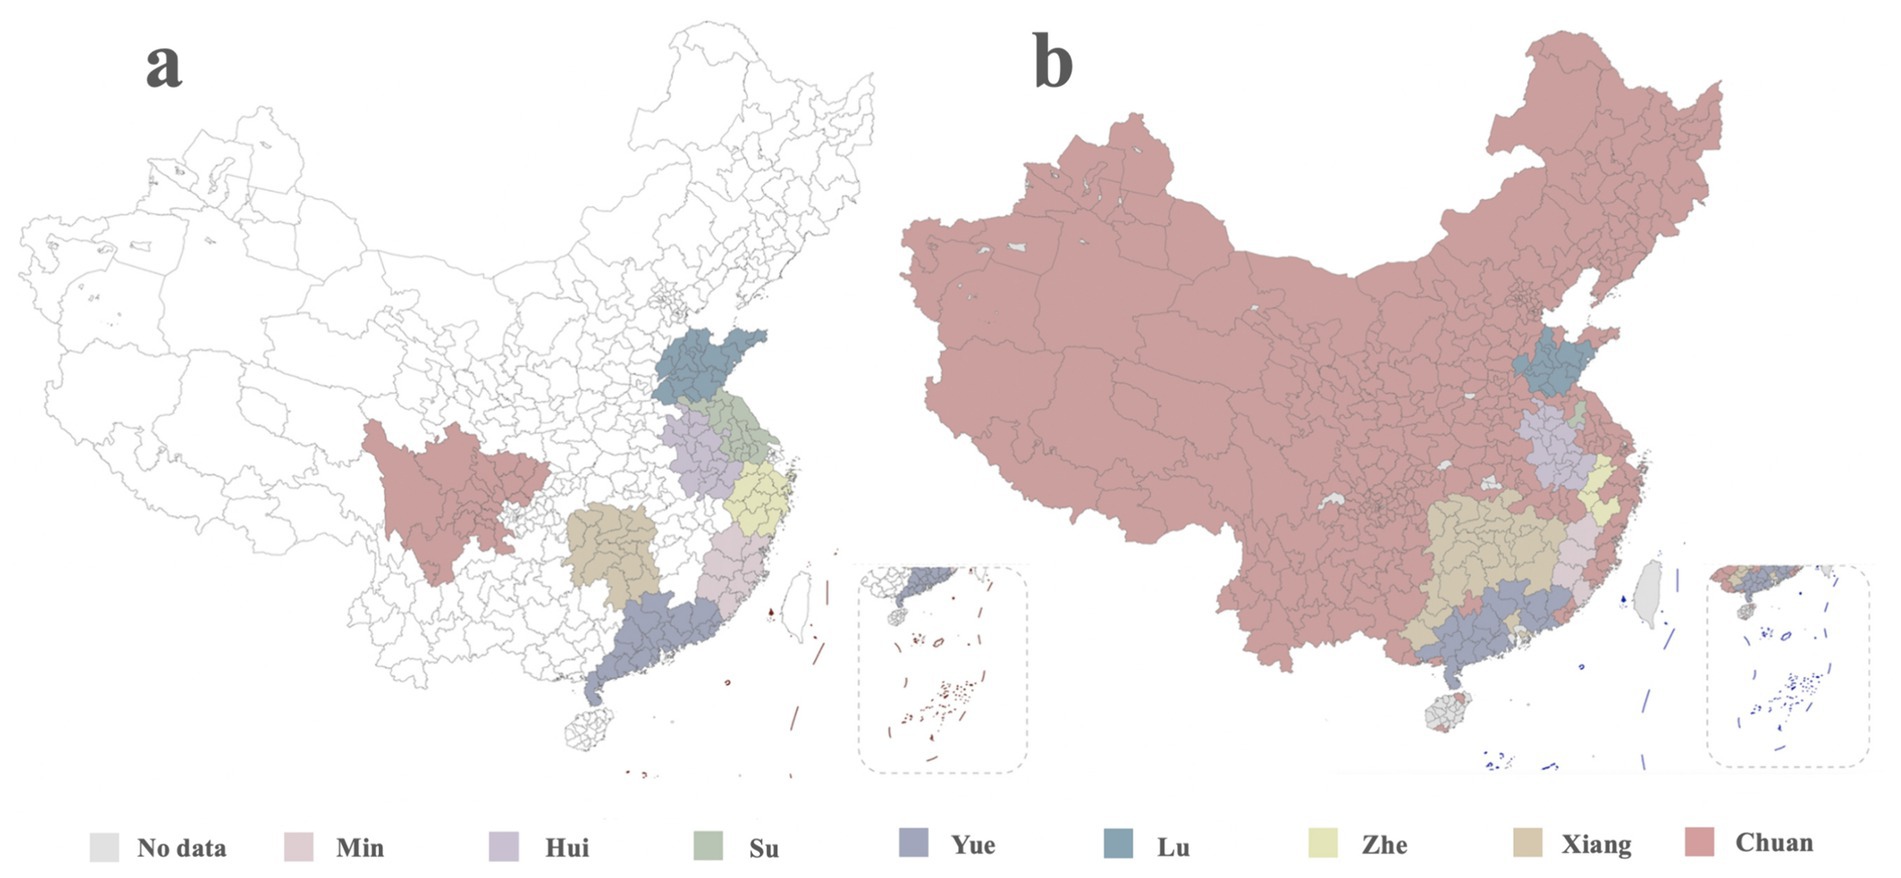
Figure 1. (A) Eight cultural source provinces corresponding to eight Chinese culinary traditions. The provincial color area corresponding to each province is the cultural birthplace of eight Chinese culinary traditions. (B) Overall diet regional preference chart of eight Chinese culinary traditions. The regional preference index (r) of cuisine in a prefecture-level city or a municipality directly under the central government can be expressed as N divided by M.
As shown in Figure 2, we divide the municipalities and prefecture-level cities in various regions of China into [0, 1] according to the value of r. We found that the preference indices of the eight cuisines have apparent regional differences, which can reflect the overall dietary preferences and eating habits of a region to a large extent.
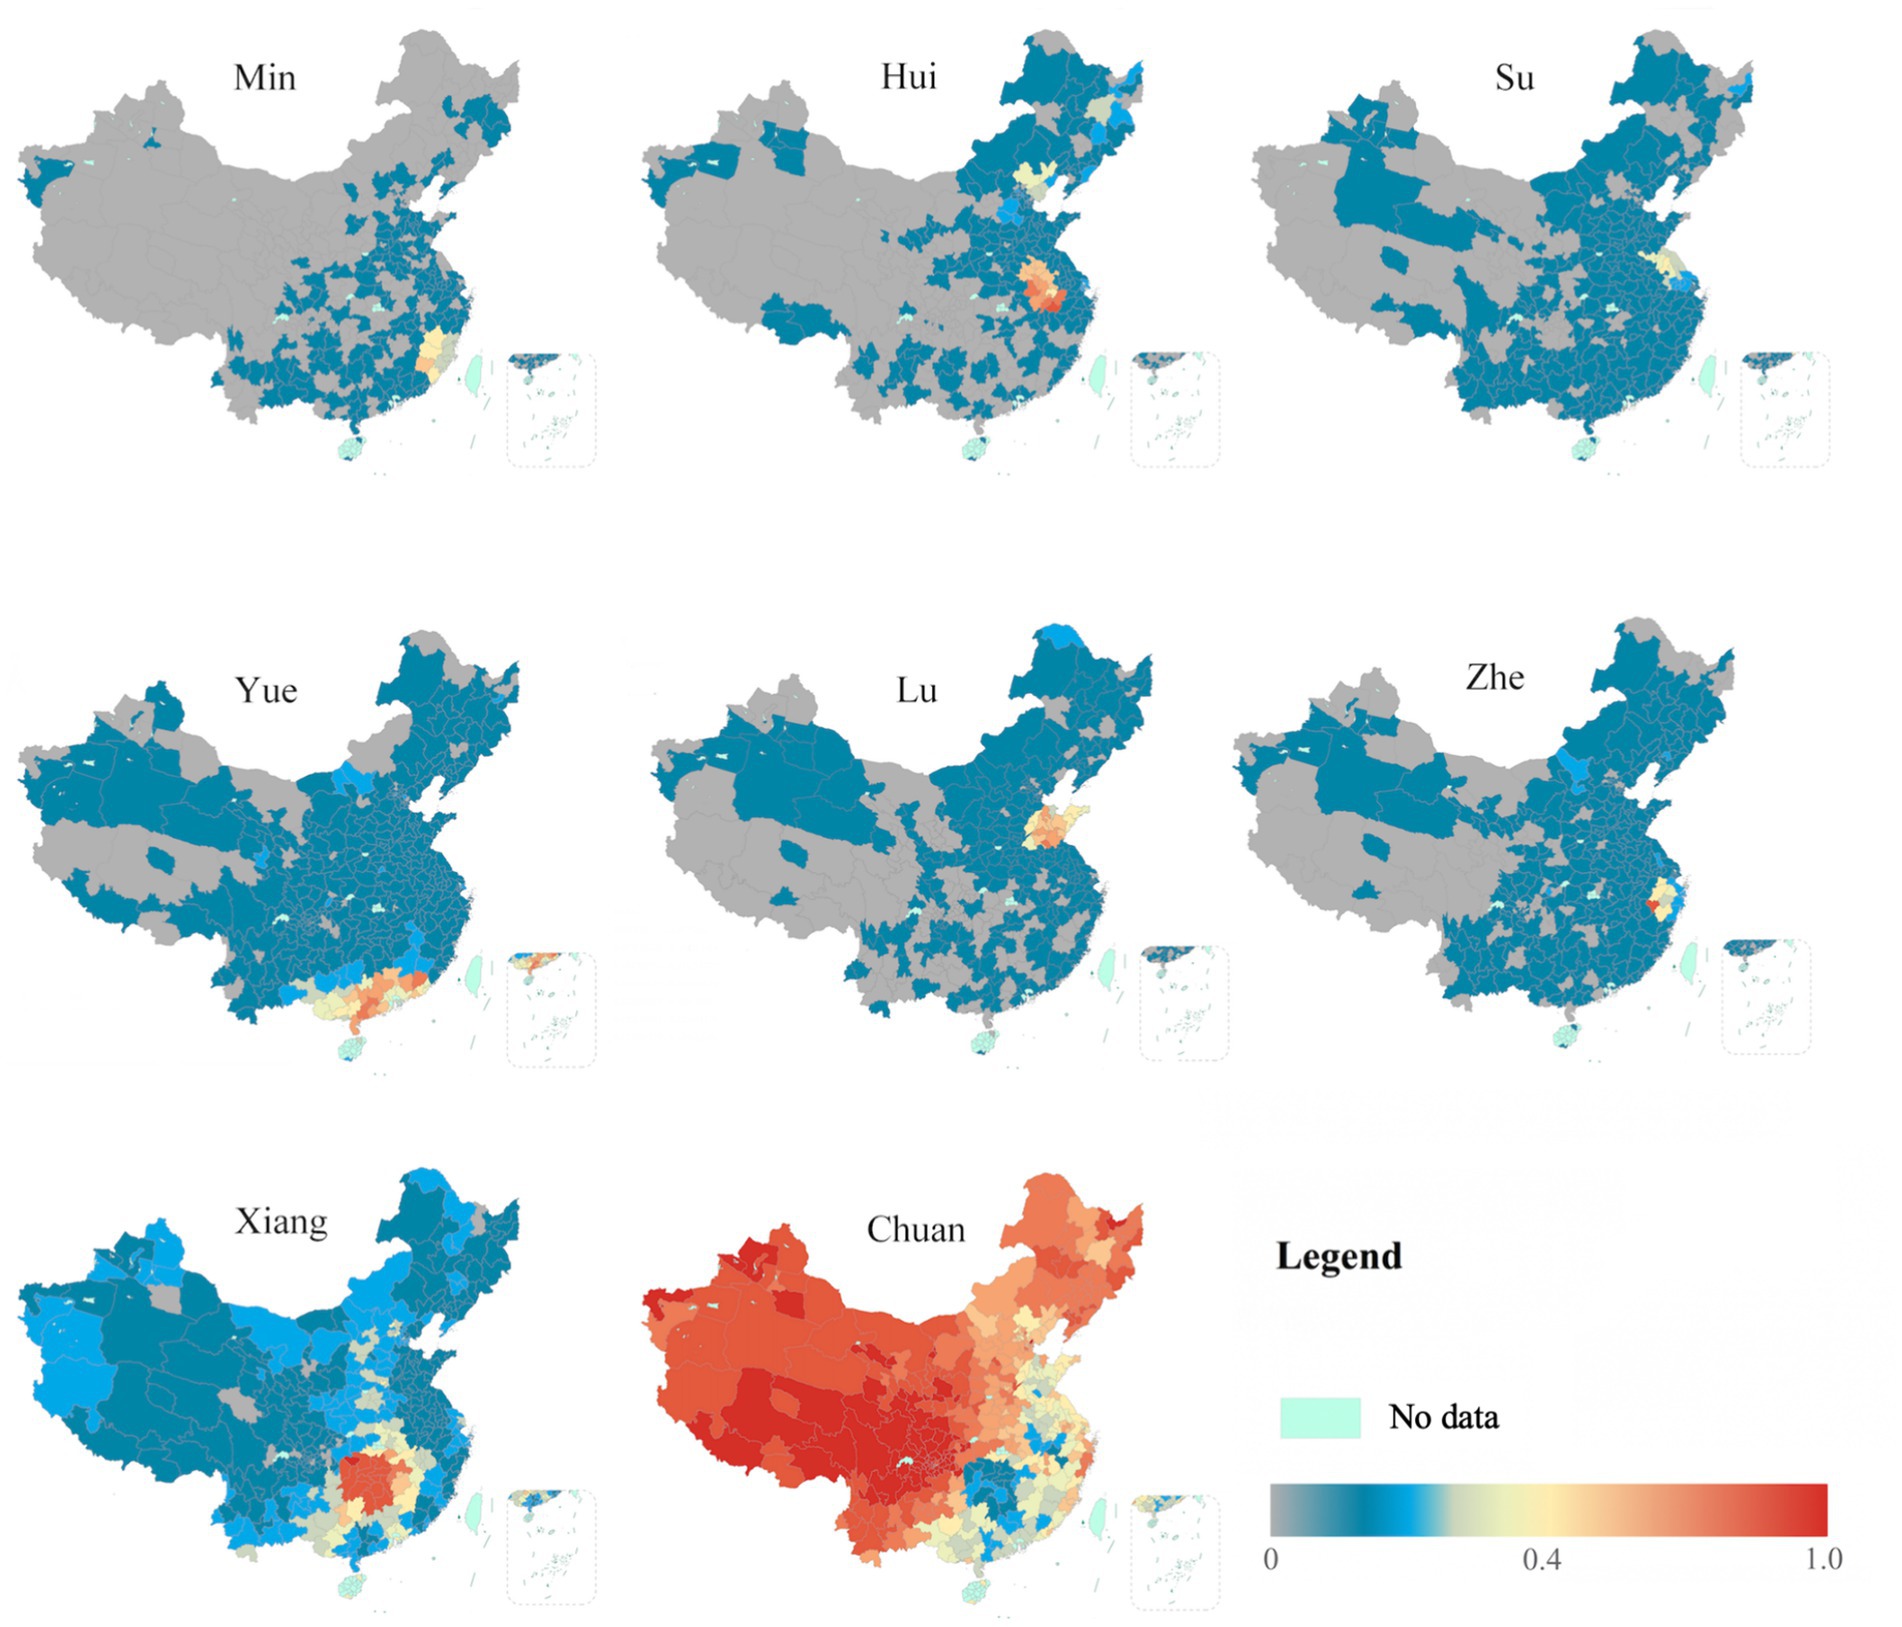
Figure 2. The eight maps of China represent the regional diet preference index corresponding to the eight Chinese culinary traditions. It can be seen from the color distribution that Chuan cuisine occupies a very obvious preference advantage.
From the perspective of the national distribution, although there are noticeable differences in the regional preference index between inland and coastal areas, Chuan cuisine is the most popular nationwide, and it is distributed in almost all regions, especially in Northwest China, Northeast China, and Southwest China. The second is Xiang cuisine, and the regions with high recognition of Xiang cuisine are mainly concentrated around Hunan Province (r ≥ 0.4). The northwest inland region has a relatively high preference for Chuan cuisine (r ≥ 0.4) and Xiang cuisine (r ≥ 0.1), while Min cuisine is the most distributed in the northwest inland region, where the preference index is zero (r = 0), followed by Hui cuisine.
From the relationship with the headstream of culture perspective, except for Chuan cuisine, the regional preference indices of the other seven cuisines all spread to nearby areas, with the cuisine’s origin areas as the peak. There are obvious limitations to the diffusion range. Chuan cuisine spreads from the southwest to the northwest and northeast. Although the influence of Xiang cuisine is not as significant as that of Chuan cuisine, its influence on the provinces near Hunan is more potent than that of Chuan cuisine. It is worth noting that the r value of Chuan cuisine, which is (0, 0.1), is the lowest in the Hunan region, where people prefer Xiang cuisine.
Moreover, the index of Hunan region shows a clear tendency of whether Hunan people will choose Xiang cuisine or Chuan cuisine when they go out for meals. In addition, Min cuisine has the smallest spread, followed by Hui cuisine. The regional preference index of Su cuisine in its cultural origin is the lowest, followed by Min cuisine. However, the national distribution range of Su cuisine is significantly higher than that of Min cuisine. From this, we found that although different cuisine cultures have different degrees of recognition in different regions, the cuisine culture still maintains a specific influence on the origin of the cuisine.
From the perspective of regional differences in taste preferences, Chuan and Xiang cuisines, as the representative cuisines of spiciness, have a nationwide distribution that confirms the differences in dietary preferences between the north and the south. In contrast, the remaining six cuisines are not typical representative cuisines of spiciness. Its distribution range does not have noticeable north–south differences. Among the eight Chinese culinary traditions, the only northern cuisine, Lu cuisine, does not have the apparent dietary preference advantage of the northern region.
As shown in Figure 3, from the national total of the eight Chinese culinary traditions, the overall values of Chuan cuisine (64,233) and Xiang cuisine (25,396) are significantly higher, which have an obvious advantage in the national popularity of the eight cuisines. The preference graph is also validated.
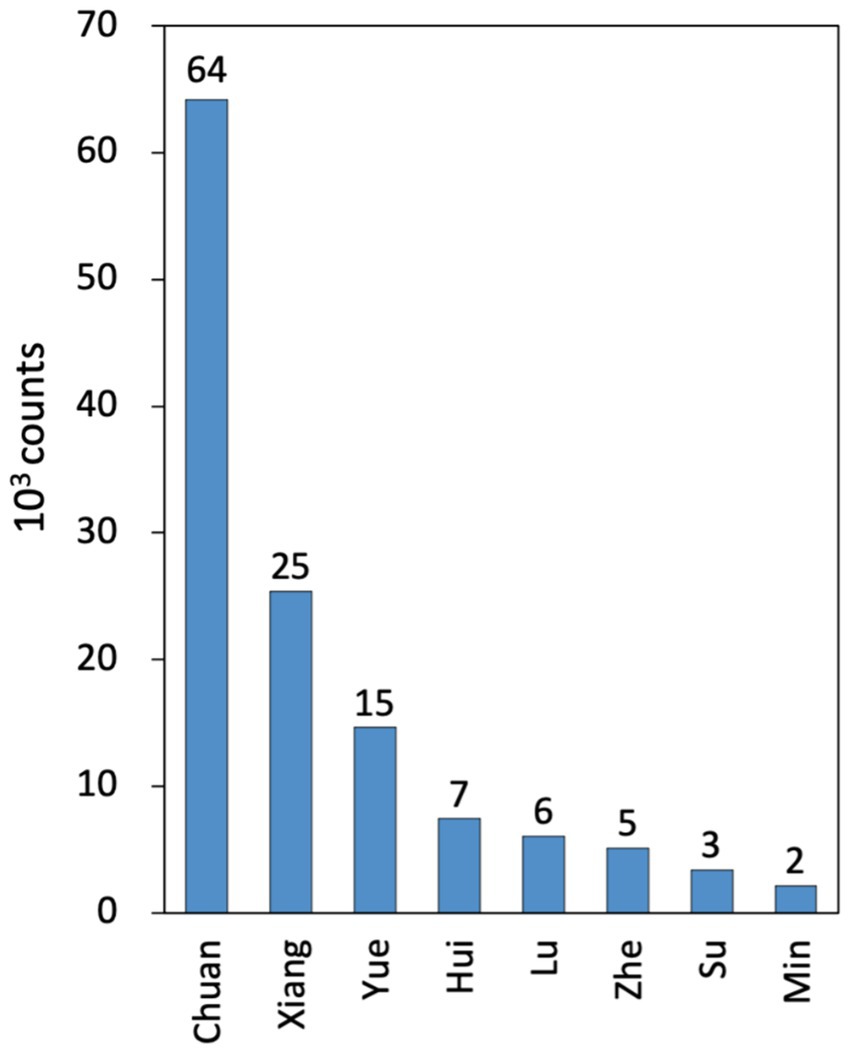
Figure 3. Total number of restaurants for each cuisine.
3.2 Horizontal comparison of three footprints of eight cuisines
We use the calculated values of carbon footprint per 1,000 kcal, water footprint per 1,000 kcal, and ecological footprint per 1,000 kcal as our research data. Firstly, we compare the median of the three footprints in the horizontal direction with the box plot diagram and analyze the characteristics of each cuisine culture from the three dimensions of carbon footprint, water footprint, and ecological footprint.
According to Figure 4, the carbon footprint (unit: kgCO2eq/1000 kcal) of traditional Chinese food per kilocalorie fluctuates between (1.366 and 2.344), which is a large fluctuation range. Min Cuisine (2.327), Hui cuisine (2.344), and Zhe cuisine (2.306) have a higher carbon footprint. The total carbon footprint of these three cuisines in the production process is large, while the median of other cuisines is relatively stable—all-around 1.0.
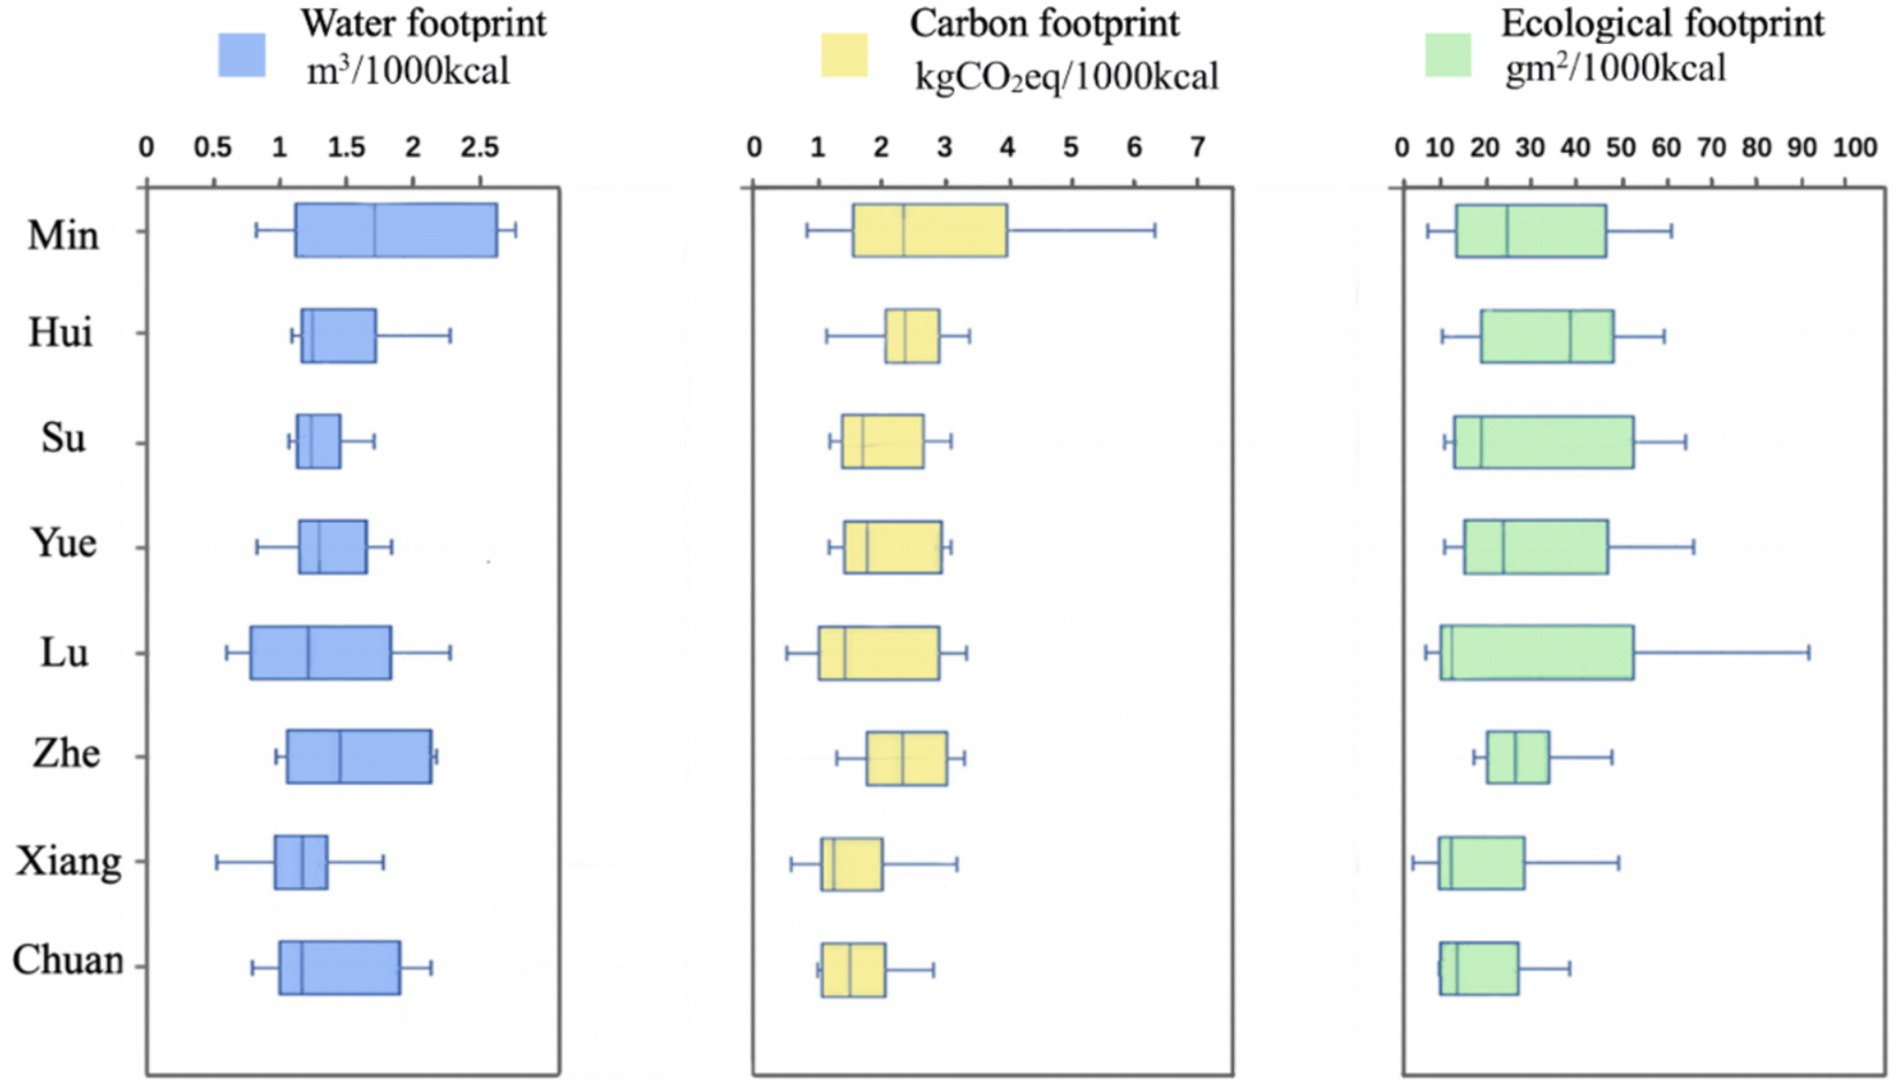
Figure 4. Water, carbon, and ecological footprints of each cuisine.
Therefore, in terms of carbon footprint, the eating habits of Min cuisine, Hui cuisine, and Zhe cuisine may lead to more greenhouse gas emissions, which also means that the production process of these three cuisines has higher carbon emissions and greater environmental burden. Relatively speaking, the median of other four cuisines is close, and the level is low. In terms of carbon emissions, they can be regarded as an environmentally friendly food culture.
In Figure 4, the water footprint level (unit: m3/1000kcal) for each cuisine is relatively close, concentrated in the interval (1.207, 1.775). The water footprint level of Min cuisine and Zhe cuisine is high, with a median of 1.775 and 1.506 respectively, which means that the eating habits of these two cuisines have a high consumption level of water resources, and their preferred ingredients also have a high consumption of freshwater resources. The water footprint of other six cuisines is about 1.2, and the demand for water resources is similar and maintained at a low level.
The ecological footprint (gm2/1,000 kcal) of the eight cuisines in Figure 4 fluctuates in the range of (10.64,36.85). Hui cuisine (36.85) has the highest ecological footprint and consumes the most eco-environmental resources. The ecological footprint of Zhe cuisine (24.74), Min cuisine (23.03), and Yue cuisine (22.11) are relatively low, followed by Su cuisine (17.25), and Chuan cuisine (11.94), Lu cuisine (10.77), and Xiang cuisine (10.64).
3.3 Clustering results of eight cuisines
In Figure 5A, we performed k-clustering on our experimental data to better define the environmental preferences of the eight Chinese culinary traditions. Before implementing clustering, we first normalize the data with the aim of improving clustering quality and enhancing the accuracy of the results. It can be seen from the figure that the eight cuisines can be divided into three categories according to the data of three dimensions: carbon footprint, water footprint, and ecological footprint. Among them, Xiang cuisine, Chuan cuisine, and Lu cuisine belong to the first category, while Su cuisine and Yue cuisine belong to the second category. Zhe cuisine, Hui cuisine, and Min cuisine belong to the third category. The difference between the cuisines in the first type of cuisine is minimal, and so is the second type of cuisine, which shows that the dishes in the same kind of cuisine have similar effects on the environment. The third kind of cuisine has a significant gap in this kind of cuisine. However, there is a substantial gap between these three cuisines, and they have common characteristics in this group. Therefore, we use this classification to discuss cuisine’s impact on the environment further.
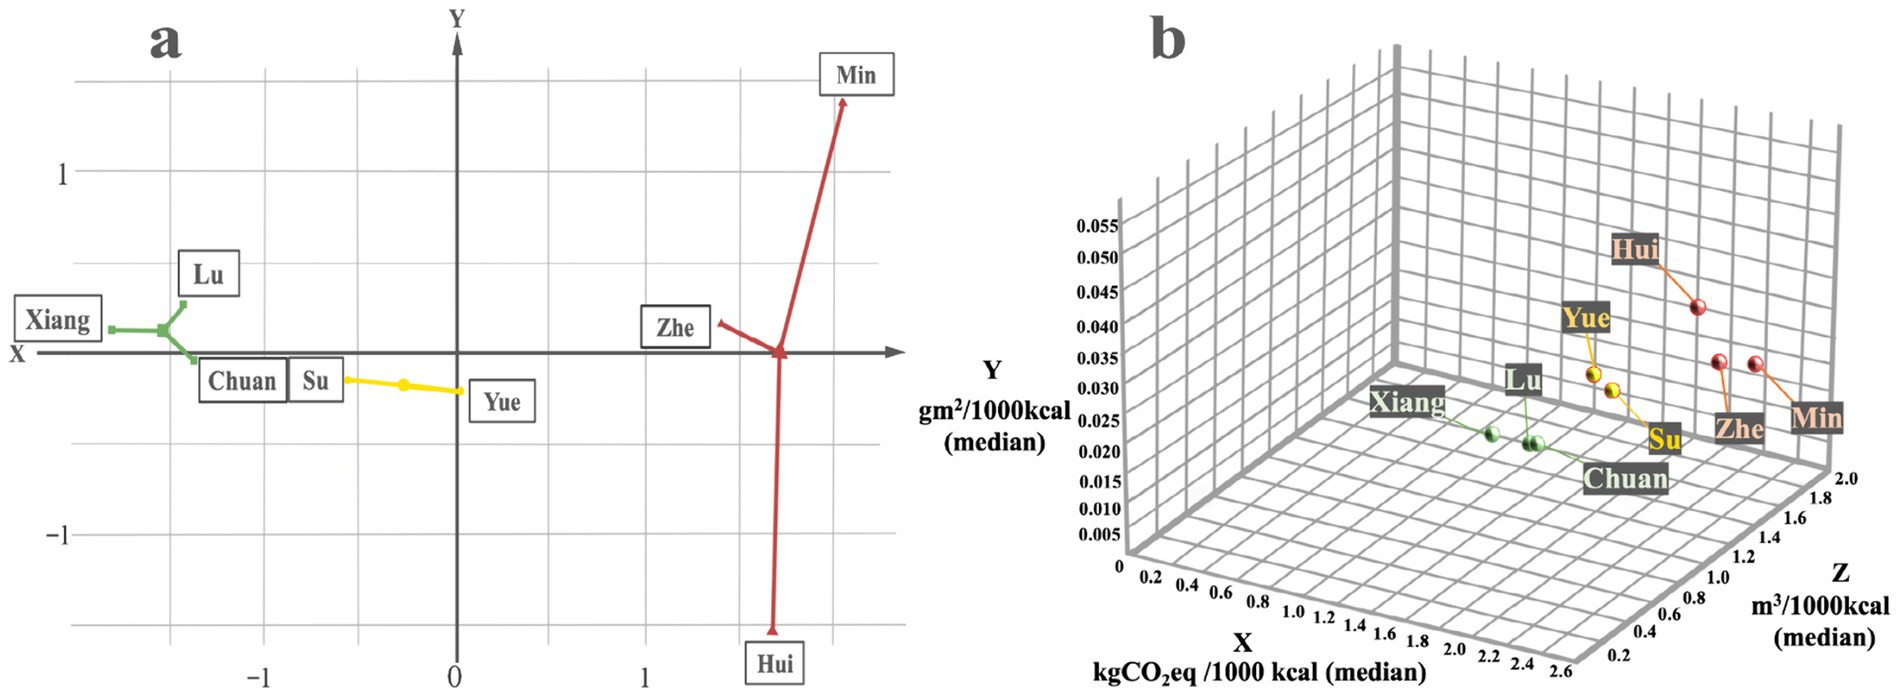
Figure 5. Clustering of eight traditional Chinese cuisines: (A) visualization of clustered central data diagram; (B) K-means 3D diagram.
In Figure 5B, we made the three-dimensional distribution map of the eight cuisines after clustering them according to the standardized data. It can be seen from the figure that Xiang cuisine, Chuan cuisine, and Lu cuisine have the smallest environmental burden which means that they are environment-friendly cuisines. These three cuisines have a high preference for pork and vegetables, and the menu is relatively simple. Five dishes of Chuan cuisine are mainly made of pork and vegetables. The main ingredient of Lu cuisine is pork for three dishes and vegetables and fruits for five dishes. In Xiang cuisine, the main component of three dishes is vegetables, and the main ingredient of four dishes is pork. Heavy consumption of pork and vegetables explained why the average footprint of the three cuisines is low.
The second category is Yue cuisine and Su cuisine. Compared with the first three cuisines, these two cuisines consume more environmental resources. By comparing raw materials, we find that Yue cuisine and Su cuisine have a clear preference for fish. Su cuisine includes five dishes with fish as the main ingredient, and Yue cuisine includes four. In addition, the use of pork in Su cuisine and Yue cuisine has been reduced, and the dishes with pork as the main ingredient have been reduced to one and two, respectively. In addition, the environmental burden of Yue cuisine are significantly higher than that of Su cuisine, which may be related to Yue cuisine’s richer raw materials. Su cuisine has an obvious preference for fish, while Yue cuisine adds more diversified ingredients, such as chicken (1 share), goose (1 share), and beef (1 share).
The third category is Hui cuisine, Zhe cuisine, and Min cuisine. Their environmental burden is significantly higher than that of other cuisines. We found that fish are still the preferred ingredient of these three cuisines. Min cuisine includes four kinds of dishes with fish as the main ingredient. Meanwhile, five kinds of Zhe cuisine dishes and six kinds of Hui cuisine dishes use fish as the main ingredient. Secondly, compared with the second type of cuisine, these three cuisines have a wider choice of ingredients. Beef, mutton, chicken, duck, and goose are added to the menu to enrich the types of dishes. At the same time, however, it also increases the consumption of environmental resources of the three cuisines.
Based on these findings, we draw the following conclusions. First, the cuisine with more fish has a heavy environmental burden. Through the analysis of recipes from the first type of cuisine with a lower environmental impact, we found a low preference for fish and a high preference for vegetables, especially Lu cuisine, where half of the dishes are related to vegetables. In addition, there is also a correlation between the abundance of ingredients and the environmental burden. Some cuisines with a wide range of ingredients, such as Zhe cuisine and Min cuisine, have a heavier environmental burden than those with a single range of ingredients, such as Xiang cuisine and Chuan cuisine. One reason is that these cuisines contain more raw materials with a higher environmental burden. The abundance of ingredients also leads to the differences among the three footprints of different cuisines. Although Zhe cuisine and Hui cuisine belong to cuisines with heavy environmental burdens, these two cuisines have different preferences for ingredients, resulting in significant differences in environmental footprint between them. The carbon footprint of Zhe cuisine is lower than that of Hui cuisine, while the water footprint and ecological footprint of Hui cuisine are higher than that of Zhe cuisine. In comparison, Chuan cuisine, Xiang cuisine, and Lu cuisine, which have lower complexity of ingredients, have a higher similarity of ingredients, so the environmental burden is relatively similar.
Research shows that the key to describing environmentally sustainable behavior in food consumption is not the traditional social and economic classification (age, income, and education) but cultural factors such as consumers’ lifestyles and values (van Dooren et al., 2018). The eight Chinese culinary traditions concentrate on the traditional Chinese food culture, including food preferences and eating habits, and still affect the diet concept of today’s Chinese people. According to the preference chart of the eight Chinese culinary traditions, we found that the diet concept represented by the eight cuisines is still the local people’s first choice. To verify our conclusion, we choose to compare the per capita food consumption of Chinese residents in 2021 in the National Bureau of Statistics of China 2022 (National Bureau of statistic of China [NBSC], 2022) with our outcome.
Taking Xiang cuisine and Chuan cuisine, the two most widely distributed cuisines, as examples, in 2020, the per capita consumption of pork by residents in Sichuan Province and Chongqing were 28.0 and 29.9 kg, respectively, which were higher than the national average of 24.8 kg. In comparison, the consumption level of beef and mutton by residents in these two regions is relatively low. The per capita consumption of beef and mutton by residents in Sichuan Province is only 1.9 and 0.4 kg, and the per capita consumption of beef and mutton by residents in Chongqing is 1.9 and 0.5 kg. The consumption of beef and mutton in these two regions is less than the national per capita consumption of beef of 2.3 kg and mutton of 1.2 kg. In addition, the consumption of vegetables in Sichuan and Chongqing is large, 119.6 kg and 130.3 kg, respectively, which is greater than the national per capita consumption of 103.7 kg. Overall, Sichuan Province and Chongqing are the birthplaces of Chuan cuisine. The per capita consumption of the leading food of local people in 2020 is mainly vegetables and pork, while the consumption of beef and mutton is small, which is in line with our findings. Xiang cuisine and Chuan cuisine have high similarities. In 2020, the per capita consumption of beef and mutton in Hunan Province was 2.2 and 0.6 kg, respectively, lower than the national average. The per capita consumption of pork is 22.7 kg, and the consumption of vegetables is 104.5 kg. These two indicators are higher than the national average, consistent with the results we found.
4 Discussion
Our research shows that it is feasible to use the form of POI to represent culture under the premise that culture is difficult to quantify. It shows that some cuisine cultures are environmentally friendly and have a high degree of overall national preference, which deserves our special attention. For example, Chuan and Hui cuisine are the two most popular flavors with a small environmental impact. A new healthy and environment-friendly diet with Chuan and Xiang flavors would be more in line with people’s expectations in most parts of China, which is an important variable that should be considered in China’s dietary transition.
As for other cuisine, we find in the places where other culinary traditions originated, the local cuisine still predominantly shapes the dietary habits of the residents. Our findings further confirm the need to consider and respect the cultural characteristics of different regions in the study of the impact of diet on the environment and health and the intervention of people’s diet for the sustainable development of human health and the environment, which seems to be consistent with our first hypothesis. However, there exist some exceptions. For example, Chuan cuisine is highly recognized in the cultural sources of some other cuisines in the southeast coastal areas, especially in the southeast coastal regions such as Zhejiang and Jiangsu province (see Figure 1B), Which may conflict with our traditional impression. These unique deviations are also what we need to pay attention to.
In terms of the environmental burden, we use k-means to identify groups of cuisines with similar environmental burdens. We find that the combination of ingredients and cooking ways among food cultures causes different environmental burdens, especially the use of meat. The difference in environmental burden between the first type of cuisine, the most environmentally friendly cuisine, and the third type of cuisine, which is the least environmentally friendly, is mainly reflected in the different amounts of pork, beef, and mutton. This result is consistent with the research from Sun et al. (2022). Compared to beef and lamb, pork has a lower overall impact on the environment (Nijdam et al., 2012), which explains why pork-preferred cuisines have less environmental stress. Fish has a higher water footprint (Guzmán-Luna et al., 2021), so cuisines that prefer fish, such as Zhe and Min cuisines, have a higher water footprint than Chuan and Xiang cuisines and other pork-based cuisines.
Some existing healthy dietary guidelines, such as the Chinese dietary guidelines (CDG), eat lancet, or some dietary transition ideas, such as replacing meat consumption with more cereal products (Westhoek et al., 2014) and the promotion of the Mediterranean diet (Willett et al., 1995), have been proved to reduce the environmental impact of the food system or be beneficial to people’s health. However, since the formation of food culture requires a long-term process of dynamic interaction between various social factors, and food culture also has relative stability, the change based on local food culture will increase the investment benefit of food (Zavaleta et al., 2017; Tucci et al., 2021), and the improvement based on food preference (Yin et al., 2020) can gain more acceptance from local customers. It will be difficult to accept the progress without local food culture, which is also an act of disrespect for the independence of local culture. We should reduce the environmental burden brought by the food system on the premise of respecting the local food culture.
Furthermore, suppose we want to reduce the environmental burden brought by the food system. In that case, we can improve the recipe/diet from the ingredients based on respecting the original flavor of the cuisine culture and the way of making dishes. For the second and third types of cuisine cultures with high environmental burdens, especially Min cuisine, Zhe cuisine, and Hui cuisine, we can consider some measures. Using plant-made meat instead of pork and other meat (Apostolidis and McLeay, 2016), or using meat consumption with a lower environmental burden such as pork to replace meat consumption with a higher environmental burden like beef (Song et al., 2015) to improve our menu are desirable approaches. For example, based on the food culture of preferring beef balls in Fujian province, we can develop “beef balls” with beef flavor made of soybean to retain the inherent characteristics of the local diet. These measures can enhance people’s recognition of the improved recipes in Min cuisine as much as possible and reduce the environmental burden caused by beef consumption.
The formation of environmentally friendly and local cultural eating habits requires effort. Facts have proved that many people are not willing to change their eating habits for a green environment (Tobler et al., 2011), and the intervention of external forces is necessary, rather than waiting for the spontaneous development of eating habits. Many works of literature (Phulkerd et al., 2017; Dixon and Isaacs, 2013; Ippolito, 1999; Behrens et al., 2017) have proved the important role of government in dietary intervention and promoting the transition of the dietary system. We believe that the government (Westhoek et al., 2014) should take the responsibility to encourage cooks, restaurants, food critics, scientists, and other food practitioners to improve recipes, pay attention to local people’s eating habits, focus on those food cultures that are both environmentally friendly and widely preferred, and improve diet based on local people’s diet concepts. In particular, when promoting indigenous green diets in China, it is important to take into account the dietary habits of different regions. For example, in Zhejiang Province, where Zhe cuisine originated, Chuan cuisine can be promoted, including increasing the intake of vegetables and pork, which is considered a more environmentally friendly choice because these foods are similar to Zhe cuisine. What’s more, Chuan cuisine is widely distributed in Zhejiang Province and is deeply loved by local people, as we show in Figures 1, 2. Other efforts, such as promoting the concept of a healthy diet, are also necessary.
China is a country with a diverse culinary heritage. This article primarily focuses on the representative regional traditional food cultures of eastern, central, and parts of western China. It would be beneficial to consider a broader range of regional culinary traditions across the country. For instance, the unique food culture found in the traditional animal husbandry areas of northwestern China could provide valuable insights. Furthermore, we used cross-sectional data, which effectively captures the distribution of culinary cultures for a specific year. Nevertheless, given that cultural exchange is a dynamic process, future research could benefit from data spanning a broader temporal dimension to better analyze these changes over time.
Our study demonstrates the impact of regional culinary cultures on dietary environmental footprints. Future research should focus on identifying specific interventions or policy measures to mitigate the negative environmental impacts of diets. For example, longitudinal studies could be conducted to track changes in dietary preferences and their long-term environmental impacts, or comparative studies could be carried out across regions with different culinary traditions to examine how they address the challenges of promoting green diets. Such research should adopt an interdisciplinary approach, integrating cultural studies, environmental science, and policy analysis to develop more comprehensive and effective solutions. In addition, more and more studies believe that only an environment-friendly diet that meets people’s nutritional needs is genuinely sustainable (Song et al., 2019; Bonnet et al., 2020). Considering culture and trying to reduce the environmental burden brought by the food system, we also need to make more improvements to meet people’s nutritional needs to make this food improvement more sustainable and more practical.
5 Conclusion
Food culture is essential for sustainable dietary transition. This study investigates the food culture in China via POI characterization, and compares the environmental performances among different food cultures. Results firstly show that the regional preference index of different cuisines varies in different regions. Chuan cuisine is the most popular nationwide, followed by Xiang cuisine. Min cuisine has the smallest spread, followed by Hui cuisine, and the only northern cuisine, Shandong cuisine, does not have the apparent dietary preference advantage of the northern region. An important finding is that in parts of the cultural origin of Zhe cuisine and Su cuisine, Chuan cuisine’s regional preference index still dominates. As for the environmental burden, Chuan cuisine is identified as having the least environmental impact, followed closely by Xiang and Lu cuisines, and Hui, Zhe, and Min cuisines demonstrated the highest environmental burdens, particularly due to their reliance on ingredients such as fish and red meat, which have higher carbon and water footprints. Notably, Chuan cuisine is the most widely distributed environmentally friendly dietary culture in China.
Promoting sustainable dietary transitions in China presents both challenges and opportunities. While there is a clear need to reduce the environmental impacts of certain cuisines, efforts must also respect the cultural significance of these food traditions. Strategies could include encouraging local adaptations of low-impact cuisines or integrating sustainable ingredients into traditional dishes, fostering a balance between environmental goals and cultural preservation. As Chuan cuisine is widely accepted and has a low environmental footprint, it could serve as a model for developing sustainable dietary guidelines that respect local preferences. On the other hand, strategies could also involve promoting plant-based ingredients or sustainable meat substitutes that align with traditional flavors.
The world’s food culture is diverse, and the premise of creating a more environmentally friendly diet is to respect and embrace diverse food cultures. People’s diets can be more sustainable through recipe improvement, sustainable diet propaganda, and government intervention based on respecting the uniqueness of regional food cultures. This study emphasizes the role of culture in food transition, which is rare in relevant studies. However, we have not considered the nutritional aspects of sustainable dietary structure, and the specific transition measures need further research to determine.
Data availability statement
The raw data supporting the conclusions of this article will be made available by the authors, without undue reservation.
Author contributions
JZ: Writing – original draft, Writing – review & editing, Conceptualization, Data curation, Methodology, Software. HY: Writing – original draft, Writing – review & editing, Visualization, Software. SL: Writing – review & editing. LC: Writing – original draft, Writing – review & editing, Methodology, Supervision, Validation.
Funding
The author(s) declare that no financial support was received for the research, authorship, and/or publication of this article.
Conflict of interest
The authors declare that the research was conducted in the absence of any commercial or financial relationships that could be construed as a potential conflict of interest.
Publisher’s note
All claims expressed in this article are solely those of the authors and do not necessarily represent those of their affiliated organizations, or those of the publisher, the editors and the reviewers. Any product that may be evaluated in this article, or claim that may be made by its manufacturer, is not guaranteed or endorsed by the publisher.
References
Apostolidis, C., and McLeay, F. (2016). Should we stop meating like this? Reducing meat consumption through substitution. Food Policy 65. 74–89. doi: 10.1016/j.foodpol.2016.11.002
Bajželj, B., Richards, K. S., Allwood, J. M., Smith, P., Dennis, J. S., Curmi, E., et al. (2014). Importance of food-demand management for climate mitigation. Nat. Clim. Chang. 4, 924–929. doi: 10.1038/nclimate2353
Barilla Center for Food and Nutrition . (2010). Double pyramid: Healthy food for people, sustainable food for the planet. Available at: https://www.unscn.org/en/topics/sustainable-food-systems?idnews=1428 (Accessed December 15, 2022).
Baroni, L., Cenci, L., Tettamanti, M., and Berati, M. (2006). Evaluating the environmental impact of various dietary patterns combined with different food production systems. Eur. J. Clin. Nutr. 61, 279–286. doi: 10.1038/sj.ejcn.1602522
Beeton, R. J. S. (2003). Sustainably managing food production resources to maximise human nutritional benefit. Asia Pac. J. Clin. Nutr. 12:S50.
Behrens, P., Kiefte-de Jong, J. C., Bosker, T., Rodrigues, J. F. D., de Koning, A., and Tukker, A. (2017). Evaluating the environmental impacts of dietary recommendations. Proc. Natl. Acad. Sci. 114, 13412–13417. doi: 10.1073/pnas.1711889114
Berners-Lee, M., Hoolohan, C., Cammack, H., and Hewitt, C. (2012). The relative greenhouse gas impacts of realistic dietary choices. Energy Policy 43, 184–190. doi: 10.1016/j.enpol.2011.12.054
Bonnet, C., Bouamra-Mechemache, Z., Réquillart, V., and Treich, N. (2020). Viewpoint: regulating meat consumption to improve health, the environment and animal welfare. Food Policy 97:101847. doi: 10.1016/j.foodpol.2020.101847
Buchner, B., Fischler, C., Fitoussi, J.-P., Monti, M., Riccardi, G., Ricordi, C., et al. (2010). Double pyramid: Healthy food for people, sustainable food for the planet. Milan, Italy: Barilla Center for Food & Nutrition.
Burlingame, B., and Dernini, S. (2011). Sustainable diets: the Mediterranean diet as an example. Public Health Nutr. 14, 2285–2287. doi: 10.1017/s1368980011002527
Cao, Y., Chai, L., Yan, X., and Liang, Y. (2020). Drivers of the growing water, carbon and ecological footprints of the Chinese diet from 1961 to 2017. Int. J. Environ. Res. Public Health 17:1803. doi: 10.3390/ijerph17051803
Davis, K. F., Gephart, J. A., Emery, K. A., Leach, A. M., Galloway, J. N., and D’Odorico, P. (2016). Meeting future food demand with current agricultural resources. Glob. Environ. Chang. 39, 125–132. doi: 10.1016/j.gloenvcha.2016.05.004
Dixon, J., and Isaacs, B. (2013). Why sustainable and ‘nutritionally correct’ food is not on the agenda: Western Sydney, the moral arts of everyday life and public policy. Food Policy 43, 67–76. doi: 10.1016/j.foodpol.2013.08.010
Duchin, F. (2008). Sustainable consumption of food: a framework for analyzing scenarios about changes in diets. J. Ind. Ecol. 9, 99–114. doi: 10.1162/1088198054084707
Fang, K., Heijungs, R., and de Snoo, G. R. (2014). Theoretical exploration for the combination of the ecological, energy, carbon, and water footprints: overview of a footprint family. Ecol. Indic. 36, 508–518. doi: 10.1016/j.ecolind.2013.08.017
Foley, J. A., Ramankutty, N., Brauman, A. K., Cassidy, E. S., Gerber, J. S., Johnston, M., et al. (2011). Solutions for a cultivated planet. Nature 478, 337–342. doi: 10.1038/nature10452
Grabs, J. (2015). The rebound effects of switching to vegetarianism. A microeconomic analysis of Swedish consumption behavior. Ecol. Econ. 116, 270–279. doi: 10.1016/j.ecolecon.2015.04.030
Guzmán-Luna, P., Gerbens-Leenes, P. W., and Vaca-Jiménez, S. D. (2021). The water, energy, and land footprint of tilapia aquaculture in Mexico, a comparison of the footprints of fish and meat. Resour. Conserv. Recycl. 165:105224. doi: 10.1016/j.resconrec.2020.105224
Hallström, E., Carlsson-Kanyama, A., and Börjesson, P. (2015). Environmental impact of dietary change: a systematic review. J. Clean. Prod. 91, 1–11. doi: 10.1016/j.jclepro.2014.12.008
Hartigan, J. A., and Wong, M. A. (1979). Algorithm as 136: a K-means clustering algorithm. Appl. Stat. 28:100. doi: 10.2307/2346830
He, P., Baiocchi, G., Feng, K., Hubacek, K., and Yu, Y. (2019). Environmental impacts of dietary quality improvement in China. J. Environ. Manag. 240, 518–526. doi: 10.1016/j.jenvman.2019.03.106
Himics, M., Giannakis, E., Kushta, J., Hristov, J., Sahoo, A., and Perez-Dominguez, I. (2022). Co-benefits of a flexitarian diet for air quality and human health in Europe. Ecol. Econ. 191:107232. doi: 10.1016/j.ecolecon.2021.107232
Hofstede, G. (2011). Dimensionalizing cultures: the Hofstede model in context. Online Read. Psychol. Cult. 2:14. doi: 10.9707/2307-0919.1014
Huang, J. K., Wei, W., Cui, Q., and Xie, W. (2017). The prospects for China’s food security and imports: will China starve the world via imports? J. Integr. Agric. 16, 2933–2944. doi: 10.1016/s2095-3119(17)61756-8
Ibarrola-Rivas, M., and Nonhebel, S. (2022). Regional food preferences influence environmental impacts of diets. Food Secur. 14, 1063–1083. doi: 10.1007/s12571-022-01270-3
Ippolito, P. M. (1999). How government policies shape the food and nutrition information environment. Food Policy 24, 295–306. doi: 10.1016/s0306-9192(99)00025-1
Jiang, S., Zhang, H., Wang, H., Zhou, L., and Tang, G. (2021). Using restaurant POI data to explore regional structure of food culture based on cuisine preference. ISPRS Int. J. Geo Inf. 10:38. doi: 10.3390/ijgi10010038
Komarek, A. M., Dunston, S., Enahoro, D., Godfray, H. C. J., Herrero, M., Mason-D’Croz, D., et al. (2021). Income, consumer preferences, and the future of livestock-derived food demand. Glob. Environ. Chang. 70:102343. doi: 10.1016/j.gloenvcha.2021.102343
Li, S., Chen, X., Ren, Y., and Glauben, T. (2024). The impact of demographic dynamics on food consumption and its environmental outcomes: evidence from China1. J. Integr. Agric. 23, 414–429. doi: 10.1016/j.jia.2023.11.017
Lillekroken, D., Bye, A., Halvorsrud, L., Terragni, L., and Debesay, J. (2024). Food for soul—older immigrants’ food habits and meal preferences after immigration: a systematic literature review. J. Immigr. Minor. Health 26, 775–805. doi: 10.1007/s10903-023-01571-5
Liu, H., Gómez-Miñambres, J., and Qi, D. (2022). Menu-dependent food choices and food waste. Resour. Conserv. Recycl. 176:105919. doi: 10.1016/j.resconrec.2021.105919
Liu, S., Huang, X., Bin, Z., Yu, B., Lu, Z., Hu, R., et al. (2023). Wild edible plants and their cultural significance among the Zhuang ethnic group in Fangchenggang, Guangxi, China. J. Ethnobiol. Ethnomed. 19:52. doi: 10.1186/s13002-023-00623-2
Lu, Y., Jenkins, A., Ferrier, R. C., Bailey, M., Gordon, I. J., Song, S., et al. (2015). Addressing China’s grand challenge of achieving food security while ensuring environmental sustainability. Sci. Adv. 1:e1400039. doi: 10.1126/sciadv.1400039
Mekoth, N., and Thomson, A. R. (2018). Food preferences and culture: the influence of nationality and religion among tourists visiting Goa. Tour. Cult. Commun. 18, 191–204. doi: 10.3727/109830418x15319363084472
National Bureau of statistic of China [NBSC] , (2022). China Statistical Yearbook. Available at: https://www.stats.gov.cn/sj/ndsj/2022/indexeh.htm
Nijdam, D., Rood, T., and Westhoek, H. (2012). The price of protein: review of land use and carbon footprints from life cycle assessments of animal food products and their substitutes. Food Policy 37, 760–770. doi: 10.1016/j.foodpol.2012.08.002
Niu, G., and Niu, X. (2021). A bite of eight Chinese culinary traditions. Beijing: Chemical Industry Press.
Phulkerd, S., Sacks, G., Vandevijvere, S., Worsley, A., and Lawrence, M. (2017). Barriers and potential facilitators to the implementation of government policies on front-of-pack food labeling and restriction of unhealthy food advertising in Thailand. Food Policy 71, 101–110. doi: 10.1016/j.foodpol.2017.07.014
Ruini, L. F., Ciati, R., Pratesi, C. A., Marino, M., Principato, L., and Vannuzzi, E. (2015). Working toward healthy and sustainable diets: the “double pyramid model” developed by the barilla center for food and nutrition to raise awareness about the environmental and nutritional impact of foods. Front. Nutr. 2:9. doi: 10.3389/fnut.2015.00009
Sivaguru, M., and Punniyamoorthy, M. (2020). Performance-enhanced rough k-means clustering algorithm. Soft. Comput. 25, 1595–1616. doi: 10.1007/s00500-020-05247-2
Song, G., Gao, X., Fullana-i-Palmer, P., Lv, D., Zhu, Z., Wang, Y., et al. (2019). Shift from feeding to sustainably nourishing urban China: a crossing-disciplinary methodology for global environment-food-health Nexus. Sci. Total Environ. 647, 716–724. doi: 10.1016/j.scitotenv.2018.08.040
Song, G., Li, M., Fullana-i-Palmer, P., Williamson, D., and Wang, Y. (2017). Dietary changes to mitigate climate change and benefit public health in China. Sci. Total Environ. 577, 289–298. doi: 10.1016/j.scitotenv.2016.10.184
Song, G., Li, M., Semakula, H. M., and Zhang, S. (2015). Food consumption and waste and the embedded carbon, water and ecological footprints of households in China. Sci. Total Environ. 529, 191–197. doi: 10.1016/j.scitotenv.2015.05.068
Springmann, M., Clark, M., Mason-D’Croz, D., Wiebe, K., Bodirsky, B. L., et al. (2018). Options for keeping the food system within environmental limits. Nature 562, 519–525. doi: 10.1038/s41586-018-0594-0
Springmann, M., Godfray, H. C. J., Rayner, M., and Scarborough, P. (2016). Analysis and valuation of the health and climate change co-benefits of dietary change. Proc. Natl. Acad. Sci. 113, 4146–4151. doi: 10.1073/pnas.1523119113
Sun, G., Cao, X., Chen, J., and Li, H. (2022). Food culture and sustainable development: evidence from firm-level sustainable total factor productivity in China. Sustain. For. 14:8835. doi: 10.3390/su14148835
Tilman, D., and Clark, M. (2014). Global diets link environmental sustainability and human health. Nature 515, 518–522. doi: 10.1038/nature13959
Tobler, C., Visschers, V. H. M., and Siegrist, M. (2011). Eating green. Consumers’ willingness to adopt ecological food consumption behaviors. Appetite 57, 674–682. doi: 10.1016/j.appet.2011.08.010
Tucci, M., Martini, D., Del Bo, C., Marino, M., Battezzati, A., Bertoli, S., et al. (2021). An Italian-Mediterranean dietary pattern developed based on the EAT-lancet reference diet (EAT-IT): a nutritional evaluation. Food Secur. 10:558. doi: 10.3390/foods10030558
van Dooren, C., Keuchenius, C., de Vries, J. H. M., de Boer, J., and Aiking, H. (2018). Unsustainable dietary habits of specific subgroups require dedicated transition strategies: evidence from the Netherlands. Food Policy 79, 44–57. doi: 10.1016/j.foodpol.2018.05.002
van Dooren, C., Marinussen, M., Blonk, H., Aiking, H., and Vellinga, P. (2014). Exploring dietary guidelines based on ecological and nutritional values: a comparison of six dietary patterns. Food Policy 44, 36–46. doi: 10.1016/j.foodpol.2013.11.002
von Braun, J., Afsana, K., Fresco, L. O., and Hassan, M. (2021). Food systems: seven priorities to end hunger and protect the planet. Nature. Available at: https://www.nature.com/articles/d41586-021-02331-x?error=cookies_not_supported&code=2e910170-aecd-4fce-b99f-a509f56a6a5f (Accessed December 15, 2022).
Volta, M., Turrini, E., Carnevale, C., Valeri, E., Gatta, V., Polidori, P., et al. (2021). Co-benefits of changing diet. A modelling assessment at the regional scale integrating social acceptability, environmental and health impacts. Sci. Total Environ. 756:143708.
Westhoek, H., Lesschen, J. P., Rood, T., Wagner, S., De Marco, A., Murphy-Bokern, D., et al. (2014). Food choices, health and environment: effects of cutting Europe's meat and dairy intake. Glob. Environ. Chang. 26, 196–205. doi: 10.1016/j.gloenvcha.2014.02.004
Willett, W., Rockström, J., Loken, B., Springmann, M., Lang, T., Vermeulen, S., et al. (2019). Food in the Anthropocene: the EAT–lancet commission on healthy diets from sustainable food systems. Lancet 393, 447–492. doi: 10.1016/s0140-6736(18)31788-4
Willett, W. C., Sacks, F., Trichopoulou, A., Drescher, G., Ferro-Luzzi, A., Helsing, E., et al. (1995). Mediterranean diet pyramid: a cultural model for healthy eating. Am. J. Clin. Nutr. 61, 1402S–1406S. doi: 10.1093/ajcn/61.6.1402s
Ye, Q., Bruckner, M., Wang, R., Schyns, J. F., Zhuo, L., Yang, L., et al. (2022). A hybrid multi-regional input-output model of China: integrating the physical agricultural biomass and food system into the monetary supply chain. Resour. Conserv. Recycl. 177:105981. doi: 10.1016/j.resconrec.2021.105981
Yin, J., Yang, D., Zhang, X., Zhang, Y., Cai, T., Hao, Y., et al. (2020). Diet shift: considering environment, health and food culture. Sci. Total Environ. 719:137484. doi: 10.1016/j.scitotenv.2020.137484
Zavaleta, C., Berrang-Ford, L., Llanos-Cuentas, A., Cárcamo, C., Ford, J., Silvera, R., et al. (2017). Indigenous Shawi communities and national food security support: right direction, but not enough. Food Policy 73, 75–87. doi: 10.1016/j.foodpol.2017.10.001
Zhang, J., and Chai, L. (2022). Trade-off between human health and environmental health in global diets. Resour. Conserv. Recycl. 182:106336. doi: 10.1016/j.resconrec.2022.106336
Keywords: water footprint, carbon footprint, ecological footprint, sustainable diets, food culture
Citation: Zheng J, Yang H, Li S and Chai L (2024) Environmental footprints in divergent cuisines: a case study of eight Chinese culinary traditions. Front. Sustain. Food Syst. 8:1366208. doi: 10.3389/fsufs.2024.1366208
Edited by:
Miguel Angel Prieto Lage, University of Vigo, SpainReviewed by:
Aurup Ratan Dhar, University of Minnesota, United StatesPaula Barciela, University of Vigo, Spain
Copyright © 2024 Zheng, Yang, Li and Chai. This is an open-access article distributed under the terms of the Creative Commons Attribution License (CC BY). The use, distribution or reproduction in other forums is permitted, provided the original author(s) and the copyright owner(s) are credited and that the original publication in this journal is cited, in accordance with accepted academic practice. No use, distribution or reproduction is permitted which does not comply with these terms.
*Correspondence: Li Chai, Y2hhaWxpQGNhdS5lZHUuY24=