 Murad Bal1
 Elif Gokcen Ates1,2Furkan Erdem1
 Gokcem Tonyali Karsli1
 Melis Cetin Karasu1Ozlem Ozarda3Behic Mert1
 Mecit H. Oztop1*
- 1Department of Food Engineering, Middle East Technical University, Ankara, Türkiye
- 2Department of Food Engineering, Cankiri Karatekin University, Cankiri, Türkiye
- 3SELUZ Fragrance and Flavor Company, Istanbul, Türkiye
In this study, a new functional product using Mediterranean ingredients (tomato, tomato peel powder and olive powder) was formulated where two different concentrations of protein (1 and 2%) and peel (2 and 4%) were tested. Olive powder was kept at a constant concentration of 2%. Physico-chemical, Rheological, and Sensorial analysis were carried out on the formulated samples. Soluble protein content was found as the highest in the sample containing 4% peel and 2% protein and it was affected by the pH and tomato peel concentration. Rheological results reveal shear-thinning behavior, as defined by the Herschel-Bulkley model, with protein and peel concentrations having a major influence on yield stress and viscosity. A positive trend was noticed between apparent viscosity and peel concentration, meantime protein concentration affected apparent viscosity adversely. Contrary relation between consistency index (k) values and apparent viscosity illustrate the complex interaction between protein and peel, particularly at higher concentrations. Furthermore, Principal Component Analysis (PCA) was used to investigate the complicated sensory landscape of tomato products with different quantities of pea protein and tomato peel. While higher tomato peel and protein levels have no direct impact on rheological qualities, they do add to astringency and sourness, which influences overall acceptability. Remarkably, the sample with the greatest quantities of peel and protein exhibits a delicate balance, with a loss in perceived tomato taste intensity and overall acceptability offsetting an increase in astringency. In terms of overall acceptability, the most preferred beverage was selected as the sample formulated with 2% peel and 1% protein.
1 Introduction
Tomato is an essential food for the Mediterranean diet and is often used to enhance the flavor of the dishes. Tomato contains high amounts of antioxidants that protect the body’s cells from harmful free radicals and have protective effects against cancer (Collins et al., 2022). Tomato contains high amounts of lycopene which is an important antioxidant and has been shown to prevent cardiovascular diseases (Zeng et al., 2019). Tomatoes are also rich in nutrients such as vitamin C, vitamin E, quercetin, and lutein (Dorais et al., 2008).
Tomato peel contains significant amount of pectin, which is why it is often used to extract pectin for commercial use. The pectin content in tomato peel is an important factor on the texture and viscosity of tomato-based products. The pectin in tomato peel can contain both high methoxyl (HM) and low methoxyl (LM) pectin, depending on the tomato variety and the ripeness of the fruit (Hyodo et al., 2013). HM pectin is more commonly found in unripened tomatoes, while LM pectin is more prevalent in ripened tomatoes. This is because the degree of methoxylation decreases as the tomato ripens, which can result in an increase in the proportion of LM pectin in the peel (Lurie et al., 2003).
Protein-enriched tomato juice can be produced by adding protein sources to increase the protein content of a regular tomato juice. These protein sources include a variety of options such as plant proteins. As a plant protein source, soy and pea have been gaining popularity due to their well-balanced amino acid composition and desirable functional properties such as emulsification and gelling (Nishinari et al., 2014). Pea protein is a popular and relatively new plant-based protein source in the food industry due to its availability, cost-effectiveness, nutritional value, and health benefits. In comparison to the other cereal protein sources, pea protein has a balanced amino acid profile with a high amount of lysine and relatively low levels of sulfur-containing amino acids (Reinkensmeier et al., 2015). There are four major types of pea protein which are globulin, albumin, prolamin, and glutelin. Globulin is the main storage protein in peas, making up 55–65% of total proteins, and can be further classified into two types: 11S legumin and 7S vicilin (Barac et al., 2010). Pea albumin is also a rich source of amino acids, particularly lysine. It is a water-soluble protein that makes up around 18–25% of the total protein in pea seeds (Emkani et al., 2021). The functionality of pea protein is strongly pH-dependent, which can significantly influence its behavior in food processing, storage, and consumption.
One particular challenge is the application of pea protein in fortified beverages such as protein shakes or sports drinks. Ideally, these beverages should have a pH range of 4–6 to avoid astringency problems (Wagoner and Foegeding, 2017). It is known that pH significantly affects the protein solubility. Proteins have the lowest solubility at their isoelectric point, a crucial pH value where a protein carries no net charge, while their solubility increases as they move away from this point (Burger and Zhang, 2019). Pea protein, which is often used in these beverages, has a negative charge at neutral pH, causing repulsive forces in the solution. However, with decrease in the pH by the acidification, pea protein becomes neutral by losing its negative charge and starts to aggregate. Therefore, the functionality of pea protein can be enhanced by forming soluble complexes with HMP, which is a promising approach (Lan et al., 2018).
The aim of this study is to investigate the potential of fortifying a tomato product with pea protein, tomato peel and olive powder. The study will evaluate the effects of different concentrations of pea protein, peel powder on the viscosity, color, lycopene content, and sensory properties of the juice products and determine the best fortification levels to achieve a desirable balance between nutritional benefits and consumer acceptability. The findings of this study could provide valuable insights into the development of healthier and more nutritious tomato-based food product with improved sensory attributes. This study ultimately aims to design a new tomato based functional product for the purpose of “reformulating traditional Mediterranean tomato products” and create an awareness on the Mediterranean consumers.
2 Materials and methods
2.1 Preparation of the tomato sauce
Kraft Heinz (Bursa, Turkiye) provided the Roma tomato variety known for their egg-like shapes, bright red colors and smooth skins. Before being transformed into reformulated sauce, raw tomatoes were subjected to a hot-break process. Following peeling, hot break was performed at 85°C for 3 min using Vorwerk’s Termomix (Worverk & Co. KG, Wuppertal, Germany). Following hot-breaking, samples were cooled in an ice bath and stored at −79°C until further processing. Tomato peel powder was obtained by drying the peeled tomato skins using a 55°C-household type dehydrator (Klarstein Fruit Jerky 9, Berlin Brands Group, Berlin, Germany) for 24 h.
Freeze dried olive powders were produced (using the olive obtained from Marmara region of Türkiye) following the procedures explained in a previous study (Arğün, 2022). Pea protein (PP) isolate was purchased by Vegrano (Lucca, Italy). Before each treatment, frozen hot-break tomatoes were thawed at room temperature. To obtain a homogeneous mixture, samples were sieved twice (500 μm) to remove the seeds and the pulp. The samples were kept in a refrigerator (Vestel, Manisa, Turkiye) at 4°C until they were reformulated into sauce. Afterwards, 1% salt and 2% olive powder were added and later mixed in a magnetic stirrer. Pea protein isolate and tomato peel powder were added at 2 concentrations: 1 and 2% for protein and 2 and 4% for peel powder. A full-factorial design was used for the experiments with 2 factors and 2 levels each: protein and tomato peel powder. Once the mixture is obtained, 200 mL of the product was mixed for 5 min with the help of a high shear homogenizer at 14,000 rpm (IKA T18, Staufen, Germany). Formulation names are given in Table 1.
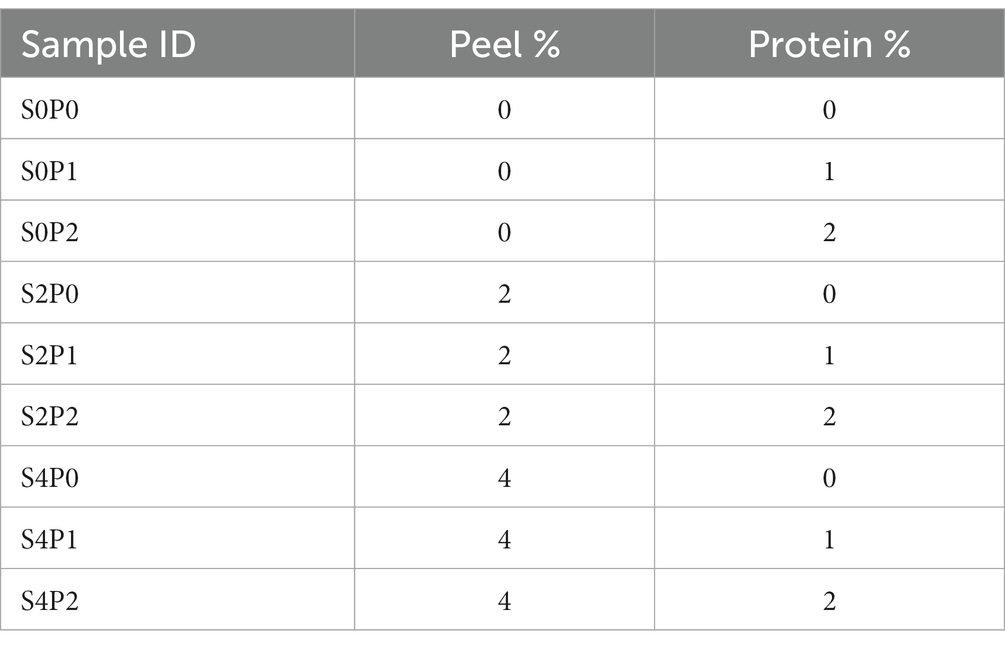
Table 1. Sample ID for different peel and protein concentrations.
2.2 Characterization of tomato juice
2.2.1 Soluble solid content
The soluble solid content of the products was measured by a hand refractometer (Hanna Instruments, HI96801, George Washington Hwy Smithfield, USA). °Brix values were reported at 25°C. Measurements were carried out at least 3 times.
2.2.2 Moisture content
Moisture content measurements were carried out using an air oven (Mikrotest, MST-120, Ankara, Türkiye). Samples were kept in an oven at 105°C for at least 6 h. The samples were incubated until the difference between each measurement was less than 0.5%.
2.2.3 Soluble protein content
For soluble protein content determination, Lowry method was followed (Ertugrul et al., 2021). First, 10 mL of the sample was poured into 15 mL tubes and centrifugated at 4,000 rpm for 5 min. Later, 0.5 mL of the supernatant was mixed with 2.5 mL of Lowry Reagent and the mixture was kept at room temperature for 10 min. Then, 0.25 mL of Folin–Ciocalteu reagent was added and the mixture was kept in dark at room temperature for 30 min. Lastly, absorbance values were read at 680 nm by using a spectrophotometer (Optizen Pop Nano Bio, Daejeon, Korea). The calibration curve was prepared by using 1 g/L Bovine Serum Albumin (BSA) solution.
2.2.4 Color
Color of the products was measured using spectrocolorimeter (Serlab SL400, İstanbul, Türkiye) Lightness (L*), red-green (a*), and blue-yellow (b*) values were recorded.
2.2.5 Lycopene content
Lycopene content was determined using the method of Pieper and Barrett (2009) with slight modifications. Briefly, ~100 g of sample was high shear homogenized (IKA T18, Staufen, Germany) at 10,000 rpm for 3 min before extraction. 100 mg aliquot from the homogenized sample was mixed with 4 mL hexane, 2 mL ethanol, 2 mL acetone in a glass tube and vortexed for 30 s before being left to sit for 30 min. After 30 min, solution was mixed with 1 mL of distilled water and vortexed again for 30 s before being left to sit for another 10 min to allow hexane portion to separate. An aliquot of the upper layer was then read at 503 nm (Optizen Pop, Mecasys, Daejeon, Republic of Korea). Hexane-ethanol-acetone mixture was used as the blank. Lycopene content of the samples was then determined using the following formula.
Where; Abs503 is the absorbance of sample at 503 nm, MWlycpone is the molecular weight of lycopene, R is the volumetric ratio of the upper layer compared to whole, V is the volume hexane-ethanol-acetone mixture, msample is the weight of sample, and F is the molar constant for lycopene in hexane (172 1/mM).
2.2.6 Flow properties
Flow behavior of the sauce sample was determined using cup and bob type rheometer (Kinexus Dynamic Rheometer, Malvern, Worcestershire, U.K.). Shear stress and shear rate curves were obtained within a shear rate of 100 s−1 – 1000 s−1. Temperature was kept constant at 20°C. At least five measurements were taken.
Rheological properties of the juice were determined by fitting shear stress (τ) -shear rate (γ) data to the Non-Newtonian models (Bingham, Power Law and Herschel Bulkley). Best fit was obtained for Herschel Bulkley model shown in the following equation where y0 is the yield stress (Pa), k is the consistency factor (Pa·sn), and n is the flow behavior index.
2.2.7 Time domain-nuclear magnetic resonance
TD-NMR experiments were performed using a 0.5 Tesla (20.34 MHz, 1H proton frequency) system (Spin Track GmbH, Kirchheim/Teck, Stuttgart, Germany). T2 (spin–spin relaxation) was measured using Carr-Purcell-Meiboom-Gill (CPMG) sequence. Echo time was set to 6 ms, and number of echoes changed between 700 and 1,000 depending on the formulation. Repetition time of 300 ms was used to ensure the complete recovery of the magnetization. T1 (Spin Lattice relaxation times) was measured using a saturation recovery sequence. Delay times changed between 1 and 350 ms. Sixteen scans were used for both T1 and T2 measurements. The results were analyzed by using MATLAB.
2.2.8 Sensory evaluation
For sensory analysis, 5 trained panelists from SELUZ Fragrance & Flavor Company in Türkiye were involved. The samples to be evaluated were kept in a dark environment and at 4°C for one day. All samples were presented to the panelists at the same temperature and in equal amounts. Samples served to sensory panelists were identified with three-digit random codes to prevent subconscious selection of a sample due to identification. The panel room evaluated was an odor-free, neutral, daylight-lit environment. A constant room temperature between 22 and 24°C and a relative humidity of 45–55% was maintained to assure comfort and a constant environment. The panel was carried out in 2 stages. Flavor profile analysis methodology (ISO 6564:1985) was used. The Flavor Profile method describes flavor in terms of five major components: tomato taste, tomato paste taste, tomato juice taste sweetness, saltiness, sourness-astringency, off-taste, flavor density, spicy notes, and overall acceptance. The original scale for the flavor profile was 5 points: not present, threshold, slight, moderate, strong, but in practice, attributes that were not present were not given zeros, they simply were not mentioned in the profile. In the first session, the panelists evaluated the products individually, and in the second session, the results of the individual evaluations were evaluated with all the panelists and a consensus was reached on the flavor characteristics.
2.3 Statistical analysis
The experimental data were analyzed using ANOVA (Analysis of Variance) (Minitab Inc., v19, PA, United States). Tukey’s comparison test was applied at a confidence interval of 95%. Before conducting the analysis, the assumptions of ANOVA were checked, and if deemed necessary, outliers were excluded from the data set. It is important to note that each result was replicated a minimum of three times. For the sensory evaluation, principal component analysis was conducted by using Minitab to examine the differences in the physical and sensory characteristics of tomato products.
3 Results and discussion
3.1 Soluble solid content and moisture content
Soluble solid content of tomato products was reported as °Brix in Table 2. The results showed that increasing the peel concentration (2, 4%) caused a significant increase in °Brix values (p < 0.05) as expected. The addition of peel represents the presence of higher dissolved solids and therefore higher °Brix values. On the other hand, increasing the pea protein concentration (1, 2%) did not a significant effect on the °Brix values for both protein concentrations (p > 0.05). This might be explained with pH of the tomato products. It is known that pH significantly affects the protein solubility. Proteins have the lowest solubility at their isoelectric point (pI), the pH value where a protein carries no net charge, while their solubility increases as they move away from this point (Burger and Zhang, 2019). A representative curve for pH vs. solubility was provided in Figure 1. The isoelectric point of the pea protein is around pH 4.5 (D’Alessio et al., 2023). In this study, since the pH of tomato products exactly coincides with the isoelectric point of the pea protein, its solubility was low and therefore it did not contribute to the increase of °Brix values. It was observed that the °Brix values decreased only at 2% peel and 2% pea protein concentration. The pH value for this product was higher than the other products (Table 2) and closer to the pI. Although the soluble protein content might have not changed for this formulation at 1 & 2% protein concentration, it is likely that more aggregates have been formed and decreased the oBrix values more.
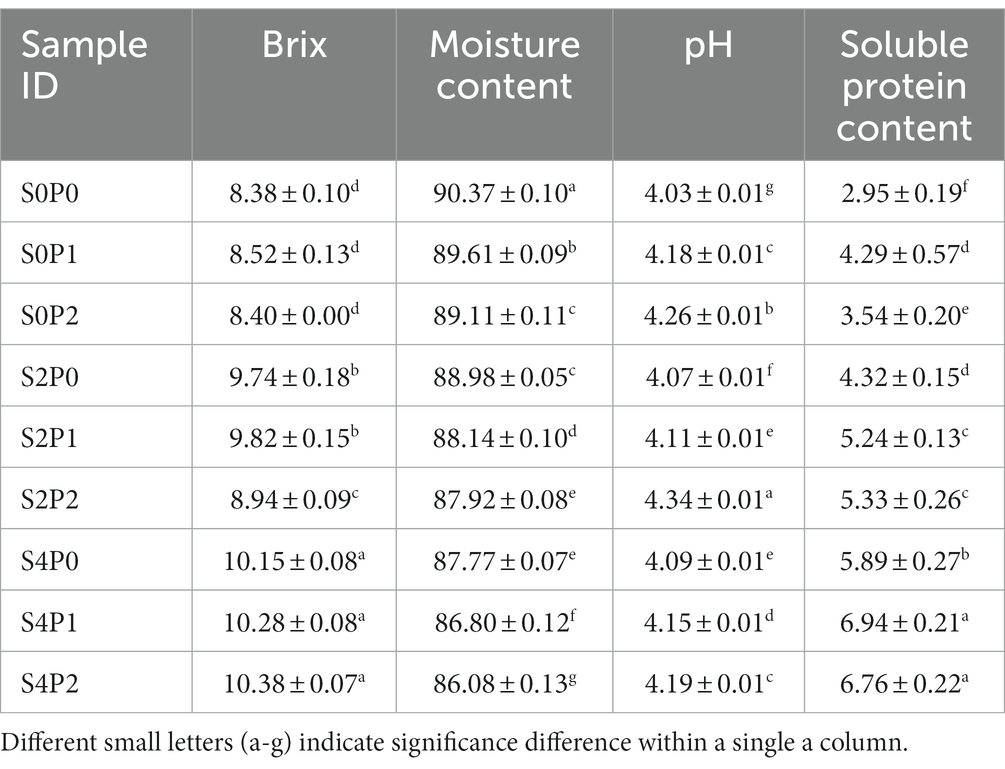
Table 2. Brix, moisture content, pH and soluble protein content of tomato products.

Figure 1. Representative curve for pH vs. solubility.
3.2 Soluble protein content and pH
The pH and soluble protein concentration results are shown in Table 2. The lowest pH (pH of 4.03) was obtained for the S0P0 sample.
It was observed that for all peel concentrations, pH increased significantly (p < 0.05) as the pea protein content increased. Pea protein isolates had high amount of glutamine, followed by aspartic acid, arginine, and lysine, with lower contributions of methionine, tryptophan, and cysteine (Dahl et al., 2012). As the concentration of pea protein increases, the basic amino acid such as lysine and arginine also increases, leading to an increase in pH (Barac et al., 2010).
According to these results, as peel concentration increased, soluble protein content also increased significantly (p < 0.05). The amount of protein in the tomato skin may have also caused an increase in the soluble protein content. Tomato peels contain about 10–20 g-protein/100 grams-peel (Boukhalfa-lezzar et al., 2014; Elbadrawy and Sello, 2016). For our samples, protein content of the peel powder was found as 7.8% (in dry basis). This amount of protein may have contributed to the total amount of soluble protein.
Soluble protein content of the proteins is also strongly affected by the pH. Considering the pH and soluble protein content results together, when the pH approaches 4.5 (with increasing protein content), that is, when it approaches the pI of pea protein, a decrease in protein solubility is expected. For 2 and 4% peel powder concentrations, the soluble protein amount did not change significantly with increasing protein amount which confirmed this finding. In the absence of peel powder, soluble protein content also decreased significantly with increasing protein concentration (1➔ 2%) as pH increased from 4.18 to 4.26 (p < 0.05) which confirmed the effect of pH on the solubility of the proteins.
3.3 Color
Table 3 represents the effect of different concentrations of peel and protein on the color of the tomato samples. Colors of the samples were reported in CIEL*a*b* color system. As peel concentration increased lightness value decreased significantly (p < 0.05). Moreover, addition of protein to the samples also increased the lightness of the samples due to its whitish nature. A similar trend was also reported before (Chavan et al., 2015; Ren and Giusti, 2021). Addition of tomato peel powder improved the red color of the samples as well. It was seen that samples containing protein had more reddish color (higher a* values) compared to ones that did not include proteins. According to the b* values, peel amount did not seem to have a big impact. Protein addition, on the other hand, contributed to the yellow range and increased the b* values significantly.
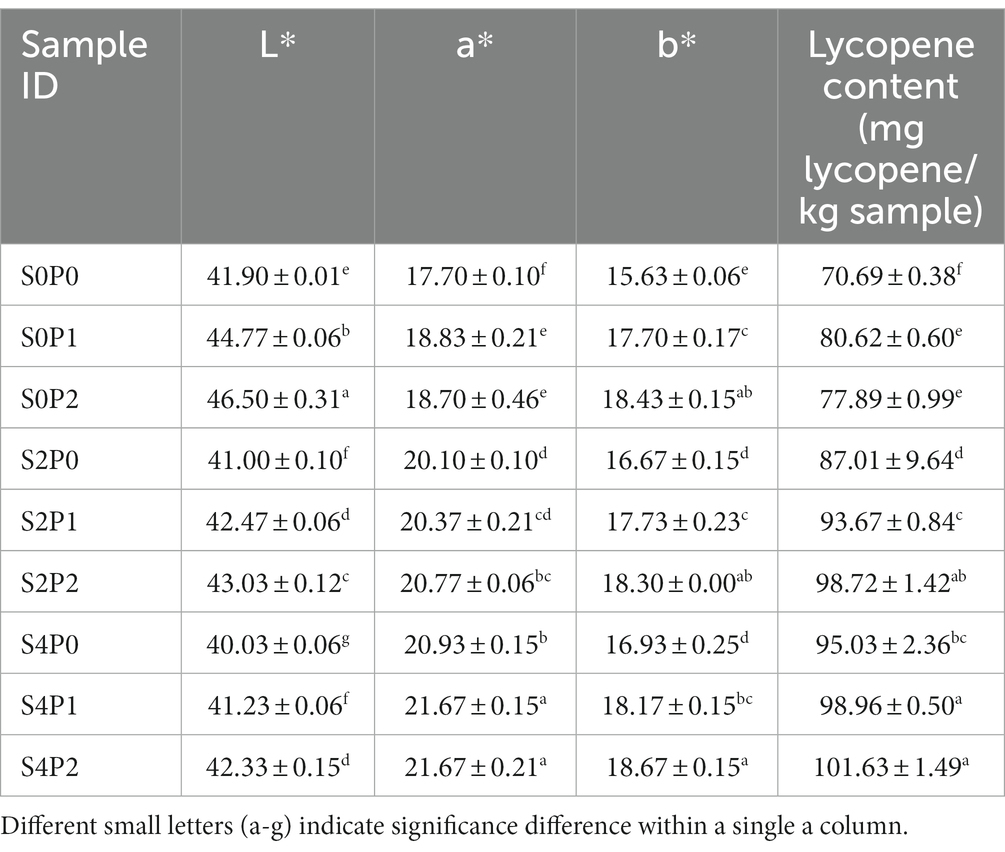
Table 3. Color and lycopene content of tomato products.
3.4 Lycopene content
Lycopene contents of the samples are presented in Table 3. Increasing concentrations of pea protein, and tomato peel powder were seen to positively impact the lycopene content compared to S0P0 sample (p < 0.05). The lowest lycopene content was observed in S0P0 samples, whereas the highest values were observed for S2P2 and S4P1, S4P2 samples. Lycopene content of S0P0 sample were in accordance with other studies, where Roma tomato lycopene content was reported in the range of 65 to 70 mg/kg (Odriozola-Serrano et al., 2008; Gupta et al., 2011). Addition of the components individually increased the lycopene content of samples significantly (p < 0.05). Tomato peel is reported in literature as a great source of lycopene and other carotenoids compared to the other by-products of the juice production process, and peel powder addition in food products has been shown to improve the lycopene content significantly, Knoblich et al. (2005) and Luisa García et al. (2009). Addition of olive powder had a positive impact on the lycopene concentration in the samples. This is likely due to increased availability of lycopene in the presence of oil due to its hydrophobic properties (Desmarchelier and Borel, 2017; Liang et al., 2021). As the olive powders used in this study were obtained directly from olives, their oil content is completely preserved (Arğün, 2022) and the presence of oil further enabled interactions with lycopene. While addition of the pea protein increased the lycopene content, this increase was seen to diminish for 4% peel powder containing samples (S4P1 & S4P2) (p > 0.05) (Table 3). Study of Iddir et al. (2021) had also shown increased bio-accessibility and availability of total carotenoids in tomato juice (71.5% lycopene) when enriched with various protein isolates (Iddir et al., 2021). Their study showed that proteins were predominantly absorbed via their hydrophobic portions, helped to incorporate other components. However, while the presence of olives had increased the availability of lycopene, incorporation of proteins at increased concentrations to the samples containing more peel powder may have oversaturated the matrix, as well as making its structure more complex. A more complex and competitive system is anticipated to negatively impact componential interactions. Negative impact of more complex matrices on the soluble carotenoids was also described in other studies (Desmarchelier and Borel, 2017).
3.5 Flow properties
The effects of different concentrations of protein and peel combinations on the flow behavior of tomato-based samples are given in Table 4. The results suggested that tomato-based samples showed shear thinning behavior. Previous studies have frequently reported that various tomato-based food products obey to the Herschel-Bulkley model, characterizing them as shear-thinning non-Newtonian fluids (Koocheki et al., 2009; Gao et al., 2021).
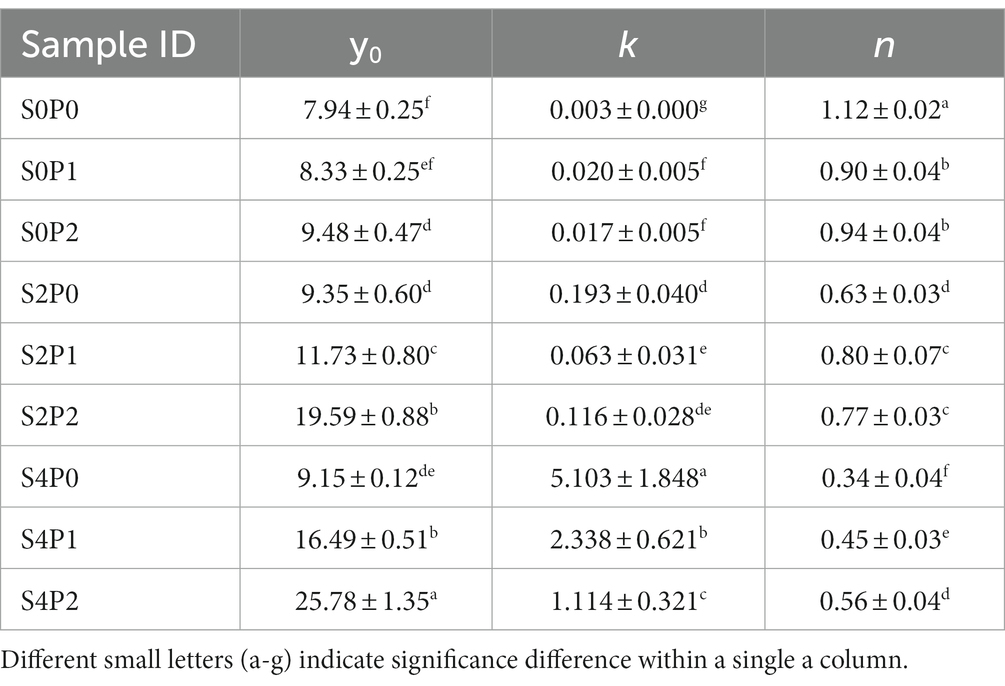
Table 4. Rheological properties of tomato products.
Results shown in Table 3 highlighted that both protein and peel concentrations had substantial and differing impacts on the Herschel-Bulkley parameters of the samples. These observations underscored the complexity of the interplay between the two components in determining the flow characteristics of the developed formulations. When protein concentration was low and no peel was added, the yield stress was at its minimum. A modest increase in yield stress was noted with the escalation of protein content, suggesting that protein concentration had a role in strengthening the material’s resistance to flow initiation. Interestingly, a more pronounced increase in yield stress was found when peel was incorporated into the mix. Specifically, samples with higher peel concentration, irrespective of the protein content, displayed significantly greater yield stress values. The highest yield stress was observed in samples containing the maximum concentration of both protein and peel. These findings highlight the synergistic or perhaps additive effects of protein and peel on the yield stress of the tomato-based products. The data suggested that while both protein and peel individually contribute to increasing yield stress, their combined presence may lead to more complex rheological behavior. This may be particularly important when optimizing the formulation of such products for desired textural and flow characteristics. The consistency index, represented by the k values, showed distinct variations based on the concentrations of protein and peel in the samples. With no peel present, a slight increase in k values was observed as protein concentration rose, suggesting that higher protein levels contribute to the material’s overall viscosity. However, the presence of peel introduced a more complicated relationship. When 2% of peel was added, the k values exhibited an increase, reaching a peak at the lower protein levels. Yet, the k values declined when both higher concentrations of peel and protein were present in the sample, indicating that the interactions between protein and peel may have a dampening effect on the apparent viscosity of the system. Interestingly, a drastic elevation in k values was found in the samples with the 4% peel concentration but with the 0% protein content.
In the analysis of samples containing 2 and 4% peel, it was noted that the predominant effect of protein addition was on the yield stress of these samples. Despite a decrease in consistency index (k) values, which would generally indicate reduced viscosity, the apparent viscosity of the samples in fact increased with higher protein content. This suggests that the presence of protein had a more significant impact on the yield stress, enhancing the material’s resistance to initial flow, rather than on its inherent viscosity as characterized by k value. This counterintuitive relationship between k values and apparent viscosity in the presence of protein indicates that the rheological behavior of these tomato-based products is not solely dictated by individual ingredient concentrations. Rather, it underscores the complex interactions between protein and peel, especially at higher concentrations, and their collective influence on both yield stress and apparent viscosity. Moreover, the rheological properties of the protein solutions are usually governed by various types of interactions including electrostatic and steric repulsions, or hydrophobic, and van der Waals attractions. In dilute solutions where there are large distances between the molecules, the interactions are usually explained with the long-range charge–charge repulsive interactions (Du et al., 2022). In a concentrated solution, proteins may also interact with surrounding molecules. In this study, for all peel concentrations, viscosity increase with increasing protein content is a good example of repulsive forces being dominant and limiting mobility. As mentioned earlier, the concentration of peel and protein increases, the viscosity, that is, the yield stress used to explain, increases considerably due to aforementioned interactions. Moreover, although the k value (consistency factor) seems to decrease as protein increases at high peel concentrations, this is actually thought to be because yield stress suppresses these model parameters and becomes dominant when explaining viscosity.
3.6 TD-NMR relaxometry
In this study, T2 relaxation times of the samples were also measured (Table 5). The NMR signal is a combination of the T2 relaxation decay of water protons in different compartments. T2 relaxation decay of the tomato samples was explained both by a mono exponential fitting where weighted average of the individual components are calculated and also by 2 components to see the changes observed in the individual proton pools (T21 and T22) (Alacik Develioglu et al., 2020; Unal et al., 2020; Ozel et al., 2021). T21 mostly corresponds to explain solid-water interactions (tightly bound), while T22 serves more to explain the mobility of bulk water. Moreover, percent relative areas refers to the proportion of a specific proton pool to the total area of all signals in a given NMR spectrum. This parameter is frequently used to calculate the amount or concentration of a specific component or functional group in a sample (Ilhan et al., 2020).
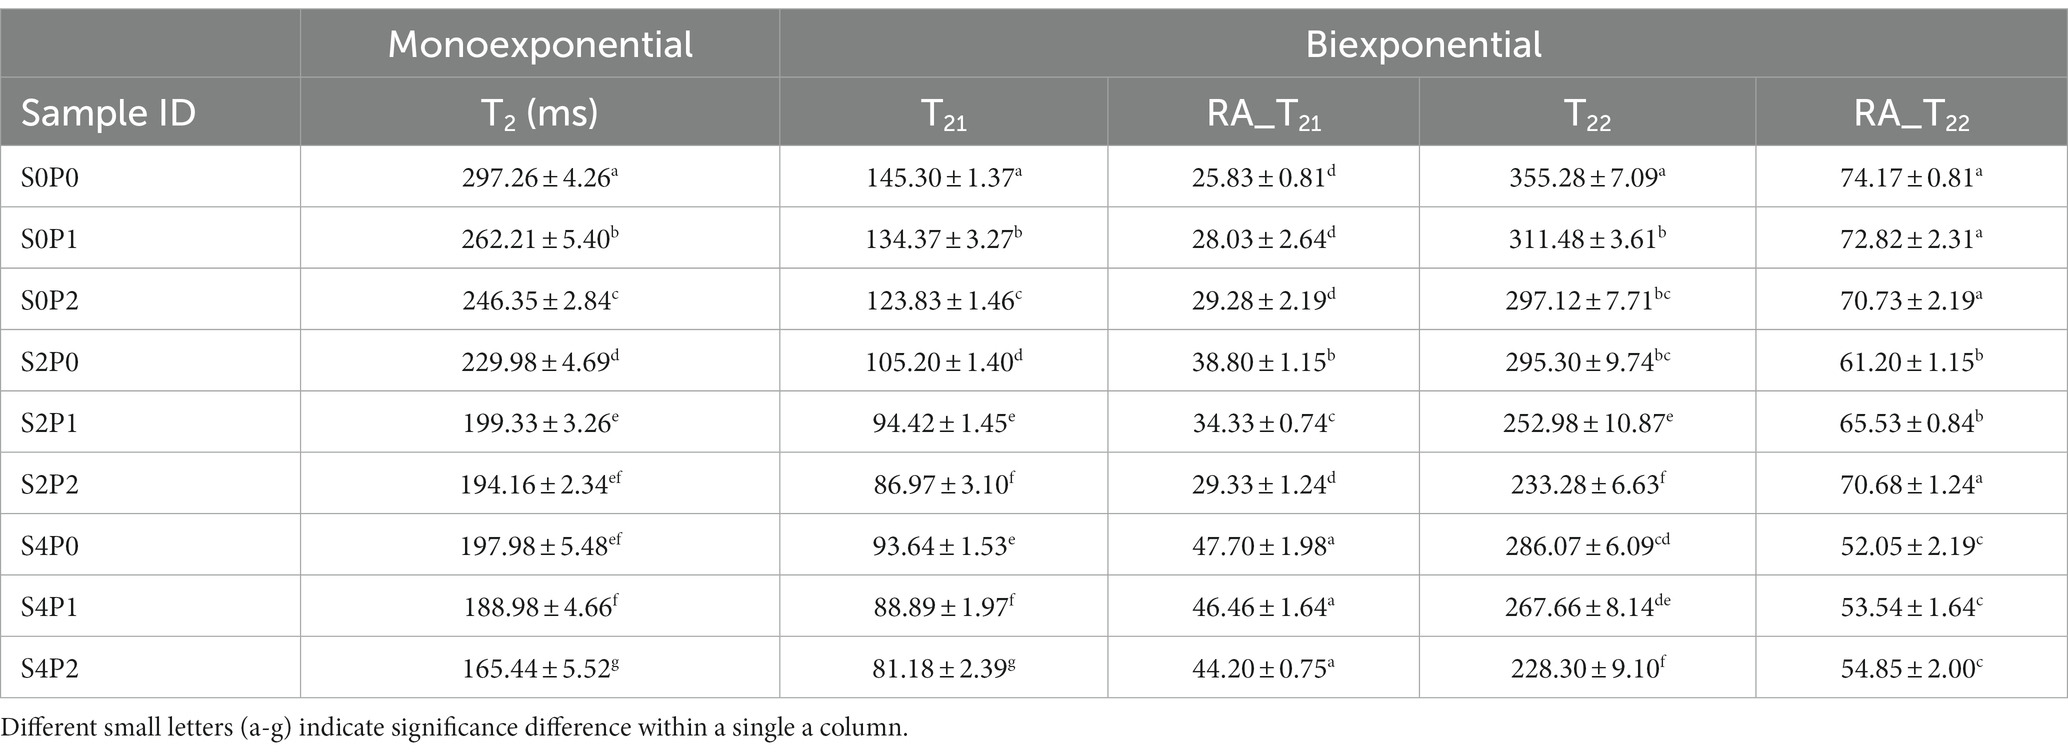
Table 5. TD-NMR relaxometry (T2 values) of tomato products.
For mono-exponential fitting, it was observed that different protein and peel concentrations had a significant effect on the T2 values of the samples. It was observed that T2 values decreased with the increase of pea protein and peel concentration. This suggests that the protein and/or peel powder limited the molecular mobility in the formulations and shortened the relaxation times (Ozel et al., 2017). Pectin and soluble fibers present in the peel powder trapped the water and limited its mobility. Therefore, the increase in the concentration of peel may have affected the consistency of the juice and shortened the T2 values. This result was also in accordance with the rheology results (Table 4). Likewise, the increase in peel concentration increased the viscosity of the samples, resulting in shortened T2 values (Korb et al., 2015; Agarwal et al., 2023).
In addition, in terms of biexponential fitting, as the concentration of pea protein and peel increases, T21 values generally decrease, while relative area of T21 increase. This indicated that the pea protein and the peel shortened the relaxation time of the juice and contributed more to the T21 component which proved that this proton pool was indeed related to protons strongly associated with the solid components present in the juice. The fact that the relative area of T21 increased with higher concentrations of pea protein and peel further confirmed the idea that the pea protein contributed more to the T21 component.
T22 on the other hand, is associated with proton pools having higher molecular mobility (Ilhan et al., 2020). As the tomato peel and pea protein concentration increased, T22 values decreased, while the relative areas decreased. Considering that the added peel is the peel of the tomato itself, the effect of components such as fiber and cellulose can be taken into account (López Bermúdez et al., 2022). Fiber or cellulose might limit the water mobility resulting in a decrease in T22. T22 provides insights into the interactions between water molecules and the peel, as well as potentially other components present in the juice. Lower T22 values indicate reduced water mobility, suggesting that water molecules may be more restricted in their movement due to interactions with the peel or other components. Moreover, as explained above, as peel concentration increased viscosity increases which decreases the molecular mobility of the sample. Higher viscosity implies that proton movement is restricted, resulting in shorter relaxation time (T22). This is because protons interact with their surroundings for a longer period, resulting in a faster decay of transverse magnetization. This decrease in molecular mobility can cause protons to move more slowly, affecting their relaxation properties.
3.7 Sensory evaluation
Principal component analysis (PCA) is a widely used multivariate analytical statistical technique that can be applied to reduce the set of dependent variables to a smaller set of underlying variables based on patterns of correlation among the original variables. The resulting data can then be applied to the following: profiling specific product characteristics; comparing and contrasting similar products based on attributes important to consumers; and altering product characteristics with the goal of increasing market share for a given set of products. Quantitative descriptive analysis was used to describe the key attributes of nine tomato paste products of various pea protein and tomato peel levels. The PCA analysis was conducted on the dataset consisting of variables related to tomato taste and overall acceptance, with peel and protein considered as the independent variables. The purpose of the analysis was to understand the relationships between these variables and identify any underlying patterns or clusters.
In the loading plot, variables that have strong positive or negative associations with PC1 were located closer to the respective end of the arrow (Figure 2). With this strategy of perceptual mapping, products that are similar to one another are positioned close to one another in the map, and products that are very different are far apart. Variables such as “tomato taste” “flavor density,” and “tomato juice taste” appeared to have strong positive associations with PC1. This suggested that higher values of these variables were associated with higher values of PC1. On the other hand, variables like “spicy notes” and “off-taste” had strong negative associations with PC1, indicating that higher values of these variables were associated with lower values of PC1. PC2 is the second most important component in terms of explaining the variance in the dataset. In the loading plot, variables like “tomato paste taste” and “saltiness” had strong negative associations with PC2, while “spicy notes” and “off taste” had a moderate positive association. Variables like “tomato taste,” “sourness-astringency,” and “overall acceptance” had positive associations with PC2. This suggested that higher values of the variables positively associated with PC2 corresponded to higher values of PC2, while higher values of variables negatively associated with PC2 correspond to lower values of PC2. PC2 appeared to capture a dimension related to the taste attributes such as tomato paste taste, saltiness, and spicy notes. It may represent a dimension of flavor intensity or specific taste characteristic.
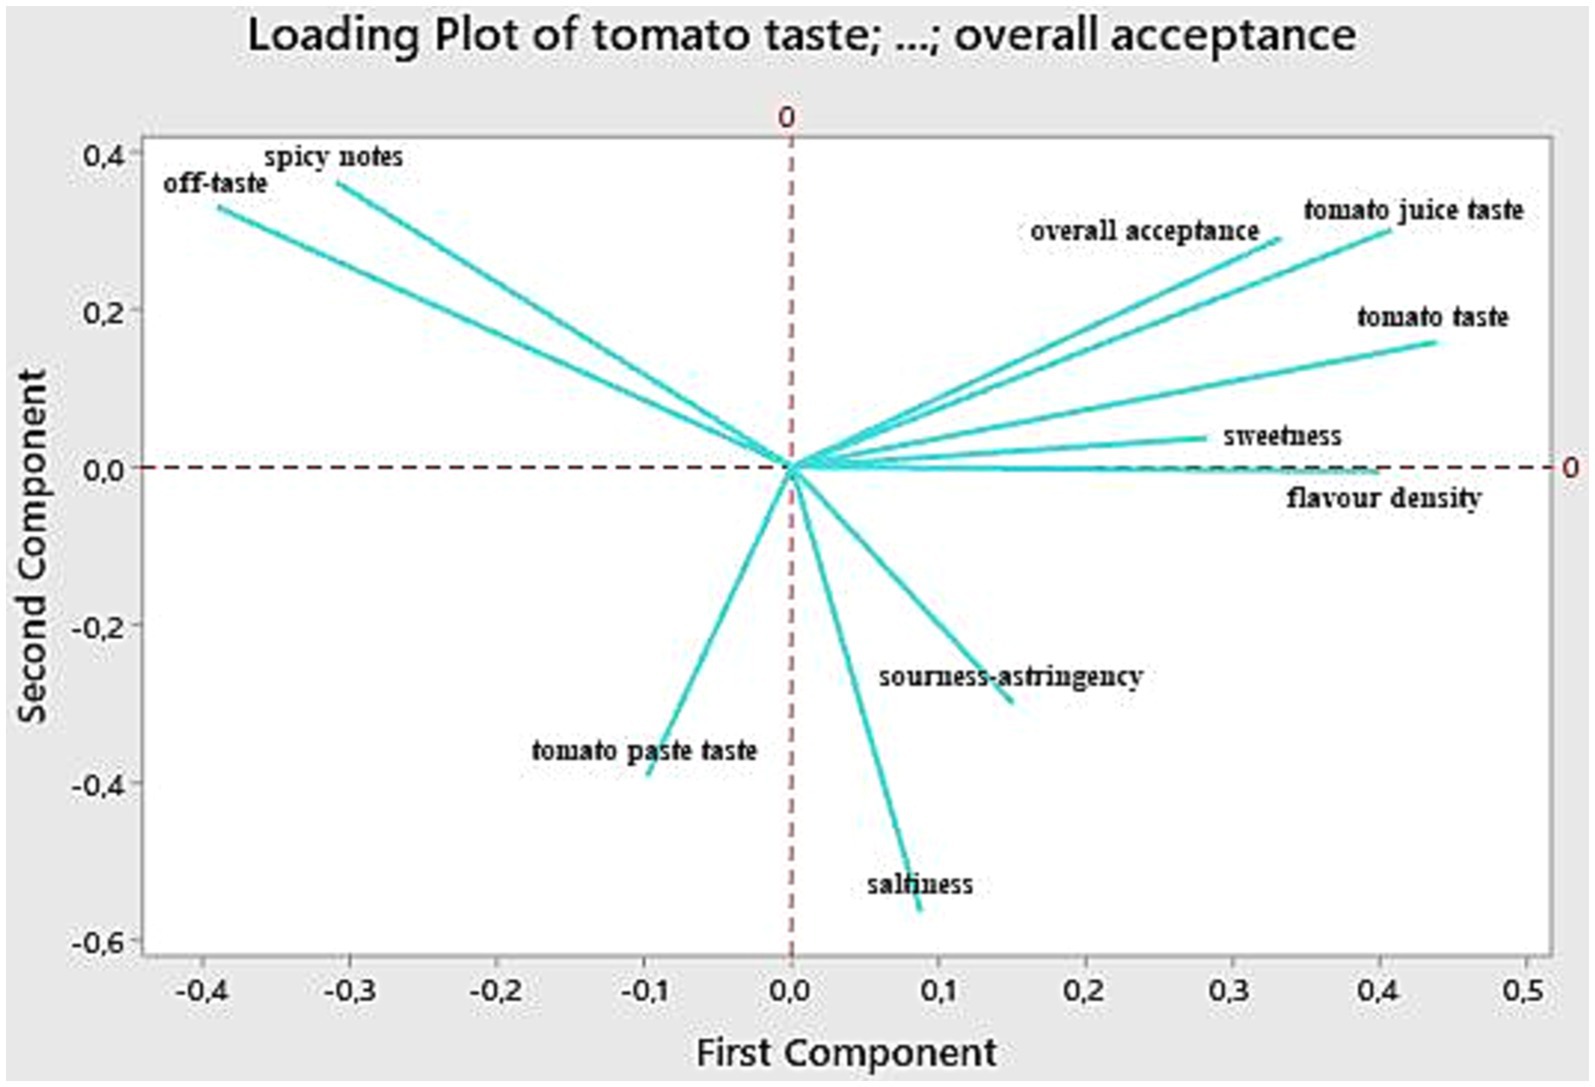
Figure 2. Loading plot of the principal component analysis.
Relations between samples can be visualized by using score plot (Figure 3). The score plot showed that S0P0 sample and the sample containing S2P1 was located on the right side of the plot with a positive score. This indicated that increasing the amount of tomato peel and protein in the product does not directly affect the sensory perception of tomato taste and the perception of tomato flavor intensity. Panelists found the tomato sample containing S2P1 as the most successful product in terms of flavor profile which was also justified by PCA. Moreover, the samples which are located far from previous samples were S2P2, S4P0 and S4P1 samples. This shows that increasing the amount of tomato peel also increases the sensory perception of astringency and sourness. They were negatively associated with both PC1 and PC2. On the other hand, the sample containing S4P2 was located at the upper left side of the score plot which indicated a negative score in PC1 and a positive score in PC2. It can be interpreted that when the amount of tomato peel and protein in the product is increased to the highest level, the characters such as tomato taste and tomato juice that are expected to be perceived are perceived weaker and therefore the total acceptability is moved away. The intensity of the tomato flavor in this sample, the clear perception of the juicy and fleshy parts, and the lack of intense tomato paste flavor were important for this attribute.
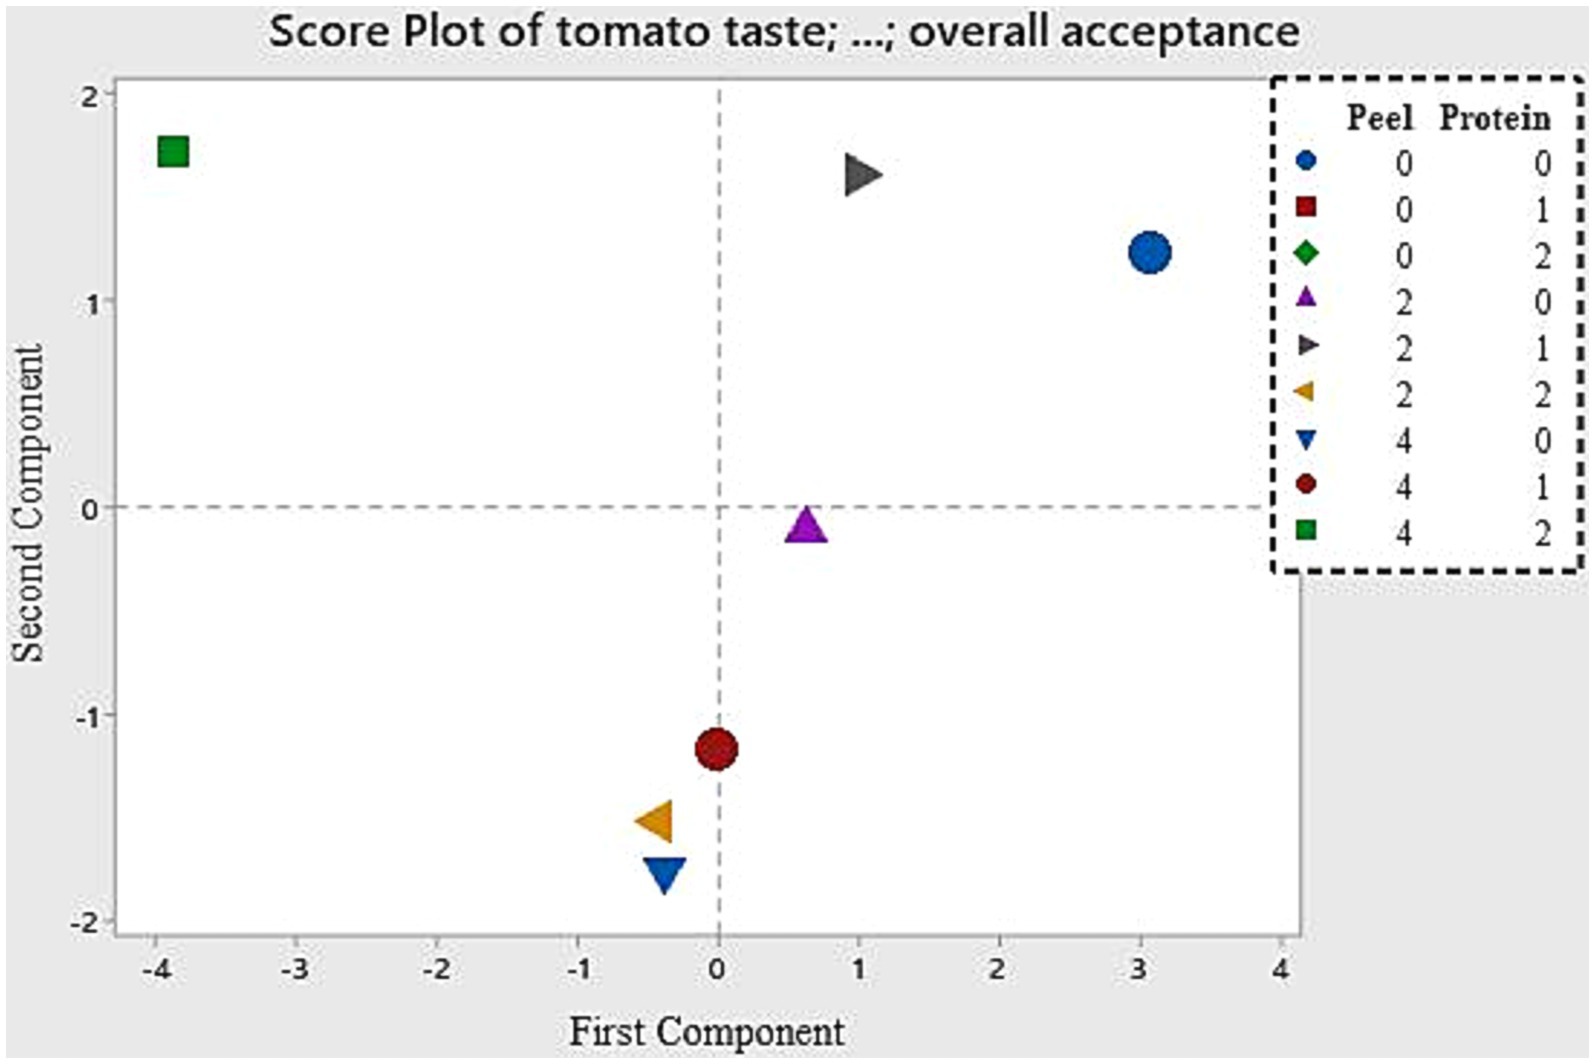
Figure 3. Score plot of the principal component analysis.
4 Conclusion
In this study a new tomato product enriched with olive powder, pea protein and tomato peel powder was produced and an extensive physicochemical and sensorial characterization was performed. Compared to the control tomato samples (without any ingredients), adding pea protein and peel powder led to an increase in lycopene content known for its anticancer properties. Protein enrichment, in general, increased soluble protein content; however, in certain conditions, it remained constant since pH is also a key factor in protein solubility. oBrix and moisture content decreased as protein and peel concentrations increased. The rheological properties of the samples were found to be very dependent on the intermolecular forces between the hydrocolloids present in the solution. While viscosity increases as the peel concentration increases due to stronger long-range interactions, viscosity decrease with the protein increase was attributed to the short-range interactions. In terms of sensorial attributes, the sample formulated with 2% peel and 1 protein % was found the best product for overall acceptability.
Data availability statement
The raw data supporting the conclusions of this article will be made available by the authors, without undue reservation.
Ethics statement
Ethical approval was not required for the studies involving humans because the sensory study was performed by a company specializing in Sensory Analysis. The company provided a letter showing that ethical requirements were satisfied. The studies were conducted in accordance with the local legislation and institutional requirements. The participants provided their written informed consent to participate in this study.
Author contributions
MB: Data curation, Formal analysis, Methodology, Writing – original draft. EA: Formal analysis, Methodology, Writing – original draft. FE: Data curation, Writing – original draft. GT: Data curation, Investigation, Methodology, Writing – original draft. MK: Data curation, Writing – original draft. OO: Data curation, Writing – review & editing. BM: Methodology, Writing – original draft. MO: Funding acquisition, Investigation, Project administration, Supervision, Writing – review & editing.
Funding
The author(s) declare financial support was received for the research, authorship, and/or publication of this article. This study is funded by European Union’s Horizon 2020-PRIMA Section I Program under grant agreement number of 2032 named as FunTomP.
Conflict of interest
OO was employed by SELUZ Fragrance and Flavor Company, Türkiye.
The remaining authors declare that the research was conducted in the absence of any commercial or financial relationships that could be construed as a potential conflict of interest.
Publisher’s note
All claims expressed in this article are solely those of the authors and do not necessarily represent those of their affiliated organizations, or those of the publisher, the editors and the reviewers. Any product that may be evaluated in this article, or claim that may be made by its manufacturer, is not guaranteed or endorsed by the publisher.
Supplementary material
The Supplementary material for this article can be found online at: https://www.frontiersin.org/articles/10.3389/fsufs.2024.1358520/full#supplementary-material
References
Agarwal, D., Kim, E. H. J., Feng, L., Wade, C., Moggré, G. J., Morgenstern, M. P., et al. (2023). Microstructure, rheological and water mobility behaviour of plant-based protein isolates (pea and quinoa) and locust bean gum mixtures. Food Res. Int. 164:112311. doi: 10.1016/j.foodres.2022.112311
Alacik Develioglu, I., Ozel, B., Sahin, S., and Oztop, M. H. (2020). NMR Relaxometry and magnetic resonance imaging as tools to determine the emulsifying characteristics of quince seed powder in emulsions and hydrogels. Int. J. Biol. Macromol. 164, 2051–2061. doi: 10.1016/j.ijbiomac.2020.08.087
Barac, M., Cabrilo, S., Pesic, M., Stanojevic, S., Zilic, S., Macej, O., et al. (2010). Profile and functional properties of seed proteins from six pea (Pisum sativum) genotypes. Int. J. Mol. Sci. 11, 4973–4990. doi: 10.3390/ijms11124973
Boukhalfa-lezzar, H., Copinet, E., Duchiron, F., and Aicha, M. (2014). Utilization of tomato pomace as a substrate for neutral protease production by aspergillus oryzae 2220 on solid-state fermentation. Int. J. Adv. Res. 2, 338–346.
Burger, T. G., and Zhang, Y. (2019). Recent progress in the utilization of pea protein as an emulsifier for food applications. Trends Food Sci. Technol. 86, 25–33. doi: 10.1016/j.tifs.2019.02.007
Chavan, R. S., Kumar, A., and Basu, S. (2015). Whey based tomato soup powder: rheological and color. Int. J. Agric. Sci. Res. 5, 301–314.
Collins, E. J., Bowyer, C., Tsouza, A., and Chopra, M. (2022). Tomatoes: an extensive review of the associated health impacts of tomatoes and factors that can affect their cultivation. Biology 11, 239–283. doi: 10.3390/biology11020239
D’Alessio, G., Flamminii, F., Faieta, M., Prete, R., Di Michele, A., Pittia, P., et al. (2023). High pressure homogenization to boost the technological functionality of native pea proteins. Curr. Res. Food Sci. 6:100499. doi: 10.1016/j.crfs.2023.100499
Dahl, W. J., Foster, L. M., and Tyler, R. T. (2012). Review of the health benefits of peas (Pisum sativum L.). Br. J. Nutr. 108 Suppl 1, S3–S10. doi: 10.1017/S0007114512000852
Desmarchelier, C., and Borel, P. (2017). Overview of carotenoid bioavailability determinants: from dietary factors to host genetic variations. Trends Food Sci. Technol. 69, 270–280. doi: 10.1016/j.tifs.2017.03.002
Dorais, M., Ehret, D. L., and Papadopoulos, A. P. (2008). Tomato (Solanum lycopersicum) health components: from the seed to the consumer. Phytochem. Rev. 7, 231–250. doi: 10.1007/s11101-007-9085-x
Du, Q., Zhou, L., Lyu, F., Liu, J., and Ding, Y. (2022). The complex of whey protein and pectin: Interactions, functional properties and applications in food colloidal systems – A review. Colloids and Surfaces B: Biointerfaces 210:112253. doi: 10.1016/j.colsurfb.2021.112253
Elbadrawy, E., and Sello, A. (2016). Evaluation of nutritional value and antioxidant activity of tomato peel extracts. Arab. J. Chem. 9, S1010–S1018. doi: 10.1016/j.arabjc.2011.11.011
Emkani, M., Oliete, B., and Saurel, R. (2021). Pea protein extraction assisted by lactic fermentation: impact on protein profile and thermal properties. Food Secur. 10, 549–564. doi: 10.3390/foods10030549
Ertugrul, U., Namli, S., Tas, O., Kocadagli, T., Gokmen, V., Sumnu, S. G., et al. (2021). Pea protein properties are altered following glycation by microwave heating. LWT 150:111939. doi: 10.1016/j.lwt.2021.111939
Gao, R., Wu, Z., Ma, Q., Lu, Z., Ye, F., and Zhao, G. (2021). Effects of breaking methods on the viscosity, rheological properties and nutritional value of tomato paste. Food Secur. 10, 1–21. doi: 10.3390/foods10102395
Gupta, R., Kopec, R. E., Schwartz, S. J., and Balasubramaniam, V. M. (2011). Combined pressure-temperature effects on carotenoid retention and bioaccessibility in tomato juice. J. Agric. Food Chem. 59, 7808–7817. doi: 10.1021/jf200575t
Hyodo, H., Terao, A., Furukawa, J., Sakamoto, N., Yurimoto, H., Satoh, S., et al. (2013). Tissue specific localization of pectin-Ca2+ cross-linkages and pectin methyl-esterification during fruit ripening in tomato (Solanum lycopersicum). PLoS One 8:e78949. doi: 10.1371/journal.pone.0078949
Iddir, M., Felipe, J., Yaruro, P., Cocco, E., Hardy, E. M., Appenzeller, B. M. R., et al. (2021). Impact of protein-enriched plant food items on the bioaccessibility and cellular uptake of carotenoids. Antioxidants 10, 1–23.
Ilhan, E., Pocan, P., Ogawa, M., and Oztop, M. H. (2020). Role of ‘D-allulose’ in a starch based composite gel matrix. Carbohydr. Polym. 228:115373. doi: 10.1016/j.carbpol.2019.115373
Knoblich, M., Anderson, B., and Latshaw, D. (2005). Analyses of tomato peel and seed byproducts and their use as a source of carotenoids. J. Sci. Food Agric. 85, 1166–1170. doi: 10.1002/jsfa.2091
Koocheki, A., Ghandi, A., Razavi, S. M. A., Mortazavi, S. A., and Vasiljevic, T. (2009). The rheological properties of ketchup as a function of different hydrocolloids and temperature. Int. J. Food Sci. Technol. 44, 596–602. doi: 10.1111/j.1365-2621.2008.01868.x
Korb, J. P., Vorapalawut, N., Nicot, B., and Bryant, R. G. (2015). Relation and correlation between NMR relaxation times, diffusion coefficients, and viscosity of heavy crude oils. J. Phys. Chem. C 119, 24439–24446. doi: 10.1021/acs.jpcc.5b07510
Lan, Y., Chen, B., and Rao, J. (2018). Pea protein isolate–high methoxyl pectin soluble complexes for improving pea protein functionality: effect of pH, biopolymer ratio and concentrations. Food Hydrocoll. 80, 245–253. doi: 10.1016/j.foodhyd.2018.02.021
Liang, X., Yan, J., Guo, S., McClements, D. J., Ma, C., Liu, X., et al. (2021). Enhancing lycopene stability and bioaccessibility in homogenized tomato pulp using emulsion design principles. Innov. Food Sci. Emerg. Technol. 67:102525. doi: 10.1016/j.ifset.2020.102525
López Bermúdez, Y. N., Aldana Heredia, J. F., Sánchez-Camargo, A. P., and Hernández-Carrión, M. (2022). Valorization strategies for a by-product of organic tomato processing as potential ingredient in functional food formulations. Front. Food Sci. Technol. 2, 1–14. doi: 10.3389/frfst.2022.893795
Luisa García, M., Calvo, M. M., and Dolores Selgas, M. (2009). Beef hamburgers enriched in lycopene using dry tomato peel as an ingredient. Meat Sci. 83, 45–49. doi: 10.1016/j.meatsci.2009.03.009
Lurie, S., Zhou, H. W., Lers, A., Sonego, L., Alexandrov, S., and Shomer, I. (2003). Study of pectin esterase and changes in pectin methylation during normal and abnormal peach ripening. Physiol. Plant. 119, 287–294. doi: 10.1034/j.1399-3054.2003.00178.x
Nishinari, K., Fang, Y., Guo, S., and Phillips, G. O. (2014). Soy proteins: a review on composition, aggregation and emulsification. Food Hydrocoll. 39, 301–318. doi: 10.1016/j.foodhyd.2014.01.013
Odriozola-Serrano, I., Soliva-Fortuny, R., and Martín-Belloso, O. (2008). Changes of health-related compounds throughout cold storage of tomato juice stabilized by thermal or high intensity pulsed electric field treatments. Innov. Food Sci. Emerg. Technol. 9, 272–279. doi: 10.1016/j.ifset.2007.07.009
Ozel, B., Cikrikci, S., Aydin, O., and Oztop, M. H. (2017). Polysaccharide blended whey protein isolate-(WPI) hydrogels: a physicochemical and controlled release study. Food Hydrocoll. 71, 35–46. doi: 10.1016/j.foodhyd.2017.04.031
Ozel, B., Kruk, D., Wojciechowski, M., Osuch, M., and Oztop, M. H. (2021). Water dynamics in whey-protein-based composite hydrogels by means of nmr relaxometry. Int. J. Mol. Sci. 22, 9672–9684. doi: 10.3390/ijms22189672
Pieper, J. R., and Barrett, D. M. (2009). Effects of organic and conventional production systems on quality and nutritional parameters of processing tomatoes. J. Sci. Food Agric. 89, 177–194. doi: 10.1002/jsfa.343
Reinkensmeier, A., Bußler, S., Schlüter, O., Rohn, S., and Rawel, H. M. (2015). Characterization of individual proteins in pea protein isolates and air classified samples. Food Res. Int. 76, 160–167. doi: 10.1016/j.foodres.2015.05.009
Ren, S., and Giusti, M. M. (2021). The effect of whey protein concentration and preheating temperature on the color and stability of purple corn, grape and black carrot anthocyanins in the presence of ascorbic acid. Food Res. Int. 144:110350. doi: 10.1016/j.foodres.2021.110350
Unal, K., Alpas, H., Aktas, H., and Oztop, M. H. (2020). Time domain (TD)-NMR relaxometry as a tool to investigate the cell integrity of tomato seeds exposed to osmotic stress (OS), ultrasonication (US) and high hydrostatic pressure (HHP). J. Food Sci. Technol. 57, 3739–3747. doi: 10.1007/s13197-020-04406-5
Wagoner, T. B., and Foegeding, E. A. (2017). Whey protein–pectin soluble complexes for beverage applications. Food Hydrocoll. 63, 130–138. doi: 10.1016/j.foodhyd.2016.08.027
Keywords: tomato sauce, pea protein fortification, valorization of tomato peel, sauce rheology, sensory analysis
Citation: Bal M, Ates EG, Erdem F, Tonyali Karsli G, Karasu MC, Ozarda O, Mert B and Oztop MH (2024) Rheological and sensorial behavior of tomato product enriched with pea protein and olive powder. Front. Sustain. Food Syst. 8:1358520. doi: 10.3389/fsufs.2024.1358520
Edited by:
Na Zhang, Harbin University of Commerce, ChinaReviewed by:
Maria Simona Chiș, University of Agricultural Sciences and Veterinary Medicine of Cluj-Napoca, RomaniaNishant Rachayya Swami Hulle, Tezpur University, India
Copyright © 2024 Bal, Ates, Erdem, Tonyali Karsli, Karasu, Ozarda, Mert and Oztop. This is an open-access article distributed under the terms of the Creative Commons Attribution License (CC BY). The use, distribution or reproduction in other forums is permitted, provided the original author(s) and the copyright owner(s) are credited and that the original publication in this journal is cited, in accordance with accepted academic practice. No use, distribution or reproduction is permitted which does not comply with these terms.
*Correspondence: Mecit H. Oztop, bWVjaXRAbWV0dS5lZHUudHI=