 Samarth Godara1Pratap S. Birthal2G. Avinash1
 Mukhtar Ahmad Faiz3,4*
 Ram Swaroop Bana3*
 Abimanyu Jhajhria5Rajender Parsad1Sudeep Marwaha1
- 1ICAR-Indian Agricultural Statistics Research Institute, New Delhi, India
- 2ICAR-National Institute of Agricultural Economics and Policy Research, New Delhi, India
- 3ICAR-Indian Agricultural Research Institute, New Delhi, India
- 4Afghanistan National Agricultural Sciences and Technology University, Kandahar, Afghanistan
- 5ICAR-Indian Institute of Soil and Water Conservation, Dehradun, India
Introduction: With increasing demand for food and changing environmental conditions, a better understanding of the factors impacting wheat yield is essential for ensuring food security and sustainable agriculture. By analyzing the effect of multiple factors on wheat yield, the presented research provides novel insights into the potential impacts of climate change on wheat production in India. In the present study, datasets consisting of countrywide environmental and agronomic factors and wheat yield were collected. In addition, the study also analyzes the effect of information demand of farmers on production.
Methodology: The study employs a regional analysis approach by dividing the country into five zonal clusters: Northern Hills, Central India, Indo-Gangetic Plains, North-Eastern India, and Peninsular India. Correlation and Principal Component Analysis (PCA) were performed to uncover the month-wise key factors affecting wheat yield in each zone. Furthermore, four Machine Learning/Deep Learning-based models, including XGBoost, Multi-layer Perceptron (MLP), Gated Recurrent Unit (GRU), and 1-D Convolutional Neural Network (CNN), were developed to estimate wheat yield. This study estimated partial derivatives for all factors using Newton's Quotient Technique, a numerical method-based approach.
Results: The analysis focused on applying this technique to the best-performing wheat yield estimation model, which was the GRU-based model (with RMSE and MAE of 0.60 t/ha and 0.46 t/ha, respectively).
Discussion: In the later sections of the article, multiple policy recommendations are communicated based on the extracted insights. The results of the presented research help inform decision-making regarding the development of strategies and policies to mitigate the impacts of climate change on wheat production in India.
1 Introduction
Wheat, a vital crop globally, ensures food security for millions. India, ranking second in wheat production after China (Shukla et al., 2022), contributes ≈8% of the world's annual production, yielding around 105 million tonnes. Over the years, the wheat cultivation area in India has expanded, covering more than 30 million hectares (Ramadas et al., 2019). For farmers, particularly in northern and central regions, wheat serves as a crucial source of income.
In this scenario, the Indian government has implemented various policies and programs to promote wheat cultivation and increase production, such as the National Food Security Mission and the Pradhan Mantri Fasal Bima Yojana (Chopra, 2022). However, the crop is also affected by various environmental and agronomic factors, which can impact yield. Understanding these factors is essential for improving crop productivity and addressing food insecurity in India. In this context, the presented study aims to identify the factors affecting wheat yield in India and analyze their impact on production using Machine Learning/Deep Learning (ML/DL)-based models.
The existing studies have found that changes in average minimum and maximum temperatures can directly impact wheat yield (Asseng et al., 2011). This highlights the vulnerability of agricultural systems to changes in temperature patterns and the need to adapt to such changes to ensure food security. Secondly, changes in rainfall patterns also impact wheat yield (Birthal et al., 2021). Of all the factors at play, rainfall and temperature are deemed the most pivotal variables affecting wheat yield, owing to their direct impact on crop growth and development (Birthal et al., 2021). Adequate rainfall ensures sufficient water availability for plant growth, while optimal temperature ranges promote optimal physiological processes. Considering these factors allows for an accurate wheat yield estimation, which is crucial in determining crop productivity. However, understanding the factors affecting wheat yield is a complex task. The complexity of the crop's biology and the dynamic interactions between various factors make it challenging to identify the most critical factors affecting yield (He et al., 2022). Additionally, various regions in India with different climates, soil types and farming practices make the analysis of factors affecting yield more complex (Bhardwaj et al., 2022).
The concept of crop yield estimation utilizing remote sensing data was first introduced in the late 1970's, with MacDonald and Hall (1980) pioneering the estimation of harvests in strategically significant counties. Moreover, process-oriented crop simulation models, such as DSSAT, APSIM, WOFOST, MCWLA, and AQUACROP, can provide improved crop yield estimation when combined with remote sensing data (Lobell, 2013; Sakamoto et al., 2013; Huang et al., 2015; Lobell et al., 2015). These models can adapt to changes in location, weather conditions, and timing of images to produce yield estimates for each pixel. However, these models often require more in-depth input data, including site-specific soil and daily weather information. This, coupled with the computational costs, can make it challenging to scale the approach to cover multiple crops, regions, and years without incurring significant time, monetary, and labor investments.
On the other hand, traditional statistical-based methods, using specific response functions between yields and independent variables, offer a simpler and more effective alternative for yield predictions. (Huang et al., 2015; Qader et al., 2018). However, these empirical regression models are often limited in spatial generalization and suffer from local specificity (Folberth et al., 2019). To overcome these limitations, it is essential to develop innovative approaches for accurate, timely, and low-cost yield estimation over large areas.
In recent years, in many countries, ML techniques have been widely adopted in agriculture research, including crop classification, growth monitoring, and yield prediction (Shah et al., 2019; Wolanin et al., 2019). ML is a subset of artificial intelligence where algorithms learn patterns and make predictions from data without explicit programming. DL is a type of ML that uses neural networks with multiple layers to learn hierarchical representations of data, enabling complex feature learning and abstraction. Unlike traditional ML algorithms, DL methods automatically extract features from raw data, eliminating the need for manual feature engineering. Due to their complex nature, DL architectures require large amounts of data and computational power to train effectively. While both ML and DL aim to extract insights from data, DL excels at handling unstructured data like images, audio, and text, often achieving state-of-the-art performance in various tasks. ML approaches, such as regression tree, support vector machine (SVM), random forest (RF), and neural network (NN), have been shown to perform better than traditional regression methods in yield prediction studies (Cai et al., 2019).
Furthermore, DL has emerged as a powerful tool in yield estimation, with its ability to transform raw input data into high-level abstract representations through multiple non-linear layers (Kuwata and Shibasaki, 2015; Khaki and Wang, 2019). For example, You et al. (2017) used Convolutional Neural Network (CNN) and Long Short-Term Memory (LSTM) to estimate soybean yields in the US and achieved better results compared to traditional statistical-based methods and USDA estimations. Cao et al. (2021) designed a Deep Neural Network (DNN) with 21 hidden layers and 50 neurons in each layer to predict maize yield in 2017 and achieved superior accuracy compared to LASSO, shallow neural networks (SNNs), and regression trees (RTs).
Barbier et al. (2015) explores the intersection of Computer Science and Agronomy, highlighting the potential of Model-Driven Engineering as the future of software engineering for crop modeling and simulation. The proposed metamodel and graphical syntax address the need for formal tools in conceptual modeling, leading to improved production processes and industrial application in the ITK Company. Gupta et al. (2022) provides a comprehensive review of modeling technologies in climate-smart agriculture (CSA), emphasizing advancements in crop simulation models, hydrological models, and the potential of AI-based approaches. It highlights the importance of these models for improving crop and environment estimation, field management, and decision-making in CSA. Furthermore, the study by Jamali et al. (2023) developed a methodology using vegetation indices (VIs) from sentinel-2 data and machine learning algorithms to estimate leaf parameters in wheat. The results showed that the DNN model achieved high precision in predicting leaf parameters, demonstrating the potential for accurate crop monitoring and management.
A study by Santos et al. (2023) aimed to propose a methodology utilizing Lautilizinga for predicting and projecting eucalyptus forest growth and yield and analyzing dynamics. Different scenarios with varying sample sizes were assessed to evaluate potential cost savings. Artificial neural network (ANN) and random forest (RF) algorithms were employed for estimation, resulting in relative root mean square error (RRMSE) values ranging from 7.9 to 14.5% for wall-to-wall prediction and 6.8–11.8% for projection. Seyedmohammadi et al. (2023) aimed to predict yield and effectively manage natural resources in the study by modeling the impact of soil properties using various algorithms such as classification and regression tree, k-nearest neighbors, support vector machines, and a hybrid model combining support vector machines with the firefly meta-heuristic algorithm. Soil samples from 124 pistachio orchards in Iran were analyzed, and critical predictors were selected based on correlation coefficients, sensitivity analysis, and ANOVA hypothesis testing. The hybrid model outperformed other algorithms, explaining 94% of the variation in pistachio yield by efficiently capturing non-linear relationships. The research by Son et al. (2022) demonstrates the potential of using ML techniques and monthly image composites from Sentinel-2 satellite imagery to predict rice crop yield in Taiwan. Three ML models (random forest, support vector machine, and artificial neural networks) were employed, with the support vector machine performing slightly better. The validation results showed close agreement between the predicted yields and government statistics, with low root mean square percentage error and mean absolute percentage error values.
Research by Pagano et al. (2023) explores the use of Artificial Intelligence models, specifically Multi-Layer Perceptron (MLP) and Random Forest (RF), to predict daily actual evapotranspiration in a Mediterranean citrus orchard. It demonstrates that these models, especially Random Forest with seven input features, can achieve accurate predictions, leading to significant water savings of up to 38.5% compared to full irrigation. Incorporating soil water content, weather, and satellite data enhances the accuracy of evapotranspiration forecasts compared to models using only meteorological variables. Another work by Singh et al. (2023) used thermal and visible imaging along with machine learning techniques to estimate plant disease severity under field conditions, overcoming the limitations of existing methods. The study found that combining machine learning models using model combination techniques significantly improved the accuracy of disease severity prediction in chickpea crops with wilt resistance. A study by Prasad et al. (2023) used earth observation data and an ensemble model, combining random forest (RF), support vector machine (SVM), and multivariate adaptive regression spline (MARS) models, to create a highly accurate wetland map. The ensemble model achieved an impressive 96% accuracy when cross-validated with field data and demonstrated the effectiveness of integrating multiple key variables for probabilistic wetland mapping, providing valuable insights for coastal area planning and sustainable development.
Lv et al. (2013) analyzed the spatial pattern of wheat yield using cluster analysis and emphasized the need to address the spatial gap and improve production over time. To identify the factors affecting wheat production, techniques such as the spatial Durbin model (Zhang and Li, 2022), stepwise regression analysis (Zhang et al., 2021), farmer field surveys (Zhang and Li, 2022), and machine learning (Yu et al., 2022) are utilized. The consensus is that the impact of crop yield is multidimensional, and climate factors have the most direct effect on regional differences in yield (Fen et al., 2020; Lin and Shao, 2020; Twizerimana et al., 2020).
The existing studies demonstrate the potential of using machine learning and deep learning techniques to predict wheat yield and identify the most critical factors affecting yield. These models can analyze large and complex datasets and identify patterns and relationships that may not be apparent from traditional statistical methods. However, it is essential to note that these models must be trained on a large and diverse dataset to achieve accurate predictions. Despite the advancements in this field, there are still some limitations to the existing research on the factors affecting wheat yield in India, which have been addressed in the present study.
• One limitation is that many studies have focused on specific regions or states rather than the entire country. Generalizing the findings to other regions or the entire country is difficult. Additionally, many studies have used observational data, which can limit the quality and completeness of the data. Observation data may not represent the entire population or cover all the relevant factors affecting wheat yield.
• Most studies focus on single data points for environmental factors, such as cumulative rainfall and average temperature for the entire season. Still, a comprehensive understanding of these factors requires considering them month- or stage-wise.
• Another limitation is that most studies have used machine learning and deep learning models for prediction. However, interpreting and understanding these models are complex, and it is not always clear how the model arrived at its predictions. This can make it challenging to understand the underlying factors affecting wheat yield. Therefore, further analysis is needed, such as extracting the factor-wise partial derivatives using the trained models.
• Additionally, many studies have evaluated the performance of these models only on the training datasets, which can lead to overfitting of the model. Overfitting occurs when a model is too complex and fits the training data too well but needs to perform better on new data. This can lead to inaccurate predictions and unreliable conclusions. Therefore, in the presented study, the models are assessed based on their performances on unseen (testing) data.
In the present study, the environmental factors are analyzed monthly for the rabi season, i.e., the rainfall and temperature parameters are analyzed separately for October to April. This helps to gain novel insights regarding the month-wise effects of the considered factors. In addition, the study analyzes the correlation between wheat yield and various environmental factors and factors related to farmers' demand for information. For this objective, data corresponding to the farmers' demand for assistance regarding various topics were also collected from the nationwide farmers' helpline network, i.e., Kisan Call Centers (KCC; Godara and Toshniwal, 2022). Moreover, the study uses ML/DL-based models to predict wheat yield based on the considered factors. The study also investigates the scale of impact each factor has on the yield using the numerical method-based partial derivatives. Overall, the presented study is aimed to answer the following research questions:
• What are the most critical (month-wise) factors affecting wheat yield in India?
• How do these (environmental, agronomic, etc.) factors impact wheat yield concerning different climatic zones?
Moreover, the analysis of the KCC data provides insights into the information needs of farmers and how they seek information to improve their crop yields. The results of this analysis can help policymakers design effective extension delivery systems to meet the needs of farmers, particularly concerning their information needs. This can be essential to improving agricultural productivity and supporting sustainable farming practices in the face of changing climate conditions. The research work presented in this study offers several novel contributions. Firstly, it investigates the specific effects of month-wise environmental factors, such as rainfall and temperature, on wheat yield, providing valuable insights into the impact of these variables. Additionally, it explores the influence of farmers' demand for information on yield, shedding light on the relationship between farmers' needs and crop productivity. The development of a DL-based model incorporating both environmental factors and farmers' assistance data is another innovative aspect (a total of 36 variables considered), enabling more accurate wheat yield prediction. Lastly, introducing LDI-based merging of nationwide district-wise datasets enhances the comprehensive analysis by integrating diverse information sources.
The initial step involved collecting data about diverse environmental factors, such as rainfall and temperature, to accomplish the set objectives. This data was acquired in a 1x1 grid format based on latitude and longitude coordinates and converted into a district-wise representation. In addition, information regarding the irrigated area corresponding to each district was considered in the study. A major challenge in merging various datasets is that the district and state names do not exactly match when collected from different sources. And the manual matching of thousands of records is an infeasible task. We have introduced a Levenshtein Distance Index (LDI) for merging (agricultural district-wise) datasets to tackle this problem. Later, data corresponding to district-wise wheat yield and farmers' demand for assistance from all over India were merged. To have a more practical analysis, the whole dataset is clustered into five groups according to their climatological properties, i.e. Northern Hills, Indo-Gangetic Plain, Central India, Peninsular India and North-Eastern India.
In the next step, a correlation analysis was done to identify the association between wheat yield and various factors (each month, corresponding to each cluster, separately). Further, PCA was done to identify the factors explaining the most variance in the dataset. Subsequently, four ML/DL-based models (XGBoost, Multi-layer Perceptron (MLP), Gated Recurrent Unit (GRU), and 1-D Convolutional Neural Network (CNN)) were trained to predict wheat yield based on the collected data, and the best-performing model was chosen for further analysis. The ML/DL models offer several advantages for agricultural applications. Firstly, these models can effectively capture complex relationships between input variables (such as environmental factors) and crop yield, enabling accurate predictions. Secondly, ML/DL models can handle large volumes of data and automatically learn patterns, reducing the need for manual feature engineering. Finally, the working of these models involves training the model on historical data to learn the underlying patterns and then using the trained model to make predictions on new, unseen data, allowing for continuous improvement and adaptation to changing conditions.
Lastly, the partial derivatives (PD) corresponding to each factor are calculated in the study and analyzed to capture an exhaustive understanding of each undertaken factor. A significant challenge in calculating PD with a DL-based model is that it is inconvenient to calculate the PD through mathematical derivation. The challenge in calculating PD with a DL-based model arises due to deep learning architectures' complex and nonlinear nature. These models have multiple layers and thousands of parameters, making it challenging to derive the PD concerning each input variable analytically. The intricate interactions and transformations within the model make obtaining explicit mathematical equations for the derivatives difficult. Therefore, in the presented study, a numerical method-based approach was used. The following are the major research contributions of the presented study:
• Analysis of the effects of month-wise environmental factors (rainfall and temperature) along with the topic-wise farmers' demand for information on wheat yield.
• Deep learning-based model development for wheat yield prediction using environmental factors and information regarding farmers' demand for assistance (total 39 variables considered).
• Introduced LDI-based merging of nationwide district-wise datasets (environmental, yield, and farmers' helpline data).
• Introduced partial derivative-based factor analysis using the DL-based model to understand factors' effect on wheat yield.
The remainder of the paper is organized as follows: Section 2 elaborates on the related research works. The details of the proposed methodology used in the study are presented in Section 3. Section 4 gives the results obtained through the proposed methodology. A discussion of the obtained results and recommended policies is given in Section 5. Section 6 gives a summary of the presented work.
2 Methodology
2.1 Data collection and preprocessing
The data collection and preprocessing process is illustrated in Figure 1. The data for the study was collected from various sources, such as daily grid-wise rainfall data and daily grid-wise minimum and maximum temperature data from the India Meteorological Department (IMD) servers (MOES, 2023), https://mausam.imd.gov.in/ for the years 2009–2020, Kisan Call Center data from the Kisan Knowledge Management System (DAFW, 2020), area of cultivation and wheat yield data (DAFW, 2023) at the district level from the Ministry of Agriculture and Farmers' Welfare of India, and data on the area of irrigated land at the district level from the International Crops Research Institute for the Semi-Arid Tropics (ICRISAT) servers (ICRISAT, 2023).
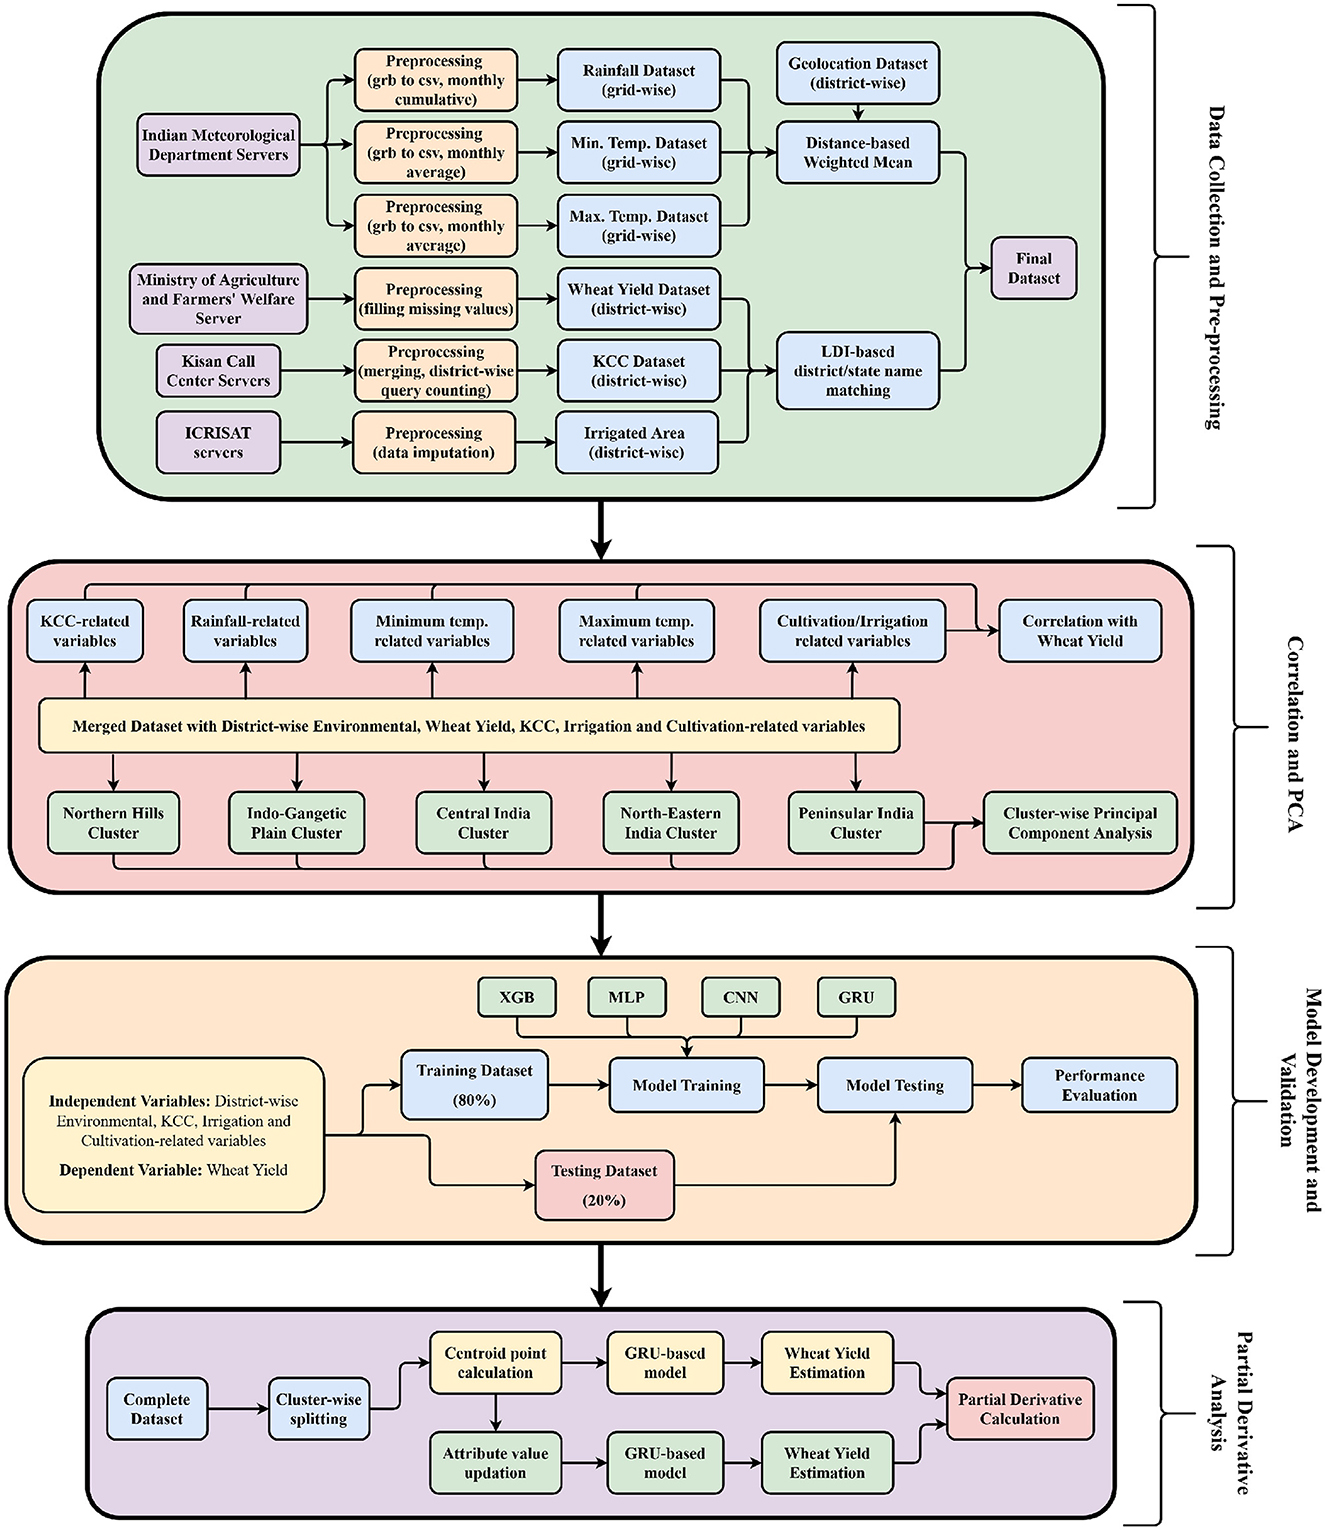
Figure 1. Approach used in the study to analyze factors influencing wheat yield.
It is important to note that the data preprocessing step is crucial for ensuring the accuracy and reliability of the results in the study. The preprocessing step involves cleaning, transforming, and organizing the data in an easily analyzed format. This step helps to remove errors, inconsistencies, and outliers from the data and prepares it for further analysis. Once the data was collected, it underwent a series of preprocessing steps. The first step involved converting the grid data into district-wise data and merging all the data using the proposed Levenshtein Distance index. This merging process was necessary since the available yield data was in district rather than grid format. The distance-based weighted average (Equation 1) was used for the grid-to-district conversion of the rainfall, minimum and maximum temperature data.
Here, ai represents the (rainfall/temperature) data of the ith closest grid point concerning the latitude (latd) and longitude (lond) of the district record being processed, and lati and loni are the latitude and longitude of the ith closest grid point to the target district. p represents the number of grid points for calculating the target district's average (environmental factor) value.
Moreover, the datasets corresponding to the rainfall and (min. and max.) temperature are available daily. The rainfall data were cumulated for October to April (rabi season) from 2009 to 2020. In addition, the temperature data was month-wise averaged for the same period.
Another challenge researchers face while merging the district-wise datasets is the spelling of the district names in the various dataset mismatches. Moreover, this is the only attribute that can be used for merging the datasets. Nevertheless, manual matching of the nationwide multiple datasets is a challenging task. To overcome this challenge, we developed a Levenstien Distance Index, which indicates the edit distance of two words by comparing their length. The well-known Levenstien Distance or edit distance (Mullin, 1985) is a widely used metric to perform this task, but the metric doesn't inform anything related to the lengths of the words being compared. To overcome this problem, we present a modified version of the same (Equation 2).
Here, n1, n2 are the input character strings between whom the LDI is to be calculated, |n1| represents the length of string n1, and tail(x) is the string x without the first character. The LDI ranges from 0 to 100%, indicating the match percentage found between the input strings.
To merge the district-wise records of two datasets, first, the LDI is calculated for each record from the primary dataset with every record of the secondary dataset (district names from each dataset being matched). If the minimum LDI corresponding to a target record is found to be more than 70%, then the records are merged; otherwise, the record is discarded.
The data regarding the variables corresponding to the farmers' demand for information is captured from the Nationwide Farmers' Helpline Network (Kisan Call Centers (KCC; DAFW, 2020), run by the Government of India as a free service to the Indian farmers since 2004. The KCC services provide telephonic help to Indian farmers on all agriculture-related topics. Furthermore, the Ministry of Agriculture and Farmers' Welfare keeps call-log records (in text format) of each query call made by the farmers. It has made the data publically available on the open data platform (NIC, 2023). The KCC dataset contains individual query-call logs, with each row representing a distinct log entry. The dataset encompasses multiple attributes, including the farmer's question, the corresponding response, crop information, query type, category, time, location, and more. Comprehensive details about these attributes can be found in Godara and Toshniwal (2020).
In the presented study, 14 variables related to KCC are taken into account, representing the 14 most popular topics that farmers have been asking for the past 11 years (2009–2020) regarding the wheat crop (Supplementary Table 2) Moreover, each variable represents the district-wise number of query calls related to the particular topic per hectare (cultivation area).
2.2 Correlation and PCA analysis
The data splitting process and performing correlation and PC analysis is illustrated in Figure 1. The (merged) input dataset for this phase contains five types of variables in it, i.e., district-wise KCC (14 variables), Rainfall (seven variables), Temperature (Min. temp. + Max. temp. = 7 + 7 = 14 variables), and two variables regarding the Area of Cultivation and Irrigated Area. In addition, a derived variable is also considered as an interaction of the Irrigated Area × Max. Temperature.
The correlation analysis helps understand the relationship between each independent variable and the dependent variable of wheat yield (Equation 3). It helps identify the variables that strongly or negatively impact the wheat yield.
Here, xi represents the values of the x-variable, represents the mean of the values of the x-variable, yi is the values of the y-variable in a sample and ȳ represents the mean of the values of the y-variable. In the presented study, the correlation analysis of each variable is performed separately. Furthermore, to understand the variables in terms of linear relation with the wheat yield, the data points are further divided into five clusters (based on different climatological zones) for the analysis.
The PCA transforms the independent variables into a new set of uncorrelated variables called the principal components (Abdi and Williams, 2010). PCA is a popular method for dimensionality reduction in data analysis. A linear technique transforms the original data into a lower-dimensional representation through a linear projection. The main goal of PCA is to reduce the number of dimensions while exploring the relationships between variables. It is commonly used as a preprocessing step before applying other statistical methods, such as regression or clustering. By transforming the data into orthogonal principal components, PCA ensures independence between variables and enhances the accuracy of regression and clustering methods.
Generally, the first principal component (PC1) explains the maximum variance in the data, and the subsequent PCs explain the remaining variance. Calculating the PCA for different zones of India separately helps understand the regional variability in the impact of different variables on wheat yield. Moreover, in the presented study, PCA is performed to capture the variables that show the highest variance in the dataset. In addition, the variable that captures similar data point variance is also obtained from the analysis. For the PCA, the whole dataset is divided into five clusters, and PCA is performed on each cluster separately (Figure 1).
2.3 Model development and validation
In the Model Development and Validation phase, four ML/DL-based models (XBG, MLP, CNN, and GRU) are trained and tested to predict the district-wise wheat yield based on the environmental, KCC and other variables. Brief information regarding the working of each of the considered models in the study is as follows:
1. XGBoost (XGB): is a highly effective machine learning algorithm that belongs to the Gradient Boosting Trees (GBT) model class. It was developed to optimize the performance and scalability of GBT models by Chen and Guestrin (2015). XGBoost stands for eXtreme Gradient Boosting, and its popularity can be attributed to its remarkable performance in real-world applications.
The XGBoost model uses a decision tree-based approach for regression and classification tasks. It is an optimized implementation of gradient boosting that uses parallel computing and advanced memory management techniques. In XGBoost, the trees are built sequentially, where each tree is built to correct the errors made by the previous tree. This allows XGBoost to handle non-linear relationships between independent variables and the dependent variable. The algorithm also uses a penalty term to control overfitting, and the penalty term can be tuned using cross-validation techniques. The XGBoost algorithm is a gradient boosting method incorporating a regularization term into the objective function (Equation 4) to mitigate overfitting.
Where yi is the actual value, is the prediction of the rth round, gr denotes the structure of the decision tree, represents the loss function, n is the number of training examples, and Ω(gr) is the regularization term, derived from the number and weights of the leaf nodes.
2. Multi-Layer Perceptron (MLP): is a type of artificial neural network that is widely used for supervised learning problems (Kruse et al., 2022). It is a feedforward network with multiple hidden layers of artificial neurons that use non-linear activation functions to model complex relationships between inputs and outputs. The working of a neuron can be mathematically described by Equation (5).
Where ψ is the activation function utilizing the weighted summations of the inputs, and u represents the number of nodes in the previous layer. The model is trained using the backpropagation algorithm, which calculates the error between the predicted output and the actual target and adjusts the network weights accordingly. MLP is highly flexible, capable of modeling a wide range of problems, and has been shown to produce good results in many real-world applications. The model is beneficial when the relationship between inputs and outputs is highly non-linear and cannot be modeled effectively by traditional linear regression techniques.
3. 1-D Convolutional Neural Network (CNN): is a deep learning architecture designed for processing sequences of data, such as time series, signals, or sequences of words. In contrast to traditional 2-D CNNs, designed for image processing, 1-D CNNs operate on sequences by sliding a filter window along the temporal dimension of the input data. The filters in a 1-D CNN learn to extract relevant features from the input sequence, such as patterns, trends, or anomalies. The extracted features are then fed through a series of fully connected layers to produce a prediction. Using convolutional layers in 1-D CNNs allows for the efficient learning of spatial dependencies in the data, as the same filter can be applied at different positions along the sequence.
The complete dilated causal convolution operation F over consecutive layers for a 1-D sequence of a given input f∈Rn and a filter f:{0, …, k−1} → R, on element s of the sequence, is defined by Equation (6):
where, d is the dilation factor, k is the filter size, and s−d.i accounts for the direction of the past.
4. Gated Recurrent Units (GRU): are a type of Recurrent Neural Network (RNN) architecture used for sequential data processing. GRU was introduced as an improvement over traditional RNNs as they are more computationally efficient and can capture long-term dependencies more effectively. In a GRU regression model, the network receives a sequence of inputs and utilizes hidden states to process the information and predict an output value. The model leverages the gating mechanism in GRUs to control the flow of information and decide which information to preserve and discard, resulting in more robust and accurate predictions. The model can be trained using various optimization algorithms such as stochastic gradient descent (SGD) or Adam to minimize the prediction error and improve its performance. A GRU unit has two gates, i.e., the update gate and the reset gate. The working of the reset gate can be mathematically described by Equation (7).
Where rt, Wr and br are the output vector, the weight and the bias of the gate, respectively. Like the reset gate, the update gate determines the updation level to be done in the received data (Equation 8). The output (ht) of the unit is a linear interpolation between the element-wise multiplication of ht−1 and update gate output zt, and the element-wise multiplication of ĥ and (1−zt) (Equation 10). Here, is calculated using the reset gate output and the current input as shown in Equation (9).
Where Wz, Wh, bz, and bh are the weights and biases used in the update gate.
First, the dataset is divided into two parts for the development of the regression models: training (80%) and testing (20%). Later, the hyperparameter tuning was performed based on the grid-based search technique (Bergstra et al., 2011) to find the optimal architecture of the models. The study incorporates several hyperparameters for model optimization, encompassing batch size, number of epochs, layer count, layer size, and activation functions for each layer.
Furthermore, the models learn from the historical data using the backpropagation technique, a fundamental algorithm used in neural networks to calculate the gradients of the model's parameters concerning the loss function (Smolensky et al., 1996). It involves the iterative process of propagating the error from the output layer back to the input layer, updating the weights and biases along the way, and enabling the network to learn and adjust its internal representations to improve its predictions. The models were first trained on the training data, and then their performance was evaluated using the Root Mean Squared Error (RMSE, Equation 11) and Mean Absolute Error (MAE, Equation 12) on the testing data.
where, n is the number of output data point, Ŷ is the output of the forecasting model, and Y is the desired value. Finally, a Diebold Mariano test was performed between the outputs of each model to determine if the outputs of the models are statistically significantly different (Costantini and Kunst, 2011).
2.4 Partial derivative analysis
The partial derivative analysis involves calculating the derivative of a function concerning one or more independent variables while holding all other variables constant. It provides an estimate of how much the output of a function changes concerning a slight change in one of the inputs. The partial derivative analysis could be used to understand the effect of independent variables such as monthly cumulative rainfall and average min./max. temperature, and calls to the Kisan Call Center about specific topics on the wheat yield. The result of the partial derivative analysis can provide valuable insights into which independent variables impact the wheat yield most and in which direction. This information can be used to make informed decisions about improving the wheat yield and mitigating adverse effects.
Generally, the partial derivative corresponding to each variable is calculated by first obtaining the mathematical representation of the model and later deriving the partial derivative using the obtained function (Birthal et al., 2021). In contrast, representing complex ML/DL-based models using a mathematical function and deriving partial derivatives is infeasible. Therefore, in the presented study, we used a numerical method-based technique named Newton's Quotient to calculate the same (Figure 1). In the proposed technique, the centroid points corresponding to each data cluster are first calculated using Equation (13):
Here, Ci represents the centroid vector for the ith cluster, ni represents the total number of rows in the ith cluster (climatic zone), and xjm represents the mth row element of the jth column. In the second step, the partial derivative is calculated using Equation (14):
Here, vj is the variable corresponding to which the partial derivative is calculated for the zone with Ci as the centroid point. The presented study calculates the partial derivative for each variable corresponding to each cluster (zone) separately.
3 Experiments and results
3.1 Data and descriptive analysis
Figure 2A shows the states corresponding to five zones, which are considered in the presented study for analyzing the factors behind the yield of wheat crops. Here, each zone covers different climatological regions. Supplementary Table 1 gives the data points corresponding to each climatic zone collected and processed in the study. Previous research has demonstrated that deep learning models can capture patterns from data points spanning a wide range, typically from 2000 to 10,000 (Barbier et al., 2015; Cai et al., 2019; Birthal et al., 2021). Our study utilized ~4,500 data points, covering 11 years from 2009 to 2020. Moreover, Figure 2B plots the district-wise wheat yield (in log scale) on the India map. The graph shows that yield is high in Indo-Gangetic and Central India. Whereas in other zones, the yield of wheat is comparatively less.

Figure 2. (A) India's wheat production categorized by agro-climatic zones, (B) district-wise wheat yield (t/ha) in log scale.
Similar to the yield map, Supplementary Figure 1A gives the area of wheat cultivation corresponding to each considered district of India. The graph shows that the cultivation area in the districts is high in Indo-Gangetic plains and Central India (more than 25e4 ha per district). In other parts of India, the wheat cultivation area is < 10e4 ha per district. In addition, from the map, it can be seen that there are no data points in India's extreme North, extreme South and South-Western coastal region. This is because wheat is not grown in these regions; therefore, districts from these regions are not considered in the present study. Supplementary Figure 1B illustrates the irrigated area in each district (hectares/1e4). From the map, it is noticed that the states Haryana and Punjab are highly irrigated. Moreover, Uttar Pradesh and Madhya Pradesh districts need to be more irrigated. In addition, other zones (Northern Hills, North-Eastern India, and Peninsular India) are the least irrigated regions of India for the wheat crop.
Supplementary Figure 2A plots the daily minimum temperature (captured at 2:00 a.m.) corresponding to the December month from all the considered districts. The graph shows that the northern hills have temperatures < 5.0°C this month. In addition, the Indo-Gangetic plains, North-eastern and central India, have an average minimum temperature of 7.5-12.5°C. Whereas, in the Peninsular zone of India, the minimum temperature is noted to be more than 15.0°C. A similar pattern is noted in the graph corresponding to the district-wise average daily maximum temperature (captured at 2:00 p.m., Supplementary Figure 2B). Here, the temperature is shifted to 10°C more than the minimum temperature. Table 1 gives the mean and standard deviation of the values regarding the (monthly average min. and max.) temperature variables.
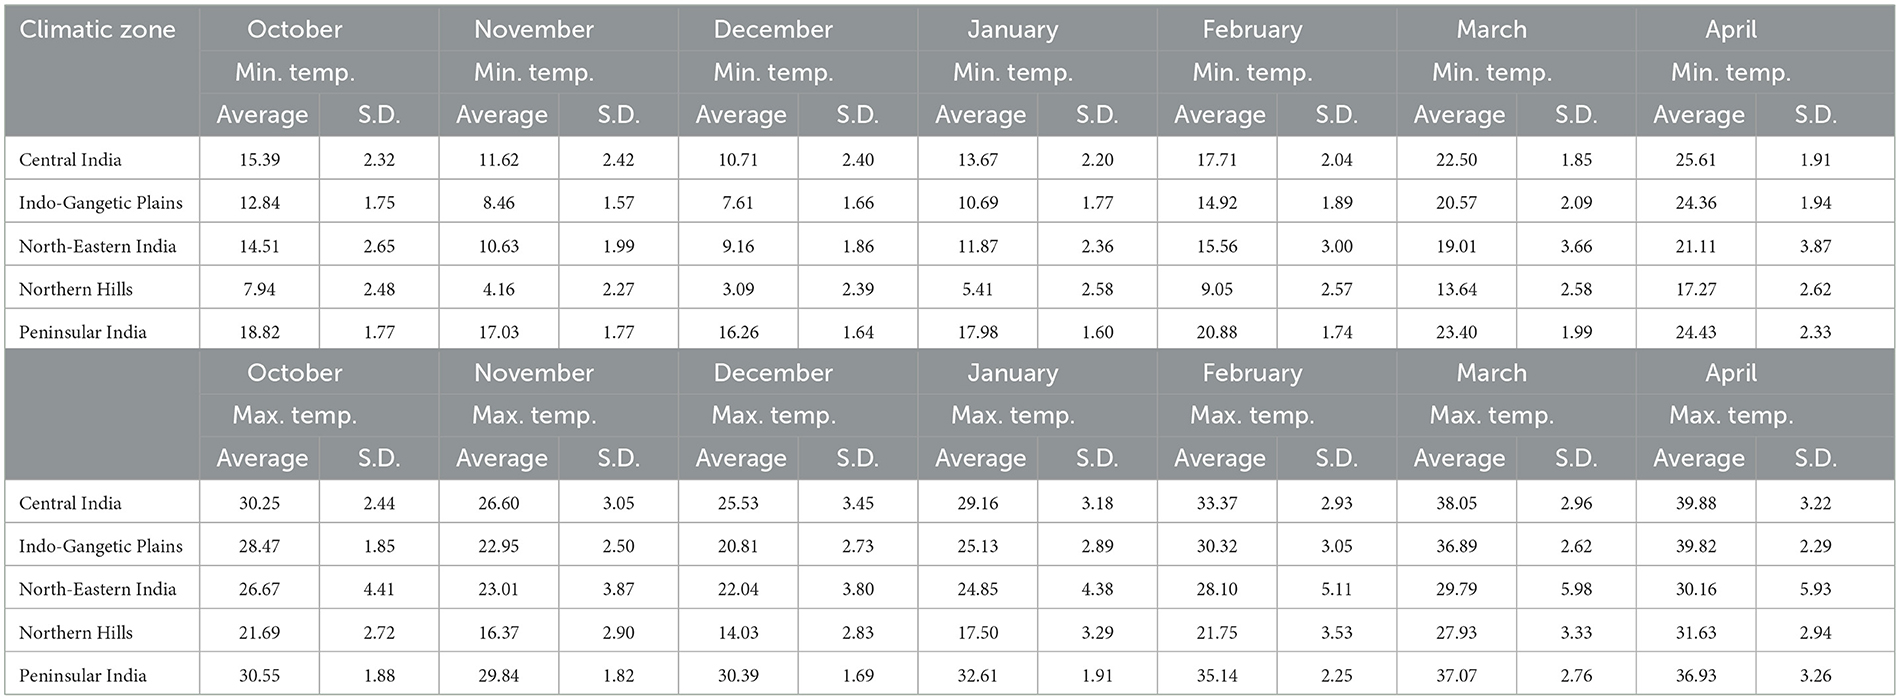
Table 1. Description of temperature-related variables in Celsius within the dataset.
Supplementary Figure 3A shows the district-wise rainfall corresponding to the April month of 2019 (in mm, log scale). The study (PCA results) has shown that rainfall corresponding to April captures the most variation of the dataset. The map shows high rainfall in the Northern hills, North-Eastern and Peninsular India. In contrast, the rainfall in the western part of central India (Gujarat state) is noted to be the least in this month. The mean and standard deviation values present in the rainfall-related variables are given in Table 2 zone-wise.

Table 2. Data description of the rainfall-related variables (in mm, log scaled).
Supplementary Figure 3B plots the KCC query index (Equation 15) corresponding to the weather-related questions (in log scale) asked by the farmers of the respective districts.
The graph shows that the farmers from the Indo-Gangetic plain asked many questions related to the other zones. The map shows that there is some common pattern in the regions where farmers ask more questions (regarding weather) with the regions of high wheat yield and area of cultivation per district (Figure 2B). Table 3 gives the mean and standard deviation of all the KCC-related variables undertaken in the present study.
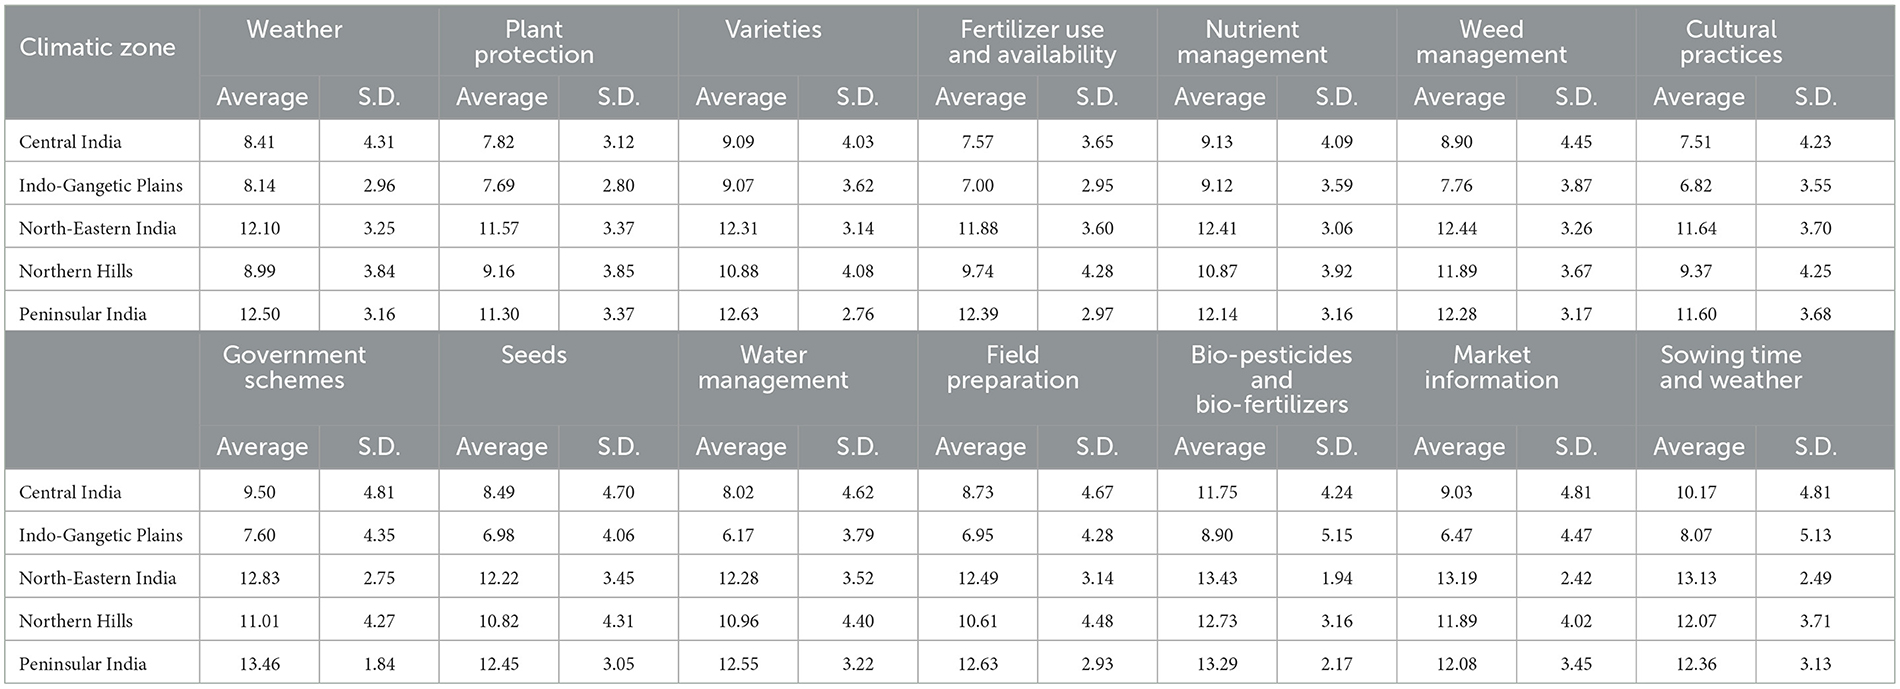
Table 3. Data description of the KCC-related variables (number of calls per hectare of cultivated area, scaling of ln(x) × 10E5).
3.2 Correlation analysis
Figure 3 represents the zone-wise correlation coefficients of all the temperature-related variables. The correlation between the minimum temperature (monthly averaged) and wheat yield is negative for three regions, i.e., Indo-Gangetic, Central India and Peninsular India. The negative correlation is lowest in the Indo-Gangetic Plains region, with the lowest correlation coefficient of –0.64. Moreover, Northern Hills and North-eastern India show a positive correlation of the monthly average minimum temperature with the yield (+0.2–+0.4). In addition, among the considered months, it was found that the minimum temperature of January is the most negatively correlated compared to the other months.

Figure 3. Pearson correlation coefficient values calculated zone-wise for the temperature-related variable in relation to wheat yield.
The results show that the correlation between the maximum temperature and wheat yield shows a similar pattern to the minimum temperature. In Indo-Gangetic Plains, Central India and Peninsular India, the correlation is negative, indicating that the wheat yield decreases in these regions as temperature increases. In North-Eastern India and Northern Hills, the correlation is positive. In addition, the Northern Hills show a more positive correlation than North-Eastern India because of the overall lower temperature in this region. Moreover, among the considered months, it was found that the maximum temperature of January is the most negatively correlated among the other months.
Figure 4 gives the correlation coefficients between the wheat yield and the rainfall-related variables corresponding to different regions of India. The figure shows that in all the zones, the rainfall from January till April shows a negative correlation with the yield, and the negative correlation is lowest in the northeastern and Northern hills. In other cases, rainfall of other months shows no significant correlation with the wheat yield.

Figure 4. Zone-specific Pearson correlation coefficient values between the rainfall-related variable and wheat yield.
From Figure 4, it is noted that, all over India, the correlation between the district-wise area of cultivation and wheat yield is positive (+0.33–+0.68). Similar patterns have been observed with the irrigated area and the derived variable (irrigated area × average max. temperature). Interestingly, the regions with a higher correlation (of the area of irrigation with wheat yield) are the regions with comparatively lesser irrigated districts (North-Eastern India, Northern Hills and Peninsular India, Supplementary Figure 1B).
Figure 5 gives the correlation coefficient values among the KCC-related variables and the wheat yield. The results show that, in Indo-Gangetic Plains, the KCC query index related to variety, fertilizer use, weed management, nutrient management and cultural practices shows a weak positive correlation (+0.2–+0.3). In contrast, the query index for government schemes is noted to have a weak negative correlation with the yield (–0.24). In addition, in the Northern hills, query index regarding the varieties, weed management, nutrient management and sowing time and weather show a positive correlation (+0.4–+0.5) against the wheat yield. Furthermore, the KCC query index did not significantly correlate with the wheat yield in North-Eastern, Central and Peninsular India.

Figure 5. Zone-specific Pearson correlation coefficient values between the KCC-related variable and wheat yield.
3.3 Principal component analysis
In the presented study, PCA was performed on two aspects of the data, i.e., zone-wise PCA to identify the variables that explain the most variance in each zone and attribute-wise PCA to obtain the variables that capture the most variation among the different groups of attributes. Table 4 gives the zone-wise data variation captured (in %) by the first three PCs. Here, the analysis is done for each group of variables separately. The table shows that, on average, the variables corresponding to max. temp. can capture the most variance (96.2%) by their first three PCs, followed by the rainfall-related variables (95.9%), KCC-related variables (86.2%) and min. temp.-related variables (84.6%).

Table 4. Zone-wise data variation captured by first three PCs corresponding different types of variables.
For an in-depth understanding of the effects of the considered variables on wheat yield, the variables are clustered (group-wise, i.e., rainfall, temp., and KCC) based on the PCA results. The PCA on the monthly minimum temperature data reveals that the variance in the data captured by the March and April months is similar (Figure 6). Additionally, the monthly minimum temperatures in November and December and October and January exhibit similar variances in the data. A similar pattern is reflected in the maximum temperature data points as well, max. temp. of March and April capture similar variances. Moreover, the variables corresponding to the max. temp. of the October, February, and November and January months are clustered together. The PCA of rainfall-related variables indicates that the monthly rainfall of March and April have a similar variance in the data (Figure 7). Additionally, the variance of the rainfall data for November and January is also similar.

Figure 6. Grouping attributes through Principal Component Analysis (PCA) of the temperature-related variables.

Figure 7. Attribute clustering using Principal Component Analysis (PCA) on the variables related to rainfall and Kisan Cal Centers (KCC).
The PCA on the attributes related to the Kisan Call Center revealed that the query index for Nutrient Management and Sowing Time and Weather had similar variance (Figure 7). Additionally, queries regarding Plant Protection, Fertilizer Usage, and Market Information could be grouped. Furthermore, the variance captured by the query index for Weather, Seeds, and Field Preparation was similar. The PCs cluster together queries about Water Management, Government Schemes, and Bio-Pesticides/Bio-Fertilizers.
The presented study also calculates the PCs zone-wise for all combined variables. The results found that the most contributing factors in each of the PCs corresponding to the Indo-Gangetic Plains include the monthly rainfall of December, January and February. Similarly, the PCA of the data corresponding to Central India shows that the attributes with the highest participation in the PCs are the monthly rainfall data for February, March and April, respectively. The results of the PCA conducted in North-eastern India reveal that the first three PCs can account for 97.4% of the total variance of the data points. Additionally, the most influential factors in these PCs are similar to those found in the analysis of North-Eastern India, which include the monthly rainfall values of February, March, and April. The PCA of the data from the Northern Hills region indicates that the key contributing factors to these PCs are the same as those found in the Indo-Gangetic Plains, which are the monthly rainfall of December, January, and February. The PCA of data from Peninsular India reveals that the most essential factors in each of these PCs include the monthly rainfall of October, November, and April.
3.4 Model development and validation
Table 5 gives the architecture of the final models obtained after hyper-parameter tuning using a grid search-based approach. Figure 8 compares different ML/DL-based models in terms of their prediction on the testing dataset. The lower the values of RMSE and MAE, the better the model performs. The figure shows that the GRU-based model has the lowest RMSE and MAE values, indicating that it performs the best among the four models. The XGB model has slightly higher values for both metrics, indicating that its performance is slightly worse than the GRU model's. The 1-D CNN and MLP models have the highest values for both metrics, indicating that their performance is worse than the others. In addition, the Diebold-Mariano test on the outputs of the models shows that the estimation of 1-D CNN and GRU-based models have no significant differences. In comparison, all the other models' outputs are significantly different. Figure 9 illustrates each model's outputs (actual vs. predicted) along with their R2 values. Here, the x-axis represents the actual wheat yield, and the y-axis represents the predicted wheat yield by the models (scaled from 0.0 to 1.0). The graph shows that the models can capture the variations and estimate the yield precisely with the highest R2 value of 0.75 (GRU model).

Table 5. Hyperparameters of the developed forecasting models (XN, XC, and XG represent X number of neurons, filter size of 1D convolutional layer and the number of GRU cells present in the corresponding layer of the model, respectively).

Figure 8. Root Mean Square Error (RMSE) and Mean Absolute Error (MAE) values in units of t/ha associated with each model on the testing dataset.

Figure 9. Comparison of actual vs. predicted scaled (0–1) wheat yield values for each model, along with their respective R-squared (R2) scores.
Figure 10 presents the Bayesian Information Criterion (BIC) values for the four undertaken models. Lower BIC values indicate better model fit and parsimony. Therefore, among the models listed, the CNN model has the lowest BIC value (–5,313.06), suggesting that it is the best-fitting model considering both goodness of fit and complexity. The GRU-based model also has relatively low BIC values compared to the CNN model, indicating that they provide better fits to the data. The XGB and MLP-based model has the highest BIC values (–4,654.37 and –4,658.91, respectively), indicating that these models have the poorest balance between model fit and complexity among the four models listed.

Figure 10. Bayesian Information Criterion (BIC) values associated with each model on the testing dataset.
3.5 Partial derivative analysis
A partial derivative measures how much a function (wheat yield) changes when one of its variables changes while the other variables are held constant. The sign of the values indicates whether the factor has a positive or negative impact on the wheat yield in the target region. The magnitude of the values indicates the strength of the relationship between the factor and the yield. Supplementary Table 3 gives the values of the centroid points (values of the zone-representative districts) corresponding to each cluster.
Figure 11 gives the PDs of the monthly averaged minimum temperature corresponding to each considered zone. The figure shows that minimum temperature has a positive PD in North-Eastern India from December to February. Interestingly, the lowest negative partial derivatives are noted for the same months in the Indo-Gangetic region. Furthermore, it seems that the min. temp. the initial months of the season have more or less a positive PD on wheat yield all over India except the North-Eastern region, while the min. temp. the medial months seem to have a negative PD in the same regions (opposite for North-Eastern India).

Figure 11. Computed partial derivatives with respect to temperature-related variables for each specific zone.
The month-wise zone-wise PD regarding the averaged monthly maximum temperature concerning the wheat yield is also given in Figure 11. According to the results, it appears that in general, the regions with the highest positive partial derivatives for average monthly maximum temperature are Central India, Indo-Gangetic Plains, Northern Hills, and Peninsular India. The region with the lowest negative partial derivative is the North-Eastern region (≈-0.2).
The high temperature positively affects wheat yield in the initial months (Oct.-Nov.) of the season all over India. On the other hand, from the mid-season till the end of the season, most regions show a negative effect on wheat yield of the increased temperature (except Northern Hills and North-Eastern India).
Figure 12 gives the partial derivatives concerning the monthly cumulative rainfall each month (October-April). The highest positive partial derivatives are found for February (North-Eastern India, 0.015), January (Central India, 0.008), and December (Peninsular India, 0.004). In addition, the lowest negative partial derivatives are found for November and December in the Northeastern region of India (–0.06 and –0.02, respectively) and in February in the Indo-Gangetic Plains (–0.02). This shows that in most regions of India (excluding North-Eastern India), the initial months' rainfall (November-December) benefits wheat production. Whereas the rainfall at the end of the season generally harms the yield.

Figure 12. Determined partial derivatives pertaining to the rainfall-related variables for each individual zone.
Figure 13 gives the PD of the KCC-related variable. The highest value in the figure is for Questions related to Bio-Pesticides and Bio-Fertilizers in North-Eastern India, with a value of 262.49. The second highest value is for the questions related to Market Information in the same zone, with a value of 77.52. The third highest value is for the questions related to Field Preparation in Indo-Gangetic Plains, with a value of 35.45. The three lowest (negative) partial derivative values in the table are for the questions related to Government Schemes, with a value of –32.88; questions related to Water Management, with a value of –28.56; and questions related to Nutrient Management, with a value of –6.10.
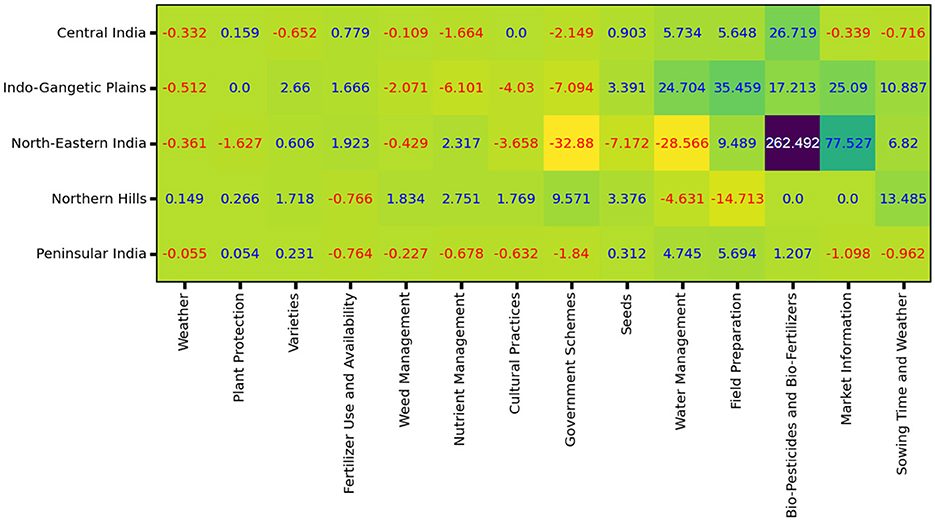
Figure 13. Computed the partial derivatives with respect to KCC-related variables for each distinct zone.
4 Discussion and policy recommendations
This section comprehensively analyzes the study's findings and discusses the probable reasons behind the observed results. Additionally, references to existing studies are provided to validate and support the findings presented in this study. The obtained results in the presented study indicate that rainfall in February, March, and April harms wheat yield in all regions, which may be because excessive rain during these months can lead to water logging, disease and pest infestation, and reduced sunlight, which can negatively impact the growth of the wheat crop (Madhukar et al., 2022; Singh et al., 2023). Therefore, it is more important that farmers should be informed about water management techniques in these particular months. Table 6 gives zone-wise policy recommendations on the type of intervention required for improving wheat yield in the respective region.
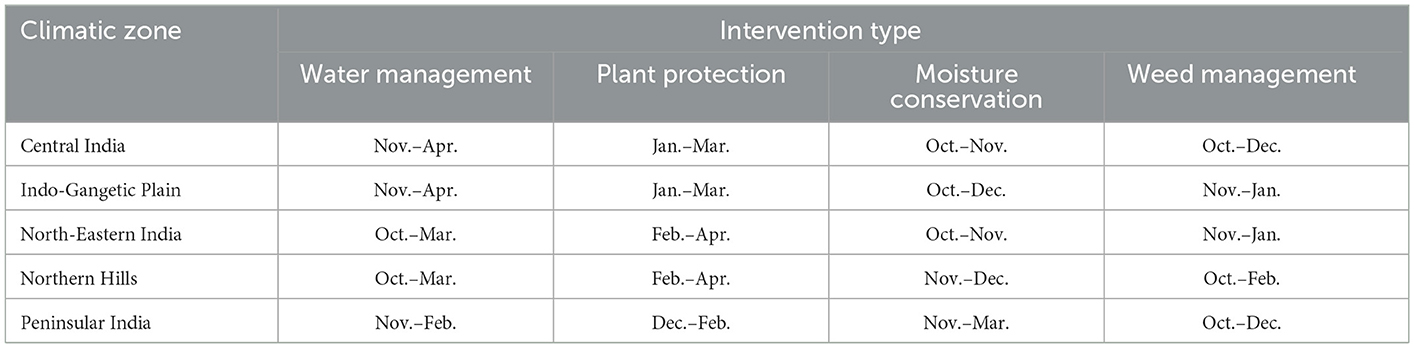
Table 6. Policy recommendations tailored to specific clusters based on the results obtained.
From the analysis, it was noticed that in many regions, the rainfall in the initial months positively affects the wheat yield. The reasons behind these observations are that this period corresponds to the growing season for wheat in these regions, and the amount of rain received during these months is likely to benefit the growth and development of the wheat plants (Zaveri and Lobell, 2019). Overall, the values of the partial derivatives suggest that an optimal amount of rainfall during the wheat cultivation period is crucial for good yield. In addition, the farmers from different zones must be helped at different times of the year regarding water management and other technologies, as given in Table 6.
In Central India, Indo-Gangetic Plains and Peninsular India, the correlation between the average minimum temperature and wheat yield is negative, indicating that lower daily minimum temperatures during the season are favorable for wheat growth (Madhukar et al., 2021). In contrast, the positive correlation in North-Eastern India and Northern Hills suggests that higher daily maximum temperatures during the whole season are favorable for wheat growth in these regions (Asseng et al., 2011). Additionally, regions with high humidity, such as Indo-Gangetic Plains, may have a lower tolerance to high temperatures, hence the negative correlation (Birthal et al., 2021; Bhardwaj et al., 2022). These observations indicate that the wheat yield may be positively affected due to global warming in the Northern Hills and North-Eastern India, whereas, in other regions, it may harm wheat yield. This could be due to several reasons. For example, lower temperatures favor wheat growth and development, while higher temperatures stress the plants and decrease yields (Madhukar et al., 2021). However, the Northern-Hilly region is already a cold climatic region for wheat; therefore, higher temperatures may benefit wheat yield in these regions in the future (Madhukar et al., 2021).
Similar observations are obtained from the monthly averaged maximum temperature variable analysis. The results show that the correlation between wheat yield and average monthly maximum temperature is primarily negative in Central India, Indo-Gangetic Plains, and Peninsular India. This suggests that the wheat yield should decrease in these regions as the temperature increases. One possible reason for this observation is that high temperatures can cause plant stress, leading to decreased photosynthesis and lower yields (Hu et al., 2020). High temperatures can also increase water loss through transpiration, decreasing yields (Asseng et al., 2011). Another possible reason for the negative correlation between temperature and yield is that high temperatures promote the growth of pests and diseases, which can damage crops (Bajwa et al., 2020).
From the analysis of the KCC-related variables, it was found that farmers' demand for help in particular topics is strongly related to wheat yield. The possible reasons behind the observed values could be a combination of various factors such as the specific crop grown in each region, the weather conditions, the availability of resources, the type of farming practices used, and the level of government support (Kumar et al., 2015). For example, in Central India, there is a negative correlation between the demand for information related to weather and wheat yield.
In contrast, in the Northern Hills, a positive correlation exists between wheat yield and the demand for information related to weed management, nutrient management and wheat varieties. This could be because the farming practices used in the Northern Hills may be more susceptible to weed growth, and farmers in this region may require more information regarding technologies like fertilizer usage and the latest varieties (Yogi et al., 2023).
Similarly, in the Indo-Gangetic Plains, there is a positive correlation between the demand for information related to fertilizer usage, weed management, nutrition management, cultural practices and wheat yield. The reason is the farming practices used in the Indo-Gangetic Plains may benefit more from these technologies than other regions, and farmers may require more information to access and use such technologies effectively (Kumar et al., 2015; Yogi et al., 2023). Overall, the study results provide a snapshot of farmers' specific needs and concerns in different regions of India and can be used to inform targeted outreach and education efforts to support farmers in these regions.
The study also shows that the irrigation area positively impacts wheat production, which has already been reported in multiple studies (Zaveri and Lobell, 2019; Birthal et al., 2021). Moreover, it will be more beneficial in India's Peninsular, North-Eastern and Northern-Hilly regions to focus on developing the command area (irrigation systems). In addition, it was also found that the derived variable (max. temp. × irrigated area) has a higher positive correlation with the wheat yield (Figure 4). This suggests that it is more beneficial if the farmers irrigate the land in the seasons with higher temperatures, as high temperatures harm productivity (Birthal et al., 2021).
The experiments related to model training give us interesting information on the undertaken models. The study showed that the GRU-based model is best suited for the task at hand compared to the other models. The probable reason is it has been specifically designed to handle sequential data. Moreover, the XGB-based model also has a specific architecture for handling a variety of datasets. Still, its performance is slightly worse than the GRU-based model due to fewer training variables, differences in implementation or hyperparameter tuning. Whereas, the CNN and MLP-based models may not be as well-suited for the task at hand as they are not explicitly designed for such sequential data and may not be able to effectively learn the underlying patterns in the data (Kamilaris and Prenafeta-Boldú, 2018). The data used to train and evaluate the models may have specific characteristics that make it more difficult for some models to learn.
The PD analysis on the KCC-related variables shows that the wheat yield is greatly affected by the number of questions asked by the farmers. Moreover, it is to be noted that there are two primary reasons behind farmers asking more questions related to a particular topic. First, the farmers are more interested in gaining information on a particular topic for increasing their yields. In this case, the more questions correspond to higher crop yield. And second, the farmers are looking for solutions related to a particular topic to save the damage. In this case, the more questions correspond to lower crop yield. For example, in the case of questions related to water management by the farmers of Indo-Gangetic plains, it seems that if farmers ask more questions related to water management techniques, it will have a positive effect on the yield, the reason being they have been asking such questions to improve the yield in the past. In contrast, the PD corresponding to the same topic is negative in the North-Eastern region because the farmers only ask more questions about this topic when they face damage due to poor water management practices. Based on the findings of the research work, the following policy recommendations can be made:
• Management of rainfall and temperature: Emphasize appropriate irrigation management practices during months when the monthly rainfall and temperature variance is high.
• Climate-resilient agriculture practices: Encourage adopting climate-resilient agriculture practices to reduce the impact of extreme weather events on crop production.
• Farmer's information needs: Address the information needs of farmers regarding sowing time and weather, plant protection, fertilizer usage, and market information.
• Agriculture extension services: Strengthen the agriculture extension services by providing relevant and timely information on water management, government schemes, and bio-pesticides/bio-fertilizers.
This research work's implications are significant for agricultural practitioners and policymakers. Firstly, the analysis of month-wise environmental factors on wheat yield can aid farmers in making informed decisions regarding crop management strategies, such as irrigation and timing of planting. Secondly, understanding the relationship between farmers' demand for information and yield can guide the development of targeted agricultural extension services to meet the specific needs of farmers, potentially improving overall productivity. Finally, integrating diverse datasets and utilizing deep learning models provide a powerful tool for accurate yield prediction, facilitating better resource allocation and planning at both local and national levels.
While the research work presented in this study has notable contributions, it is essential to acknowledge its limitations. Firstly, analyzing month-wise environmental factors on wheat yield may only capture some possible variables affecting crop productivity, such as pest infestations or soil nutrient levels. Moreover, while insightful, the partial derivative-based factor analysis may oversimplify the complex interactions among various factors influencing wheat yield. These limitations should be considered when interpreting and applying the findings in practical contexts.
5 Conclusion
In the presented work, various data sources were collected and analyzed, including daily grid-wise rainfall, daily grid-wise minimum and maximum temperature, Kisan Call Center data, district-wise area of cultivation, and wheat yield. Correlation and PC analysis were conducted to identify the most significant (month-wise) factors affecting the wheat yield. The findings from the analysis showed that monthly rainfall and temperature of particular months have significant impacts (positive and negative) on wheat yield. Furthermore, in the study, four ML/DL-based models were developed to predict the wheat yield and their performance was evaluated using RMSE and MAE. The results showed that the model developed using GRU had an excellent performance in predicting wheat yield with the considered variables. The partial derivatives were calculated to determine the effect of different factors on wheat yield. The results from the analysis can be used to formulate policies related to rainfall and temperature management practices, information demand from farmers and other related factors. The research findings can also be linked to climate change as the changing weather patterns significantly impact agriculture and food security. The future scope of the presented work includes further analysis of the effect of other factors, such as soil fertility and crop disease, on wheat yield and exploring the use of advanced DL techniques for more accurate predictions. Additionally, incorporating different climate and agricultural data, such as drought indices and cropping patterns, could provide further insight into the relationship between climate change and wheat yield.
Data availability statement
Publicly available datasets were analyzed in this study. This data can be found at: https://kcc-chakshu.icar.gov.in.
Author contributions
SG: Conceptualization, Data curation, Formal analysis, Funding acquisition, Writing—original draft. PB: Conceptualization, Data curation, Methodology, Project administration, Writing—original draft. GA: Conceptualization, Formal analysis, Software, Supervision, Validation, Writing—original draft. MA: Investigation, Methodology, Project administration, Resources, Writing—original draft. RB: Data curation, Funding acquisition, Investigation, Supervision, Validation, Writing—original draft. AJ: Data curation, Investigation, Methodology, Project administration, Writing—review & editing. RP: Software, Supervision, Validation, Visualization, Writing— review & editing. SM: Data curation, Funding acquisition, Project administration, Resources, Software, Writing—review & editing.
Funding
The author(s) declare that no financial support was received for the research, authorship, and/or publication of this article.
Conflict of interest
The authors declare that the research was conducted in the absence of any commercial or financial relationships that could be construed as a potential conflict of interest.
The reviewer HS declared a shared parent affiliation with the authors SG, GA, RP, and SM to the handling editor at the time of review.
Publisher's note
All claims expressed in this article are solely those of the authors and do not necessarily represent those of their affiliated organizations, or those of the publisher, the editors and the reviewers. Any product that may be evaluated in this article, or claim that may be made by its manufacturer, is not guaranteed or endorsed by the publisher.
Supplementary material
The Supplementary Material for this article can be found online at: https://www.frontiersin.org/articles/10.3389/fsufs.2024.1357201/full#supplementary-material
References
Abdi, H., and Williams, L. J. (2010). Principal component analysis. Wiley Interdiscipl. Rev. 2, 433–459. doi: 10.1002/wics.101
Asseng, S., Foster, I., and Turner, N. C. (2011). The impact of temperature variability on wheat yields. Glob. Change Biol. 17, 997–1012. doi: 10.1111/j.1365-2486.2010.02262.x
Bajwa, A. A., Farooq, M., Al-Sadi, A. M., Nawaz, A., Jabran, K., and Siddique, K. H. (2020). Impact of climate change on biology and management of wheat pests. Crop Protect. 137:105304. doi: 10.1016/j.cropro.2020.105304
Barbier, G., Cucchi, V., and Hill, D. R. (2015). Model-driven engineering applied to crop modeling. Ecol. Informat. 26, 173–181. doi: 10.1016/j.ecoinf.2014.05.004
Bergstra, J., Bardenet, R., Bengio, Y., and Kégl, B. (2011). Algorithms for hyper-parameter optimization. Advances in Neural Information Processing Systems, Vol. 24, eds. J. Shawe-Taylor, R. Zemel, P. Bartlett, F. Pereira, and K. Q. Weinberger (Curran Associates, Inc.). Available online at: https://proceedings.neurips.cc/paper_files/paper/2011/file/86e8f7ab32cfd12577bc2619bc635690-Paper.pdf
Bhardwaj, M., Kumar, P., Kumar, S., Dagar, V., and Kumar, A. (2022). A district-level analysis for measuring the effects of climate change on production of agricultural crops, i.e., wheat and paddy: evidence from India. Environ. Sci. Pollut. Res. 29, 31861–31885. doi: 10.1007/s11356-021-17994-2
Birthal, P. S., Hazrana, J., Negi, D. S., and Pandey, G. (2021). Benefits of irrigation against heat stress in agriculture: evidence from wheat crop in India. Agri. Water Manag. 255:106950. doi: 10.1016/j.agwat.2021.106950
Cai, Y., Guan, K., Lobell, D., Potgieter, A. B., Wang, S., Peng, J., et al. (2019). Integrating satellite and climate data to predict wheat yield in australia using machine learning approaches. Agri. For. Meteorol. 274, 144–159. doi: 10.1016/j.agrformet.2019.03.010
Cao, J., Zhang, Z., Luo, Y., Zhang, L., Zhang, J., Li, Z., et al. (2021). Wheat yield predictions at a county and field scale with deep learning, machine learning, and google earth engine. Eur. J. Agron. 123:126204. doi: 10.1016/j.eja.2020.126204
Chen, T., and Guestrin, C. (2015). “Xgboost: Reliable large-scale tree boosting system,” in Proceedings of the 22nd SIGKDD Conference on Knowledge Discovery and Data Mining (San Francisco, CA), 13–17.
Chopra, S. (2022). “The eco-system of India's food security regime,” in Food Governance in India, eds. R. Beri, A. S. Upadhyaya, and Å. Kolås (London: Routledge India), 19–36. doi: 10.4324/9781003272656
Costantini, M., and Kunst, R. M. (2011). On the Usefulness of the Diebold-Mariano Test in the Selection of Prediction Models: Some Monte Carlo Evidence. Vienna: Institute for Advanced Studies (IHS), Austria.
DAFW (2020). Kisan Call Centre. Available online at: https://agricoop.nic.in/sites/default/files/KCC%20WEBSITE.pdf (accessed November 15, 2023).
DAFW (2023). Area and Production Statistics. Available online at: https://aps.dac.gov.in/ (accessed November 15, 2023).
Fen, W., Ping, X., Haiqian, G., and Zhengbin, Z. (2020). Advances in research regarding the yield gap and resource use efficiency of winter wheat cultivation and the related regulatory approaches [J]. Chin. J. Eco-Agric. 28, 1551–1567. doi: 10.13930/j.cnki.cjea.200180
Folberth, C., Baklanov, A., Balkovič, J., Skalskỳ, R., Khabarov, N., and Obersteiner, M. (2019). Spatio-temporal downscaling of gridded crop model yield estimates based on machine learning. Agri. For. Meteorol. 264, 1–15. doi: 10.1016/j.agrformet.2018.09.021
Godara, S., and Toshniwal, D. (2020). Sequential pattern mining combined multi-criteria decision-making for farmers' queries characterization. Comput. Electr. Agri. 173:105448. doi: 10.1016/j.compag.2020.105448
Godara, S., and Toshniwal, D. (2022). Deep learning-based query-count forecasting using farmers' helpline data. Comput. Electr. Agri. 196:106875. doi: 10.1016/j.compag.2022.106875
Gupta, D., Gujre, N., Singha, S., and Mitra, S. (2022). Role of existing and emerging technologies in advancing climate-smart agriculture through modeling: a review. Ecol. Informat. 2022:101805. doi: 10.1016/j.ecoinf.2022.101805
He, H., Ding, R., and Tian, X. (2022). Spatiotemporal characteristics and influencing factors of grain yield at the county level in Shandong Province, China. Sci. Rep. 12:12001. doi: 10.1038/s41598-022-14801-x
Hu, S., Ding, Y., and Zhu, C. (2020). Sensitivity and responses of chloroplasts to heat stress in plants. Front. Plant Sci. 11:375. doi: 10.3389/fpls.2020.00375
Huang, J., Tian, L., Liang, S., Ma, H., Becker-Reshef, I., Huang, Y., et al. (2015). Improving winter wheat yield estimation by assimilation of the leaf area index from Landsat TM and MODIS data into the WOFOST model. Agri. For. Meteorol. 204, 106–121. doi: 10.1016/j.agrformet.2015.02.001
ICRISAT (2023). Area of Irrigation. Available online at: http://data.icrisat.org/dld/src/irrigation.html (accessed November 15, 2023).
Jamali, M., Soufizadeh, S., Yeganeh, B., and Emam, Y. (2023). Wheat leaf traits monitoring based on machine learning algorithms and high-resolution satellite imagery. Ecol. Informat. 74:101967. doi: 10.1016/j.ecoinf.2022.101967
Kamilaris, A., and Prenafeta-Boldú, F. X. (2018). Deep learning in agriculture: a survey. Comput. Electr. Agri. 147, 70–90. doi: 10.1016/j.compag.2018.02.016
Khaki, S., and Wang, L. (2019). Crop yield prediction using deep neural networks. Front. Plant Sci. 10:621. doi: 10.3389/fpls.2019.00621
Kruse, R., Mostaghim, S., Borgelt, C., Braune, C., and Steinbrecher, M. (2022). “Multi-layer perceptrons,” in Computational Intelligence: A Methodological Introduction, eds. D. Gries, and O. Hazzan (Berlin: Springer), 53–124. Available online at: https://link.springer.com/content/pdf/bfm:978-3-030-42227-1/1
Kumar, K. R., Nain, M., Singh, R., and Bana, R. (2015). Analysis of farmers' communication network and factors of knowledge regarding agro meteorological parameters. Ind. J. Agri. Sci. 85, 1592–1596. doi: 10.56093/ijas.v85i12.54314
Kuwata, K., and Shibasaki, R. (2015). “Estimating crop yields with deep learning and remotely sensed data,” in 2015 IEEE International Geoscience and Remote Sensing Symposium (IGARSS) (Milan: IEEE), 858–861.
Lin, Y., and Shao, H. (2020). Study on optimal time and influencing factors for winter wheat yield prediction in Henan based on random forest algorithm. J. Triticeae Crops 40, 874–880. Available online at: https://www.cabidigitallibrary.org/doi/full/10.5555/20219817040
Lobell, D. B. (2013). The use of satellite data for crop yield gap analysis. Field Crops Res. 143, 56–64. doi: 10.1016/j.fcr.2012.08.008
Lobell, D. B., Thau, D., Seifert, C., Engle, E., and Little, B. (2015). A scalable satellite-based crop yield mapper. Remote Sens. Environ. 164, 324–333. doi: 10.1016/j.rse.2015.04.021
Lv, Z., Liu, X., Cao, W., and Zhu, Y. (2013). Climate change impacts on regional winter wheat production in main wheat production regions of China. Agri. For. Meteorol. 171, 234–248. doi: 10.1016/j.agrformet.2012.12.008
Madhukar, A., Dashora, K., and Kumar, V. (2021). Spatial analysis of yield trends and impact of temperature for wheat crop across Indian districts. Int. J. Plant Product. 15, 325–335. doi: 10.1007/s42106-021-00140-w
Madhukar, A., Kumar, V., and Dashora, K. (2022). Temperature and precipitation are adversely affecting wheat yield in India. J. Water Clim. Change 13, 1631–1656. doi: 10.2166/wcc.2022.443
MOES (2023). India Meteorological Department. Available online at: https://mausam.imd.gov.in/ (accessed November 15, 2023).
Mullin, R. (1985). “Time warps, string edits, and macromolecules: the theory and practice of sequence comparison,” in Advanced Book Program, eds. D. Sankoff and J. B. Kruskal (Reading, MA; Don Mills, ON: Addison-Wesley Publishing Company, Inc.), 300.
NIC (2023). Open Government Data Platform India. Available online at: https://data.gov.in/ (accessed November 15, 2023).
Pagano, A., Amato, F., Ippolito, M., De Caro, D., Croce, D., Motisi, A., et al. (2023). Machine learning models to predict daily actual evapotranspiration of citrus orchards under regulated deficit irrigation. Ecol. Informat. 76:102133. doi: 10.1016/j.ecoinf.2023.102133
Prasad, P., Loveson, V. J., and Kotha, M. (2023). Probabilistic coastal wetland mapping with integration of optical, sar and hydro-geomorphic data through stacking ensemble machine learning model. Ecol. Informat. 2023:102273. doi: 10.1016/j.ecoinf.2023.102273
Qader, S. H., Dash, J., and Atkinson, P. M. (2018). Forecasting wheat and barley crop production in arid and semi-arid regions using remotely sensed primary productivity and crop phenology: a case study in Iraq. Sci. Tot. Environ. 613, 250–262. doi: 10.1016/j.scitotenv.2017.09.057
Ramadas, S., Kumar, T. K., and Singh, G. P. (2019). “Wheat production in India: trends and prospects,” in Recent Advances in Grain Crops Research, eds. F. Shah, Z. Khan, A. Iqbal, M. Turan, and M. Olgun (IntechOpen), 89–104. doi: 10.5772/intechopen.78117
Sakamoto, T., Gitelson, A. A., and Arkebauer, T. J. (2013). Modis-based corn grain yield estimation model incorporating crop phenology information. Remot. Sens. Environ. 131, 215–231. doi: 10.1016/j.rse.2012.12.017
Santos, J. S., de Mendonça, A. R., Gonçalves, F. G., da Silva, G. F., de Almeida, A. Q., e Carvalho, S. d. P. C., et al. (2023). Predicting eucalyptus plantation growth and yield using landsat imagery in Minas Gerais, Brazil. Ecol. Informat. 75:102120. doi: 10.1016/j.ecoinf.2023.102120
Seyedmohammadi, J., Zeinadini, A., Navidi, M. N., and McDowell, R. W. (2023). A new robust hybrid model based on support vector machine and firefly meta-heuristic algorithm to predict pistachio yields and select effective soil variables. Ecol. Informat. 2023:102002. doi: 10.1016/j.ecoinf.2023.102002
Shah, S. H., Angel, Y., Houborg, R., Ali, S., and McCabe, M. F. (2019). A random forest machine learning approach for the retrieval of leaf chlorophyll content in wheat. Remot. Sens. 11:920. doi: 10.3390/rs11080920
Shukla, S., Upadhyay, D., Mishra, A., Jindal, T., and Shukla, K. (2022). “Challenges faced by farmers in crops production due to fungal pathogens and their effect on Indian Economy,” in Fungal Diversity, Ecology and Control Management, eds. V. R. Rajpal, I. Singh, S. S. Navi (Berlin: Springer), 495–505. Available online at: https://link.springer.com/book/10.1007/978-981-16-8877-5
Singh, R., Krishnan, P., Bharadwaj, C., and Das, B. (2023). Improving prediction of chickpea wilt severity using machine learning coupled with model combination techniques under field conditions. Ecol. Informat. 73:101933. doi: 10.1016/j.ecoinf.2022.101933
Smolensky, P., Mozer, M. C., and Rumelhart, D. E. (Eds.). (1996). Mathematical Perspectives on Neural Networks (1st ed.). Psychology Press. doi: 10.4324/9780203772966
Son, N. T., Chen, C. F., Cheng, Y. S., Toscano, P., Chen, C. R., Chen, S. L., et al. (2022). Field-scale rice yield prediction from sentinel-2 monthly image composites using machine learning algorithms. Ecol. Informat. 69:101618. doi: 10.1016/j.ecoinf.2022.101618
Twizerimana, A., Niyigaba, E., Mugenzi, I., Ngnadong, W. A., Li, C., Hao, T. Q., et al. (2020). The combined effect of different sowing methods and seed rates on the quality features and yield of winter wheat. Agriculture 10:153. doi: 10.3390/agriculture10050153
Wolanin, A., Camps-Valls, G., Gómez-Chova, L., Mateo-García, G., van der Tol, C., Zhang, Y., et al. (2019). Estimating crop primary productivity with sentinel-2 and landsat 8 using machine learning methods trained with radiative transfer simulations. Remot. Sens. Environ. 225, 441–457. doi: 10.1016/j.rse.2019.03.002
Yogi, A. K., Bana, R. S., Bamboriya, S. D., Choudhary, R. L., Laing, A. M., Singh, D., et al. (2023). Foliar zinc fertilization improves yield, biofortification and nutrient-use efficiency of upland rice. Nutr. Cycl. Agroecosyst 125, 453–469. doi: 10.1007/s10705-023-10270-4
You, J., Li, X., Low, M., Lobell, D., and Ermon, S. (2017). “Deep gaussian process for crop yield prediction based on remote sensing data,” in Proceedings of the AAAI Conference on Artificial Intelligence, Vol. 31 (San Francisco, CA: Hilton San Francisco Union Square). Available online at: https://ojs.aaai.org/index.php/AAAI/article/view/11172
Yu, D., Hu, S., Tong, L., Xia, C., and Ran, P. (2022). Dynamics and determinants of the grain yield gap in major grain-producing areas: a case study in hunan province, china. Foods 11:1122. doi: 10.3390/foods11081122
Zaveri, E., and B. Lobell, D. (2019). The role of irrigation in changing wheat yields and heat sensitivity in India. Nat. Commun. 10:4144. doi: 10.1038/s41467-019-12183-9
Zhang, Y., and Li, B. (2022). Detection of the spatio-temporal differentiation patterns and influencing factors of wheat production in huang-huai-hai region. Foods 11:1617. doi: 10.3390/foods11111617
Keywords: agricultural modeling, AI in agriculture, deep learning, environmental factors, helpline data, wheat yield
Citation: Godara S, Birthal PS, Avinash G, Ahmad Faiz M, Bana RS, Jhajhria A, Parsad R and Marwaha S (2024) Quantifying effects of climate change and farmers' information demand on wheat yield in India: a deep learning approach with regional clustering. Front. Sustain. Food Syst. 8:1357201. doi: 10.3389/fsufs.2024.1357201
Received: 19 December 2023; Accepted: 16 May 2024;
Published: 31 May 2024.
Edited by:
Roberto Valdivia, Oregon State University, United StatesReviewed by:
Azam Lashkari, John Innes Centre, United KingdomHarbir Singh, Indian Council of Agricultural Research (ICAR), India
Copyright © 2024 Godara, Birthal, Avinash, Ahmad Faiz, Bana, Jhajhria, Parsad and Marwaha. This is an open-access article distributed under the terms of the Creative Commons Attribution License (CC BY). The use, distribution or reproduction in other forums is permitted, provided the original author(s) and the copyright owner(s) are credited and that the original publication in this journal is cited, in accordance with accepted academic practice. No use, distribution or reproduction is permitted which does not comply with these terms.
*Correspondence: Mukhtar Ahmad Faiz, bWFmX21haGVyQHlhaG9vLmNvbQ==; bWFmLm1haGVyLmFuYXN0dUBnbWFpbC5jb20=; Ram Swaroop Bana, cnNiYW5hQGdtYWlsLmNvbQ==