- 1International Crops Research Institute for the Semi-Arid Tropics (ICRISAT), Addis Ababa, Ethiopia
- 2International Crops Research Institute for the Semi-Arid Tropics (ICRISAT), Patancheru, India
- 3Institute of Technology, Hawassa University, Hawassa, Ethiopia
- 4Institute of Technology, Addis Ababa University, Addis Ababa, Ethiopia
Food grown in the rainfed system in Ethiopia is frequently insufficient to meet household food needs due to recurrent drought, which causes severe food insecurity. Ethiopia’s drylands have also been hit by an increase in torrential floods. As a result, the ability to adapt to shocks and risks decreases. Despite the opportunity of highland-to-lowland to lowland connectivity, the opportunities for flood-recession farming are poorly understood. This study maps flood recession opportunities incorporating national flood occurrence information, flood images, and SMAP surface soil moisture from Soil Moisture Active Passive (SMAP) images in Omo Gibe basin and Mile sub-basin. The analysis demonstrates that during the past three decades, there have been substantial flood incidents in the country’s eastern, south-eastern, and southern regions. Notably, floods that happened in 1996, 2005, 2006, 2013, and 2018 affected 90, 91, 74, 74, and 69 locations, respectively. In 2020, flooding affected a considerable area (274 locations), which demonstrates the rise in flood hazards. Based on multi-criteria suitability analysis, about 32 million hectares of lowlands are highly suitable (61%) and moderately suitable (39%) for flood-based farming. In the Omo-Gibe and the Mile sub-basin, flood-recession zone mapping using a change detection approach revealed that Omo-Gibe basin has 107,359 ha and 29,550 ha of flood zones suitable for flood recession farming and Mile sub-basin of 8,048 ha and 88 ha, during the major and short rainy seasons, respectively. Our results highlight the extent of flood-prone areas and their suitability for flood farming and provide evidence of alternative strategies for managing flood risks. Consequently, identifying potential flood-prone areas using remote sensing technology aids decision-makers and subject-matter experts in introducing and demonstrating various types of flood-based farming. Further research is recommended to identify and validate appropriate flood farming practices under different biophysical and socio-economic contexts and explore complementary opportunities as well as support informed decision-making on flood risk management and recession flood strategies in the dry lowlands of Ethiopia.
1 Introduction
Drylands are challenging environments where human ingenuity, knowledge systems, and the careful use of natural resources are essential for survival. Globally, drylands represent 45.4% (66.7 mill km2) of the Earth’s total terrestrial area, significantly more than the previous statistical estimations (41%, ~ 60 mil km2) (MEA, 2005). Drylands cover 47 percent of the land in Eastern Africa or 328 million hectares; and the lowland dryland areas in Ethiopia, which are the focus of this study, cover about 55 percent of the landmass of the country (FAO, 2010). The drylands of Ethiopia have been faced with an increasing number of recurrent droughts and floods, leading to a decline in the potential for adaptation to shocks and risks (Davies and Bennett, 2007; OCHA, 2007). Due to the regular occurrence and cyclic nature of drought and flood in the lowlands, increasing disasters have become characteristics of large parts of the dryland pastoral and agro-pastoral populations (Müller-Mahn et al., 2010). Flooding is recognized as one of the major environmental hazards and catastrophic natural disasters in Ethiopia, and its physical manifestation has increased over the years (OCHA, 2007; Amede et al., 2022). The northeastern, eastern, southeastern, and southern lowlands of Ethiopia have experienced flash floods emerging from degraded highland mountain areas caused due to land use conversion, overgrazing, erosion, and soil depletion, which are also related to high intensities of rainfall in the highlands (Getnet et al., 2022; Gumma et al., 2022). Over the last decade, flood incidents have been significant across the country, and the events have become increasingly pronounced with the increase in the extent of land degradation in upstream areas (Barvels and Fensholt, 2021). The frequency and risks of large-scale river floods increase when heavy rainfall occurs on degraded mountainous areas in the highlands.
Managing flood water for productive use is one of the flood mitigation strategies that reduce flood hazards and simultaneously addresses food security issues in dry lowland environments (Gain et al., 2017; Amede et al., 2022; Zenebe et al., 2022). Many research findings stated that flood-based farming is an entry point to efficiently utilizing hazardous floods for productive use through various forms of engineering measures and agricultural practices (Mekdaschi Studer and Liniger, 2013; Tamagnone et al., 2020). For example, the potential suitability of spate irrigation was assessed and reported in Ethiopia (Hagos et al., 2014) and specifically in Logiya watershed in Afar (Bushira and Abudle, 2020) and Western Arsi (Chukalla et al., 2013). Flood-based farming, according to Steenbergen et al. (2011), contributes to food security and provides numerous environmental benefits across a wide range of geographies by making flood water available for agricultural use. Flood-based farming is important for nutritional security and household coping mechanisms during the dry season when other food sources are depleted (Singh et al., 2021). Annual flood regimes of rivers are important in flood-affected areas, where flood-based farming could be an effective solution to meet food security and sustain livelihoods (Motsumi et al., 2012; Balana et al., 2019; Tariq et al., 2020).
Flood-based farming is a rainfed farming system that occurs in dryland areas and relies on supplementary water derived from various types of floods (Liman Harou et al., 2020). It is a practice that depends on the residual soil moisture and soil nutrient deposits remains after flood recedes (Nederveen et al., 2011; Balana et al., 2019). Flood-based farming usually occurs in relatively low-lying areas with gentle topography. Various forms of flood-based farming are found across the world’s drylands (Varisco, 1983; Steenbergen et al., 2011; Liman Harou et al., 2020). However, to determine the extent and duration of flood-based farming, the flood water supply is often difficult to predict due to uncertainties in the timing, duration, size, and frequency of floods from ephemeral and perennial streams (Steenbergen et al., 2011). Furthermore, to utilize riverine floods, the river courses are changing from season to season leading to changes in riverbed levels and sediment accumulations.
Flood-based farming has been inadequately studied and understood under the context of Ethiopian highland and lowland geographical configuration (Castelli and Bresci, 2017; Meaza et al., 2017). Alemayehu (2014) has made detailed assessments of the status of existing spate practices, challenges and potentials. He emphasized huge potential and the possibility of transforming the high spate potential to drought-prone lowland parts of the country. Meaza et al. (2017) studied the potentials of marginal grabens in their water resources and fertile soils in the Rift Valley of Ethiopia. Despite the information on the current status of spate practices and the availability of information on historical flash floods and disasters, a comprehensive locally and temporally disaggregated magnitude of flood events, as well as associated flood farming opportunities, is rarely available in Ethiopia. Nowadays, remotely sensed multi-temporal satellite imagery (Pacetti et al., 2017) significantly overcomes the limitations associated with measured data on flood incidents and moisture data at landscape scale; remote sensing and geospatial technologies and models, such as Google Earth Engine (GEE), remote sensing (RS) and GIS techniques, bivariate models, and machine learning tools, are frequently used to assess flood-prone areas and their potential for flood-based farming (Pandey et al., 2022; Priyatna et al., 2023). Flood risk analysis and mapping are the primary products used in flood risk management systems to visualize and represent information for decision-making processes. In this context, assessing and improving understanding of the spatial extent of flooding and the spatial dynamics of soil moisture is critical for land use planning and assessing the potential impact of flood-based farming on agricultural production in Ethiopia’s dry and drought-affected lowlands. The objectives of this research are: (1) To identify the national flood risk areas through reviewing data and information from historical flood incidents, (2) to demarcate potential flood-prone areas optimally suitable for flood-based farming using experts’ knowledge, and (3) to delineate flood recession zones and analyze the trends of seasonal soil moisture regimes of case study landscapes using remote sensing techniques for assessing the potential flood recession farming.
2 Materials and methods
2.1 Description of the study area
The Omo Gibe and Awash basins are the largest river basins in the southwestern and northeastern parts of Ethiopia, respectively. The study was conducted in two contrasting basin systems in the highland-lowland configuration: Mile Sub-basin which is one of the terminal sub-basin of Awash basin and Omo Gibe basin (Figure 1 and Table 1). Both sites also represent the landscape of hydrologically interconnected upstream highlands and downstream lowlands. Omo Gibe River Basin drains the heavy rainfall from the west, central, and southern parts, flooding the Southern Omo Lowlands. It has a remarkable range of altitude, temperature, rainfall, and farming systems. The basin is characterized by diverse topographic features with the elevation ranges from 336 masl in the southern part to 3,576 masl in the northern highlands. Rainfall is characterized by a unimodal pattern from June to October (in the central and northern parts) and a bimodal pattern (southern parts) (Dagnachew et al., 2020; Orkodjo et al., 2022). The highest peak happens from July to August due to the largest part of the basin receiving rainfall from an unimodal monsoon pattern. On the other hand, significant flood peaks occur during March to May due to rainfall in the lower parts of the basin. Annual rainfall ranges from 318 mm in the southern lowlands to 2,228 mm in the highlands. The mean annual maximum temperature in the basin ranges from 16.6°C in the highlands to 34.8°C in the southern lowlands. The mean annual minimum temperature shows similar trends. The high minimum temperature (23.2°C) is observed in the south lowlands, whereas the lowest temperature (3.9°C) is observed in the west highlands (Anose et al., 2021). Mixed farming is the dominant livelihood in the Omo basin, in which the agropastoral system where local cattle, sheep, goat, and camel breeds are dominant in the south lowlands and the cereal-pulse and coffee cropping system (cereals such as wheat, maize, sorghum, teff, finger millet; beans; taro, potato, coffee, and enset) is dominant in the western, central, northern, and eastern highland parts of the basin.
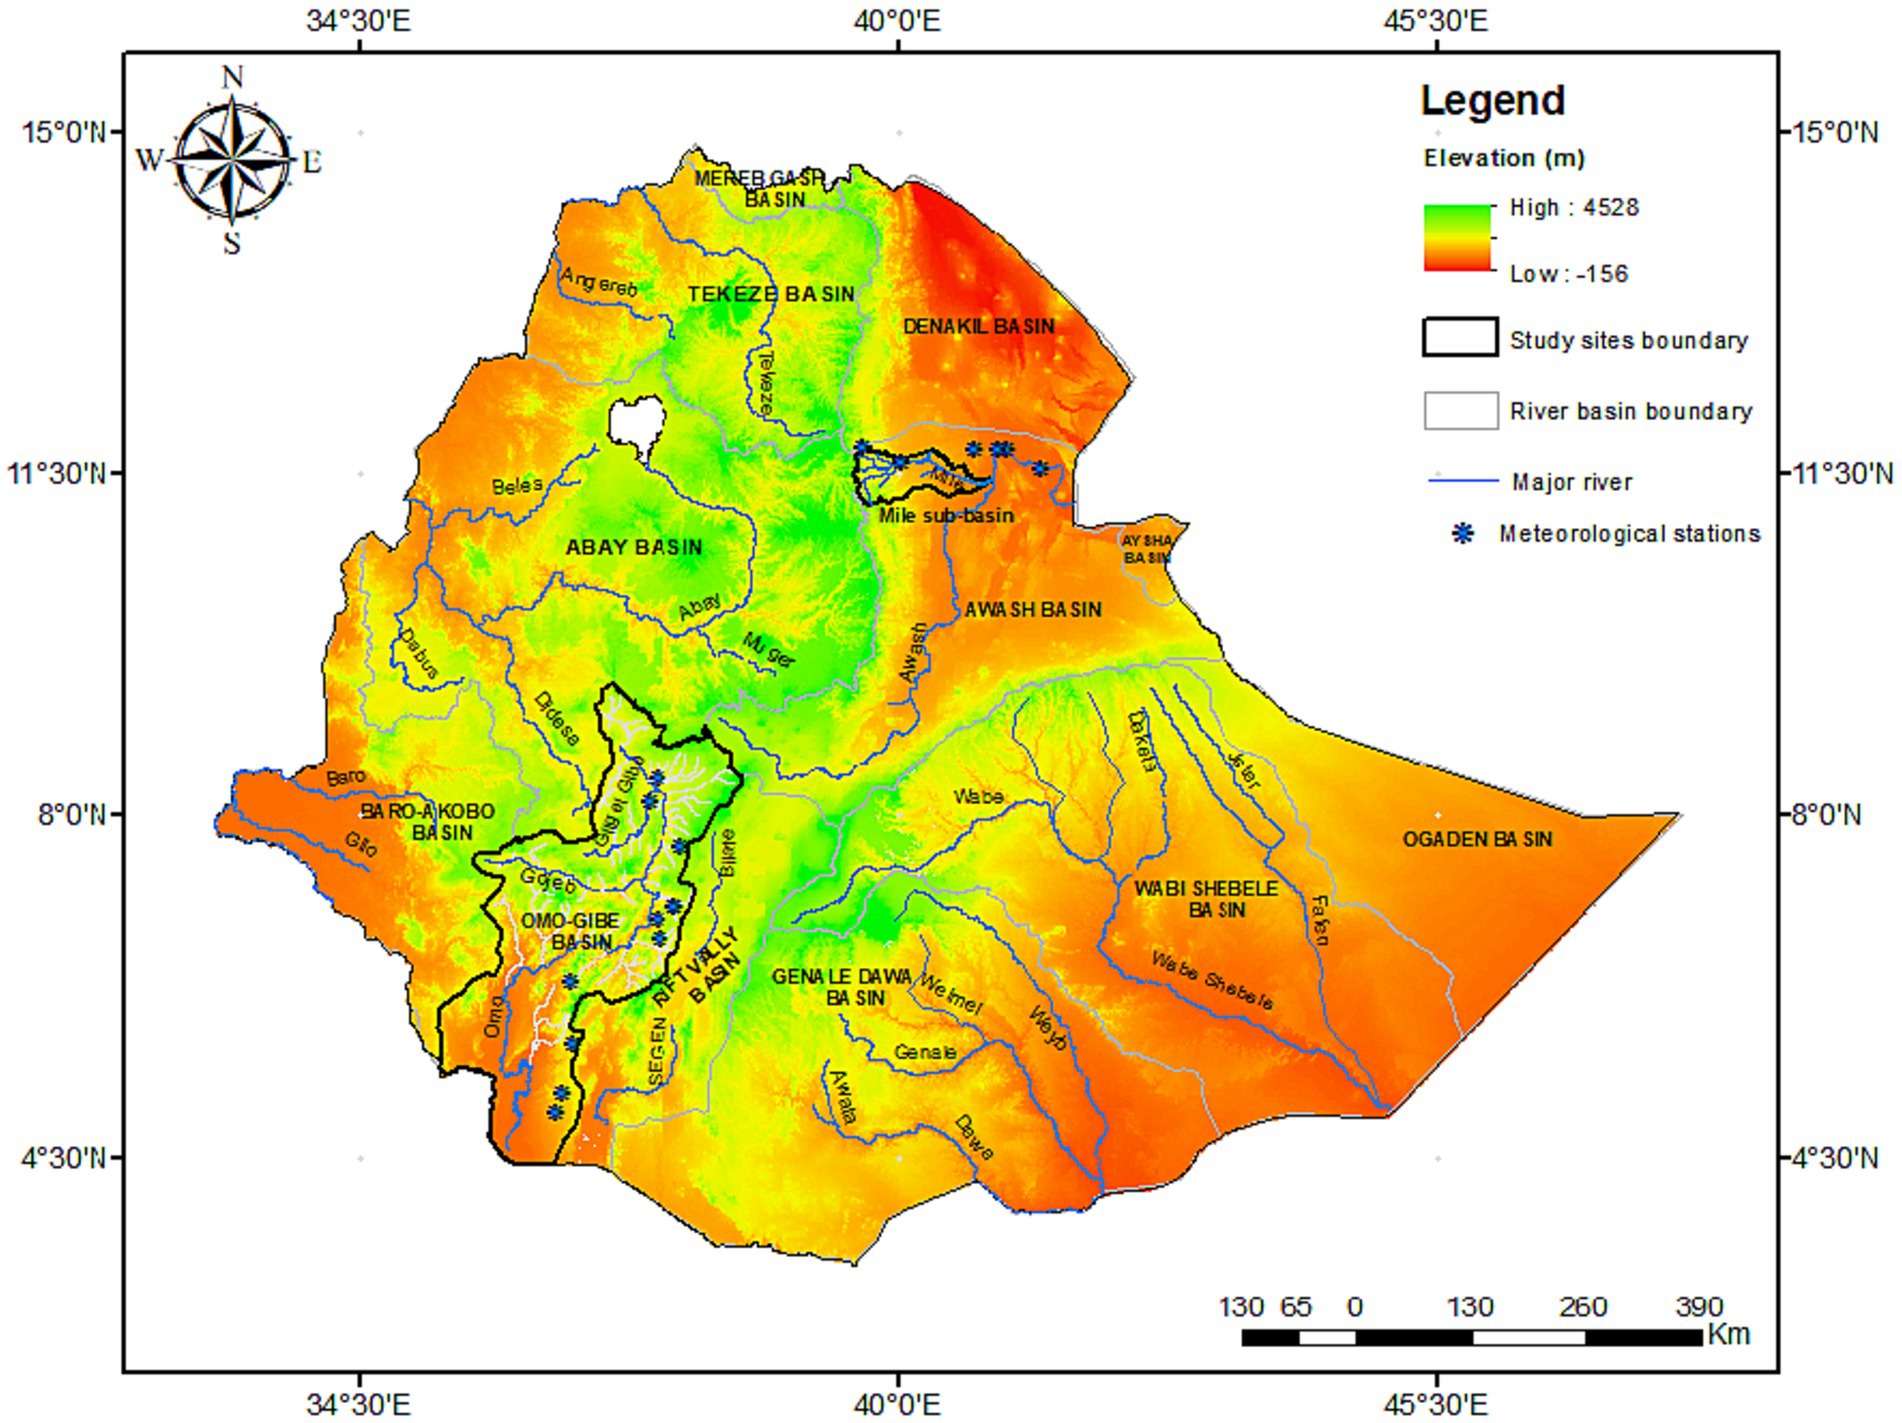
Figure 1. Location map of the case study landscapes (Omo Gibe Basin and Mile sub-basin in Awash Basin), names of basins and rivers, rainfall stations in the study landscapes and the mountain chains with high elevation ranges that are sources of flash floods. Readers refer to the names of rivers and basins and their locations in this map for the discussions about flood prone areas and flood suitability in the body of the text.

Table 1. Characteristics of the three landscape segments in Omo Gibe and Mile sub-basin river basins.
The Mile sub-basin drains the highlands of the northeastern escarpment and flows towards the extremely dry and fragile lowlands of the Afar regional state. The elevation ranges from 406 to 3,654 m asl. The upper part of the landscape is experiencing bimodal rainfall, while the lower part characterized by erratic and unreliable rainfall, is often plagued by drought and excessive flood risks (Gumma et al., 2022). Annual rainfall varies from 232 mm in the western lowlands to 1,144 mm in the eastern highlands of the Mile sub-basin. The higher mean annual maximum and minimum temperatures (34.2 and 21.6°C) are observed in the eastern highlands, whereas the corresponding lower mean temperatures (17.1 and 2.1°C) are observed in the western lowlands. The upstream parts are dominated by sorghum-based production mixed with livestock farming, particularly cattle production. Whereas, pastoral and agropastoral livelihood systems in the form of a combination of maize-based production and cattle and goat-based livestock farming are the dominant production systems in the downstream parts.
2.2 Stratified sampling of landscape segments
Omo Gibe and Mile sub-basins were divided into three landscape segments or zones (upper, middle, and lower) based on geomorphologic features, which vary in rainfall amount, soil types, elevation, slope characteristics, and frequency of drought occurrence (Table 1). The segmentation aids in characterizing flood sources, flood recession areas, and various flood zone classes. The watershed of the Omo Gibe basin area lies at elevations of 336–3,576 m, and it descends rapidly into depressions. The upper and middle Omo drainage systems show striking geometric arrangements of their streams. The lower third of the basin defines a complex tectonic depression. The upper middle zone in the western part and the upper north zone are characterized by high and moderate rainfall. The upper Gibe is covered with dense drainage, while the lower Omo Gibe basin is plain and dominated by slopes less than 5%, which are commonly flooded during the short and long rainy seasons. Mile Sub-basin is one of the Awash terminal sub-basins located in the Amhara and Afar regions at elevations ranging from 406 to 3,654 m. It has a high flood water potential draining the western highlands of the basin and varies temporally and spatially across the basin. The Mile sub-basin has a rugged topography with steep slopes in the upper and middle portions of the basin adjacent to the Amhara highlands and a relatively flat landscape in the lower portion.
2.3 Data sources and analysis
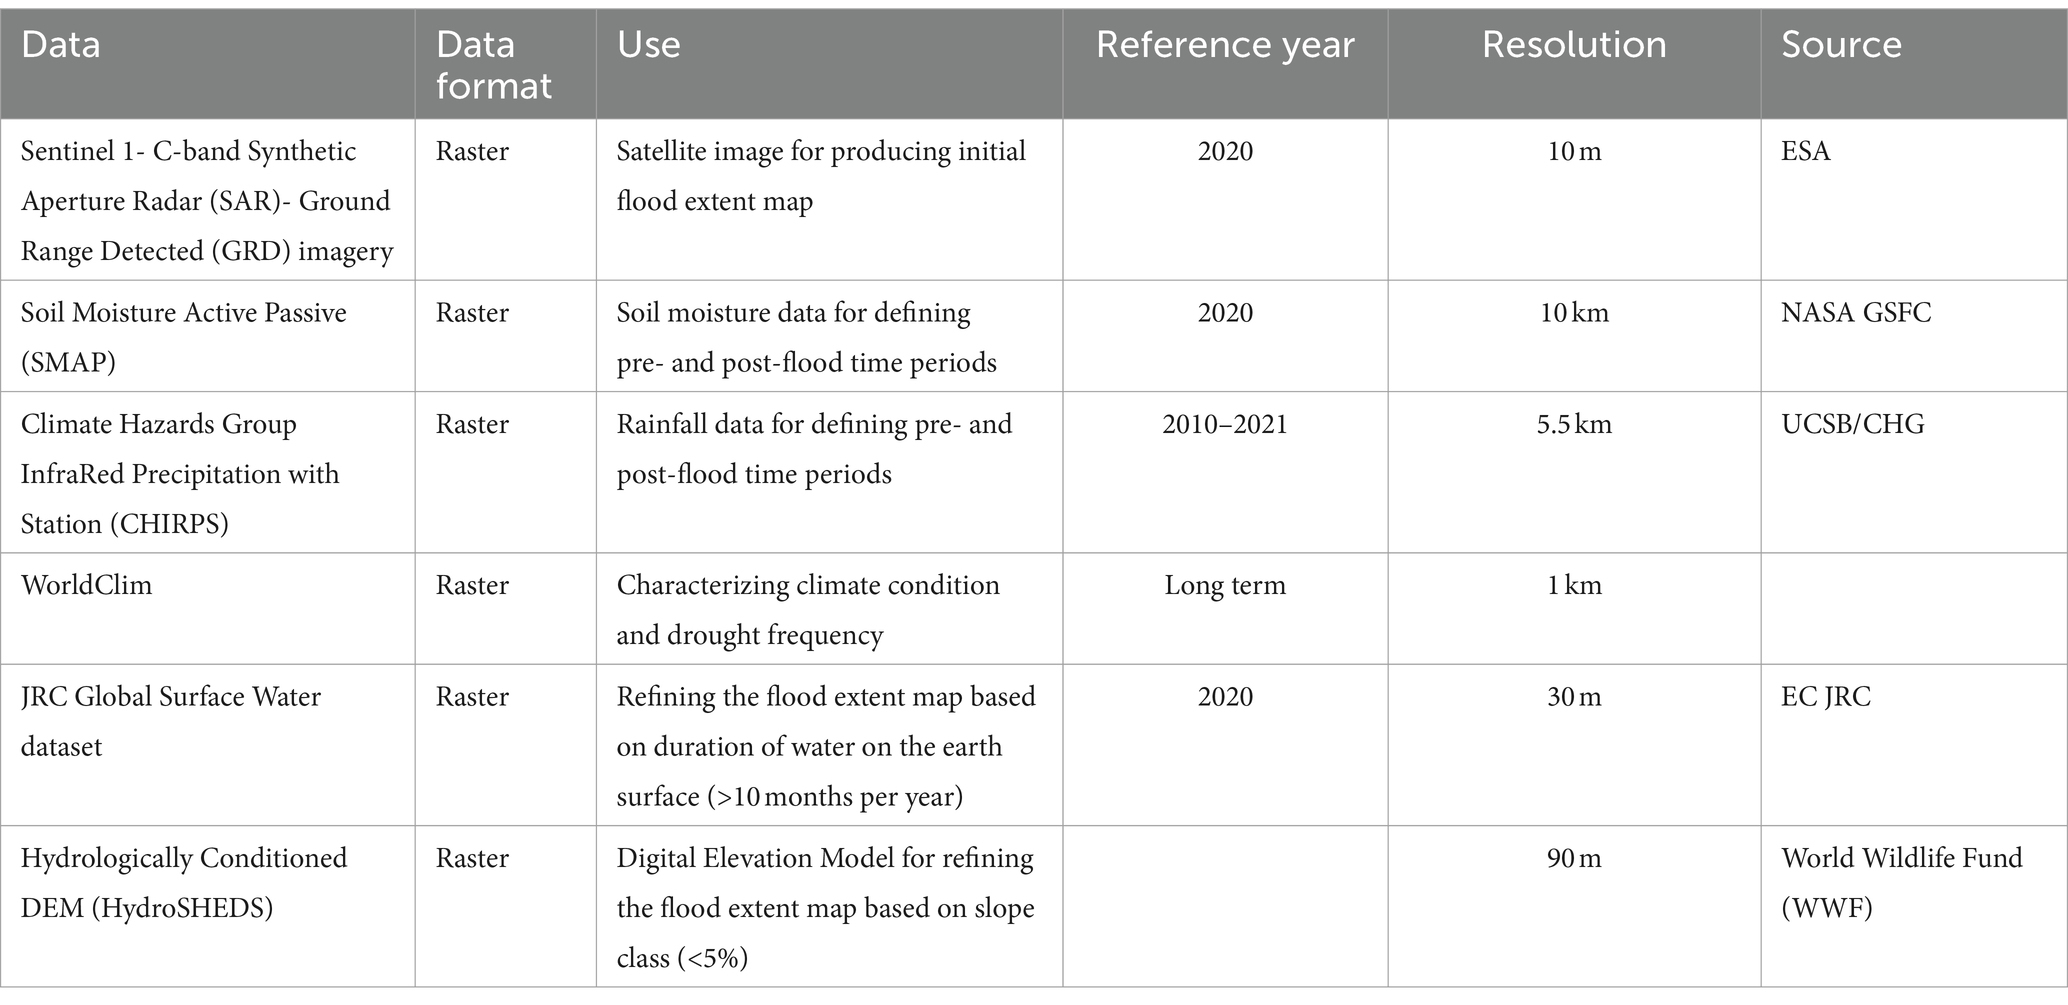
In this study, the data we dealt with is mainly data on flash flood occurrence and remotely sensed data. Since the study is focused on flash floods that exceed the stream size and spread over the river courses, measured discharge or flow data was not used. Instead, historical records of flash flood occurrence during the major (Meher) and short (Belg) rainy seasons (i.e., flood incidents and their date of occurrence and level of damage) were used as input to do remote sensing analysis of flood and soil moisture images. The historical flood events were also used to validate the spatial and temporal distribution of floods estimated from remote sensing. The extent of the spatial distribution of potential of recession flood farming was delineated using combined analysis of temporal flood events (images identified based on rainfall events) and soil moisture (i.e., SMAP image). The study made use of a variety of data sources, both primary and secondary. The study dataset primarily consists of spatial and non-spatial data, such as historical flood records, satellite imagery, and GIS-based raster and vector data, which were integrated and analyzed for assessing flood risk locations and potential areas for flood-based recession farming (Table 2).
2.3.1 Historical flash flood records
In Ethiopia, to develop natural hazard emergency response plans for humanitarian assistance, the National Flood Task Force hosted by the National Disaster Risk Management Commission (NDRMC) is in charge of recording seasonal flash flood events. Flash floods are caused by heavy rainfall in a short period and are usually reported with damages and fatalities. Flash floods often lead to issue early warning and emergency response alerts. Sixty years (1960–2020) seasonal flash floods, compiled from the United Nations Office for the Coordination of Humanitarian Affairs (UN-OCHA) flash flood snapshot reports and infographics (OCHA, 2007), as well as additional flash flood records compiled from literature (Desta et al., 2021) and the global flood dataset,1 were synthesized for assessing historical flood occurrence and associated flood risks. The database on flash floods records the duration of flood incidents in a locality, the extent of damage, and the overall situation of the incident. The historical data was also converted into spatial maps that show flood hotspot locations and district scale frequency of flood occurrence, which were used as base maps for the delineation of potential flood- based farming zones.
2.3.2 Multi-criteria analysis for delineating suitable flood-based farming zones
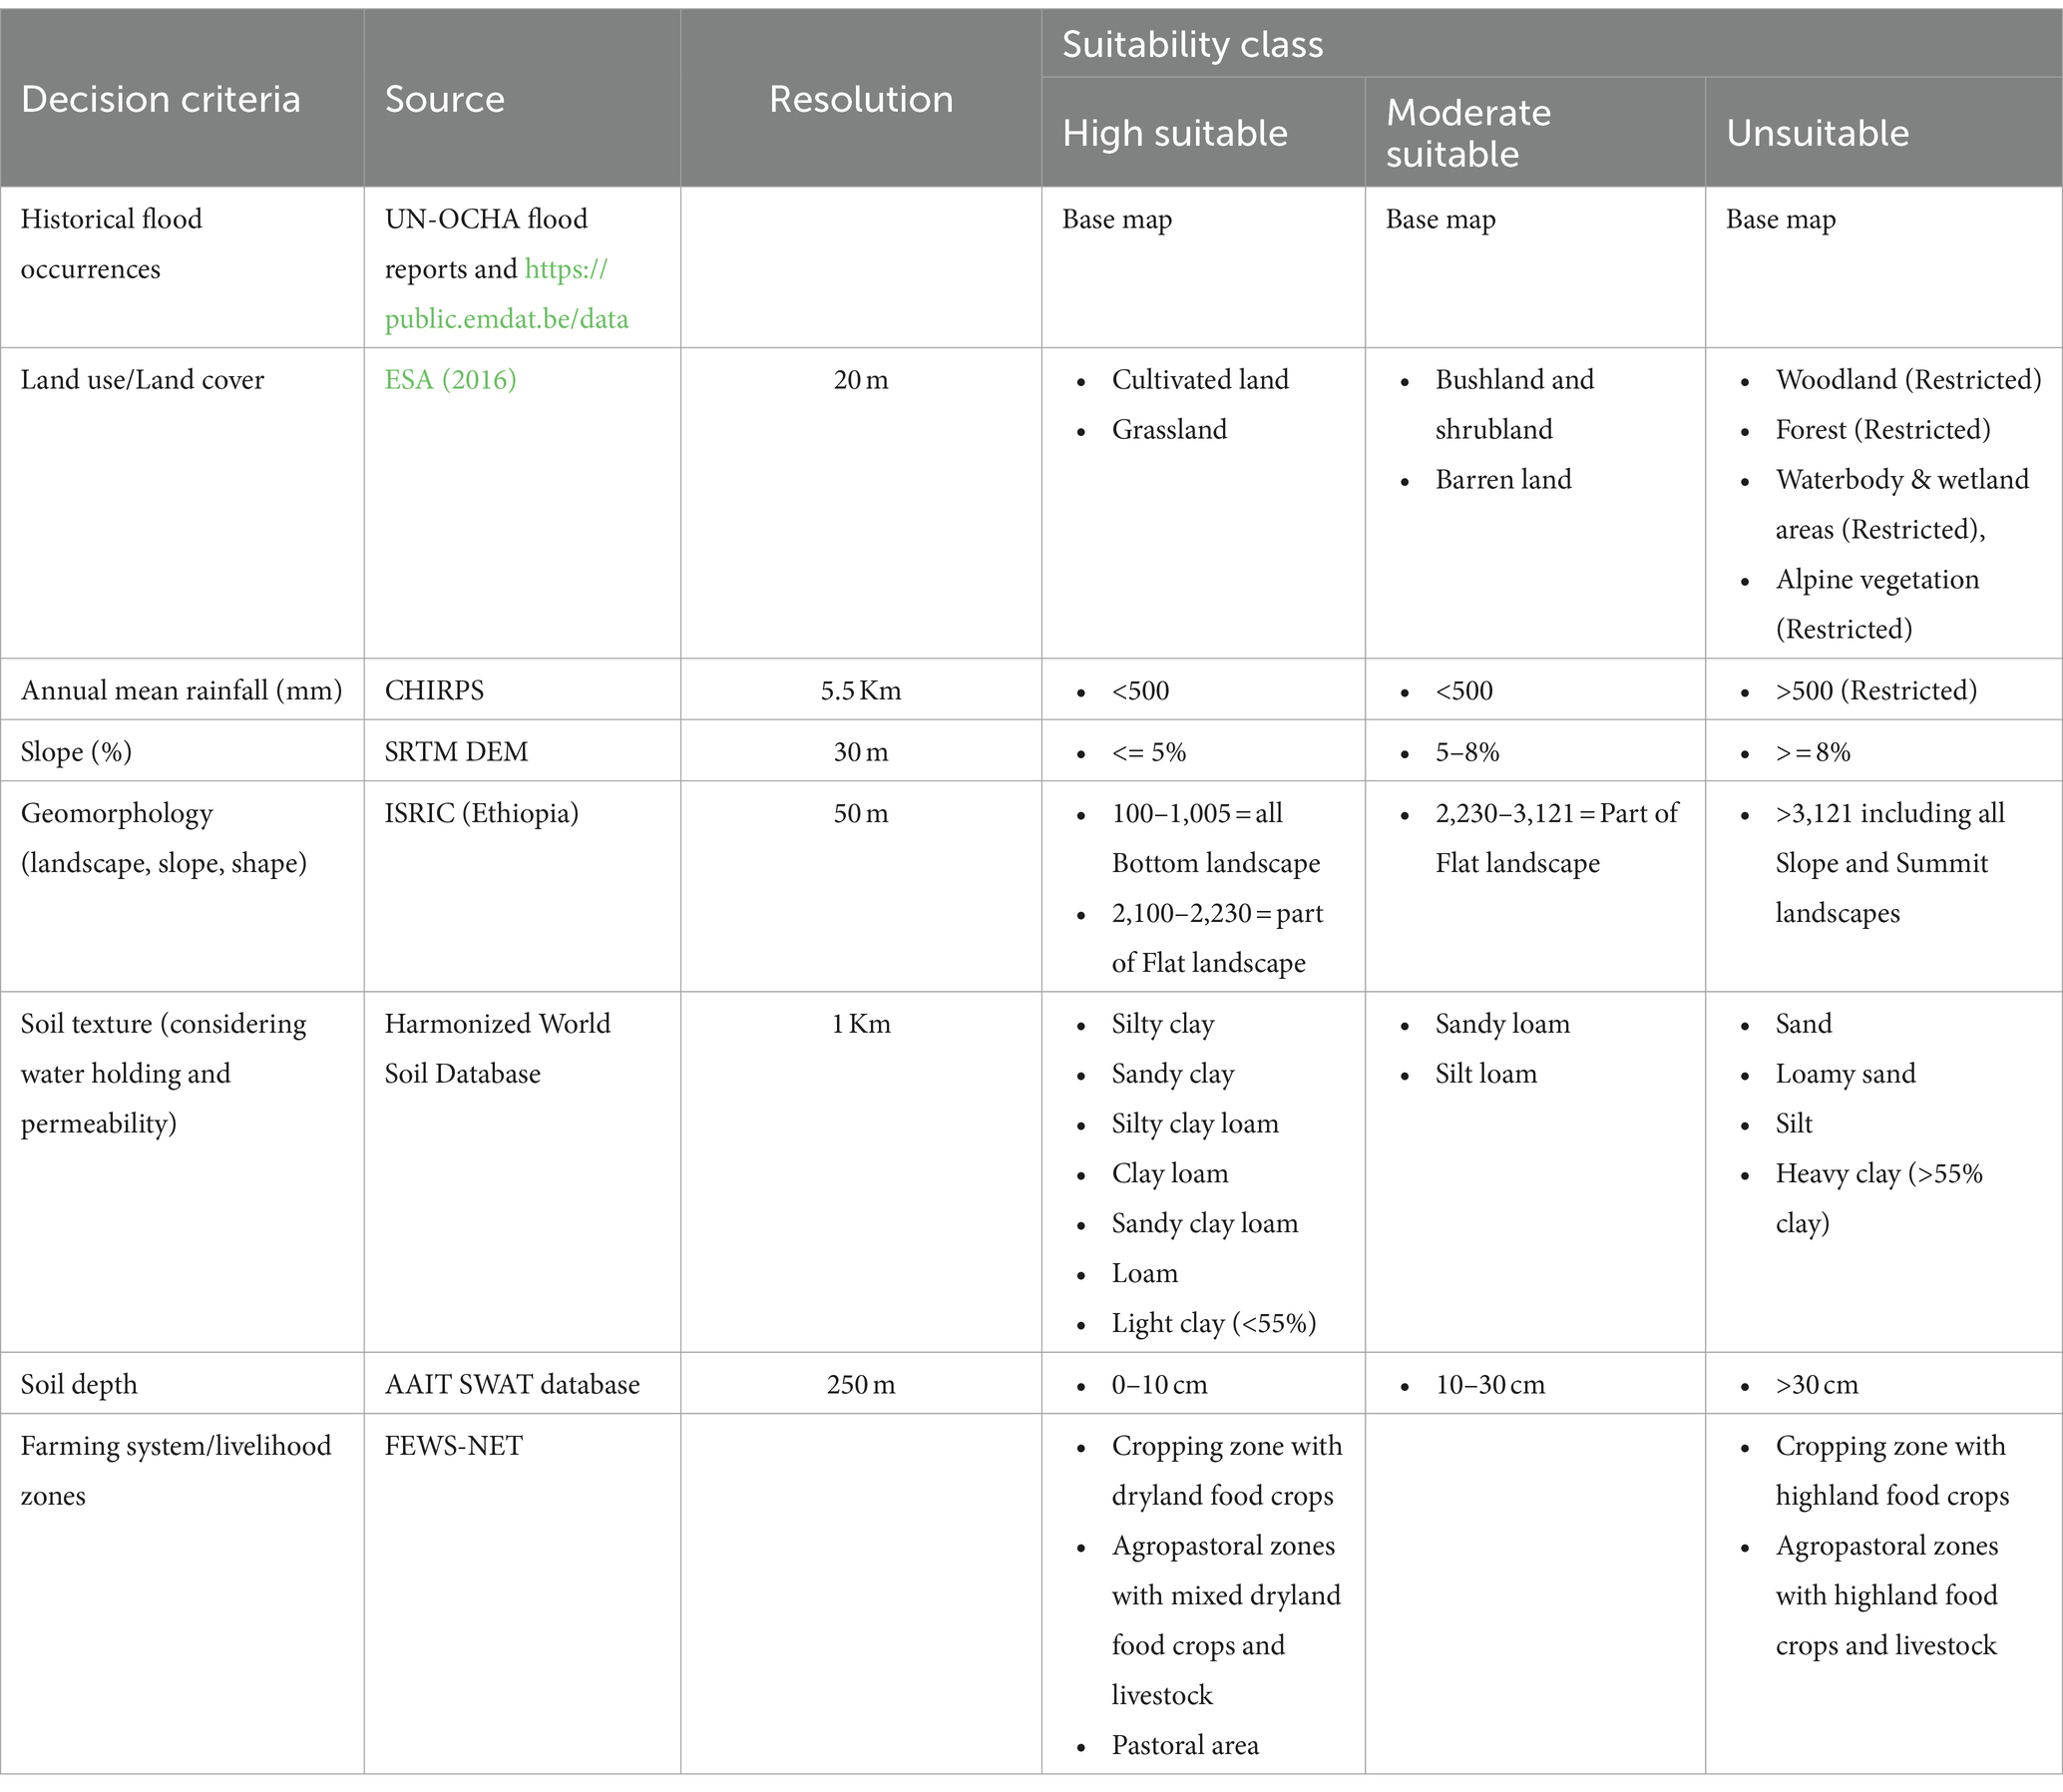
Expert knowledge was used to assess the socio-ecological suitability of flood-prone areas for targeting flood-based farming. Senior experts in the fields of hydrology and agriculture, who have practical knowledge of flood occurrence and flood farming and conducted their field research in the case study basins, were brought together to conduct a multi-criteria suitability analysis. During a week-long workshop, we brought together eight senior researchers and experts to identify important factors influencing flood-based farming and assist in the execution of GIS-based multi-criteria suitability analyses. First, the experts brainstormed the context of flood risks in the basins as well as flood farming principles and techniques and agreed to the context using Google Earth images. They identified the criteria and established a common understanding of the description of each of the criteria factors. Once they had reached an agreement on the subject of flood-based farming and criteria, each expert was asked to identify the criteria/ factors that influence flood-based farming and to set the threshold for each criterion by visualizing the spatial distribution of each factor in flood-prone areas. Criteria indicators included climate, soil, farming systems, land use and land cover, topography, and socioeconomic factors. To determine suitable potential flood-prone areas for flood-based farming, the weight of each decision criterion was estimated using the Analytical Hierarchical Process (AHP) in GIS, with experts’ pairwise ranking of factors as input.
Two classes were determined, highly suitable (SC1) and moderately suitable (SC2), as described in Table 2. The suitability analysis provided a contextualized and firsthand estimate of potential suitable areas for flood-based farming out of flood-prone areas. Because of the limitation of detailed information about flood farming analysis at the basin scale from past research, we established assumptions for the suitability analysis. Thus, the suitability analysis was carried out taking into account the following assumptions: (1) The current level of suitability analysis aims to assess and delineate potential flood-prone areas to be targeted for alternative flood-based farming strategies and interventions. (2) The suitability mapping did not consider the amount of flooding and duration of flooding, as this information is scarce in every river system. (3) The suitability does not differentiate between hazardous and useful floods, with the assumption that floodplain areas that received hazardous flash floods can be utilized either to improve the productivity of extensive pasture or rangeland or used to grow crops through a recessionary farming practice during the post-flood. (4) The suitability mapping broadly targets the arid and semi-arid lowland areas as well as drought-affected areas and pastoral, agropastoral, and sedimentary dryland farming systems. (5) Flood farming areas should exclude water bodies, wetlands, biodiversity reserve areas, forest areas, built-up areas, parks, and protected areas. Flood-prone areas that receive annual rainfall >500 mm was excluded, assuming the amount of rainfall is sufficient for rainfed farming.
2.3.3 Remotely sensed image analysis
Besides the historical flood information and experts’ knowledge, cloud-based remotely sensed satellite imageries in the Google Earth Engine (GEE) platform were used to detect and further verify the flooded areas suitable for flood-recession farming. GEE, which is a cloud-based platform for geospatial data analysis, was used for image processing and analysis using Application Programming Interface (API) code written in JavaScript. A change detection approach using a combination of multi-temporal Synthetic Aperture Radar (SAR) and other satellite imageries (Table 3) was applied for flood recession mapping through a comparison of backscattering signals between the flood image (events during post-flood period) and a reference image (events during pre-flood period) in GEE platform. The historical flash flood event records at each locality which were documented by UN-OCHA and (see footnote 1) were used as input to define periods of pre- and post-images and at the same time used to validate results of remote sensing analysis in the season. The years 1988, 1996, 1998, 2006, 2010, 2012, 2016, 2018, and 2020 were significant historical flood occurrences in Ethiopia. Historically, a total of 123 (in 58 districts) and 19 (in 7 districts) flash flood events were recorded in Omo and Mile study landscapes, respectively. The most recent years, 2016, 2018, and 2020, were chosen as input to analyze change in flood incidents that occurred during the short rainy season (Belg) and major rainy season (Meher). Most flood events were recorded in 2020. Using the records of the flood events from the 3 years, the seasonal flood occurrence periods were identified. After defining a separate flood window period for the short (Belg) and major (Meher) seasons by using meteorological rainfall data, the extent of flood-prone areas at the two study locations was determined by analyzing 234 [85 for the short (Belg) season and 149 for the major (Meher) season] Sentinel SAR images. To determine the extent of suitable areas (out of flood prone areas) for flood recession farming, the amount and duration of soil moisture needs to be examined if it meets the crop water requirement during the growth period. For this purpose, remote sensing products of soil moisture (SMAP) and CHRIPS rainfall data were also used to define soil moisture ranges during the pre and post flood periods. Radar satellite images from Synthetic Aperture Radar (SAR) sensors which have all weather day-night image acquisition capability are the most suitable for flood mapping (Hostache et al., 2012; Priyatna et al., 2023). According to the predefined parameters, the entire Sentinel-1 GRD filtered by the instrument mode [Interferometric (IW)], polarization (VV), pass direction (descending), spatial resolution (10 m) was clipped to the boundaries of study area and the selected time periods using API codes in GEE (see Supplementary materials). ArcGIS was used for map generation (Table 4).
3 Results
3.1 Flood occurrence and associated risks in Ethiopia
Flash floods occur in Ethiopia every year during the major rainy season (June to September) and the short rainy season (March to May) due to heavy rainfall or excessive river flow. Almost 90% of flood events in the country occur as a result of heavy rain, which causes rivers to overflow and inundate areas along riverbanks in lowland plains. Based on historical flash flood data compiled from various sources, the spatial extent of historical flood events in Ethiopia in the period from 1960 to 2020 was analyzed and depicted (Figure 2). The analysis of flood occurrence and associated risks revealed that the number of flood-prone areas had increased since the 1990s, with a significant change occurring after the 2010s. Before the 1990s, the number of flood-prone locations was between 6 and 23. However, the flood-affected areas steadily increased to 247, 306, and 540 in the 1990s, 2000s, and 2010s, respectively (Figure 3). Excessive floods occurred in 1996, 2005, 2006, 2013 and 2018 affected 90, 91, 74, 74, and 69 locations in the country. Exceptionally, flood events in 2020 have affected large areas (274 locations) of the country, indicating an increase in flood risks in recent years. The 2020 climate bulletin of the National Meteorology Agency indicated that the total rainfall amount of the year 2020 exceeded 1,250 mm over western and the highland of Amhara, Benishangul-Gumuz, Eastern Oromia, and most of SNNPR and the central and western Oromia. In association with this, for example, the annual total rainfall amount reported over Nekemte was as high as 2243.7 mm, and in general 2020 is wetter than 2019. Previous studies also reaffirm the increased frequency of flood incidents over the last 20 years (Mamo et al., 2019; Demissie et al., 2021; Wudineh et al., 2022). The studies identified land use change, vegetation degradation, and climate change and variability as the main driving factors for the increased incidents of flooding. These highlights that beyond the heavy rainfall events, the change in land uses and deforestation in the upstream mountain areas specifically in the south, southeast, eastern, and Rift Valley areas have a major influence for increased occurrence and frequency of flooding. These areas are also facing cyclic risks of droughts. This section presents the spatial distribution and frequency of flood prone areas (Figure 2)- and the suitability of the flood prone areas for flood farming (Figure 4). The names of basins, rivers and local names presented in this section are illustrated in Figure 1. As depicted in Figure 2 and the suitability map in Figure 4, during July to September, heavy rains in neighboring highland areas of Oromia (the southeast mountain chains in Bale and Harargie zones) and partly in the southern region cause flooding along the Wabishebele, Genale, and Dawa rivers (refer river names in Figure 1). Flood occurs every year in areas along the lower Wabishebele river. Flooding occurs at least once every 3 years in the upper, middle, and lower Awash River, Baro and Gilo Rivers in Gambella, flood plain areas around Lake Tana in the upper Abay Basin, lower Omo river in South Omo, and along the Genale and Weyb rivers (see Figure 1 and Figure 2). Heavy rainfall in the highlands of northeastern mountain chains of Amhara and Tigray and the central highlands often caused an overflow of Awash River and its tributaries in Afar. In the southern part of the country, floods occurred in the Konso area (Segen river) and along the Omo River during March to May and July to November. In the Rift Valley, floods occurred in the floodplain areas along the Bilatie River and around Lake Abaya (for example Humbo and Offa districts). During heavy rains, Flooding in the Fogera and Dembia floodplains is caused by Lake Tana’s backflow and the overflow of the Gumara, Rib, and Megech rivers that drain to Lake Tana. As a result, Awash, Wabishebele, Genale, Dawa, Omo Gibe, Baro, and Akobo Rivers, as well as the floodplains surrounding Lake Tana and the Rift Valley Lakes occupied large flood-prone areas (Figure 2). This shows the occurrence of extensive flood incidents in the south, southeast, eastern, central and Rift Valley parts whereas the north and northwest (like Abay and Tekeze basins) have no frequent records of floods except the Lake Tana flood plains. This is likely partly attributed to the large coverage of the soil and water conservation practices. These practices could reduce the occurrence of flash floods. Under increased spatial coverage of flood-prone areas and growing flood frequency over years, the associated humanitarian risks and damages on economic activities have been increased (OCHA, 2007) as indicated in Figure 3. For instance, the number of people affected by floods (both displaced and deaths) increased over decades, from 16 thousand in the 1960s to 4.2 million in the 2010s (Figure 3).
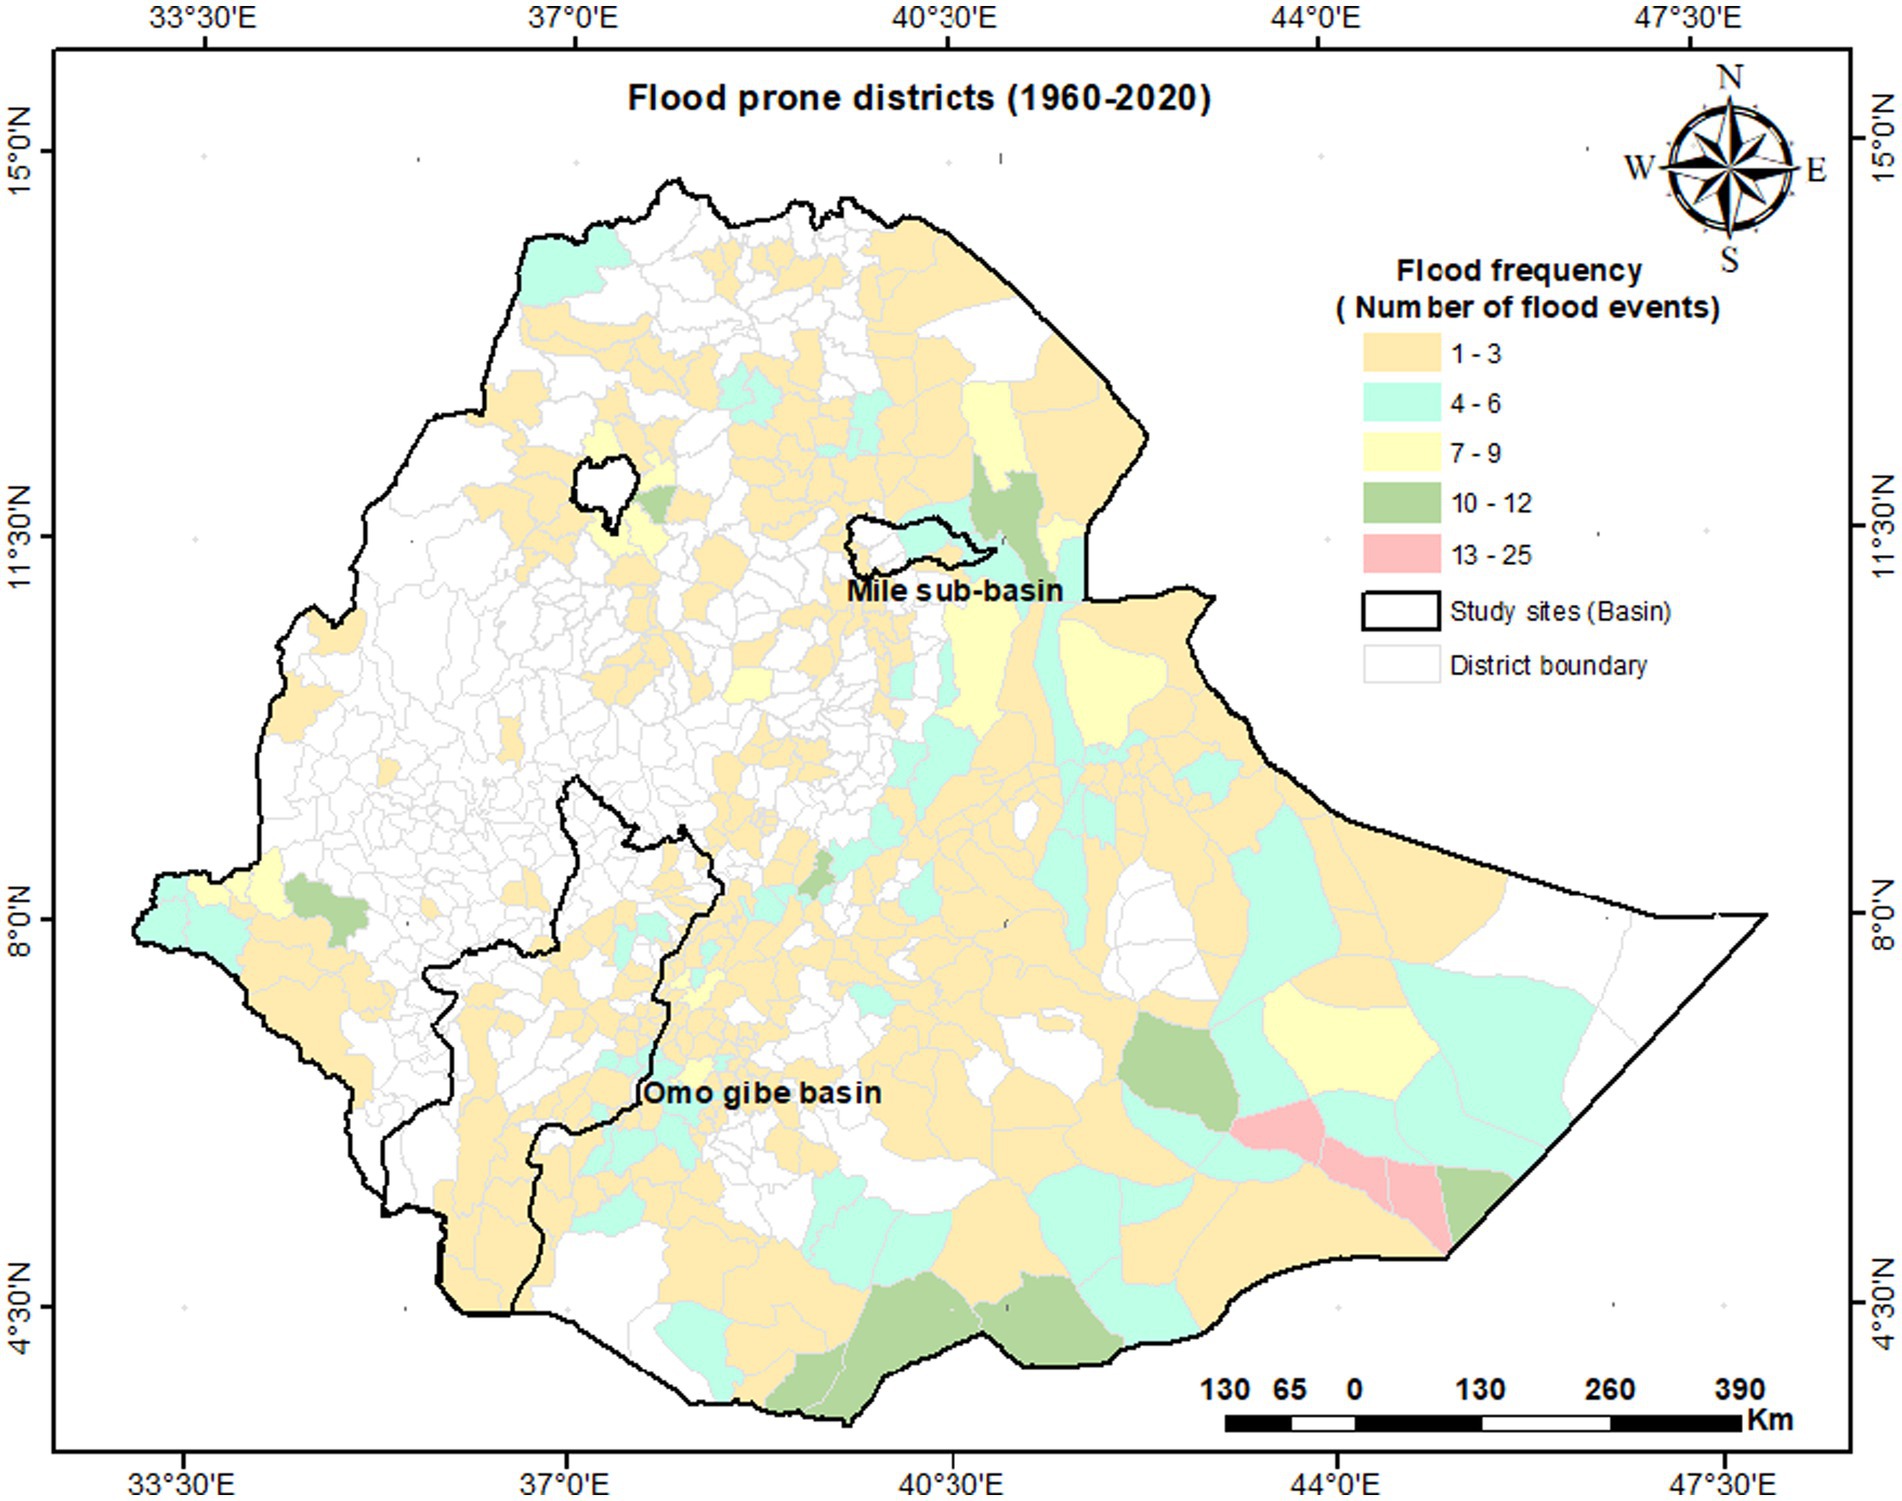
Figure 2. Flood-prone areas (shaded areas) in Ethiopia and displaying frequency of flood occurrence (1–25 times) per location (Source: remapped from historical data records of UN-OCHA seasonal flood snapshots, https://public.emdat.be/data, and Mamo et al., 2019) [adapted from Desta et al. (2021)].
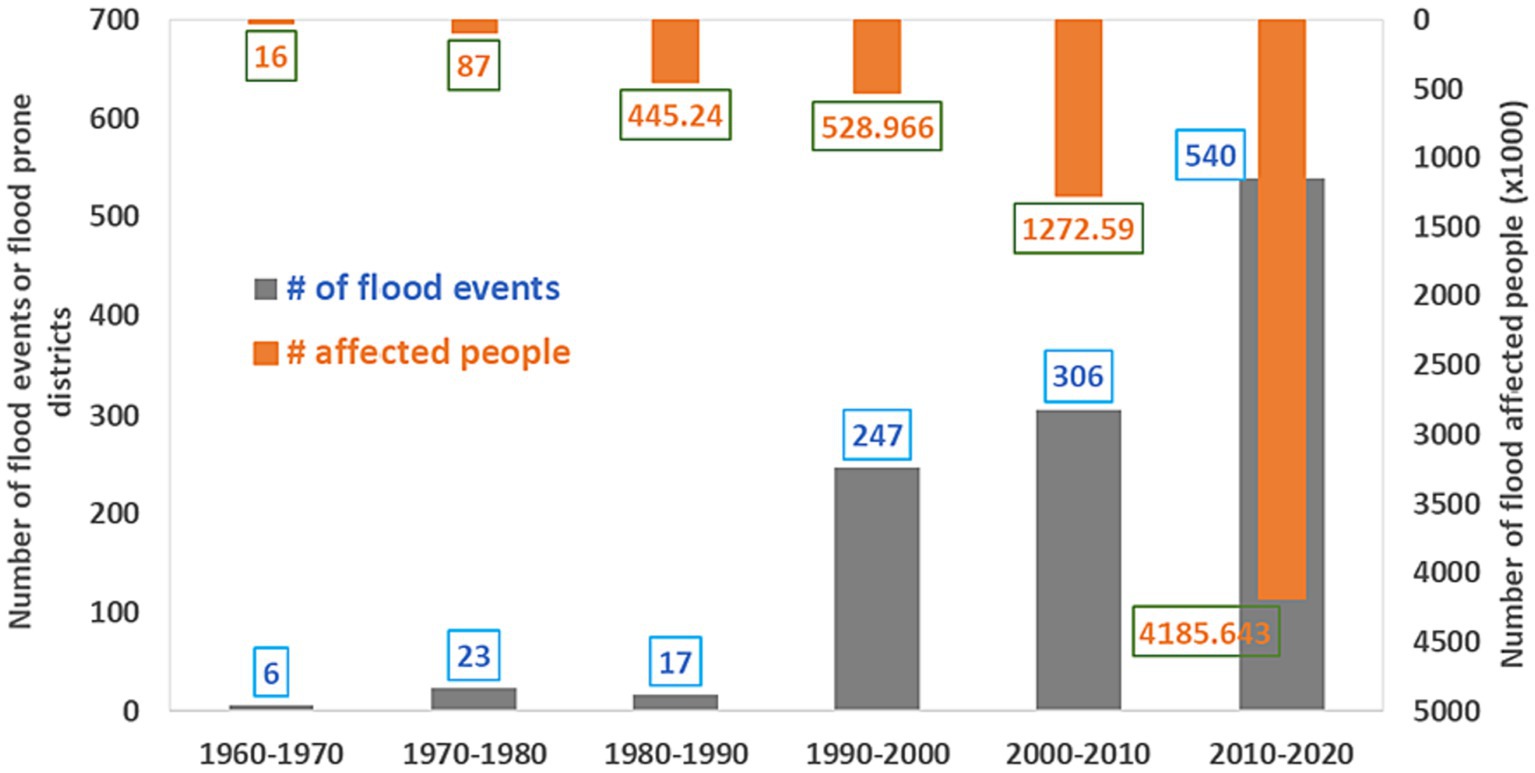
Figure 3. Trends of flood incidents (number of flood-prone locations) and total affected people over decades (1960–2020) (own analysis and https://public.emdat.be/data) [adapted from Desta et al. (2021)].
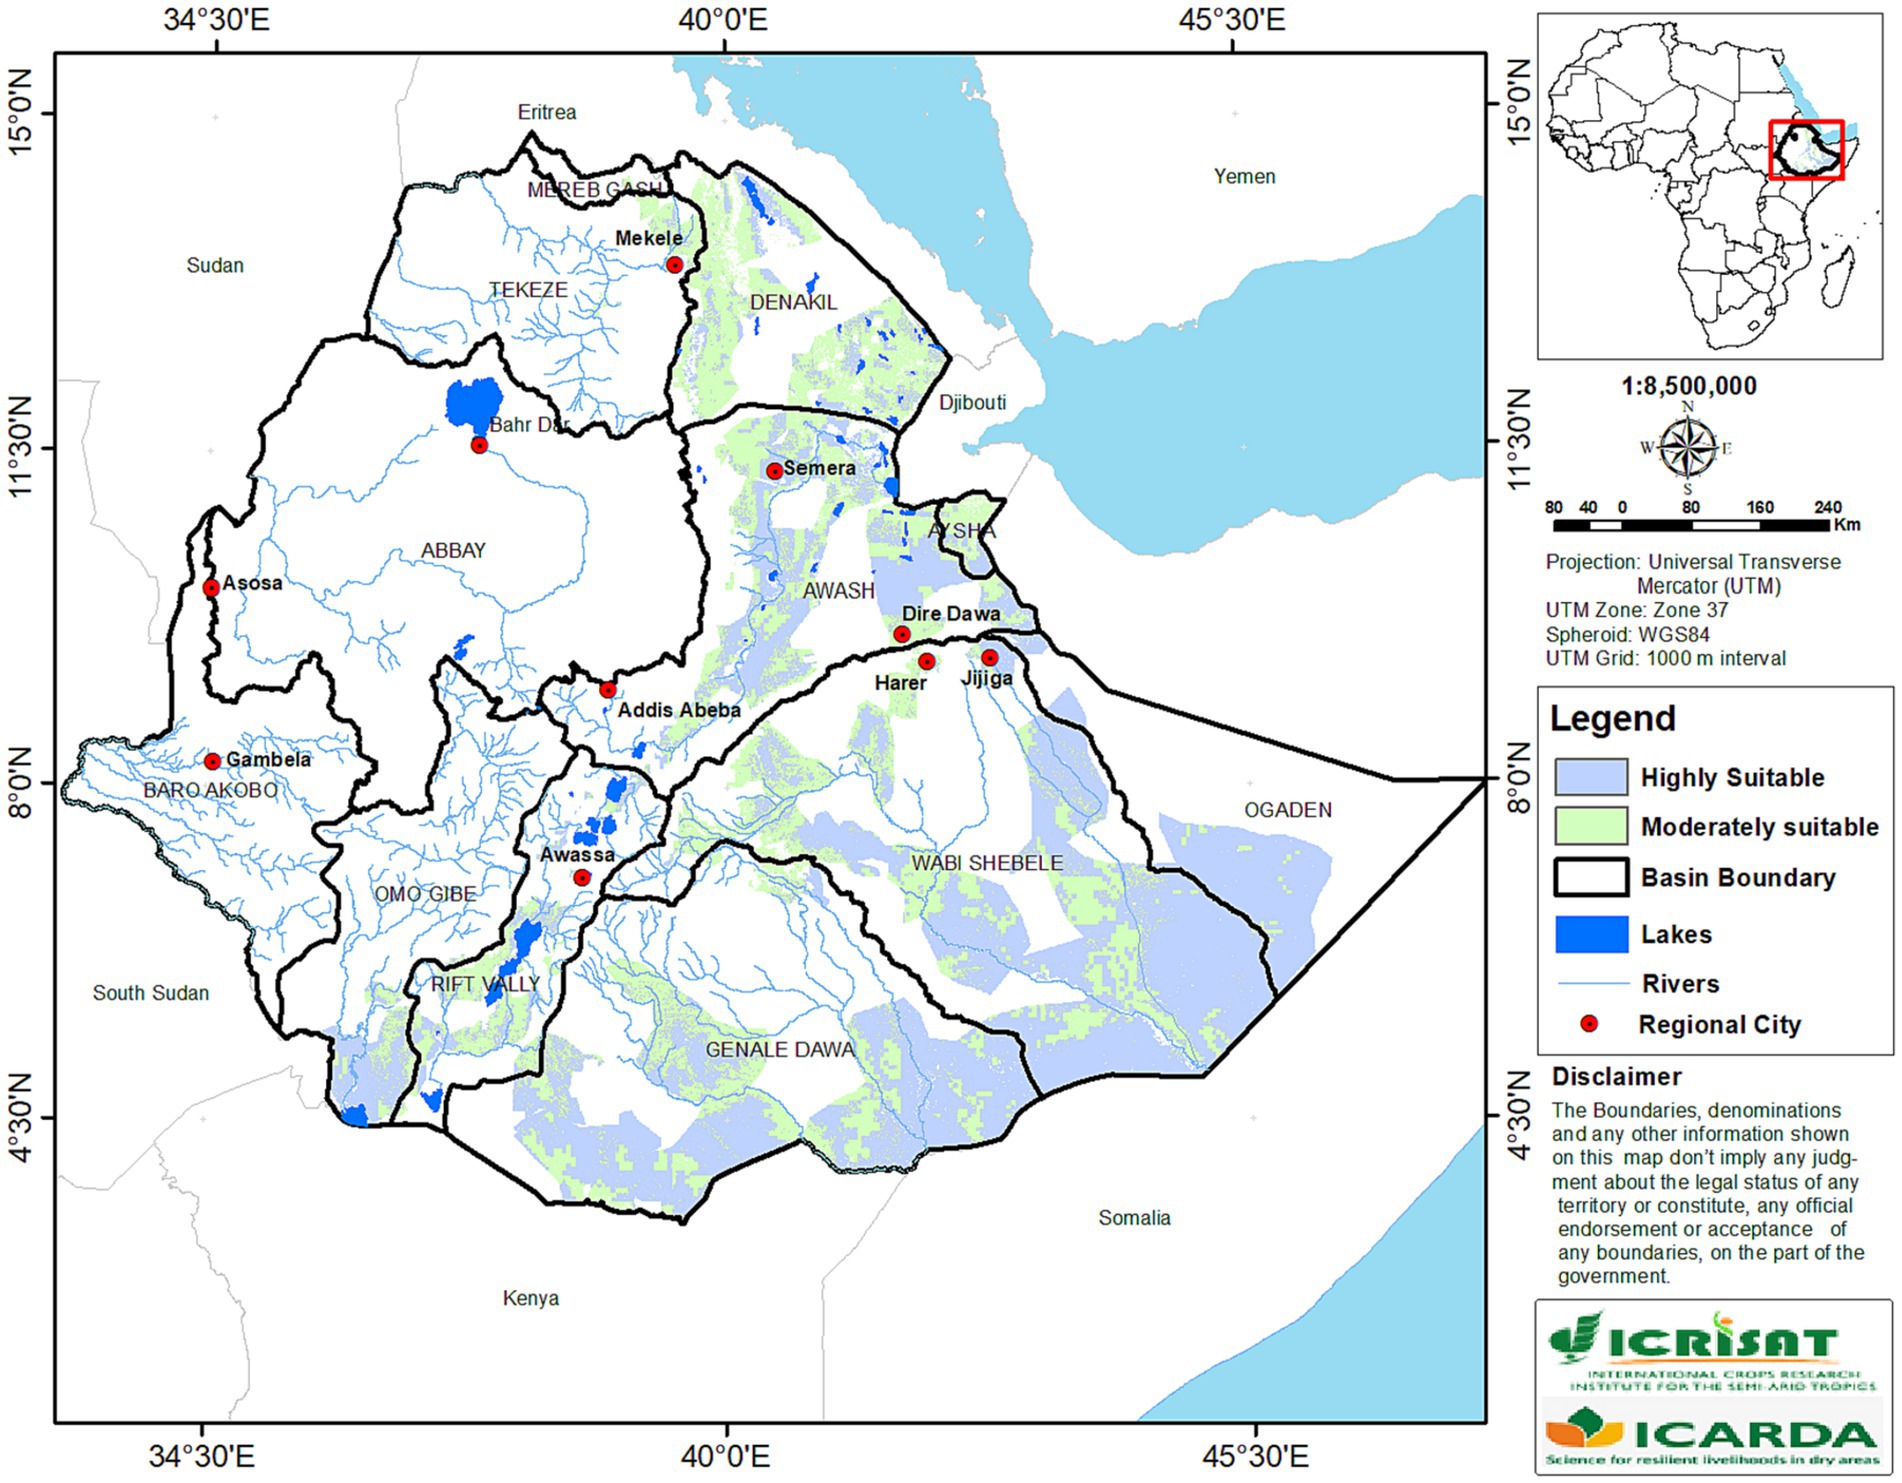
Figure 4. Map of socio-ecological suitability of flood prone areas for flood-based farming in Ethiopia using multi-criteria methods by expert knowledge. The suitability map was prepared for CGIAR WLE deliverable (source: Desta et al., 2021).
In recent years, the cyclicity of drought and flood events in the Horn of Africa is more frequent, where the occurrence of multi-hazard events is likely to amplify disaster impacts (IPCC, 2022). These cyclic disaster risks are the results of complex spatiotemporal interactions between risk components, impacts, and societal response (Matanó et al., 2022). The EM-DAT international disaster database indicates that over the last 20 years (2002–2021) floods (n = 793) and droughts (n = 137) represented 55% of natural hazards in Africa (n = 1,693), with 14,053 and 20,821 deaths, respectively. As also observed by Di Baldassarre et al. (2017), there is a fluctuating trend of annual drought-flood recurrences, indicating that the interplay of droughts with floods.
Floods occur more frequently than droughts, with annually an average of 40 flood events and seven drought events. When we see floods in otherwise dry areas, it is important to be aware and spread awareness that when a lot of rain falls in a very short period after longer periods of drought this leads to a shallow absorbance of the rain. For instance, drought hazards lead to soil degradation, reduced sub-surface water storage, and a lower capacity for soil infiltration, which increases runoff and proneness to flood risk. Unfortunately, the short and heavy rainfalls in the dry areas is a disaster as it came in big volume and became a flood. The recent drought that occurred in Borena Ethiopia is associated with flash floods.
3.2 Suitability of flood-prone areas for flood-based farming in Ethiopia
Considering the historical flood-prone areas (section 3.1) as a base map, GIS-based multi-criteria suitability analysis using an expert-based AHP technique was used to delineate flood-prone areas potentially suitable for flood-based farming. The multi-criteria suitability mapping resulted in 32.6 million ha of land in the country which is estimated to be suitable and moderately suitable for various types of flood-based farming. Sixty-one percent of the total suitable flood recession areas (20 million ha) were classified as highly suitable (SC1), while 39 percent (12.6 million ha) were classified as moderately suitable (SC2) (Figure 4).
Table 4 presents basin scale area coverage of suitable areas for flood based farming. Basin-wise analysis showed that the lower part of the Wabi Shebele basin has the largest area coverage which accounts for 10.9 million ha (33.6%) of the total land area classified as SC1 and SC2. It is followed by Genale Dawa with 8.17 million ha (25.1%) and Awash 4.92 million ha (15.1%). Considering highly suitable classes alone (SC1), Wabi Shebele has the largest area coverage (7.57 million ha, 38.1%) followed by Genale Dawa (5.39 million ha, 27.1%), and Awash (2.63 million ha, 13.2%). Basins such as Ogaden, Omo Gibe, and Rift Valley have 2.13 million, 0.68 million, and 0.57 million hectares of highly suitable areas. Although basins like Abbay and Baro Akobo have flood-prone areas, they are excluded from the suitability analysis as most of the flooded areas receive more than 500 mm of seasonal rainfall. Thus, identification and delineation of flood areas using a hybrid of expert knowledge and geospatial analysis supports informed decision-making on the flood risk and flood farming strategies using best agricultural technologies and practices. The magnitude of suitable flood areas revealed that flood-based farming could be an entry point for boosting agricultural production in the drought-affected and food-insecure areas of the lowlands.
3.3 Soil moisture during pre- and post-flood events
Figure 5 shows the soil moisture trend in April before and after events of extreme rainfall at the different meteorological stations located in the Awash Mile-Asaita flood landscape. To detect flooded areas in the lower landscape, we took SAR images on 10 April 2020 as pre-flood image and 28 April 2020 as post-flood image. In the Mile-Asaita flood zone, there were no extreme rainfall events during early April. It is observed that soil moisture from 1 to 10 April is low (Figure 5) extracted from the before extreme image. Similarly, the rainfall chart shows very little rainfall from 1 to 10 April except for small rainfall in the lower part of the flood landscape at Chifra station. After 11 April, sudden increments in soil moisture were observed and steadily attained peak soil moisture (10 mm) on 20 April. The soil moisture was strongly matched with the rainfall trend (Figure 5) occurring at the upstream meteorology station (Sirinka). The increase in soil moisture in the lower flood areas after the occurrence of rainfall in the upstream highlands shows that there is a strong correlation between upstream rainfall source areas and downstream flood recession areas.
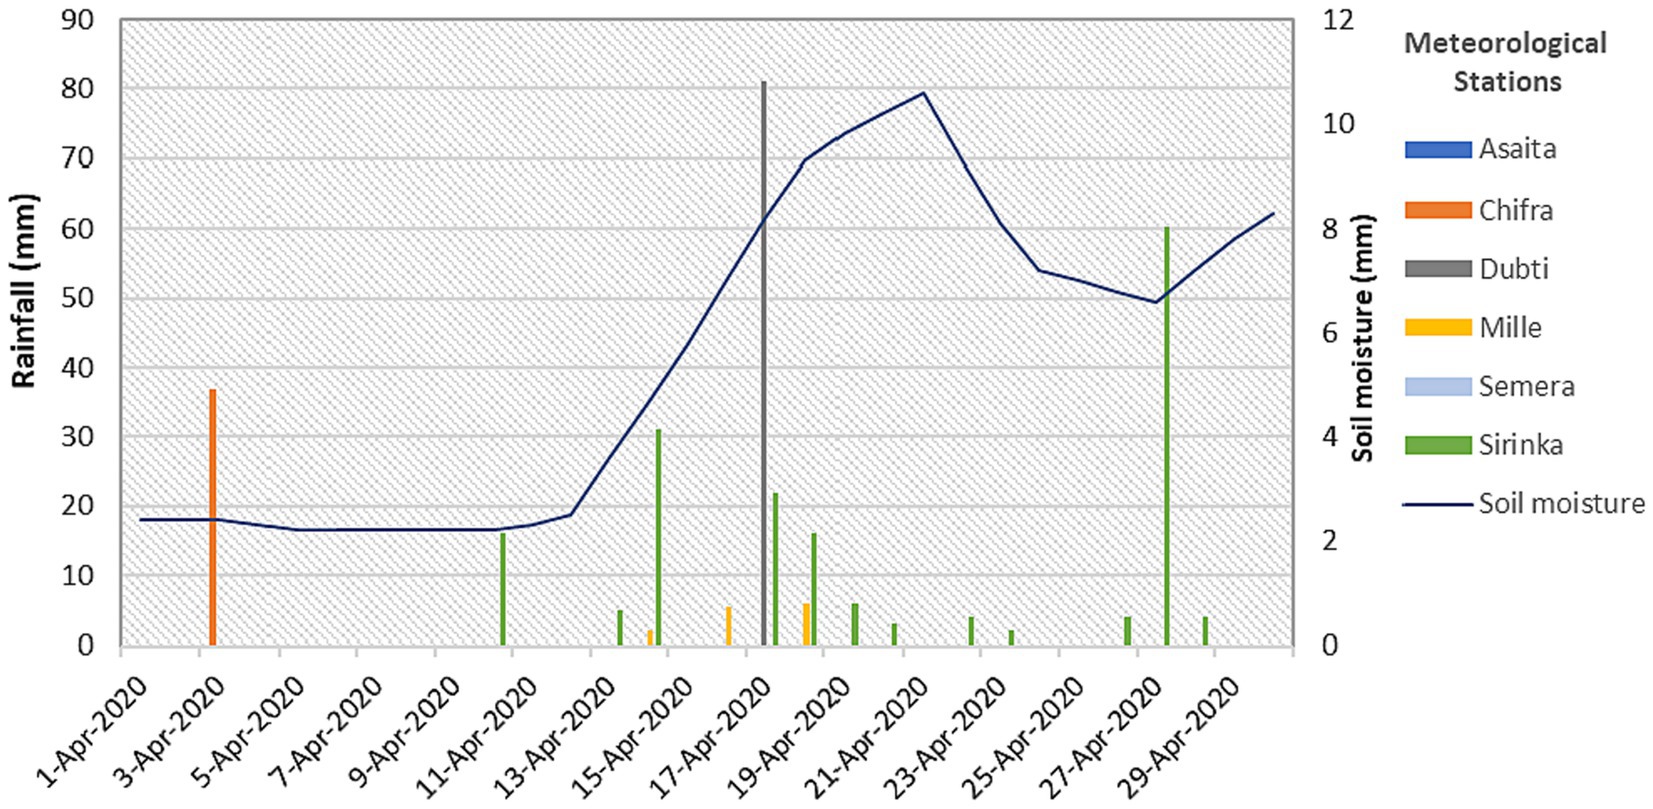
Figure 5. Distribution of rainfall events (bars) occurred at different meteorological stations in the Mile sub-basin and trends of surface soil moisture (SMAP) (line graph) extracted from before and after flood events in the selected Mile-Asaita flood landscape. Meteorological stations at Dubti, Asaita, and Semera did not record any rainfall during the month of April.
Figure 6 shows the trends of soil moisture and rainfall events in the Omo Gibe river basin. The soil moisture pattern is drawn for relevant rainfall months at three landscape zones that demonstrate the occurrence of flood recession areas. For instance, in the 2020 rainy season, the moisture trends indicate four distinct moisture retention periods, February to Mid-May, Mid-May to September, October to November, and December to January. Two seasons, February to May and October to November provided adequate soil moisture content between 10 and 20 mm while the remaining months had an average 10 mm of soil moisture (Figure 6, bottom). The soil moisture trends are very much associated with the spatial and temporal distribution of rainfall events in the landscape (Figure 6, top). Disaggregating the low and high soil moisture patterns in relation to upstream, middle, and lower zones of the landscape can provide information about where the flood recession becomes an opportunity for agricultural production.
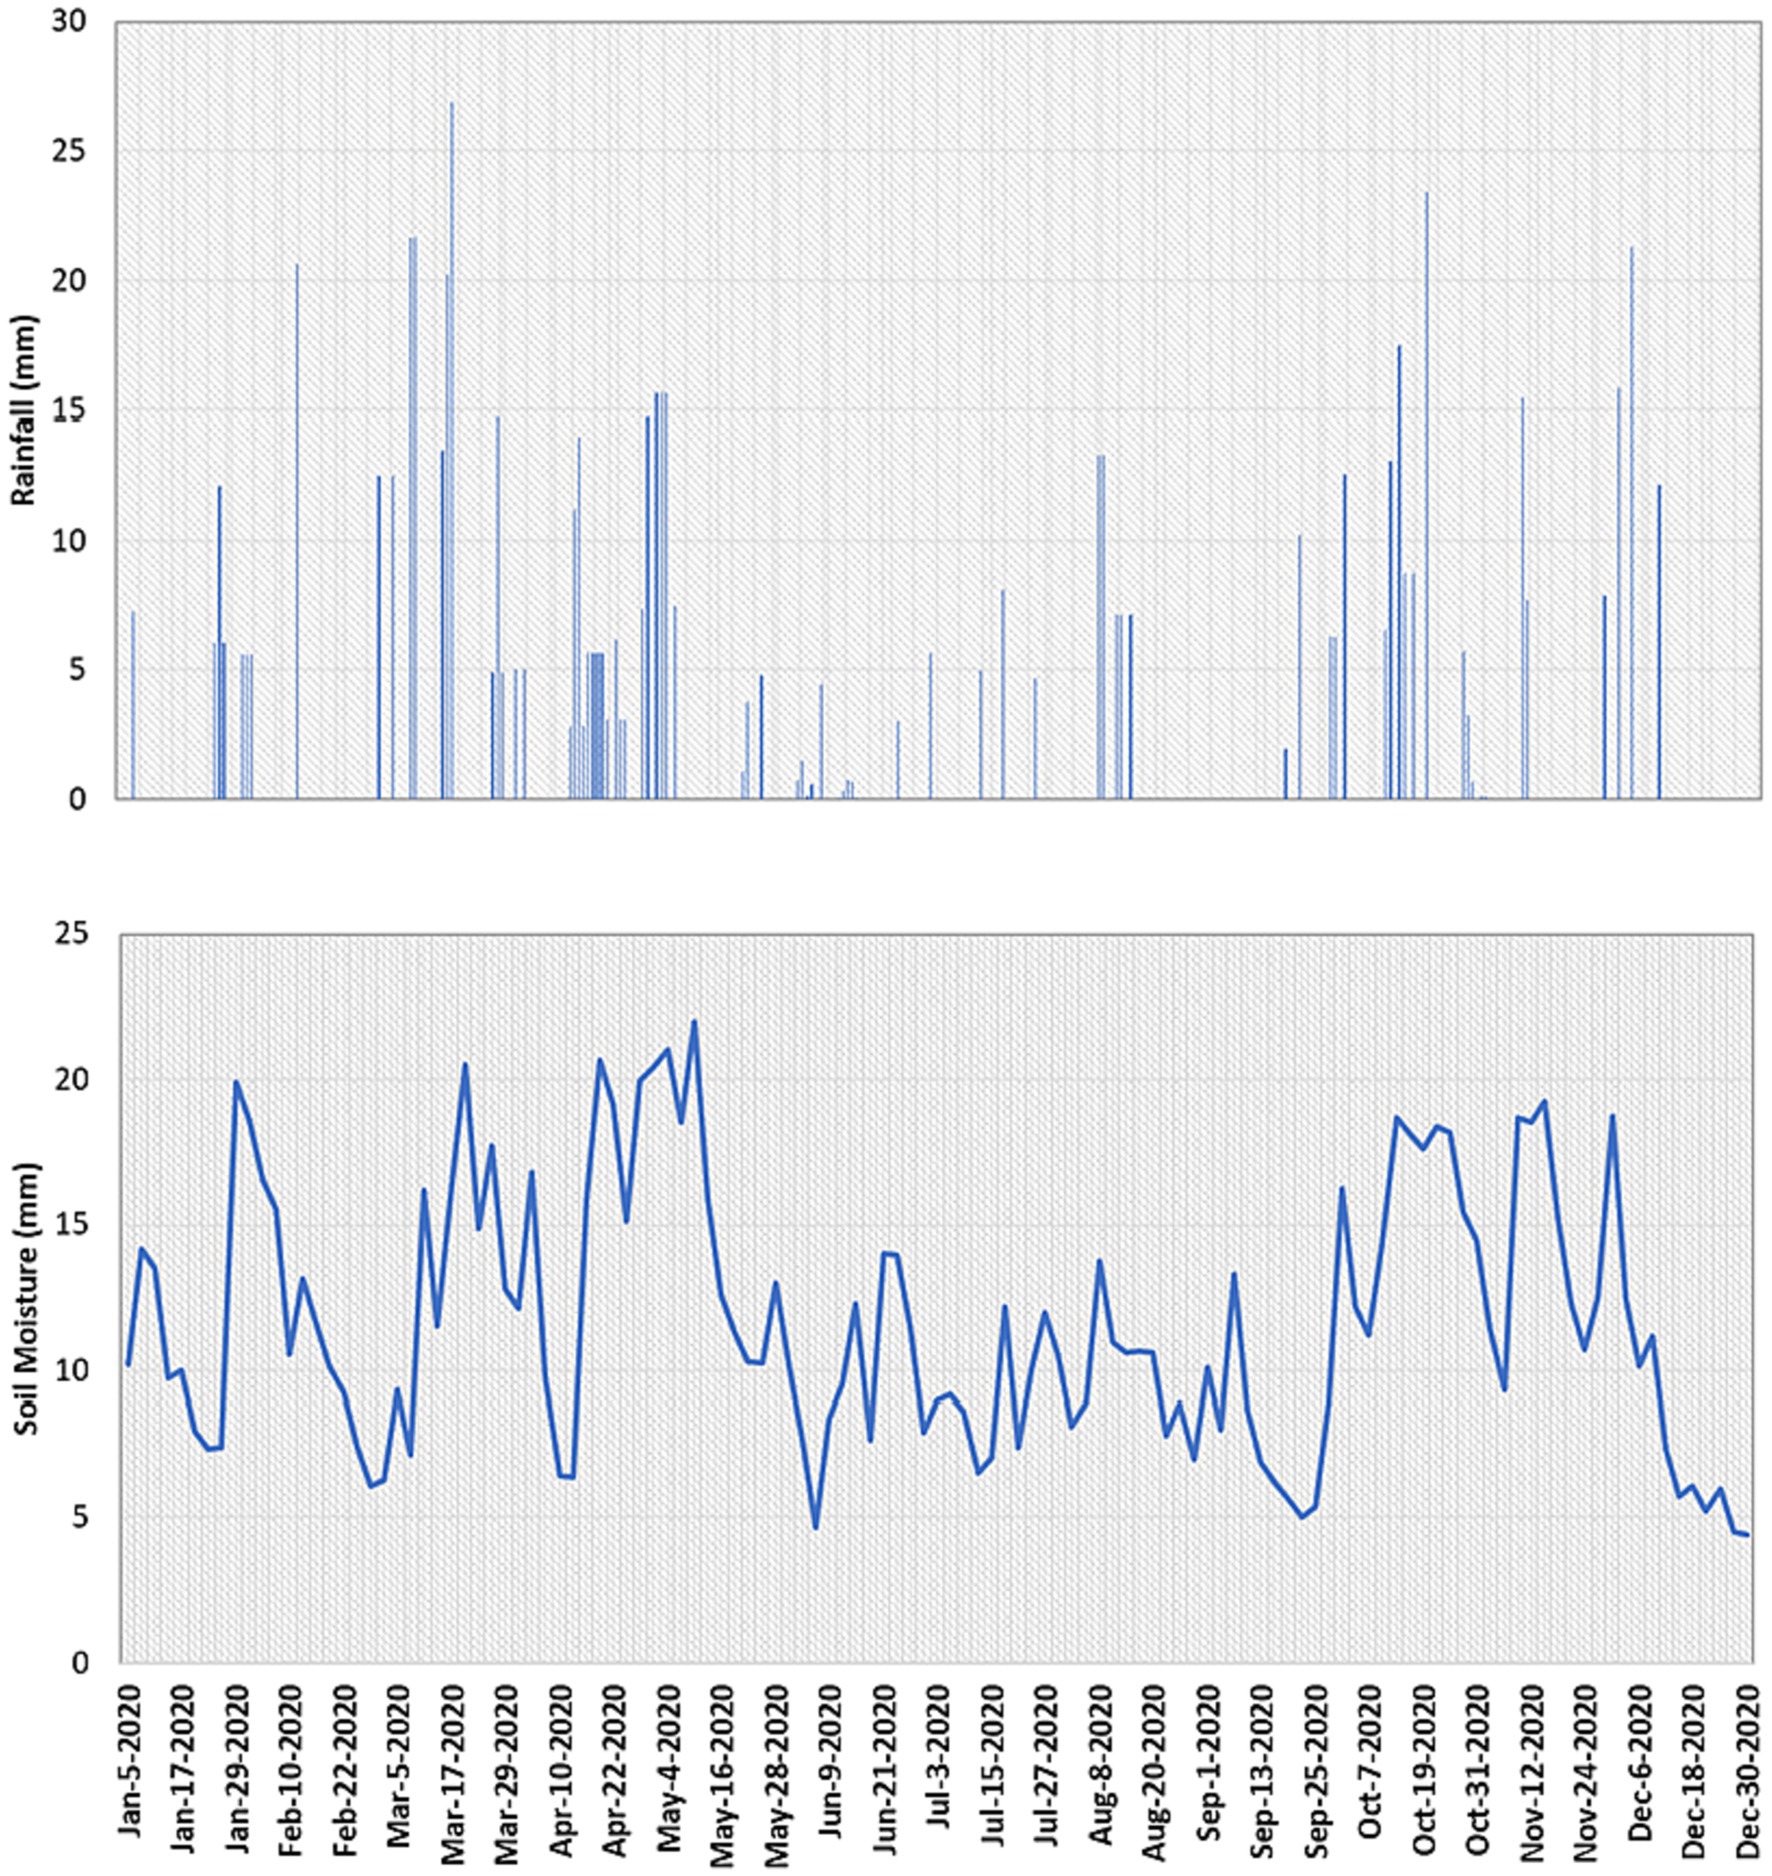
Figure 6. Rainfall events (top) and the corresponding trends of seasonal soil moisture pattern (bottom) in 2020 at Omo Gibe basin. The rainfall and soil moisture amount is the weighted average of the spatial distributed rainfall and soil moisture in the basin.
3.4 Soil moisture characteristics over landscapes
Soil moisture patterns were assessed for case study landscapes during the Belg (March to May) and Meher (June to September) rainfall seasons, taking into account intense flooding years (2016, 2018, and 2020) (Figures 7, 8). In the Omo Gibe basin, there was steadily increasing soil moisture during the short season. The increase in soil moisture is highly associated with the rainfall occurring in each landscape segment. The occurrence of sufficient soil moisture at lower landscapes is attributed due to the rainfall amount in the season and subsequent flood events from upstream landscapes. However the daily rainfall amount is small during major (Meher) season compared to the short (Belg) season, except slight increase after mid-September. The soil moisture recorded an average value of 10 mm and above. The soil moisture trends in the two seasons indicate that there is readily available soil moisture to enhance the recession farming. For instance, from March to May, the areas can receive sufficient soil moisture for crop recession farming lasting at least two and half months. Similarly, between June and December, the soil moisture in the lower landscapes was sufficient enough to sustain crop and pasture production.
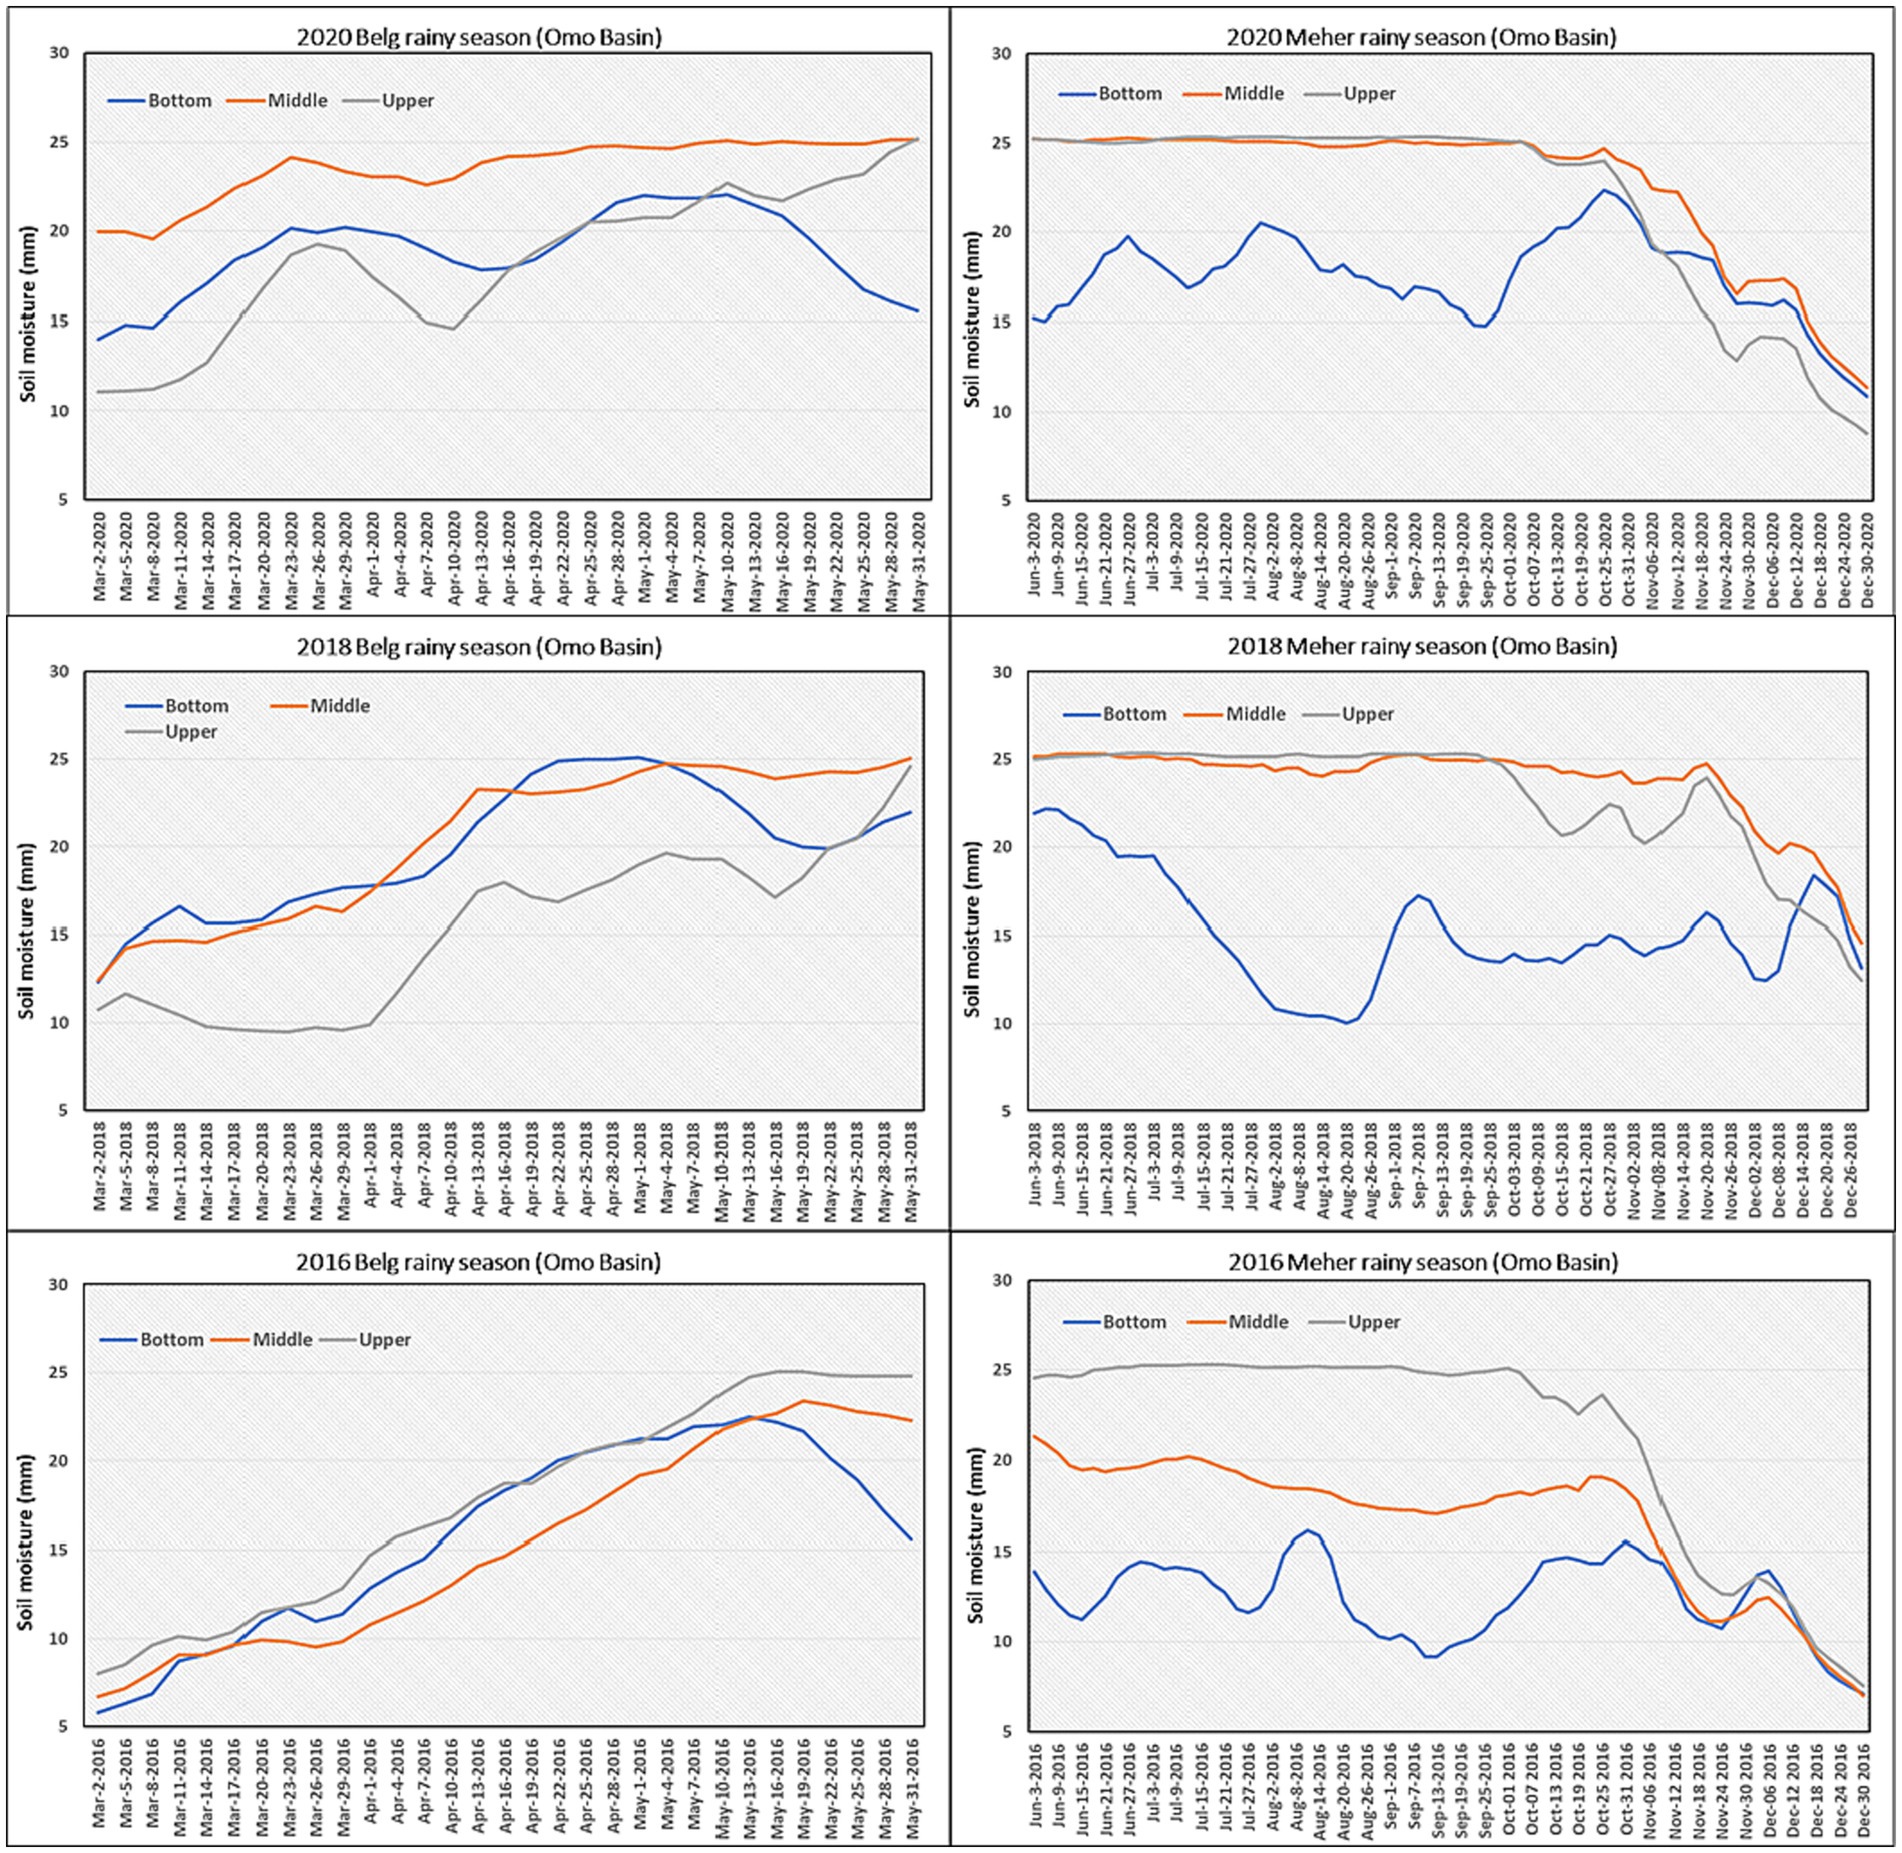
Figure 7. Soil moisture pattern of Omo Gibe river basin along three landscape zones during short (Belg) and major (Meher) rainy seasons.
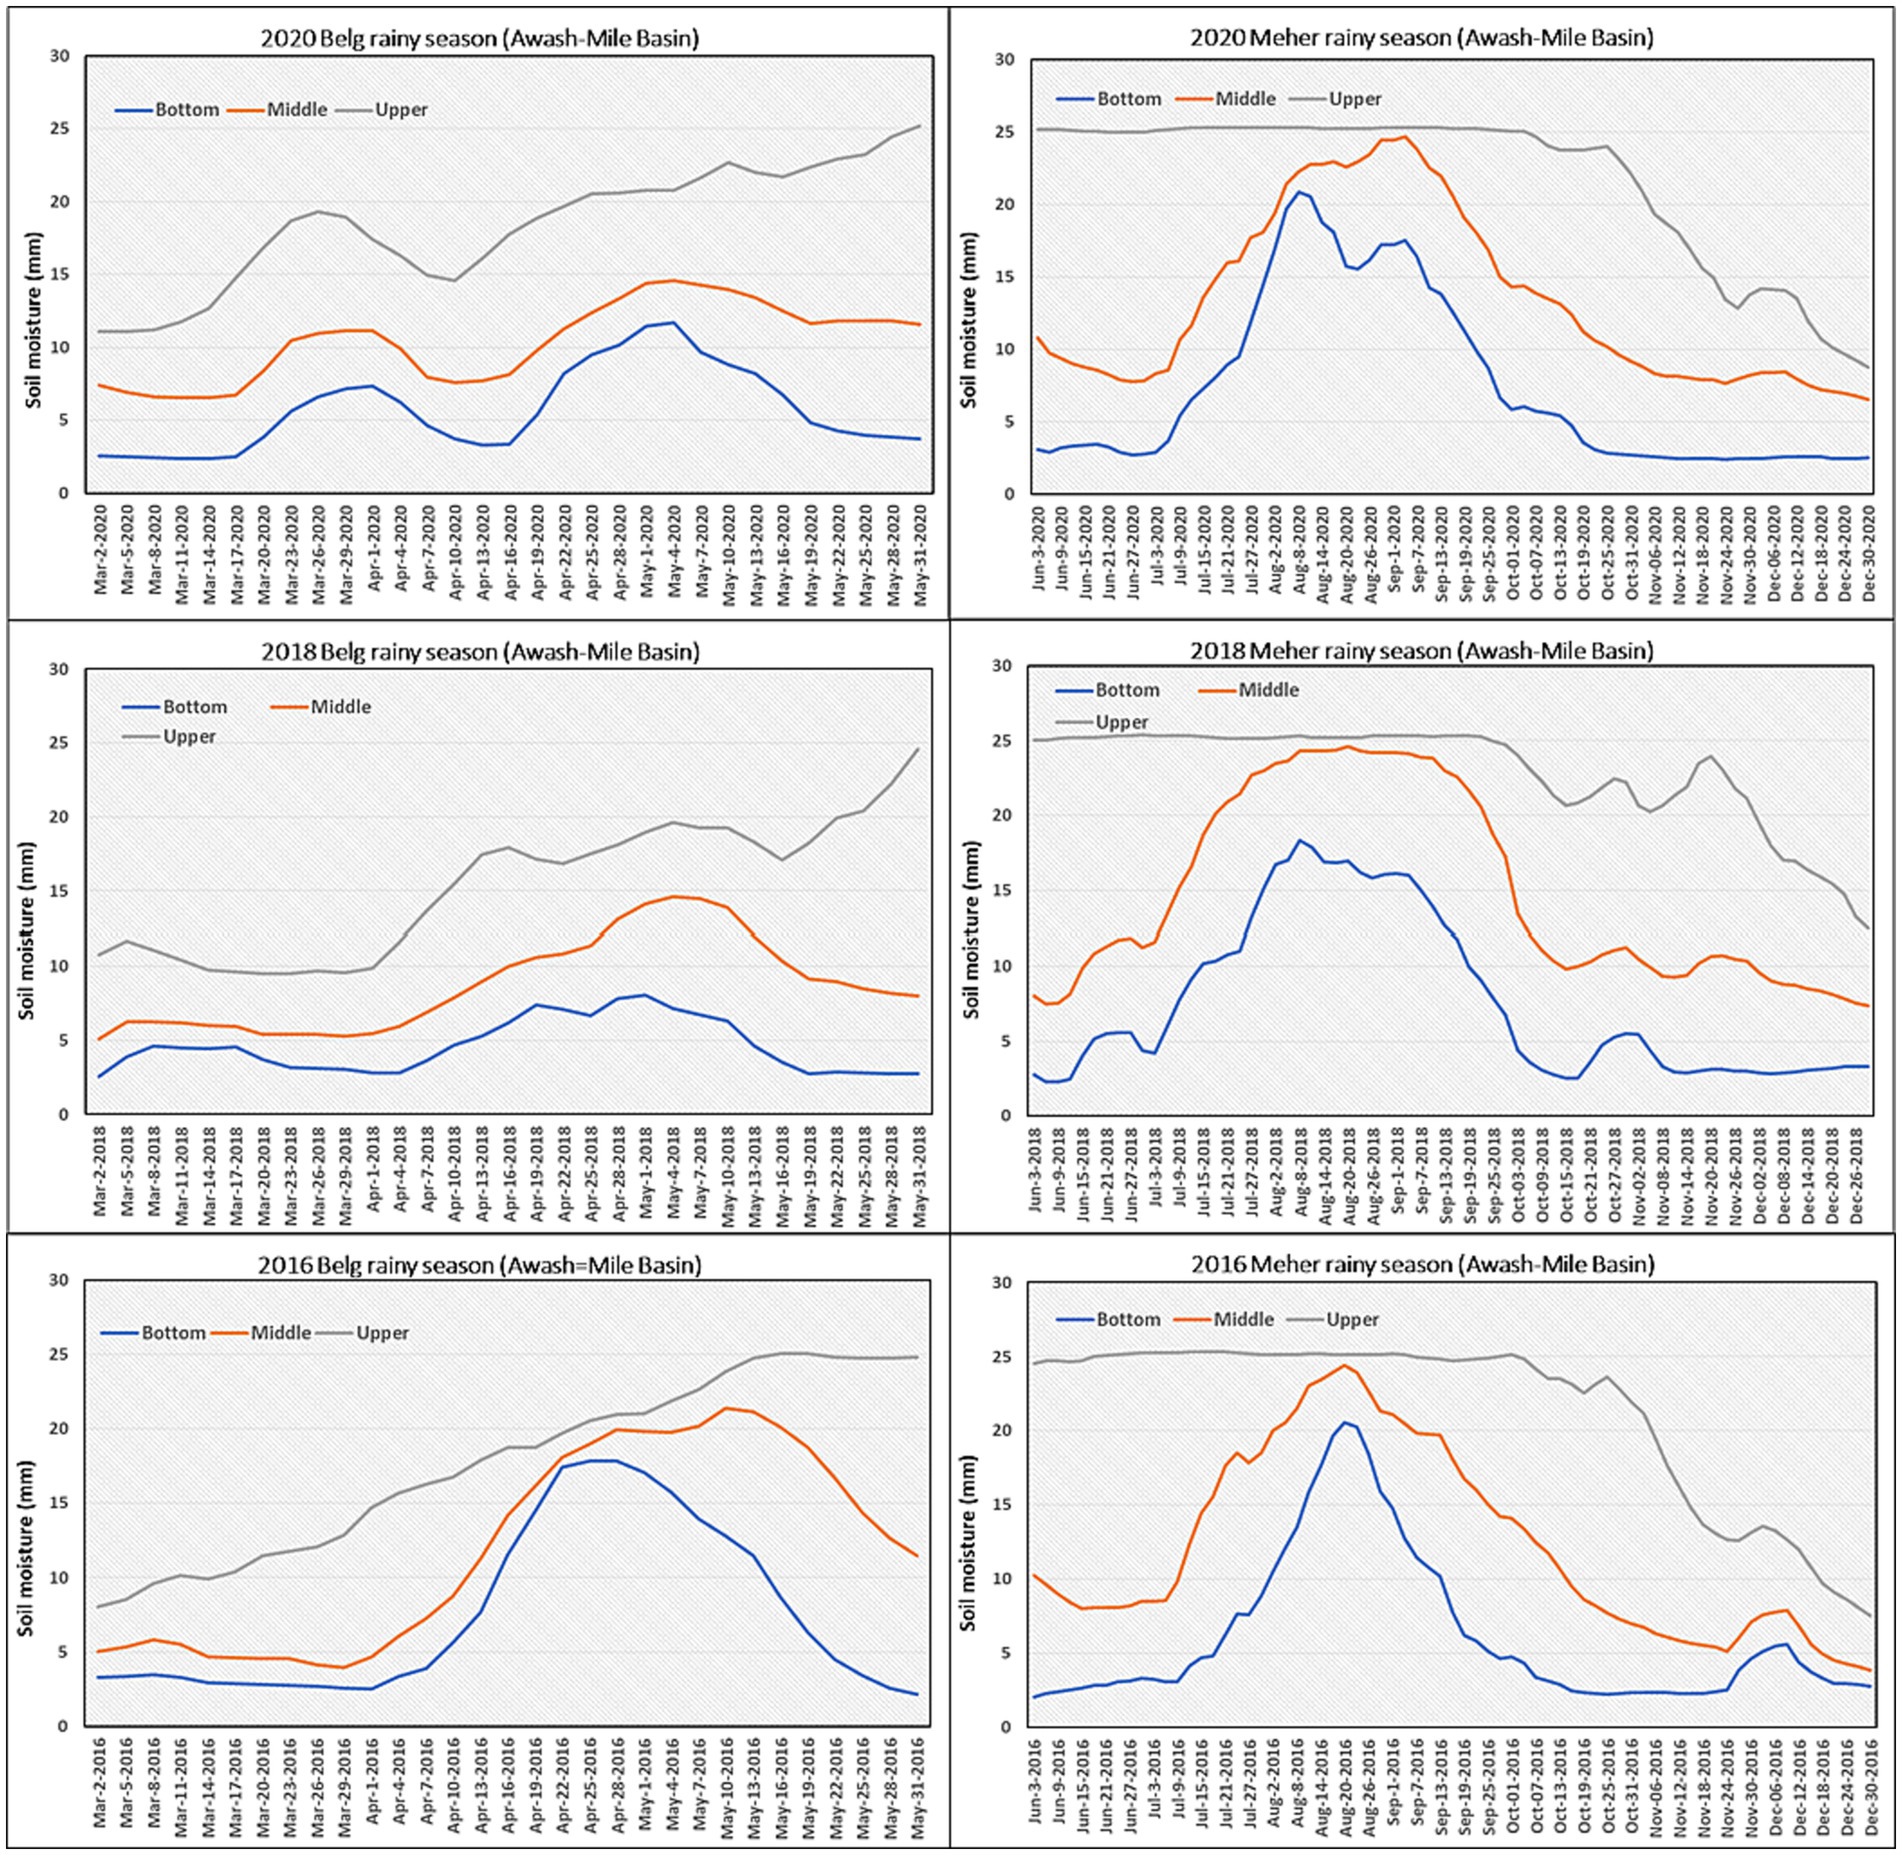
Figure 8. Soil moisture pattern of Mile sub-basin river basin along the three landscape zones during short [Belg (short)] and major [Meher (main)] rainy seasons.
In the Mile sub-basin, very distinct soil moisture trends were observed between the three landscape positions that imply strong interconnectivity of the landscapes. Although there is a considerable and consistent availability of soil moisture in lower landscapes between July and mid-October over several years, the occurrence of sufficient soil moisture from March to May is season-dependent. As a result, the Mile sub-basin landscape experiences more consistent soil moisture availability during the main rainy season, which could potentially support lowland agro-pastoral production systems and regreen the fragile and dry rangeland environment. This result is well supported by Gumma et al. (2022) who have reported and delineated potential flood farming opportunities in Afar.
In contrast, flood-based farming in the Omo Gibe basin can be more beneficial during the short rainy season and slightly extended between September and November whereas, there is a potential flood farming opportunity for dryland crops in the Mile sub-basin during the major rainy season, June to September. Since there are peak soil moisture weeks, caution has to be taken in the choice of crops that tolerate excess soil moisture conditions. Apart from its crop and livestock feed production opportunities, this seasonal soil moisture availability could help to improve ecosystem services such as mitigating the degraded environment and replenishing the subsurface water (Getnet et al., 2022).
3.5 Delineation of flood recession zones
Floods resulting from heavy rainfall and artificial drainage obstructions between upstream and downstream areas are regularly experienced in dry lowland areas. Rainfall and topographic conditions are key indicators of flood potential in geographically interconnected landscapes. In line with this, the two case study landscapes were initially characterized in terms of rainfall, elevation, and slope (Figure 9). The results revealed that the Omo Gibe basin experiences a high mean annual rainfall of 1,237 mm (318–2,228 mm) compared to the Mile sub-basin’s 686 mm (232–1,144 mm). Topographically, more flat land, which has less than 5% slope and is geographically interconnected to the adjacent highlands, exists in the Mile sub-basin than in the Omo Gibe sub-basin.
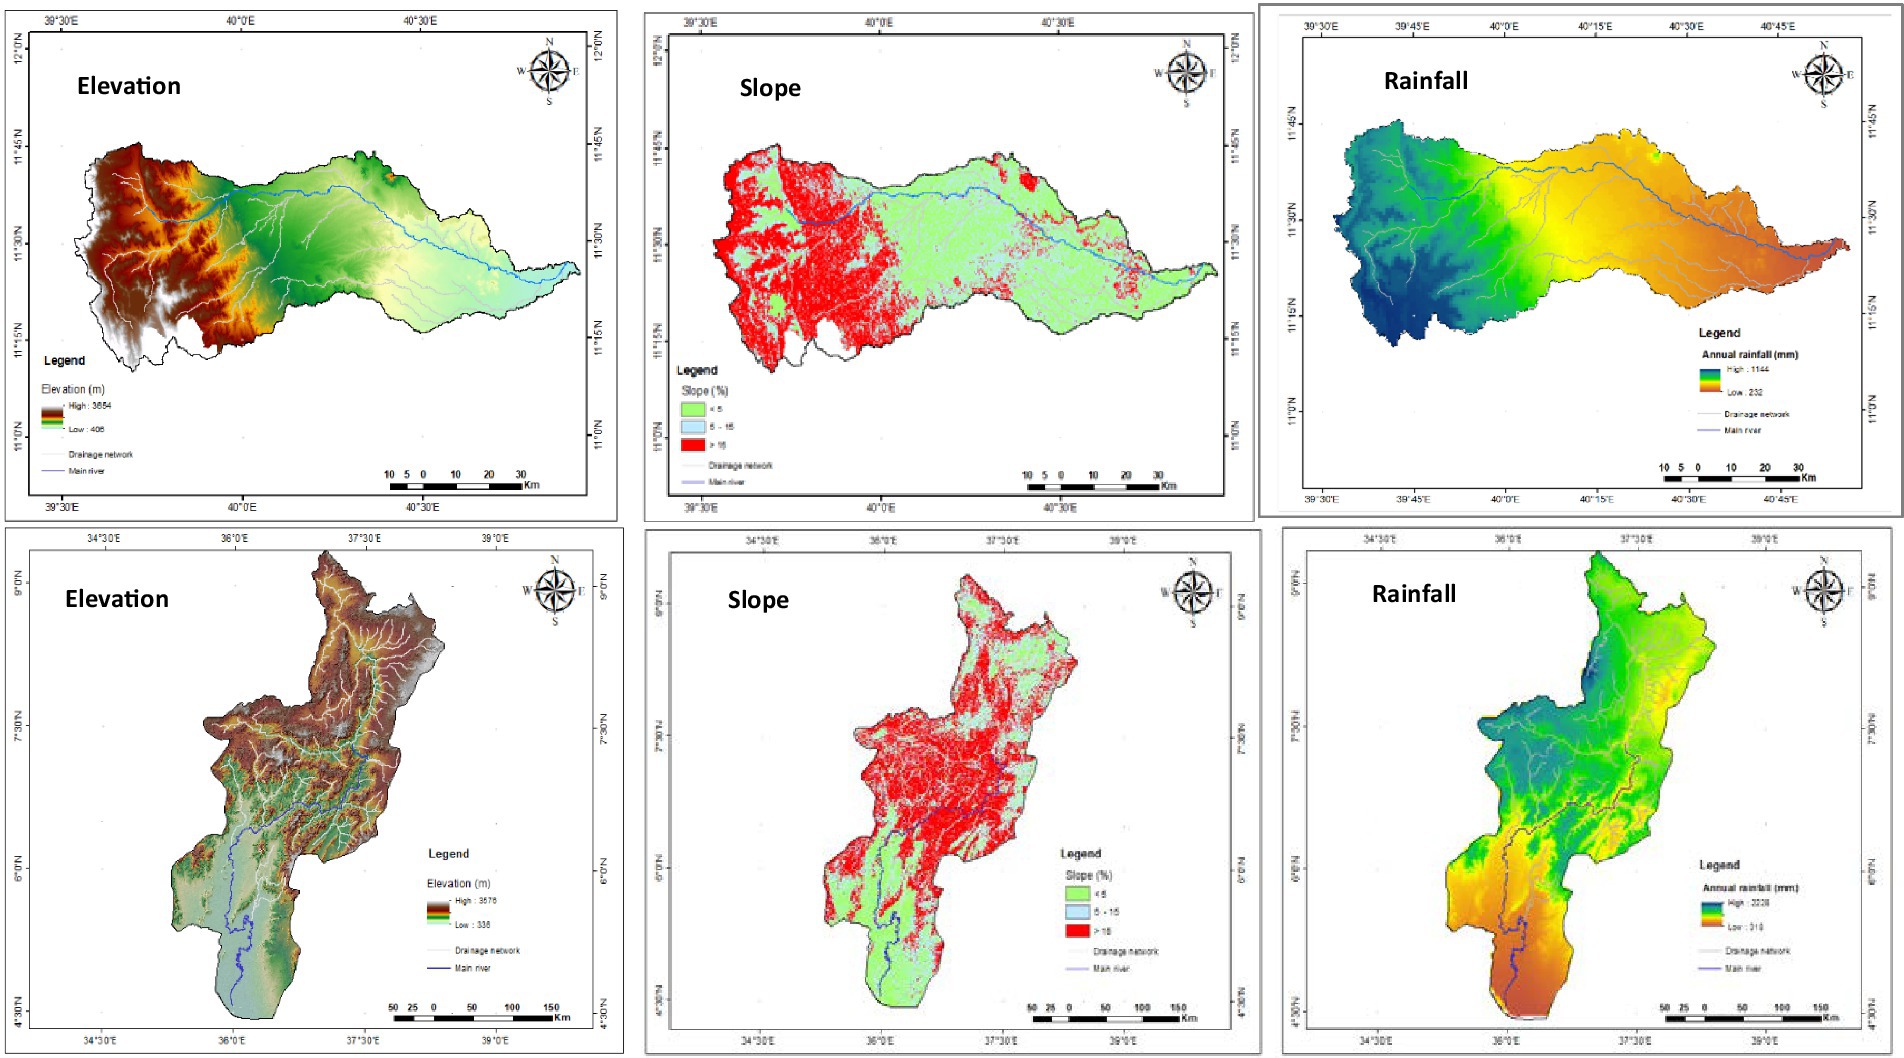
Figure 9. Elevation, slope, and rainfall characteristics of Mile sub-basin (upper lane) and Omo Gibe basin (lower lane).
Considering seasonal rainfall and soil moisture conditions before and after the flood events, slope and land cover of the two basins, flood analysis using remotely sensed derived data in the GEE platform was carried out to delineate potential flood zones for flood recession farming during major (Meher) and short (Belg) seasons. The results of flood and moisture trend analysis revealed that Omo Gibe basin has larger area coverage of flood zones for conducting recession farming in both Meher and Belg seasons than Mile sub-basin (Figure 10). Omo Gibe basin has 107,359 ha (1.4%) and 29,550 ha (0.4%) of land suited for flood recession farming during major (Meher) and short (Belg) rainy seasons, respectively. Whereas, 8,048 ha (1.44%) and 88 ha (0.02%) of suitable land for recession farming were obtained in the Mile sub-basin during Meher and Belg seasons, respectively.
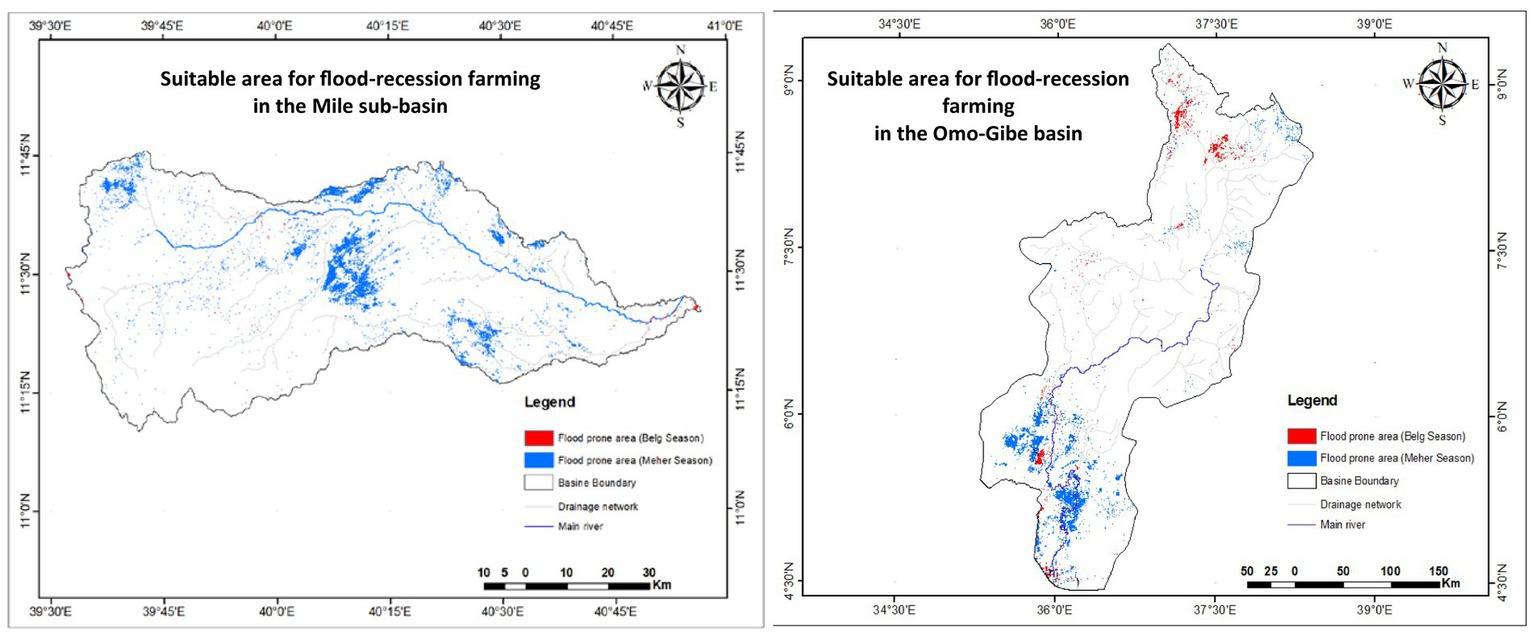
Figure 10. Maps show suitable areas for flood recession farming (out of the flood prone areas presented in Figure 2) using pre- and post flood change detection methods from satellite images in Mile sub-basin (Left) and Omo Gibe basin (Right). Blue and red colors represent areas suitable for flood based farming during major (Meher) and short (Belg) rainy seasons.
4 Discussions
4.1 Flood trends and drivers
The increase in the occurrence and frequency is evident from the historical flood records. These changes are also in line with changes in the stream channel forms (width, length, depth) and community perceived claims in the increase in flood discharge and frequency (Demissie et al., 2021). Demissie et al. (2021) indicated a sudden increase in discharge characterizes flash floods of small rivers, with high flow velocities in the range of 2–3 m s-1 with Froude numbers greater than 1. Furthermore, Meaza et al. (2018) reported increased flows (up to 732 m3 s-1) recorded in the largest rivers during the rainy seasons. Regarding the driving factors for increased flooding, high rainfall events, and variability is probably responsible for triggering flash floods (Borga et al., 2014; Douinot et al., 2016). Degefu and Bewket (2017) also reported the strong association of large scale climate signals like El Nino-Southern Oscillation (ENSO) with peak flood frequency. However, in the study landscape catchment degradation including land use conversion from forest, woodlands and shrublands to croplands and overgrazing of the landscapes are the most important causes (Demissie et al., 2021). The ecology in many parts of the highlands is considerably damaged. This damage is mainly attributable to the increasing human and livestock populations, cultivation on steep slopes, and deforestation (Kassawmar et al., 2018; Berihun et al., 2019).
4.2 Change detection approach for delineating flood recession zones
Flood-recession farming in the Omo and Mile case study landscapes is conditioned by the flood that is caused by heavy rainfall events associated with degraded upstream areas and replenishes the soil’s water reserve. But, due to many constraints, the occurrence of this flood is increasingly uncertain. However, a remotely sensed approach was adopted in the Google Earth Engine (GEE) platform using Sentinel-1A SAR technology integrated with multiple image processing functions to differentiate the inundated pixels from other pixels. A combination of change detection and the application of the GEE algorithm was used to detect floodplains (Bhatt and Rao, 2014; Pandey et al., 2022; Priyatna et al., 2023). The approach is capable of analyzing the spatio-temporal dynamics in floods and seasonal soil moisture and informing the practice of recession farming. The case study in this paper illustrates the potential of the landscape segments in the upstream and downstream configuration of the study landscapes to generate floods and provide opportunities of flood recession farming. The results underline the relevance of remotely sensed approaches (Pacetti et al., 2017) together with expert knowledge in assessing flood occurrence along the landscapes and delineating flood recession zones. The period of recession farming is dependent on the duration and level of soil moisture content needed and the type of crop. Overall, more than 10 mm soil moisture content was measured in the recession period which is adequate for the maturity of many crops. Pertaub and Stevenson (2019) reported the farming of a variety of crops under recession farming in Omo Valley and its potential to produce food that would last for much of the year. The sorghum yields under recession farming range from 0.5–0.8 tons ha-1 in Nyangatom, 1–2 tons ha-1 in Dassanech and 3.0 tons ha-1 in Kara (Pertaub and Stevenson, 2019). The annual flooding in the case study landscapes enhances the fertility of the soil by deposition of alluvials which favors the cultivation of several grain and fodder crops such as maize, sorghum, pearl millet, cowpea, mung bean, haricot bean and grass forages (Getnet et al., 2022) and increases the productivity of the natural pasture (Atanga and Tankpa, 2021; Atubiga and Atubiga, 2022). Based on that it is recommended that more attention should be given to flood recession farming to ensure all year-round farming in the areas as a measure of ensuring food security.
4.3 Implications of flood-based farming on integrated approach and current flood risk emergency responses
Natural flood risk reduction and utilizing flash floods to boost agricultural production requires more than just designing and financing the construction of engineering measures. It requires a concerted effort and dedicated finances to support coordinated efforts of stakeholders and communities at local and higher levels. Regarding planning and implementation of flood farming practices, lack of spatial and temporal flood occurrence information, lack of integrated and cross-sectoral participation across upstream and downstream landscape actors (Alemayehu, 2014; Castelli and Bresci, 2017), and lack of sustainable financing might be among the challenges of flood management. We learned from our study that there remains a need for advocacy and awareness that increases the implementation of flood farming practices to reduce the risk of flash floods and mitigate droughts. A proper understanding of flood occurrence and adaptability of the locations for flood farming will give ample opportunity in drought-prone areas to create resilient livestock and crop production systems. To this end, it is important to develop integrated floodwater governance with a clear flood management plan that involves the community at upper and lower landscapes (Castelli and Bresci, 2017; Demissie et al., 2021). The integrated flood management plan could have a range of purposes including interventions on agricultural production under dryland situations, rangeland management, livestock water supply, and restoring the soil and water resources. More importantly, economically flood farming is one of the potential entry points for creating an agricultural production value chain in the drought-affected drylands and upstream highlands. Thus, flood farming practices have the potential to influence local livelihoods, economies, and biophysical systems as it is the only source of water in arid and semi-arid environments (Alemayehu, 2014; Meaza et al., 2017; Desta et al., 2021). Thus, addressing the knowledge and evidence gap on the potentials of flood farming contributes to an informed decision toward unlocking the opportunities of flood farming to support livelihoods and economic development in the drought-prone areas, specifically in the Rift Valley areas, the Afar lowlands, South Omo valleys and the lowlands of Awash and Wabishebelle rivers.
Realizing the potential of flood farming implies a shift from a project-oriented approach to a process-oriented holistic approach based on the inclusion of stakeholders and communities in the process (Castelli and Bresci, 2017). Flood risk management should be responded to by formulating an integrated approach embedded in the context of integrated water resources management and land use planning. The uncertainty of the flood incidents or sudden nature of occurrence, the local scale of the event, and the very short flood concentration time should be taken into consideration when developing a risk mitigation and agronomic management strategy. Due to these special characteristics, flash floods are best managed by the local authorities with active and effective involvement of the people at risk who have experienced the local trends and nature of flood occurrence over the years. Thus, flood management measures and intensification practices should be encouraged and supported with regular communication and technical backup on the rainfall forecasts, flash flood inventories, and flood frequency information, and coordinated land management and land use plans which will enable it to scale up. Flood databases and decision support tools can further facilitate the decision-making and implementation of flood risk management as well as flood farming.
The current policy response to manage flood risks is through the preparation of an emergency response plan. Beyond the emergency flood response plan that aims to provide preparedness and emergency precautionary measures and develop an emergency response to flood-affected people, there is a need for an investment strategy to deal with flood farming opportunities within the overall integrated basin water management strategy that aims to unlock potentials of floodwater management and facilitate and coordinate the actions of different actors. The strategy to manage floods should be focused on providing the necessary technical, financial and legal framework for the competent authorities to play their legitimate role.
5 Conclusion
Assessing flood-induced risks and understanding flood-causing factors are the first steps in exploring adaptation alternatives in flood-prone locations so that flash floods can be turned into productive use using appropriate flood management strategies. In Ethiopia’s dry lowlands, floods are among the most frequent natural disasters. Since the 1990s, Ethiopia has experienced an incremental rise in the number of flood incidents and associated risks. The investigation of the frequency and geographic range of flood occurrences showed a dramatic increase in flood events over decades along with increased drought incidents. This is predominantly attributed to the interaction of various factors, including heavy rainfall, topography, land degradation – conversion of natural ecosystems to agricultural land uses, and changes in land use and geomorphologic conditions.
Remote sensing technologies using pre and post-flood detection approaches assist in quickly identifying areas for landscape flood occurrence. Combined application of GIS-based multi-criteria suitability analysis and remotely sensed satellite imageries were used for delineation of potential flood zones for flood recession farming. Specifically, the flood change detection approach for a predefined window period in the season proved to provide reliable flood recession distribution in a situation where there are scarce and uncertain flood records. Consequently, using a combination of remote sensing images and expert knowledge aids decision-makers, particularly subject-matter experts and irrigation planners, in introducing and demonstrating various types of flood-based farming as well as supporting informed decision-making on flood risk management strategies. The results insight into the access and availability of flood recession farming in the dry lowlands and smallholder farmers can take advantage of the fertile nature of the soil by engaging in the production of different types of food crops. It has the potential to ensure food security and livelihoods of the drought-affected communities. The study concludes that the full potential of flood recession farming and specific technological options can be assessed through comprehensive research about the different aspects of flood recession farming. Given the unpredictability of rainfed farming in the dry lowlands, there is a clear need for investment and adaptation of flood-based livelihood strategies and mainstreaming this practice in policy-making for drought management and sustainable food production in the dry lowlands.
Data availability statement
Publicly available datasets were analyzed in this study. This data can be found at: https://public.emdat.be/data.
Author contributions
GD: Conceptualization, Investigation, Methodology, Writing – original draft. GL: Data curation, Formal analysis, Methodology, Software, Writing – review & editing. MA: Data curation, Formal analysis, Methodology, Writing – review & editing. AM: Data curation, Investigation, Methodology, Writing – review & editing. BB: Data curation, Investigation, Methodology, Writing – review & editing.
Funding
The author(s) declare financial support was received for the research, authorship, and/or publication of this article. This work was partly financed under the CGIAR Research Program on Water, Land and Ecosystems (WLE) supported by Funders contributing to the CGIAR Trust Fund. For details visit https://wle.cgiar.org/donors. We also recognize the support of the EU RESET Plus Innovation Fund funded ELSAT project (Project Number: 11.0363/019) which cover staff time of lead and second authors.
Conflict of interest
The authors declare that the research was conducted in the absence of any commercial or financial relationships that could be construed as a potential conflict of interest.
Publisher’s note
All claims expressed in this article are solely those of the authors and do not necessarily represent those of their affiliated organizations, or those of the publisher, the editors and the reviewers. Any product that may be evaluated in this article, or claim that may be made by its manufacturer, is not guaranteed or endorsed by the publisher.
Supplementary material
The Supplementary material for this article can be found online at: https://www.frontiersin.org/articles/10.3389/fsufs.2024.1348094/full#supplementary-material
Footnotes
References
Alemayehu, T. (2014). Spate irrigation in Ethiopia: potential, development status and challenges. Flood-based farming for food security and adaption to climate change in Ethiopia: potential and challenges, Eds., Erkossa, T.; Hagos, F.; Lefore, N. 23–39. Colombo, Sri Lanka: International Water Management Institute (IWMI).
Amede, T., Van den Akker, E., Berdel, W., Keller, C., Tilahun, G., Dejen, A., et al. (2022). Facilitating livelihoods diversification through flood-based land restoration in pastoral systems of Afar, Ethiopia. Renew. Agric. Food Syst. 37, S43–S54. doi: 10.1017/s1742170520000058
Anose, F. A., Beketie, K. T., Zeleke, T. T., Ayal, D. Y., and Feyisa, G. L. (2021). Spatio-temporal hydro-climate variability in Omo-gibe river basin, Ethiopia. Climate Serv. 24:100277. doi: 10.1016/j.cliser.2021.100277
Atanga, R. A., and Tankpa, V. (2021). Climate change, flood disaster risk and food security Nexus in northern Ghana. Front. Sustain. Food Syst. 5:706721. doi: 10.3389/fsufs.2021.706721
Atubiga, J. A., and Atubiga, A. B. (2022). Analyzing food security through flood recession farming: a case study of the upper east region, Ghana. J. Soc. Sci. 18, 233–240. doi: 10.3844/jssp.2022.233.240
Balana, B. B., Sanfo, S., Barbier, B., Williams, T., and Kolavalli, S. (2019). Assessment of flood recession agriculture for food security in northern Ghana: an optimization modelling approach. Agric. Syst. 173, 536–543. doi: 10.1016/j.agsy.2019.03.021
Barvels, E., and Fensholt, R. (2021). Earth observation-based detectability of the effects of land management programmes to counter land degradation: a case study from the highlands of the Ethiopian plateau. Remote Sens. 13:1297. doi: 10.3390/rs13071297
Berihun, M. L., Tsunekawa, A., Haregeweyn, N., Meshesha, D. T., Adgo, E., Tsubo, M., et al. (2019). Hydrological responses to land use/land cover change and climate variability in contrasting agro-ecological environments of the upper Blue Nile basin, Ethiopia. Sci. Total Environ. 689, 347–365. doi: 10.1016/j.scitotenv.2019.06.338
Bhatt, C., and Rao, G. (2014). Ganga floods of 2010 in Uttar Pradesh, North India: a perspective analysis using satellite remote sensing data. Geomat. Nat. Haz. Risk 7, 747–763. doi: 10.1080/19475705.2014.949877
Borga, M., Stoffel, M., Marchi, L., Marra, F., and Jakob, M. (2014). Hydrogeomorphic response to extreme rainfall in headwater systems: flash floods and debris flows. Hydrology 518, 194–205. doi: 10.1016/j.jhydrol.2014.05.022
Bushira, K. M., and Abdule, Y. M. (2020). Spate irrigation potential assessment for Ethiopian watershed. J. Agric. Sci. 12:135. doi: 10.5539/jas.v12n7p135
Castelli, G., and Bresci, E. (2017). Participatory rural appraisal for diagnostic analysis of spate irrigation systems in Raya Valley, Ethiopia. J. Agric. Rural Develop. Tropics Subtropics 118, 129–139.
Chukalla, A. D., Haile, A. M., and Schultz, B. (2013). Optimum irrigation and pond operation to move away from exclusively rainfed agriculture: the Boru Dodota spate irrigation scheme, Ethiopia. Irrig. Sci. 31, 1091–1102. doi: 10.1007/s00271-012-0390-9
Dagnachew, M., Kebede, A., Moges, A., and Abebe, A. (2020). Land use land cover changes and its drivers in Gojeb River catchment, Omo Gibe Basin, Ethiopia. J. Agric. Environ. Int. Develop. 114, 33–56. doi: 10.12895/jaeid.20201.842
Davies, J., and Bennett, R. (2007). Livelihood adaptation to risk: constraints and opportunities for pastoral development in Ethiopia’s Afar region. J. Dev. Stud. 43, 490–511. doi: 10.1080/00220380701204422
Degefu, M. A., and Bewket, W. (2017). Variability, trends, and teleconnections of stream flows with large-scale climate signals in the Omo-Ghibe River basin, Ethiopia. Environ. Monit. Assess. 189:142. doi: 10.1007/s10661-017-5862-1
Demissie, B., Teklemariam, D., Haile, M., Meaza, H., Nyssen, J., Billi, P., et al. (2021). Flood hazard in a semi-closed basin in northern Ethiopia: impact and resilience. Geo-geography Environ. 8, 1–20. doi: 10.1002/geo2.100
Desta, G., Legesse, G., Amede, T., and Rooyen, Van F., & Whitbread, A. M. (2021). Unlocking the potential of flood farming to reduce flood risks and boost dryland production in Ethiopia. Colombo, Sri Lanka: CGIAR Research Program on Water, Land and Ecosystems (WLE). 10p.
Di Baldassarre, G., Martinez, F., Kalantari, Z., and Viglione, A. (2017). Drought and flood in the Anthropocene: feedback mechanisms in reservoir operation. Earth Syst. Dynam. 8, 225–233. doi: 10.5194/esd-8-225-2017
Douinot, A., Roux, H., Garambois, P.-A., Larnier, K., Labat, D., and Dartus, D. (2016). Accounting for rainfall systematic spatial variability in flash flood forecasting. J. Hydrol. 541, 359–370. doi: 10.1016/j.jhydrol.2015.08.024
ESA (2016). Land Cover CCI Product User Guide Version 2.0, Available at: https://2016africalandcover20m.esrin.esa.int/
FAO (2010). Agricultural based livelihood Systems in Drylands in the context of climate change: Inventory of adaptation practices and Technologies of Ethiopia. FAO: Rome.
Gain, A. K., Mondal, M. S., and Rahman, R. (2017, 2017). From flood control to water management: a journey of Bangladesh towards integrated water resources management. Water 9:55. doi: 10.3390/w9010055
Getnet, M., Amede, T., Tilahun, G., Legesse, G., Gumma, M. K., Abebe, H., et al. (2022). Water spreading weirs altering flood, nutrient distribution and crop productivity in upstream–downstream settings in dry lowlands of Afar, Ethiopia. Renew. Agric. Food Systems 37, S17–S27. doi: 10.1017/s1742170519000474
Gumma, M. K., Amede, T., Getnet, M., Pinjarla, B., Panjala, P., Legesse, G., et al. (2022). Assessing potential locations for flood-based farming using satellite imagery: a case study of Afar region, Ethiopia. Renew. Agric. Food Syst. 37, S28–S42. doi: 10.1017/s1742170519000516
Hagos, F., Erkossa, T., Lefore, N., and Langan, S. (2014). Spate irrigation and poverty in Ethiopia. In Erkossa Teklu, Hagos Fitsum, and Lefore Nicole (Eds.). Proceedings of the Workshop on Flood-based Farming for Food Security and Adaption to Climate Change in Ethiopia: Potential and Challenges, Adama, Ethiopia, Colombo, Sri Lanka: International Water Management Institute (IWMI).
Hostache, R., Matgen, P., and Wagner, W. (2012). Change detection approaches for flood extent mapping: how to select the most adequate reference image from online archives? Int. J. Appl. Earth Obs. Geoinf. 19, 205–213. doi: 10.1016/j.jag.2012.05.003 https://public.emdat.be/data.
IPCC, (2022) Climate change 2022: impacts, adaptation, and vulnerability. Contribution of working group II to the sixth assessment report of the intergovernmental panel on climate change. Cambridge University Press. Cambridge University Press, Cambridge, UK and New York, NY, USA, 3056.
Kassawmar, T., Zeleke, G., Bantider, A., Gessesse, G. D., and Abraha, L. (2018). A synoptic land change assessment of Ethiopia's Rainfed agricultural area for evidence-based agricultural ecosystem management. Heliyon 4:e00914. doi: 10.1016/j.heliyon.2018.e00914
Liman Harou, I., Whitney, C., Kung’u, J., and Luedeling, E. (2020). Mapping flood-based farming systems with Bayesian networks. Land 9:369. doi: 10.3390/land9100369
Mamo, S., Berhanu, B., and Melesse, A. M. (2019). “Chapter 29 - Historical flood events and hydrological extremes in Ethiopia” in Extreme hydrology and climate variability. eds. M. Assefa, W. Abtew, and G. Senay, Elsevier, 379–384.
Matanó, A., De Ruiter, M. C., Koehler, J., Ward, P. J., Van, A. F., and Loon, A. F. (2022). Caught between extremes: understanding human-water interactions during drought-to-flood events in the horn of Africa. Earths Future. 10:e2022EF002747. doi: 10.1029/2022EF002747
MEA (2005). A report of the millennium ecosystem assessment. Ecosystems and Human Well-Being. Island Press: Washington DC.
Meaza, H., Frankl, A., Poesen, J., Zenebe, A., Deckers, J., Van Eetvelde, V., et al. (2017). Natural resource opportunities and challenges for rural development in marginal grabens–the state of the art with implications for the Rift Valley system in Ethiopia. J. Arid Environ. 147, 1–16. doi: 10.1016/j.jaridenv.2017.08.003
Meaza, H., Frankl, A., Poesen, J., Zenebe, A., Van Eetvelde, V., Demissie, B., et al. (2018). Water balance variability in the confined Aba’ala limestone graben of the western margin of the Danakil depression, northern Ethiopia. Hydrol. Sci. J. 63, 957–977. doi: 10.1080/02626667.2018.1466055
Mekdaschi Studer, R., and Liniger, H. (2013). Water harvesting: Guidelines to good practice, Bern: Centre for Development and Environment (CDE).
Motsumi, S., Magole, L., and Kgathi, D. (2012). Indigenous knowledge and land use policy: implications for livelihoods of flood recession farming communities in the Okavango Delta, Botswana. Physics Chem. Earth 50-52, 185–195. doi: 10.1016/j.pce.2012.09.013
Müller-Mahn, D., Rettberg, S., and Getachew, G. (2010). Pathways and dead ends of pastoral development among the Afar and Karrayu in Ethiopia. Eur. J. Dev. Res. 22, 660–677. doi: 10.1057/ejdr.2010.37
Nederveen, S., Mengistu, A., Van Steenbergen, F., Alamirew, T., and Geleta, Y. (2011). Flood based farming practices in Ethiopia: Status and potential (overview paper #3) Spate Irrigation Network. (Overview Paper #3), Avaliable at: www.spate-irrigation.org
OCHA (2007) Situation update no. 2: flooding in Ethiopia. Available at: https://reliefweb.int/report/ethiopia/ocha-situation-update-no-2-flooding-ethiopia-1-31-aug-2007
Orkodjo, T. P., Berisavijevic, G. K., and Abagale, F. K. (2022). Impact of climate change on future availability of water for irrigation and hydropower generation in the Omo-Gibe Basin of Ethiopia. Journal of hydrology. Reg. Stud. 44:101254. doi: 10.1016/j.ejrh.2022.101254
Pacetti, T., Caporali, E., and Rulli, M. C. (2017). Floods and food security: a method to estimate the effect of inundation on crops availability. Adv. Water Resour. 110, 494–504. doi: 10.1016/j.advwatres.2017.06.019
Pandey, A. C., Kaushik, K., and Parida, B. R. (2022). Google earth engine for large-scale flood mapping using SAR data and impact assessment on agriculture and population of ganga-Brahmaputra Basin. Sustain. For. 14:4210. doi: 10.3390/su14074210
Pertaub, T., Tekle, D., and Stevenson,. (2019). Flood Retreat Agriculture in the Lower Omo Valley, Ethiopia (Briefing Note #3). In Omo-Turkana Research Network Briefing Notes, edited by J. Hodbod & E. G. J. Stevenson. East Lansing, MI: OTuRN.
Priyatna, M., Wijaya, S. K., Khomarudin, M. R., Yulianto, F., Nugroho, G., Afgatiani, P. M., et al. (2023). The use of multi-sensor satellite imagery to analyze flood events and land cover changes using change detection and machine learning techniques in the Barito watershed. J. Degraded and Mining Lands Manag. 10, 4073–4080. doi: 10.15243/jdmlm.2023.102.4073
Singh, R., Patel, S. K., Tiwari, A. K., and Singh, G. S. (2021). Assessment of flood recession farming for livelihood provision, food security and environmental sustainability in the Ganga River basin. Curr. Res. Environment. Sustain. 3, 100038–100016. doi: 10.1016/j.crsust.2021.100038
Steenbergen, F. V., Haile, A. M., Alemehayu, T., Alamirew, T., and Geleta, Y. (2011). Status and potential of spate irrigation in Ethiopia. Water Resour. Manag. 25, 1899–1913. doi: 10.1007/s11269-011-9780-7
Tamagnone, P., Comino, E., and Rosso, M. (2020). Rainwater harvesting techniques as an adaptation strategy for flood mitigation. J. Hydrol. 586:124880. doi: 10.1016/j.jhydrol.2020.124880
Tariq, M. A. U. R., Farooq, R., and van de Giesen, N. (2020). A critical review of flood risk management and the selection of suitable measures. Appl. Sci. 10:8752. doi: 10.3390/app10238752
Varisco, D. M. (1983). Sayl andghayl: the ecology of water allocation in Yemen. Hum. Ecol. 11, 365–383. doi: 10.1007/bf00892245
Wudineh, A. F., Moges, S., and Kidanewold, B. B. (2022). Flood generation mechanisms and potential drivers of flood in Wabi-Shebele River basin, Ethiopia. Nat. Resour. 13, 38–51. doi: 10.4236/nr.2022.131003
Keywords: flood occurrence, multi-criteria analysis, landscape segments, recession farming, Ethiopia
Citation: Desta G, Legesse G, Ahmed MI, Muluneh A and Birhanu B (2024) Assessing flood risks and exploring opportunities for flood-based farming in the dry lowlands of Ethiopia. Front. Sustain. Food Syst. 8:1348094. doi: 10.3389/fsufs.2024.1348094
Edited by:
Giulio Castelli, University of Florence, ItalyReviewed by:
Hailemariam Meaza Gebregergs, Mekelle University, EthiopiaLivia Serrao, University of Trento, Italy
Copyright © 2024 Desta, Legesse, Ahmed, Muluneh and Birhanu. This is an open-access article distributed under the terms of the Creative Commons Attribution License (CC BY). The use, distribution or reproduction in other forums is permitted, provided the original author(s) and the copyright owner(s) are credited and that the original publication in this journal is cited, in accordance with accepted academic practice. No use, distribution or reproduction is permitted which does not comply with these terms.
*Correspondence: Gizaw Desta, Z2l6YXcuZGVzdGFAaWNyaXNhdC5vcmc=
 Gizaw Desta
 Gizachew Legesse
 Mohammed Irshad Ahmed
 Alemayehu Muluneh
 Belete Birhanu