 Luz Astrid Pulido-Herrera*
 Claudia Sepulveda
 Jose Antonio Jiménez
 Juan Eduardo Betanzos Simon
 Edwin Pérez-Sánchez
 Larry Niño†
- Tropical Agricultural Research and Higher Education Center (CATIE), Turrialba, Costa Rica
This study investigates the “land sharing” versus “land sparing” dilemma in the context of extensive cattle ranching in Chiapas, Mexico. Employing a comprehensive methodology that synthesizes various systems and uses a normalized matrix for relative priority assessment, we identified several geographic variables as zoning criteria. These criteria encompass the hemerobic index, proximity to structurally intact forests, fire frequency, and terrain slope, aiming to identify areas optimal for conservation. Our results highlight properties with high conservation potential and propose two distinct connectivity scenarios, both excluding currently preserved areas. The analysis focuses on the interplay between connectivity and hemeroby, identifying human-influenced regions within the landscape and emphasizing the importance of tree conservation in agricultural contexts for biodiversity preservation. By tackling the “land sharing” vs. “land sparing” debate, the study underscores the necessity of sustainable livestock practices and the critical role of connectivity in ranching landscapes for ecosystem preservation.
1 Introduction
Land-use change significantly impacts biodiversity conservation and ecosystem service provision. Studies highlight traditional cattle ranching’s role in the extensive deforestation of tropical dry forests across Latin America, with less than 1.7% of intact forest remaining, thereby threatening biodiversity and ecosystem services within decades due to livestock production expansion (Tscharntke et al., 2005; Harvey et al., 2011; Tobar-López et al., 2019). Although agriculture and livestock are pivotal for food security and economic contributions, notably with livestock farming accounting for 40% of GDP contributions in some countries (Pezo et al., 2019), these sectors are also major biodiversity pressures, leading to deforestation and adversely affecting ecological processes. Daszak et al. (2020) underscores the insufficiency of current actions to adapt to and mitigate climate change’s effects on biodiversity and ecosystem services, emphasizing the need for harmonization between human requirements and biodiversity conservation.
Ecosystem-based Adaptation (EbA) emerges as a promising approach for addressing the impacts of climate change by capitalizing on biodiversity and ecosystem services. Through practices such as silvopastoral systems, EbA fosters ecological and functional connectivity within productive landscapes, simultaneously bolstering climate resilience while conserving biodiversity and facilitating sustainable territorial planning (Harvey et al., 2017). Complementing this approach, the discourse surrounding “Land Sparing” versus “Land Sharing” offers an alternative perspective on sustainability within these landscapes. While “Land Sparing” advocates for the segregation of conservation and production areas to optimize both outputs and conservation efforts, “Land Sharing” seeks to integrate these areas, promoting biodiversity-friendly agricultural practices (Perfecto and Vandermeer, 2012; Fischer et al., 2014). Hemeroby, serving as a crucial ordinal indicator for assessing the impacts of land-use changes on natural systems, plays a vital role in understanding the repercussions of unsustainable land-use intensification on biodiversity and ecosystem services. Insights garnered from hemeroby assessments contribute significantly to informed decision-making for sustainable planning within productive landscapes (Fu et al., 2006; Walz and Stein, 2009; Fehrenbach et al., 2015).
This study aims to evaluate the integration of a connectivity model within an EbA strategy in livestock landscapes, focusing on optimizing environmental services and biodiversity management amidst livestock-induced impacts. We propose developing this model using a multi-criteria evaluation framed within a Hierarchical Analysis Process and a Geographic Information System, addressing criteria such as fire frequency, deforestation, forest degradation, land slope, infrastructure layout, and human intervention (hemeroby). By weighing these criteria based on expert judgment, we aim to identify areas suitable for biodiversity conservation, enhancing forest connectivity and ecological restoration in livestock landscapes.
Finally, this research seeks to address how ecological connectivity models can be integrated into EbA strategies in livestock landscapes, the role of hemeroby as a central indicator in capturing landscape complexities, and its contribution to the Land Sparing” and “Land Sharing debate for biodiversity conservation.
2 Materials and methods
2.1 Area of study
The state of Chiapas, located in southeastern Mexico, is bordered to the north by Tabasco, to the east and south by the Republic of Guatemala, and to the west by the Pacific Ocean, Oaxaca, and Veracruz. With a territorial area of 75,634 km2, it represents 3.8% of the national territory (Figure 1). Within Chiapas, there are the geographical provinces of the Southern Gulf Coastal Plain, the Sierra Madre de Chiapas, and the Central American Cordillera. The terrain is mostly composed of mountain ranges, which include sedimentary rocks. The southeast of the state is home to the highest altitudes, highlighting the Mozotal hill with 3,050 meters above sea level and the Tacaná volcano with 3,284 meters above sea level, on the border with Guatemala. In the central region there are valleys and canyons, such as the Sumidero Canyon, crossed by the Grijalva River. To the north, there is a ridge with plains shared with Tabasco, while to the south there is a coastal plain formed by fluvial and marine deposits. Climatically, 54% of Chiapas has a warm humid climate, 40% warm sub-humid, 3% humid temperate and the remaining 3% sub-humid temperate.
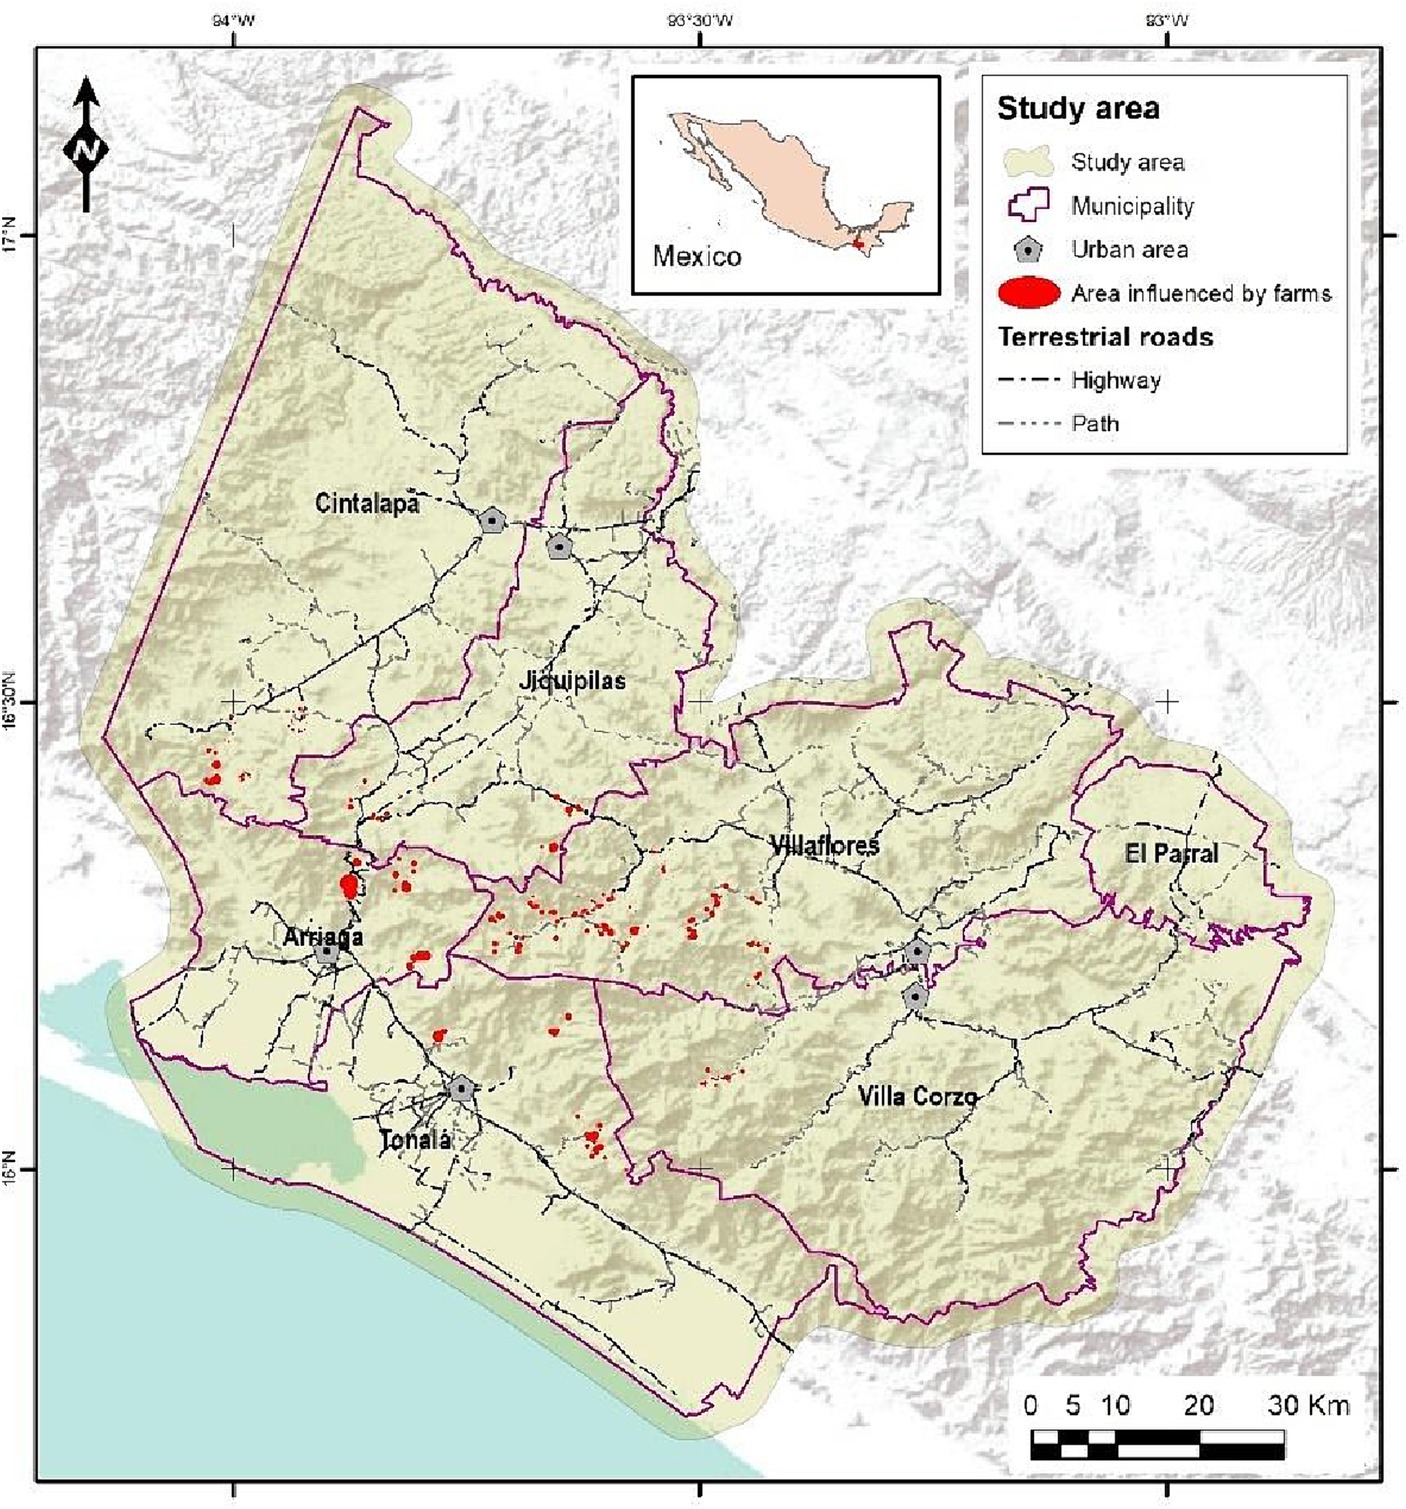
Figure 1. Geographic overview of Chiapas, Mexico: the study area in context.
In terms of land use, agriculture and pastures predominate. Irrigated and rainfed agriculture covers 10.7% of the state (804,000 ha); pastures account for 19.2% (1,438,279 ha). Temperate forests in a good state of conservation occupy 14% (1,049,500 ha), while those with some degree of alteration cover 4.5% (341,150 ha). Mesophilic mountain forests, of great biological importance, comprise 5.4% (405,280 ha), and mosaics of these forests with secondary vegetation, 3.5% (262,000 ha). Tropical forests in good condition and with some degree of alteration have similar percentages, 19.3% (1,444,000 ha) and 19.2% (1,439,000 ha), respectively (Jiménez Trujillo et al., 2020).
In Chiapas, cattle ranching is a predominant agricultural activity, particularly characterized by extensive dual-purpose cattle production. The region’s cattle ranching occupies approximately 3,059,531 hectares, averaging 8.6 hectares per production unit. This area accounts for 6.37% of the national territory dedicated to such activity, with 88.5% of these units classified as small-scale operations (INEGI, 2013).
However, this economic activity contributes significantly to environmental challenges in the region. It is a major driver of deforestation and tree cover loss, leading to a myriad of ecological issues. These include diminished soil fertility, heightened greenhouse gas emissions, reduced water availability and quality, and a decrease in biodiversity. Such impacts are particularly pronounced in areas experiencing the expansion of the livestock frontier (Jiménez Trujillo et al., 2020).
2.2 Methodological structure
This study employs an integrated systems modeling framework where the outputs from certain systems serve as inputs or parameters for others, as illustrated in Figure 2. The methodology unfolds in distinct phases, beginning with the identification and definition of geographic variables for zoning purposes. The objective is to delineate areas eligible for conservation efforts. The selected zoning criteria encompass the hemerobic index, proximity to structurally preserved forests, fire frequency over the past decade, and terrain slope. Additionally, terrestrial communication routes and land cover data feed into the hemerobic index calculation.
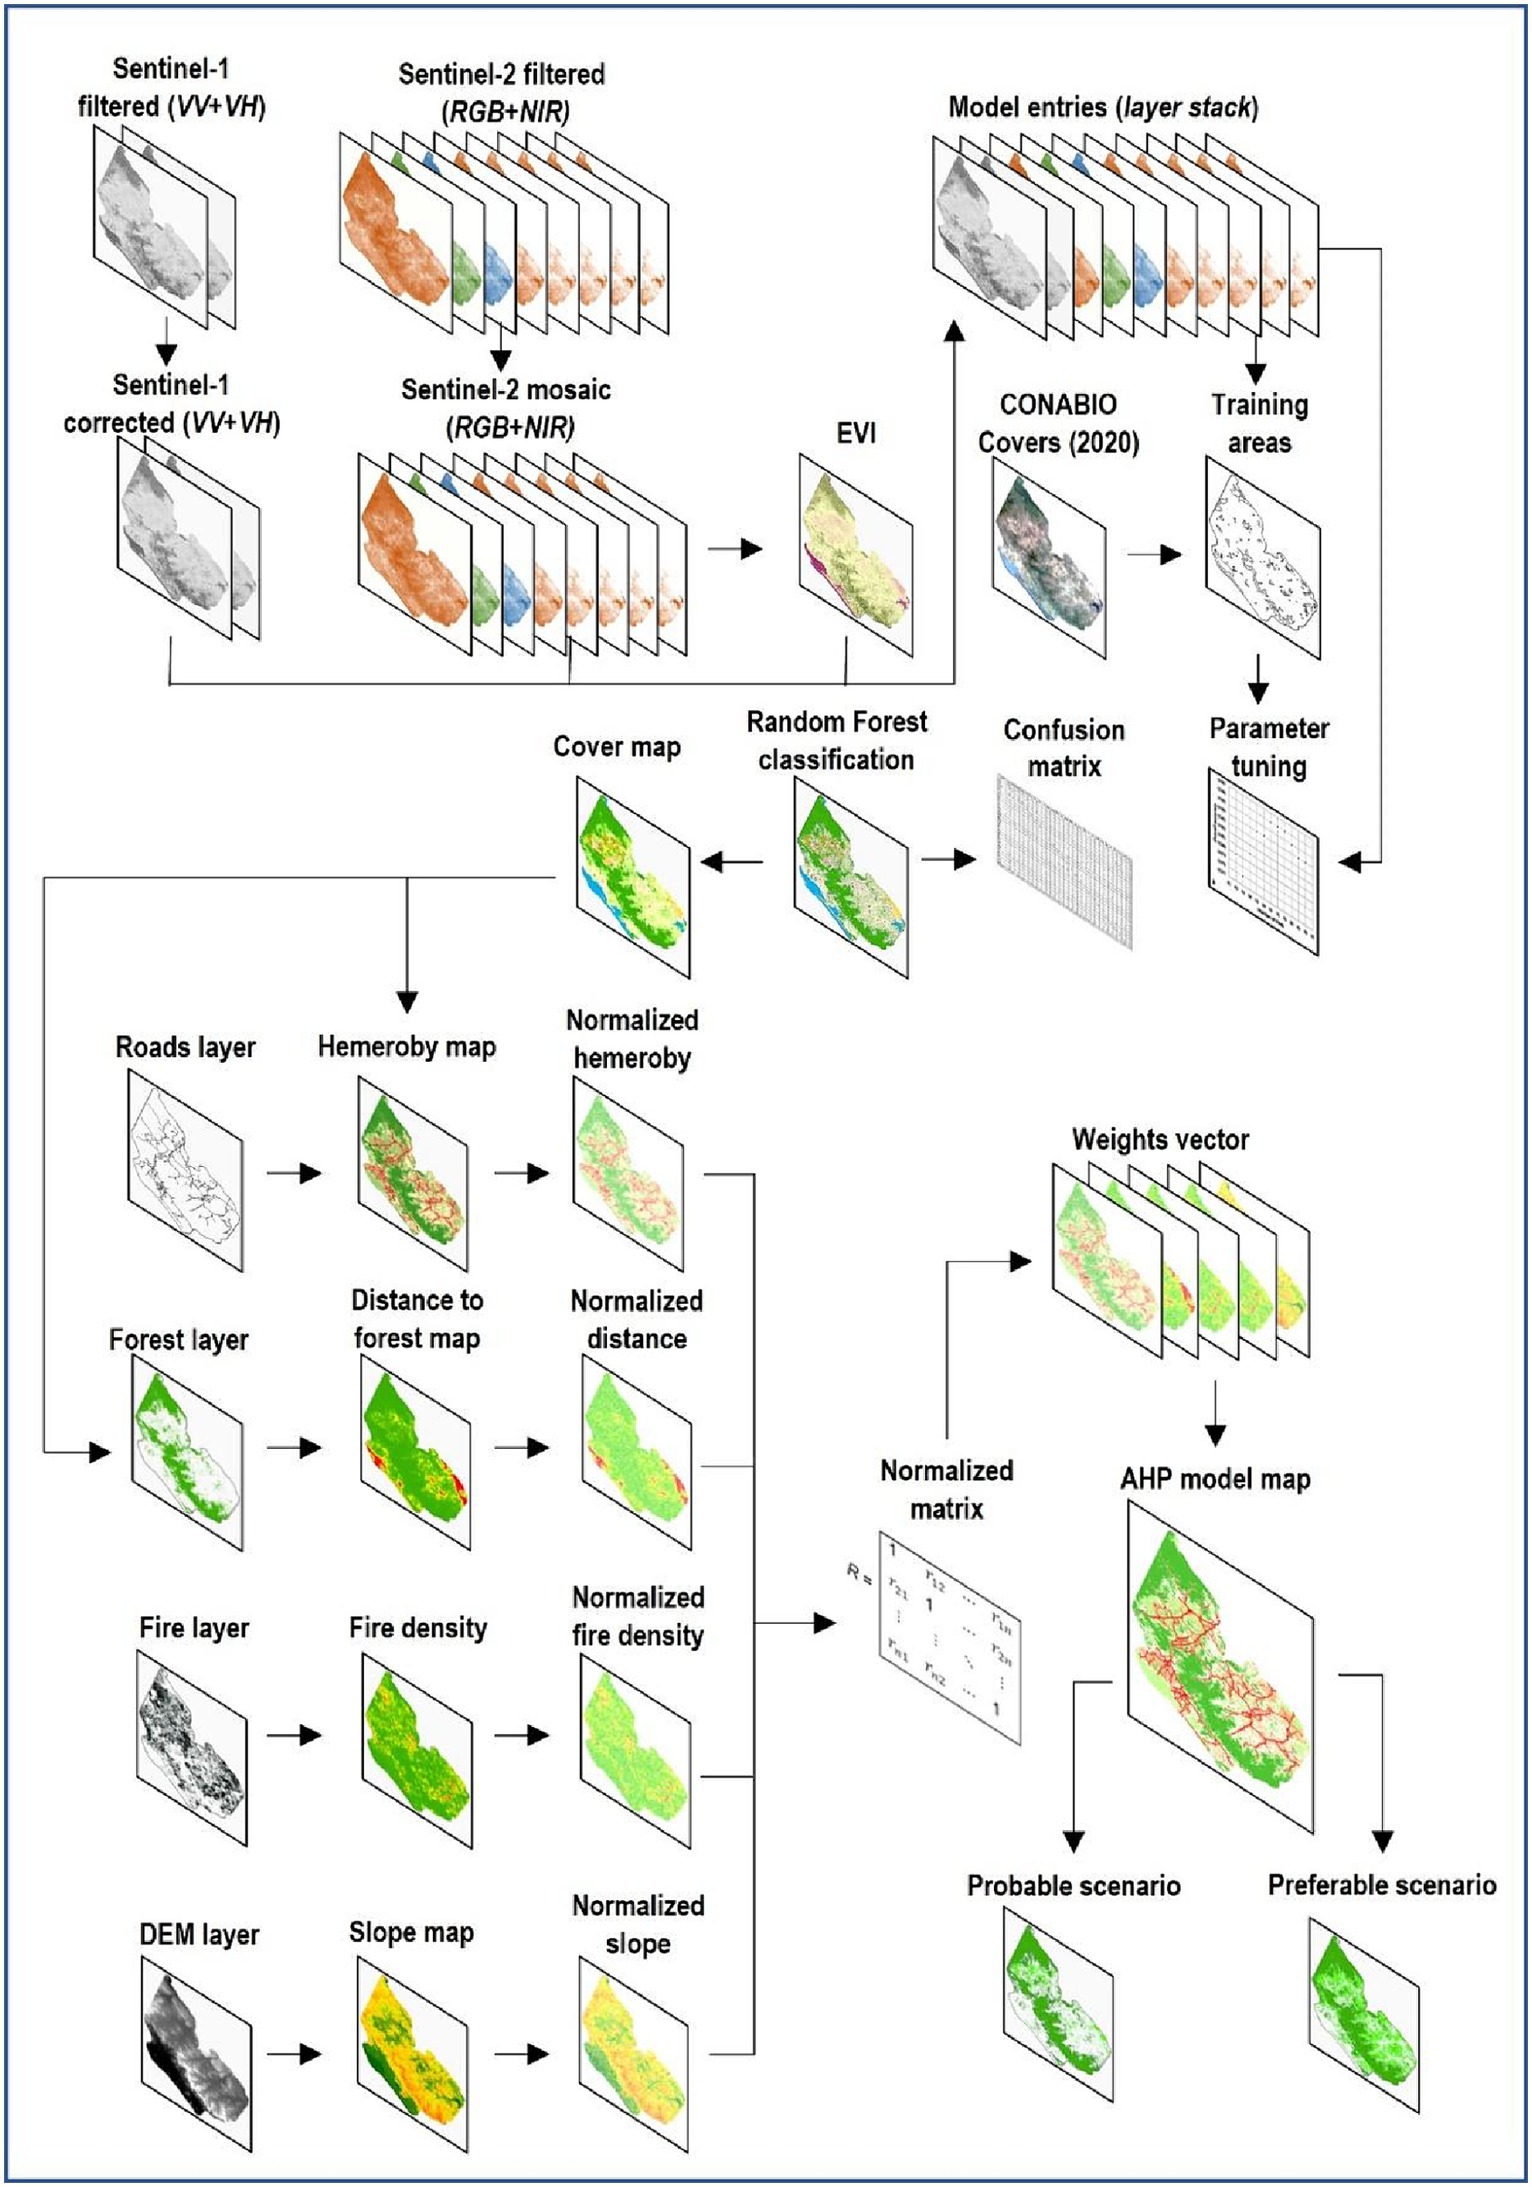
Figure 2. Methodological structure based on integrative modeling approach.
Land cover classification leverages satellite imagery through the Random Forest algorithm, a machine learning technique that constructs multiple decision trees on random data subsets with bootstrapping. This approach, known for balancing high variance against low bias, finalizes classifications based on the averaged probabilities across all trees, thereby enhancing model robustness against extreme values and reducing the risk of overfitting (Pal, 2005; Akar and Güngör, 2012; Belgiu and Dragut, 2016).
The processing of satellite images from Sentinel-1 and -2 datasets was conducted on the Google Earth Engine (GEE) platform. GEE, known for its vast storage of remote sensing data and its capability for automated parallel computing, significantly outperforms local processing by accessing a planetary-scale repository of imagery. This platform supports a broad array of functions, which users can apply flexibly using programming languages such as Python or JavaScript. The methodological choice of GEE leverages its computational efficiency and the diverse functionality it offers for remote sensing analysis, aligning with established protocols and enhancing the reproducibility of the classification process (Reiche et al., 2016; Gorelick et al., 2017; Kumar and Mutanga, 2018; Mutanga and Kumar, 2019).
The methodology for zoning potential conservation areas initiated with the transformation of geographic variables into a raster format, standardizing values between zero and one to ensure a uniform, dimensionless numerical scale conducive to comparison and integration based on conservation relevance. Subsequently, a Multicriteria Assessment (MCA), comprising a suite of techniques to aid in the evaluation process, was employed to weigh different criteria according to the researcher’s preferences and construct scenarios that mitigate uncertainty in assessing alternatives. Within this framework, the Hierarchical Analysis Process (AHP) was utilized, a method within the MCA that facilitates the inclusion of various aspects into the conservation zoning model by recognizing the interrelations among alternatives in relation to a set of attributes. The AHP methodology unfolded in three stages: first, the modeling or structuring of relevant variables for the evaluation to ensure comprehensive consideration of pertinent factors; second, the assessment or incorporation of evaluators’ preferences through established judgments in a matrix of paired comparisons, permitting a systematic evaluation of criteria based on their significance; and third, the prioritization or calculation of the weight vector of the criteria considered in the evaluation. This weight vector was subsequently integrated into the geographic criteria in raster format, aiming to extract pertinent information for the zoning of conservation areas, following guidance from foundational works in the fields of MCA and AHP (Jiménez, 2002; Fülöp, 2004; Gómez and Barredo, 2006; Malczewski, 2006).
2.2.1 Ground covers
The coverage cartographic layer was generated based on a classification of optical and Synthetic Aperture Radar (SAR) images obtained during 2021, implementing the Random Forest technique. The optical images corresponded to a mosaic of Sentinel-2 products (MSI Level 2A collection, available from GEE) at a spatial resolution of 10–20 m. The visual spectrum (RGB) and near-infrared (NIR) bands were included, which contain the most relevant information to differentiate the types of vegetation cover (Singh, 1987; Baeza et al., 2006; Serbin and Townsend, 2020). A function based on the SCL band was implemented, which allowed masking shadows and clouds to later calculate a mosaic with the average of the pixel values. A vegetation index was calculated and added to the model, corresponding to the Enhanced Vegetation Index (EVI), which allowed to partially suppress the influence of lighting, terrain heterogeneity and soil reflectance on the image data (Singh, 1987; Baeza et al., 2006; Tsai et al., 2018; Serbin and Townsend, 2020).
The SAR images implemented during the coverage classification corresponded to Sentinel-1 products (S1 GRD collection, available in GEE) at a spatial resolution of 10 m. VV and VH polarizations were included in interferometric wide-band mode and descending orbit. Speckel correction was performed with the average of the pixel values (Raed et al., 1996) with the average focal length filter at 50 m to increase the accuracy of the image classification (Waske and Braun, 2009). The bands from the optical and SAR sensors were co-registered with respect to the lowest spatial resolution mosaic Sentinel-2 and stacked into a single multi-sensor image.
The performance of a supervised classification of satellite imagery depends on both the robustness of the classifier and the quality of the training samples, which unambiguously represent the land cover categories on the multi-sensor image (Olofsson et al., 2014). The assignment of training areas considered the spectral amplitude of the multi-sensor image and the landscape representativeness of the classes, since the balanced samples between the thematic categories present greater accuracy by reducing the error of commission and omission of the underrepresented classes (Jin et al., 2014; Tsai et al., 2018). The pixels included in the training areas were divided into 70% for the Random Forest classification and the remaining 30% for the calculation of the modeling accuracy (Azzari and Lobell, 2017), which ensured the statistical independence of the validation data and limited the overestimation of the model’s accuracy (Congalton, 1991; Belgiu and Dragut, 2016). The training areas of the cover model were obtained by visual adjustment on the multisensor image of representative areas adapted from the land cover cartographic layer of Mexico at 30 m (CONABIO, 2020).
In theory, it is assumed that a higher number of decision trees in the Random Forest classification increases the fit of the model, although it also increases the processing time linearly, which justifies the calculation of the optimal number of decision trees (Probst et al., 2019). In addition to the number of decision trees, the classifiers were configured with the sampling variables defined by the multi-sensor image and the vectors representing the training areas, whose thematic attributes should be set as integers. The samples were then divided into 70% for training and 30% for accuracy estimation, through an iterative function in a sequence of every 10 trees until 140 trees were completed. Finally, predictions were made according to the sampling variable and the sequential parameters of the trees, with which the accuracy was plotted according to the number of trees in the classification.
The final Random Forest classification and error calculation were configured with the same training variables and the number of decision trees that obtained greater accuracy during parameter tuning (Pal, 2005). The results of the classification were exported in raster format at a spatial scale like the multisensor image (20 m), the thematic raster obtained was generalized to a scale of one ha, grouping pixels in homogeneous areas, and replacing values with less representativeness for those of adjacent groups that reached the defined area. Generalization includes the processes of “thematic aggregation,” which aggregates adjacent similar pixels and creates larger pixels, according to a majority focal filter applied to a moving window of predefined size (2×2); “clump” identifies groups of contiguous pixels of each thematic class, based on an attribute table assigned in the previous process and according to a number of adjacent pixels (8); “Eliminate” iteratively performs a focal majority filter, so that the values of pixels grouped in areas smaller than one ha are replaced by values of surrounding areas that meet the required number of pixels.
The estimation of the error associated with the classification was calculated with the same training variables of the Random Forest models, together with the number of previously defined classification trees (Pal, 2005). The training areas were divided in a similar way to the parameterization procedures (70–30%). Accuracy estimates included the confounding matrix, overall model accuracy, and Kappa coefficient. The confusion matrix is a square array, whose diagonal indicates the pixels that were correctly classified within the sample (Liu et al., 2007) This matrix allows you to evaluate the overall accuracy of the classification, calculated as the ratio between the number of correctly classified pixels and the total number of pixels in the sample. The Kappa coefficient is defined as an estimate of the difference between the accuracy achieved by the automatic classifier and a random classification (Rosenfield and Fitzpatrick-Lins, 1986; Plourde and Congalton, 2003).
2.2.2 Hemeroby index
The hemeroby index is a comprehensive estimator of human impact on natural systems, considering the relationship between current land use and vegetation that would exist in the absence of anthropogenic disturbances (Steinhardt et al., 1999; Peterseil et al., 2004; Niño et al., 2023). This indicator shows imbalances between conservation areas and land use planning, points out areas that require measures to improve the environmental conditions of the landscape and highlights the progress of environmental management (Walz and Stein, 2009). These imbalances could indicate the differential use of ecosystem services in densely populated areas, whose demand is proportional to the established human population and where natural areas are transformed to maximize certain services to the detriment of others (Schneiders and Müller, 2017).
To map the geographical distribution of hemerobic levels, we integrated geographic information from the BioPaSOS project’s road mapping (INEGI, 2019). This process involved creating buffers of 0.4 km around main roads and 0.2 km around secondary roads, represented by line-type vectors. The buffers were overlaid onto the land use layer to delineate areas of influence adjacent to roads. Subsequently, the nominal classes resulting from this cartographic integration were converted into numerical ordinal categories, ranging from zero (representing the lowest degree of human intervention) to one (indicating the highest degree of human intervention) (Table 1). This reclassification was based on the compilation and assignment of hemeroby levels to different land uses, following the methodologies proposed by Steinhardt et al. (1999) and Walz and Stein (2009).
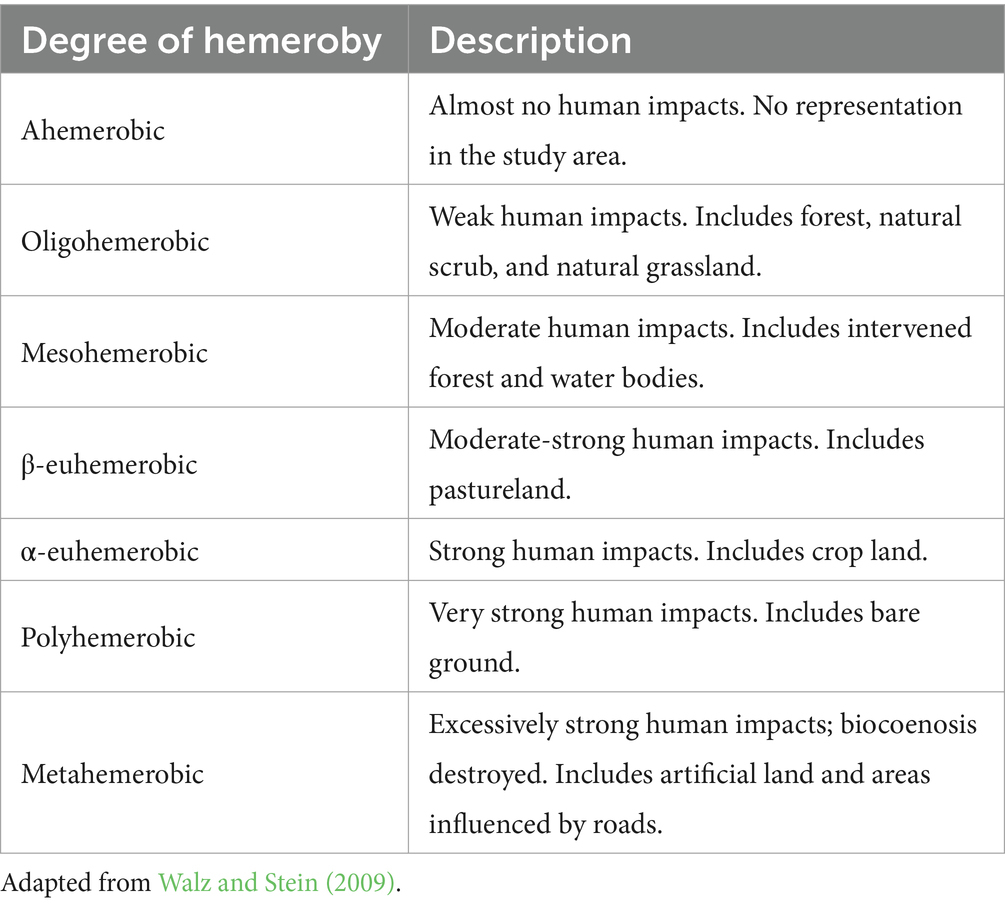
Table 1. Levels of Hemeroby based on reclassification of coverage and areas influenced by roads.
2.2.3 Distance to forests, fire hotspots and slope.
The criterion of distance to forests was established with the creation of a raster, whose values correspond to the Euclidean distance between the center of each pixel and the nearest area covered by structurally preserved forest, according to the cartographic layer of covers. It was assumed that the greater the distance from the forest, the lower the suitability of a locality for conservation, so the inverse of the data of the magnitude of the distance was calculated, to later be transformed to a scale of zero to one through a linear function.
The criterion of fire outbreaks was calculated according to the frequency of these events, recorded in point-type vector format, by the Fire Information for Resource Management System (FIRMS) program, in the study area during the last decade (NASA, 2023). A raster with the count of events within a radius of 1 km was created by implementing a kernel function to obtain a smoothed image. Since the inverse relationship of fire density with the conservation fitness of a locality was assumed, the inverse of the data was calculated before transforming the variable to the scale of zero to one.
The slope criterion of the terrain was calculated based on a Digital Elevation Model of Mexico at a scale of 15 m (INEGI, 2013). The slope in percentage was identified by calculating the proportion of change in the value of each pixel toward the surrounding neighbors. For this criterion, it was assumed that it is directly related to the conservation suitability of a locality, since the steeper the slope, the lower the willingness to establish human activities on its surface.
2.2.4 Hierarchical analysis process (AHP)
The synergy between Geographic Information Systems (GIS) and AHP has been recognized for its substantial efficacy in territorial evaluation and decision-making processes. This combined approach leverages geographic information technologies, enabling evaluators and policymakers to apply these tools across various applications, including policy formulation, development of scenarios, and prioritization of conservation areas. A significant advantage of integrating GIS with AHP is the ability to embed decision-makers’ value judgments into the analysis (Equation 1). This process not only allows for the nuanced weighting of criteria and assessment of alternatives but also facilitates a deeper comprehension of policy evaluation implications. The integration thus significantly bolsters the reliability and acceptance of the resulting decisions (Malczewski, 2006).
The Analytic Hierarchy Process (AHP) methodology is delineated into three sequential stages: (1) Modeling, where the decision-making process’s relevant aspects are systematically structured; (2) Valuation, entailing the assessment of decision-makers’ or evaluators’ preferences through a matrix of paired comparisons; and (3) Prioritization, which establishes the criteria’s weight vector crucial for solving the problem at hand (Niño, 2019).
The weights of the criteria were estimated using the Saaty method (Saaty, 1994), which is a procedure that quantifies the evaluator’s preferences with respect to the relative importance of each of the criteria included in the AHP. The objective of the method is to construct a vector of priorities or weights that allows the hierarchical and numerical evaluation of the criteria under consideration. Initially, a square matrix was configured with paired comparisons, which describes a scale that defines the correspondence between the evaluator’s qualitative assessment and a numerical assignment (Saaty and Shang, 2011). Subsequently, the normalized matrix was calculated following the methodological guidelines and theoretical considerations presented by Niño (2017, 2019), with which the weight vector of the criteria considered in the evaluation of the suitability of areas susceptible to be released for conservation purposes was estimated. Once the weight vector was obtained, the weighting of each criterion was carried out according to the assigned weight, which corresponds to the product of these values in each of the alternatives or pixels of the raster cartographic layers and representing the spatialized variables included in the evaluation. Next, a weighted linear summation was performed, in which a single value of suitability for conservation was obtained with the sum of the values of the adjusted criteria, according to the weight assigned to each variable.
Given that weights are determined based on the subjectivity of a decision-maker or expert and the exact weights remain unknown, the matrix incorporates errors about the true weights. Hence, it is essential to evaluate the consistency level of the assigned weights. Should the consistency level prove to be unacceptable, the decision-maker must revisit and amend judgments on prior comparisons before advancing with the analysis. The matrix R is characterized by a rank of 1 due to its reciprocal condition and exhibits an eigenvalue different from zero (λ), notable for producing a scalar multiple of itself upon transformation. Consequently, the sum of a matrix’s eigenvalues equals the sum of its main diagonal values, with all elements equaling 1. It thus can be asserted that the non-zero eigenvalue of the true weight matrix equals the dimension of the square matrix, that is, n (λ = n). Discrepancies within the matrix R can lead to non-zero values, making the maximum value of λ (λmax) associated with an eigenvector deemed an approximation to the weight vector ŵ (Alonso and Lamata, 2006; Jiménez, 2002), whose mathematical representation is:
Subsequently, the degree of inconsistency in the decision-maker’s judgments regarding the weighting will be assessed using the IC Consistency Index (Equations 2, 3).
Where
The Consistency Index (CI) can be computed using the Random Consistency Index (RI), which is derived from simulating 500,000 randomly generated Saaty reciprocal matrices. The ratio of CI to RI estimates the Consistency Ratio (CR):
Considering the value of RC, the matrix R is deemed completely consistent if RC = 0. The matrix R exhibits an acceptable level of inconsistency, and the weight vector is considered valid if RC ≤ 0.1. Conversely, it is deemed inadmissible if RC > 0.1.
3 Results
The parameterization of the coverage classifier showed that with 140 decision trees, the highest accuracy of the model was achieved, calculated at 0.9993; that is, that 99.93% of the pixels classified in the training areas coincided with the categories defined in the sample. The calculation of the Kappa coefficient allowed us to establish the probability of performing a correct classification at 0.9990, compared to a classifier that randomly assigns pixels to the different classes of coverage. The coverage results show that conserved forests predominate with 37.26% of the area of interest, followed by intervened forests (30.18%). Among the agricultural areas, pastures introduced for livestock (15.04%) predominate over agricultural areas (4.07%). It is evident that 20% of the study area has been drastically transformed by anthropogenic activities (Figure 3).
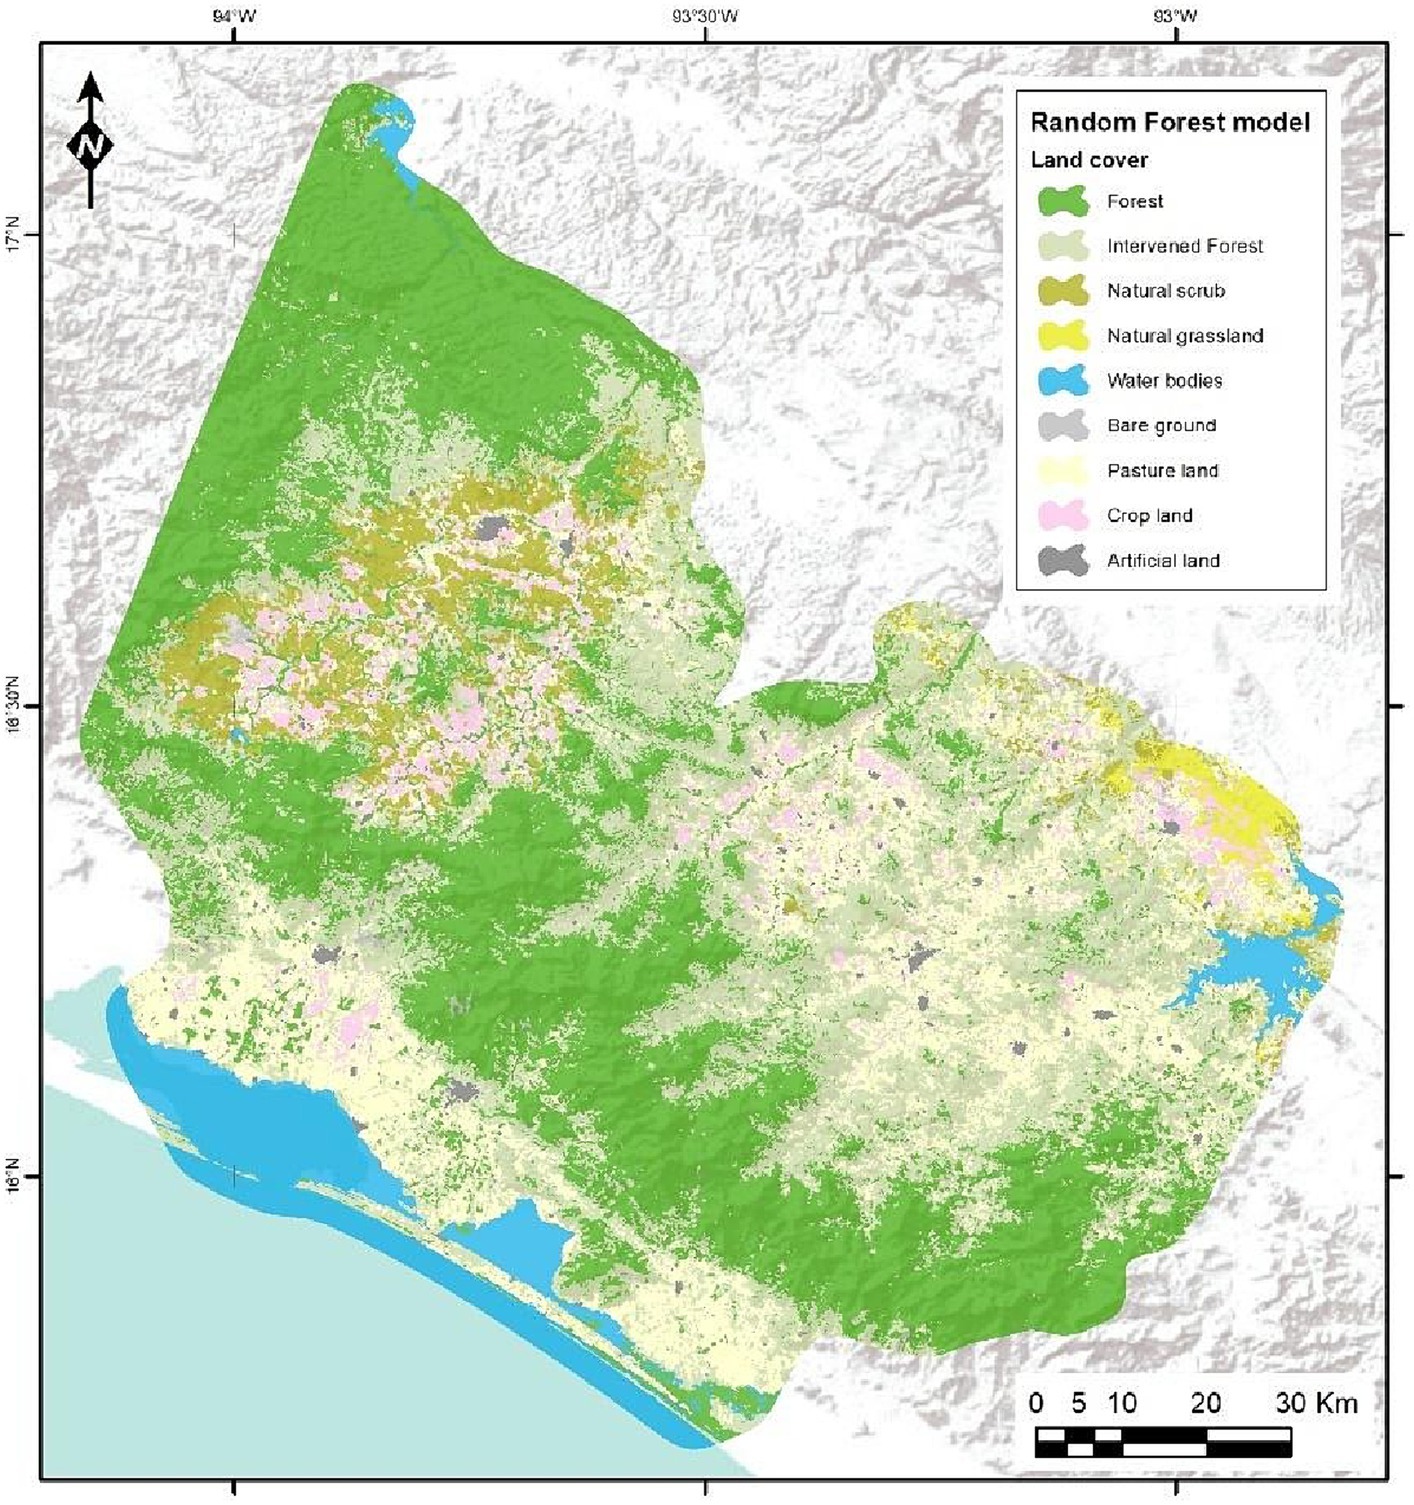
Figure 3. Land cover classification: insights from Random Forest analysis of optical and SAR imagery.
The map of hemerobic levels (HMRB) (Figure 4) presents in detail the diversity of human impact on the landscape of the study area. The oligohemerobic level predominates with 41.95% of the territory studied, characterized by natural areas of forests, shrubs, and grasslands. This is followed to a lesser extent (33.20%) by areas with a mesohemiobic level, whose predominant coverage corresponds to intervened forests that have lost their original structure; areas with a β-euhemerobic level (11.53%), occupied by introduced pastures dedicated to livestock; areas with a metahemerobic level (10.05%), used by urban infrastructures and areas influenced by land transit routes; areas of α-euhemerobic level (3.03%), where areas dedicated to agricultural activities predominate; and with the smallest extension, the areas with polyhemerobic level, occupied by bare soils (see definitions of levels in Table 1).
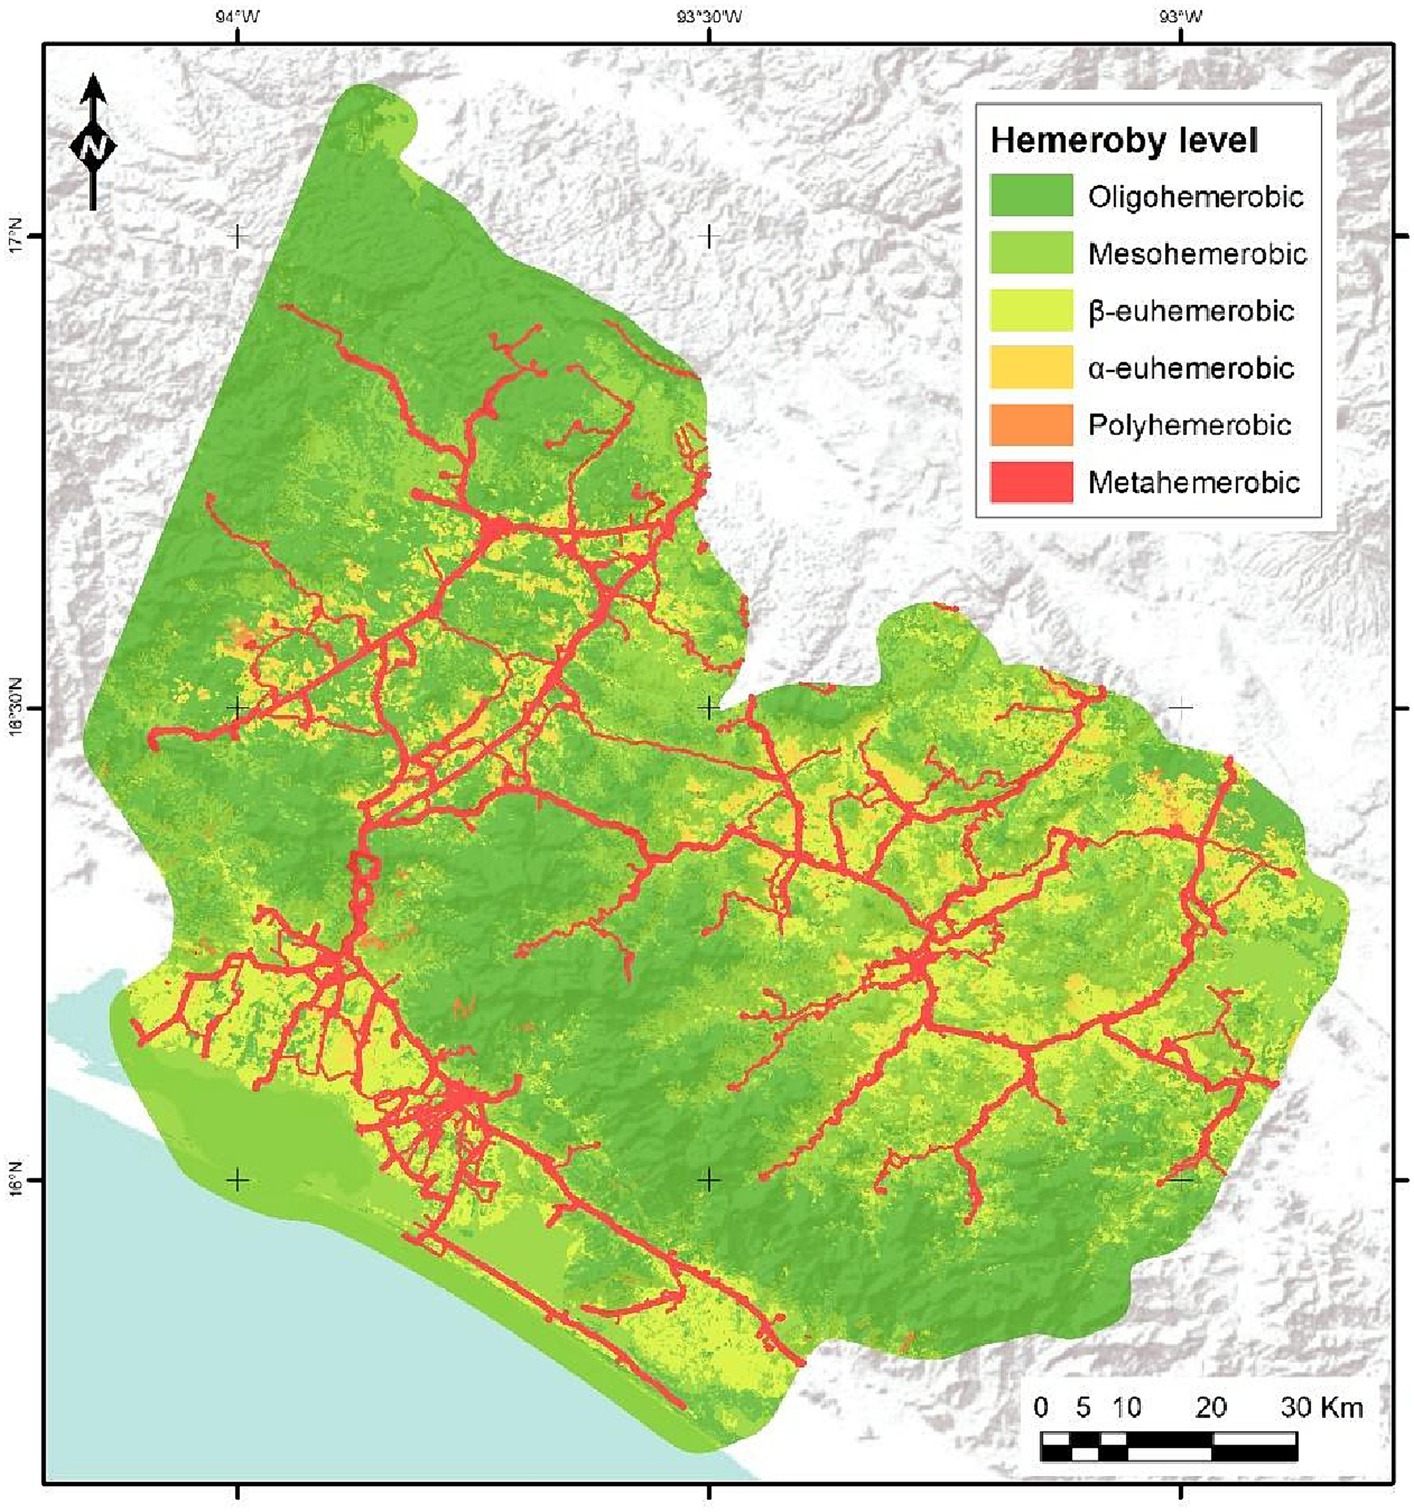
Figure 4. Hemeroby index based on reclassification of geographic information on land covers and terrestrial roads. See Table 1 for explanations on hemeroby levels.
According to the FIRMS program, 61,210 fire events (FF) were detected in the study area over the past decade. Per square kilometer, there were an average of 4.76 fires, with a maximum of 90 events and a standard deviation of 5.87 (Figure 5). The matrix of distances to the nearest forested areas (DBC) showed that the areas devoid of this cover are on average 678.86 m from the conserved forests, with a maximum distance of 12,466.87 m and a standard deviation of 1,237.13 (Figure 6). The predominant slopes (SLP) in the study area, with 25.83% of the territory, correspond to the slightly steep ones, whose range in percentage of inclination ranges from 25 to 50. It is followed in distribution (20.55%) by strongly inclined slopes with percentages between 12 and 25%; slightly inclined slopes (3 to 7% slope) occupying 15.79% of the area; and flat areas (0 to 3% slope) with 14.62% of the territory (Figure 7).
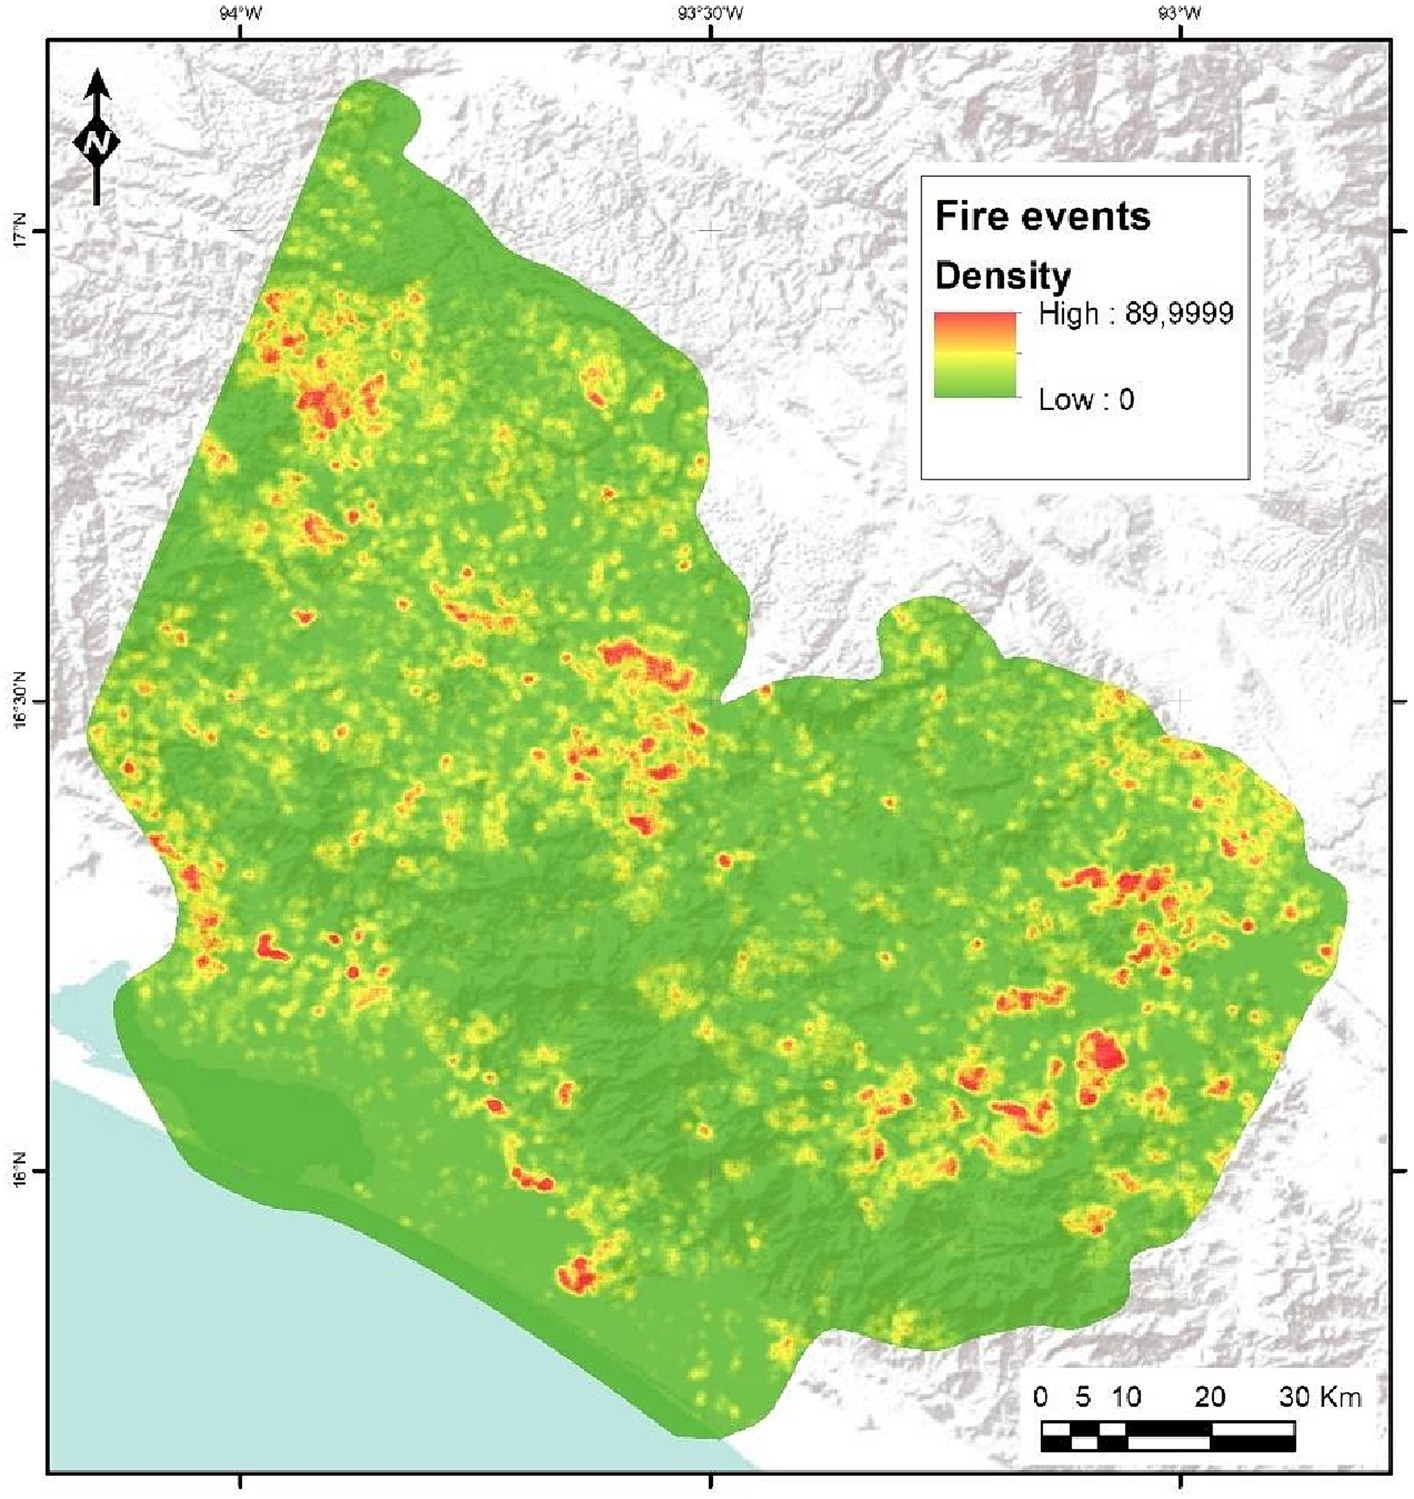
Figure 5. Fire hotspots per km2 based on frequency events registered by FIRMS program during last decade.
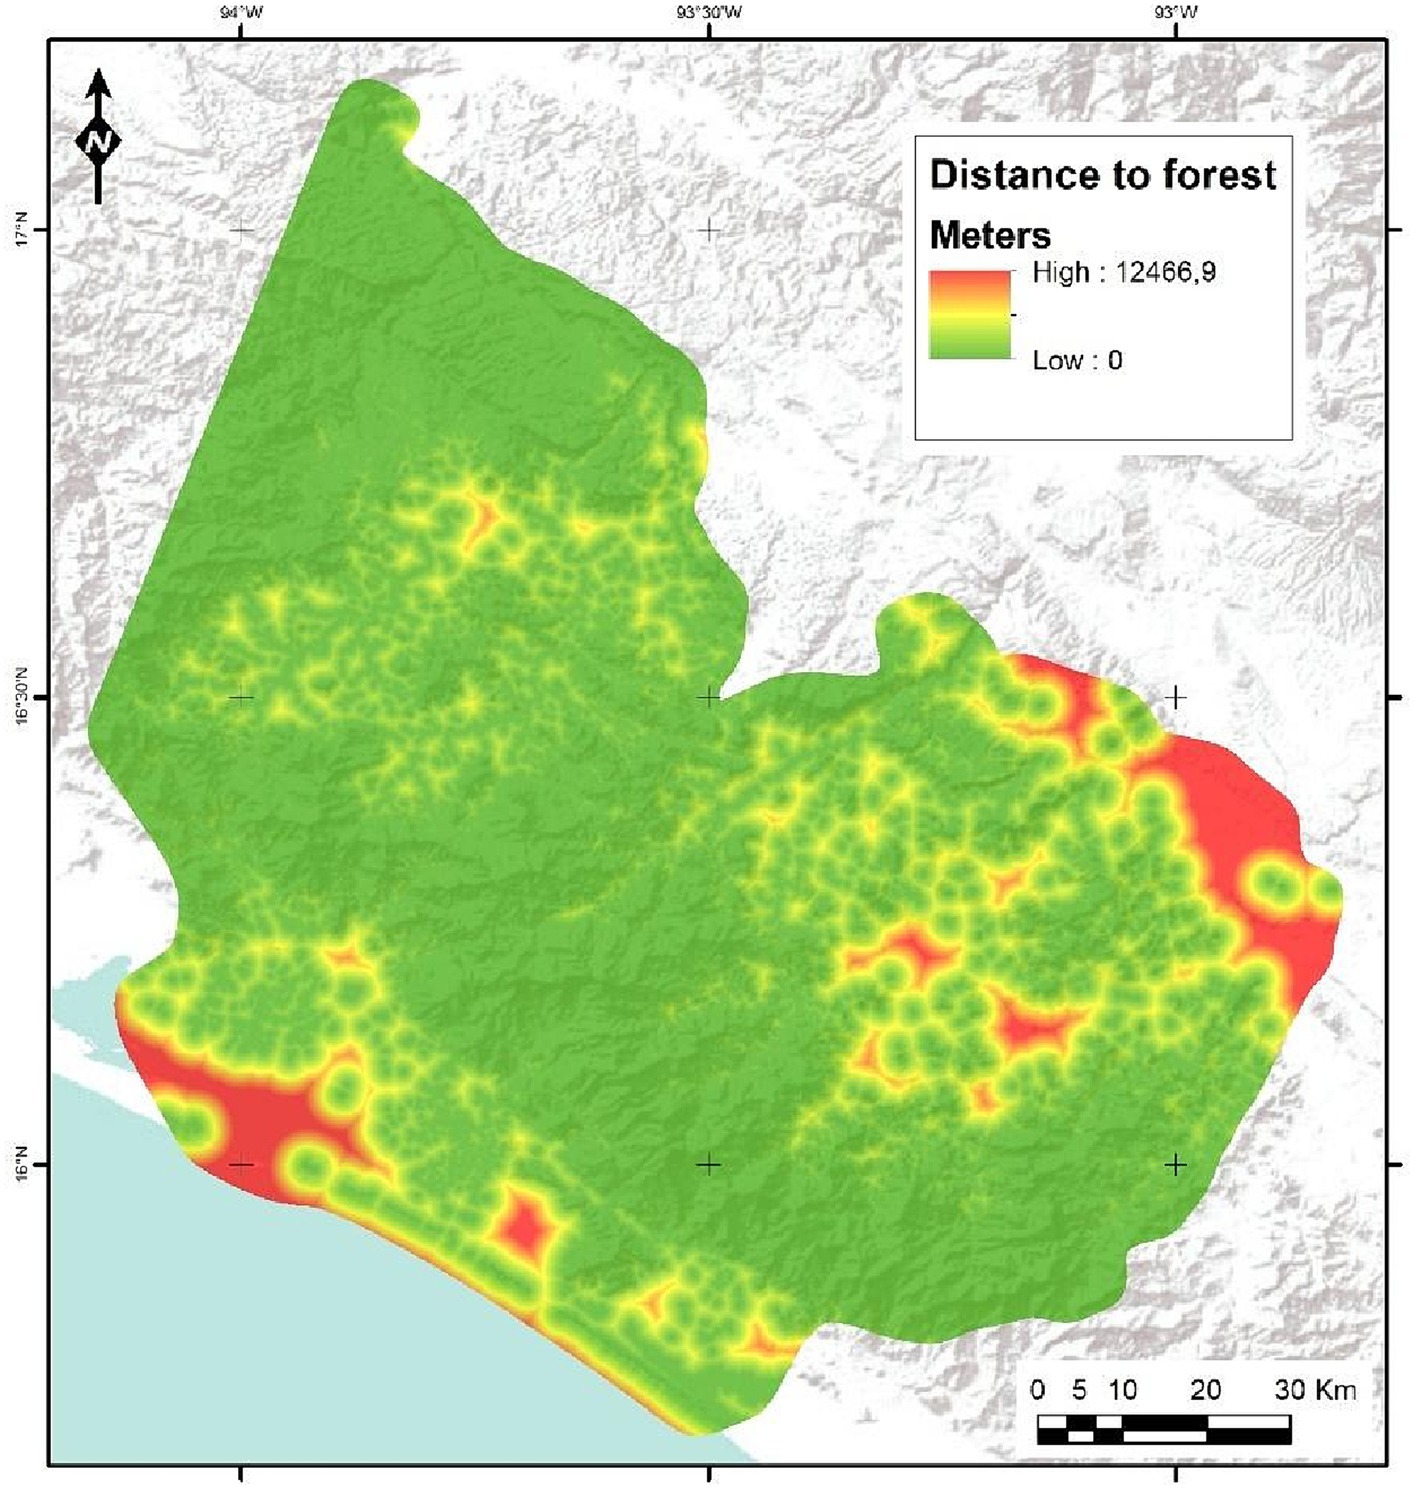
Figure 6. Distance to forest as Euclidean distance from deforested areas to nearest area covered by structurally preserved forest.
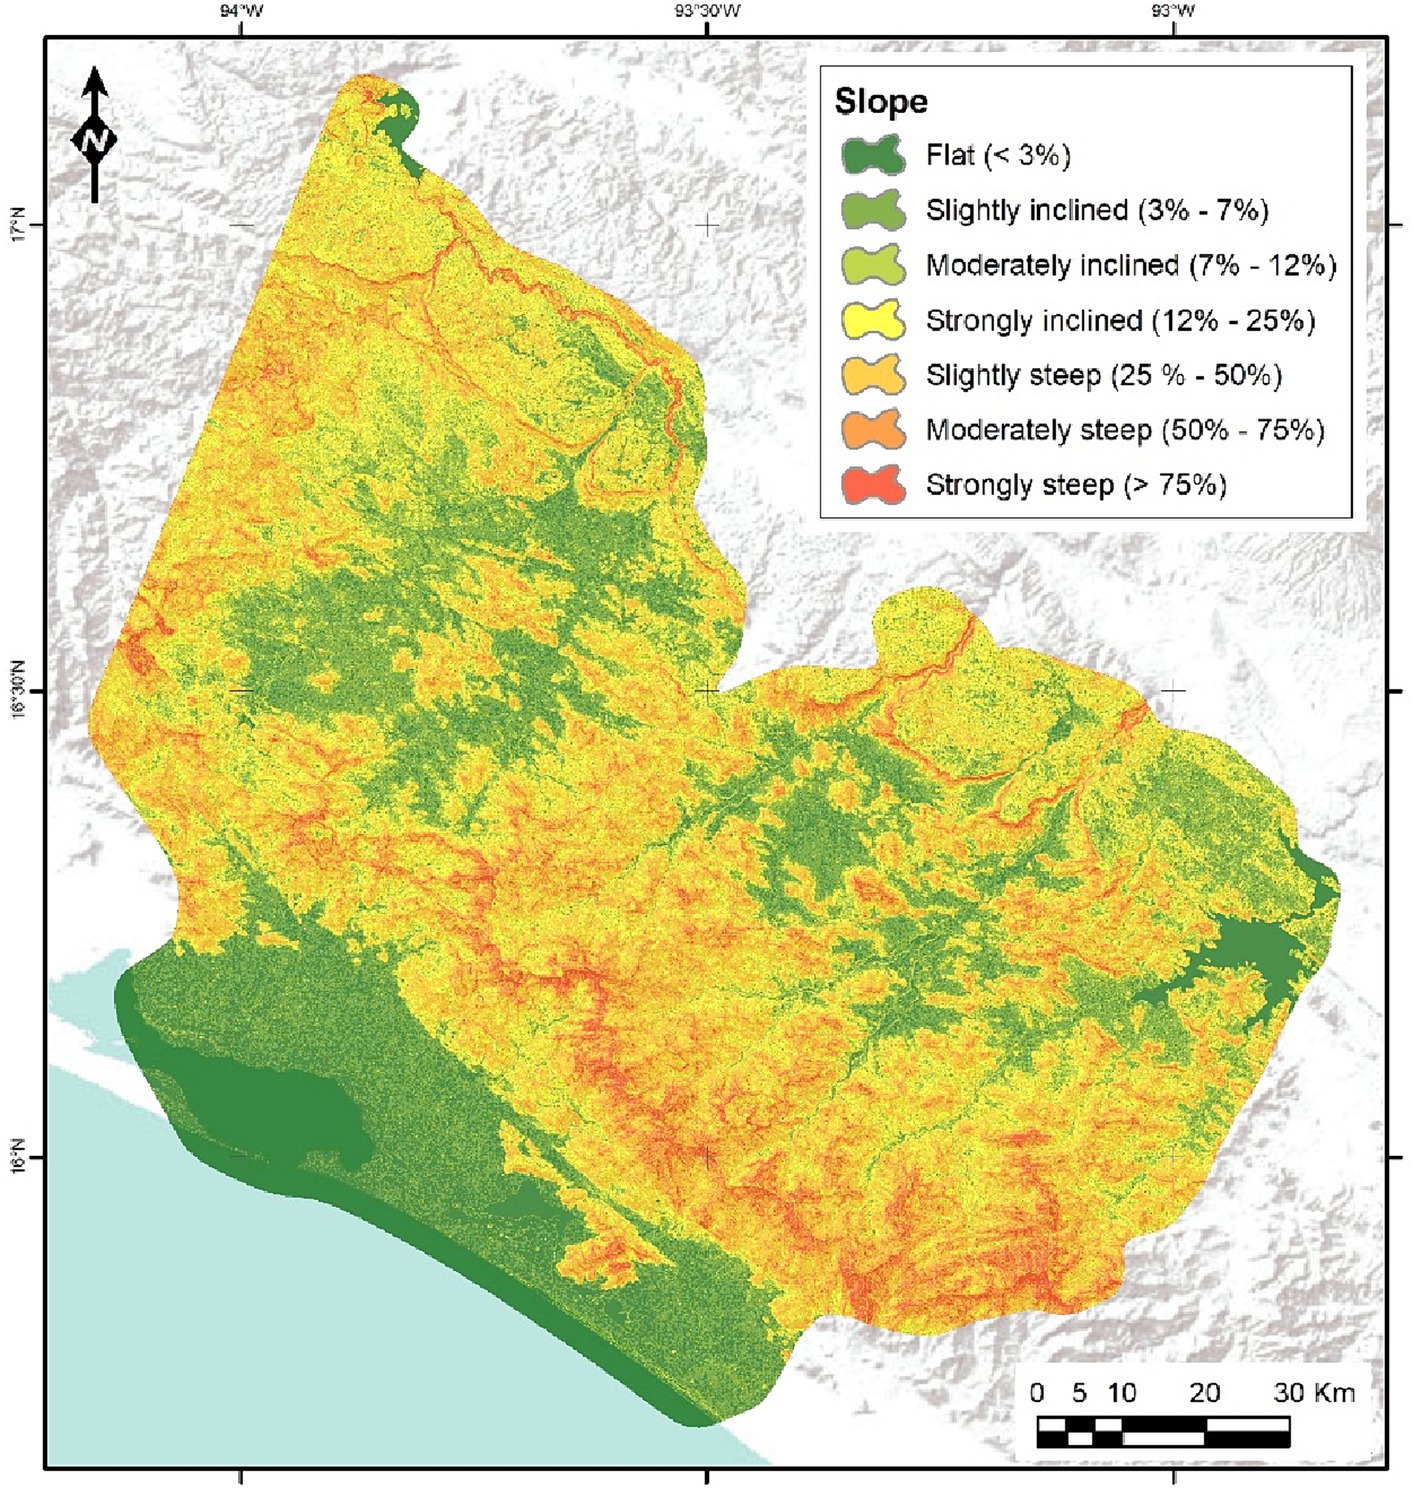
Figure 7. Slope levels as a classification of terrain inclination in percentage.
Table 2 shows the normalized matrix, with which the weight vector of the criteria considered in the evaluation of the suitability of areas susceptible to being released for conservation purposes was calculated. The degree of inconsistency of the decision-maker’s judgments was estimated with the Consistency Index, where the average of the eigenvalue λ (4.118) indicated congruent evaluations in the normalized priority matrix, since its values were close to and never less than the number of criteria (four); the calculated Consistency Index was 0.039, which was later computed, in the calculation of the Consistency Ratio, with a Random Consistency Index corresponding to 0.882, which figure is reported by Alonso and Lamata (2006) implementing 500,000 random matrices for four criteria. The resulting Consistency Ratio was 0.045, a value less than 0.1, so the weight vector is considered to have an admissible inconsistency.
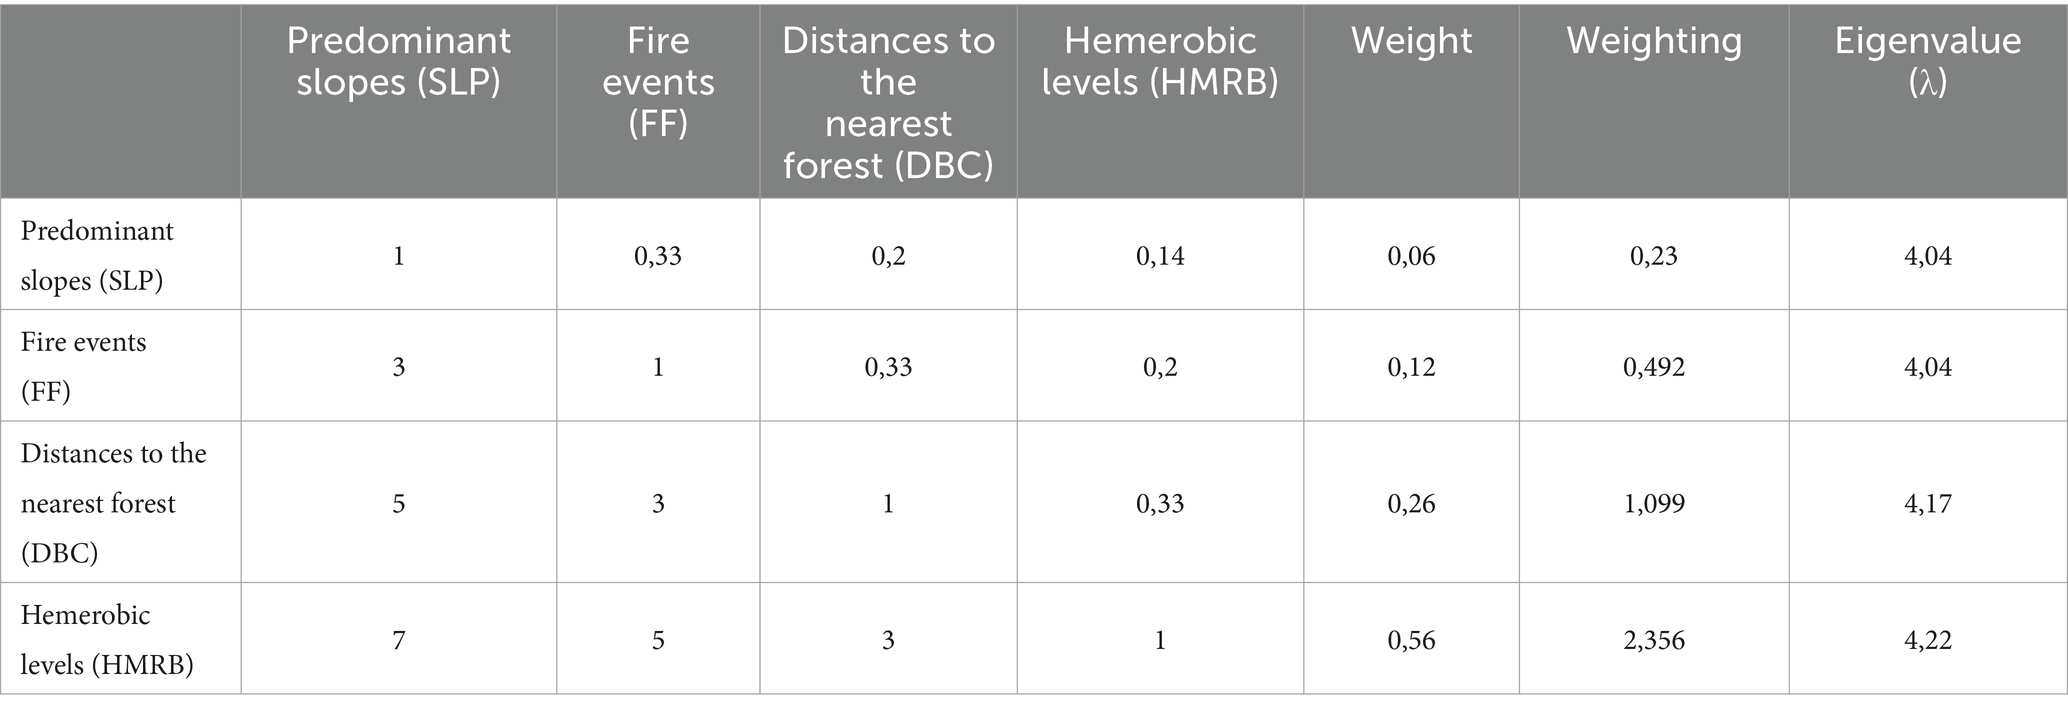
Table 2. Standardized priority matrix.
According to the vector of weights, the conservation suitability was calculated with a map algebra geoprocess, on the raster-type cartographic layers of the criteria considered and according to the expression:
Once the weight vector was integrated into the geographic information of the criteria, a cartographic output of the spatial distribution of the territory’s conservation suitability was obtained (Figure 8), which allows us to distinguish the areas with the greatest disposition to be released for conservation purposes. According to the AHP model, areas with very high suitability for conservation predominate with 36.01% of the territory, followed by areas with medium suitability with 25.42% and those with high suitability with 15.90%. To a lesser extent, there are areas with low and very low conservation suitability, with 13.30 and 9.29% of the territory, respectively.
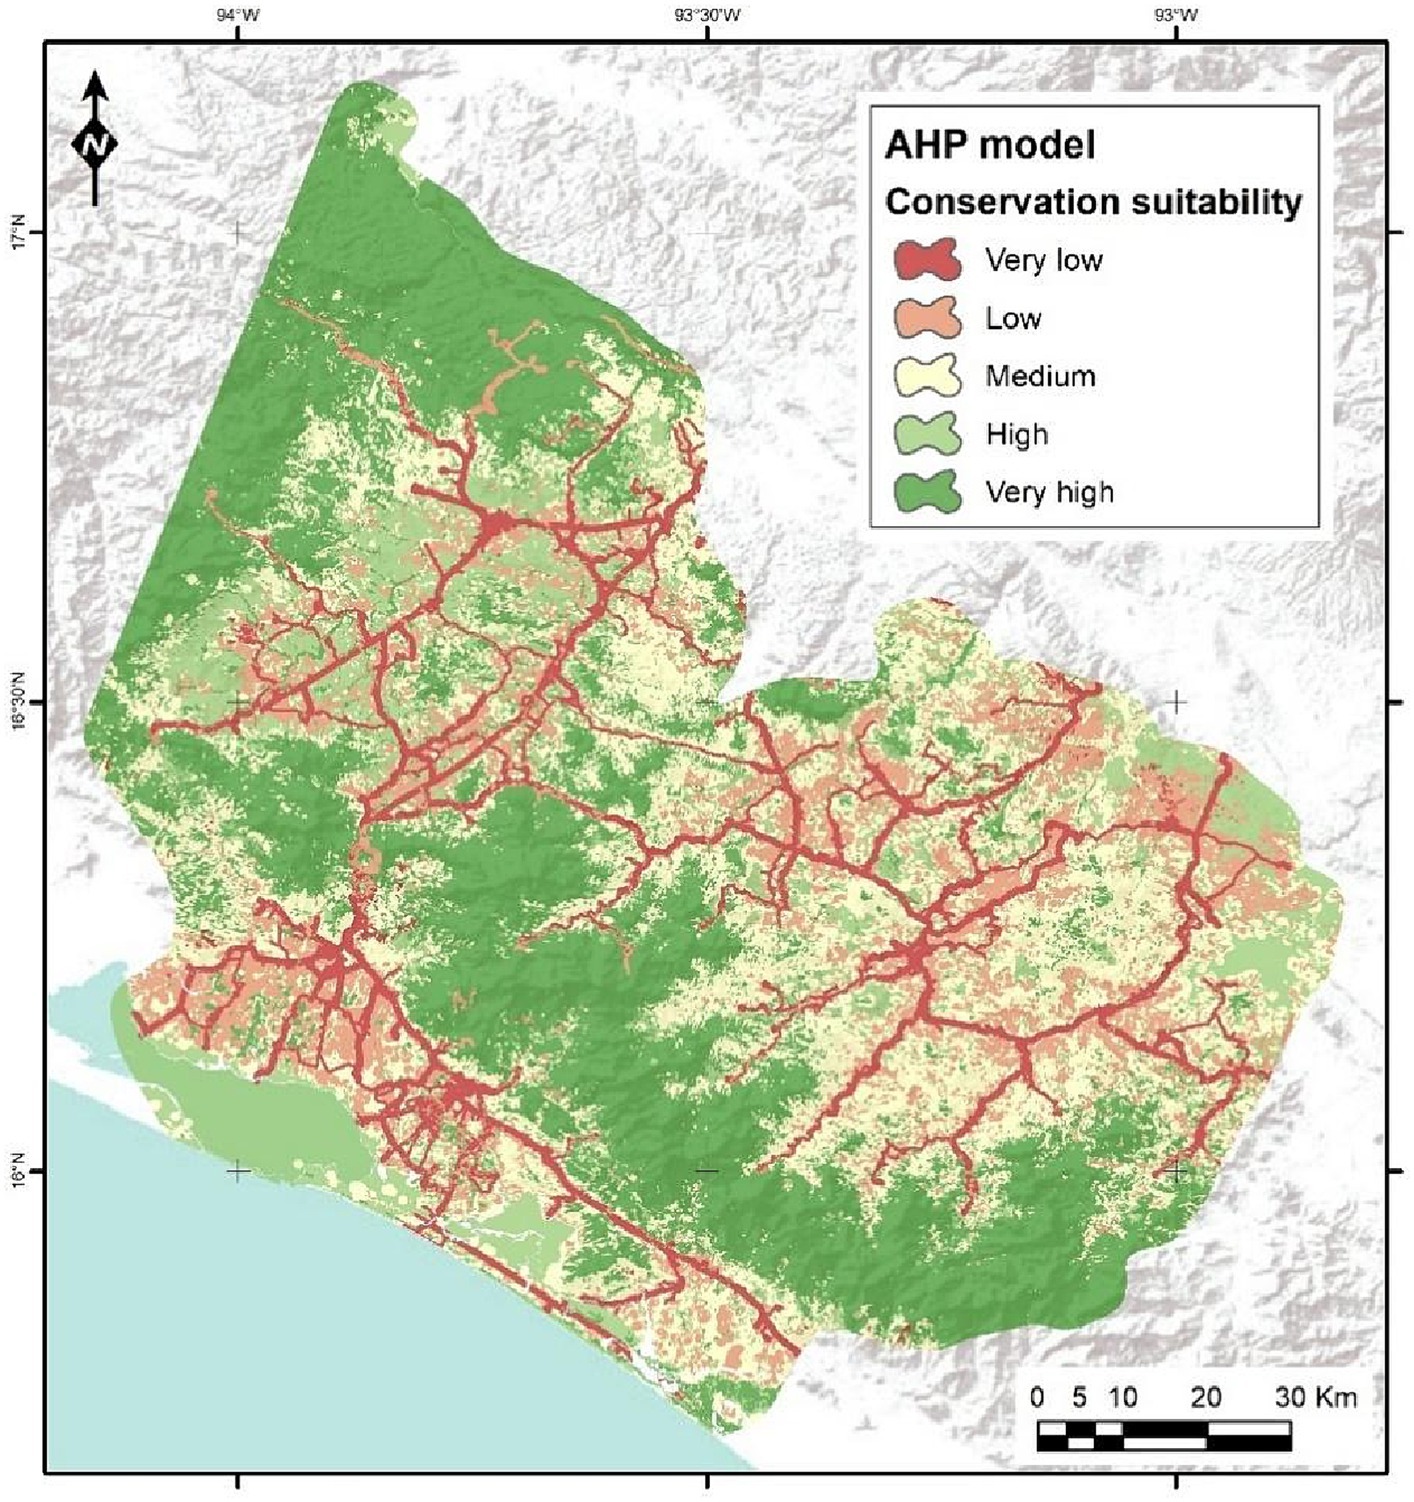
Figure 8. Conservation prioritization: identifying key areas through AHP-weighted criteria.
With respect to the farms intervened in the study area and its area of influence, the highest proportion of properties (28.53%) are mostly in areas of medium suitability for conservation and with an area of influence of 1,281.60 ha, followed by properties in very low suitability (25.96%) with 1,367.28 ha and properties in very high suitability (23.08%) with 1,577.16 ha. To a lesser extent, there are properties in high (12.82%) and very low (9.61%) suitability, with areas of influence of 541.48 ha and 302.40 ha, respectively.
According to the level of suitability for conservation calculated with the AHP model, two connectivity scenarios were defined that excluded the areas that are currently covered by conserved forests. The probable connectivity scenario (Figure 9) includes the very high and high suitability categories, this scenario includes mostly 20.19% of the properties of interest, with an area of influence of 587.52 ha. The preferable connectivity scenario (Figure 10), in addition to the categories included in the likely scenario, includes the areas of average fitness. This scenario covers mostly 55.77% of the farms of interest, with an area of 1,807.92 ha.
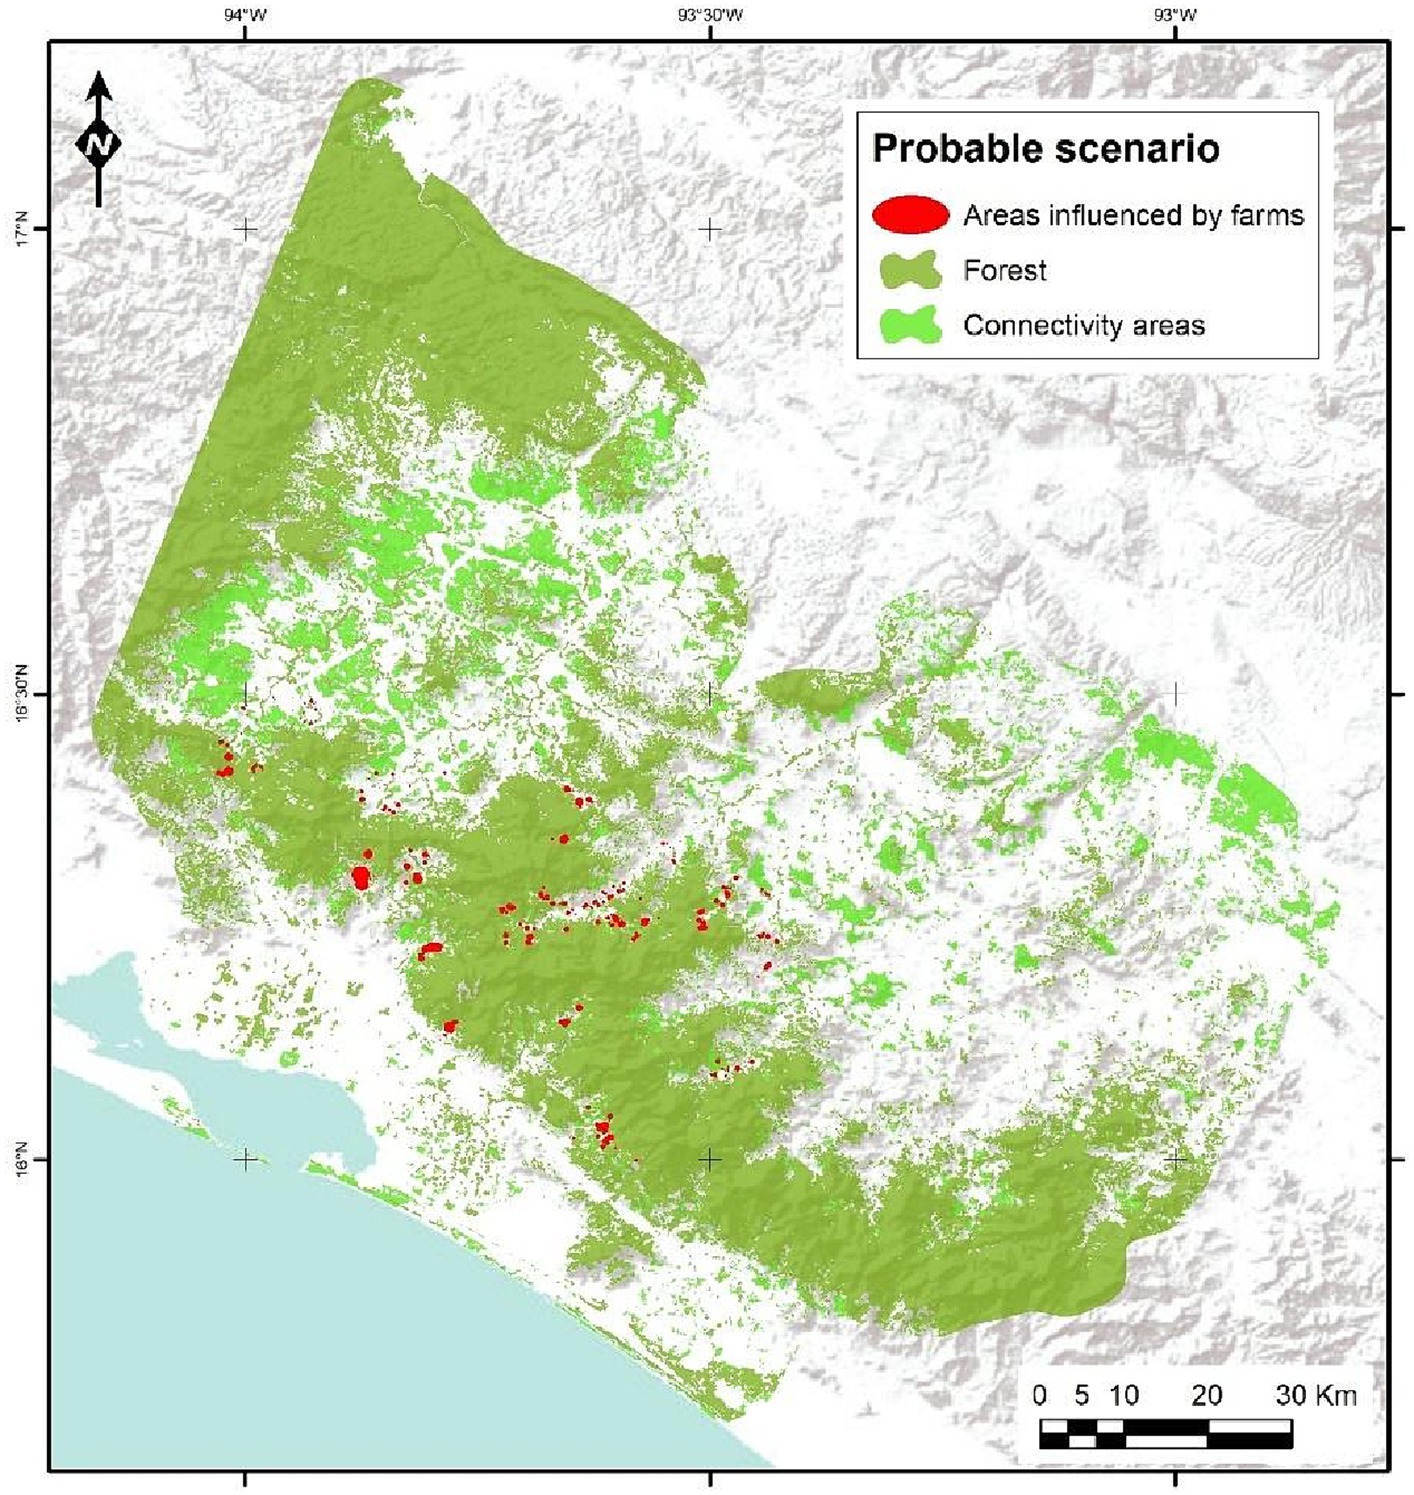
Figure 9. Probable scenario for conservation: integrating high and very high suitability areas under AHP analysis.
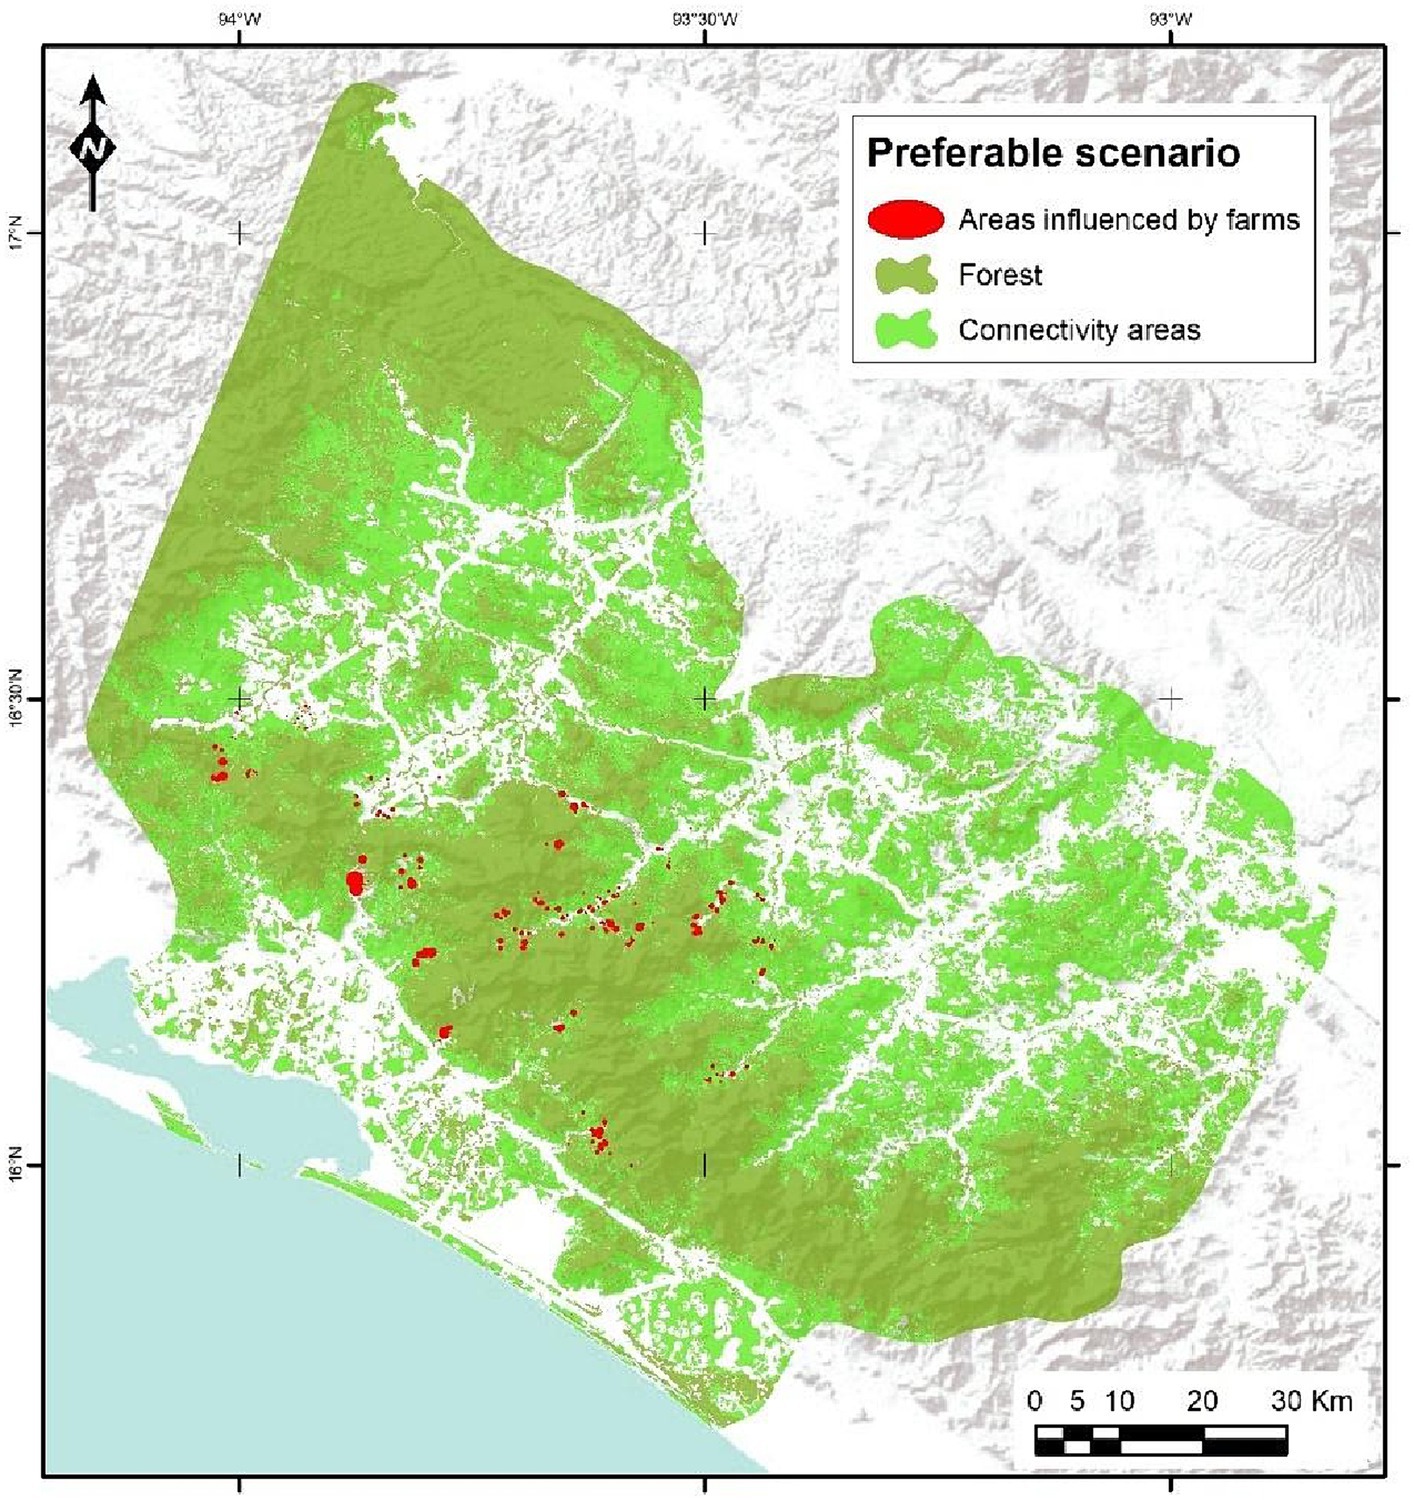
Figure 10. Preferable scenario for conservation: integrating medium, high, and very high suitability areas under AHP analysis.
4 Discussion
4.1 Integration or separation of land for biodiversity conservation in livestock landscapes
The approach of “Land Sparing” versus “Land Sharing” is a central debate in conservation and agricultural production. These approaches have direct implications for how hemeroby and landscape connectivity are managed in livestock and conservation contexts.
An indicator such as hemeroby can contribute to the planning and management of productive landscapes regardless of the approach taken to the distribution of uses in landscapes, i.e., if it is determined to work with Land Sparing, the areas destined for production would have a high hemerobic, while the conservation areas would have a low hemerobic. This creates a clearly defined landscape in terms of human influence; whereas, if the Land Sharing approach is addressed, a large part of the landscape would have an average hemeroby. Agricultural and livestock practices would be adapted to minimize their impact, allowing certain natural features to persist.
Under this approach, we can identify some advantages for both approaches, on the one hand for the Land sparing approach, the conservation of large areas of intact habitat is allowed, essential for species that require large territories or that are sensitive to disturbances; while for Land Sharing, biodiversity is favored in productive landscapes and may be more feasible in areas where it is not possible to clearly separate production from conservation areas.
Sustainable livestock farming is presented as a solution that seeks to balance production demands with the need to conserve biodiversity. In this scenario, intensive production areas would have a high hemerobic rate, while conservation areas would maintain a low hemeroby (Fischer et al., 2014). However, this approach requires ensuring connectivity between conservation areas to maintain ecosystem resilience.
Alternatively, the Land Sharing model advocates for landscapes that incorporate sustainable livestock farming in line with Ecosystem-based Adaptation (EbA) principles, promoting landscapes that are both resilient and interconnected, with a balanced level of human disturbance. These landscapes, through the harmonization of farming practices and natural elements, are capable of enhancing both agricultural productivity and biodiversity (Estrada-Carmona et al., 2022).
Perfecto and Vandermeer, 2012, Fischer et al., 2014 argue that both separation and integration have roles in biodiversity conservation, and the choice between these approaches may depend on the local context. However, it is clear that complex agricultural landscapes, which integrate multiple land uses and management practices, can be rich in biodiversity and offer multiple ecosystem services. Therefore, promoting complexity and diversity in humanized landscapes can be a key strategy for conservation and ecosystem-based adaptation.
The debate between Land Sparing and Land Sharing is essential in this context. Neyret et al. (2021) found that it is possible to minimize trade-offs between agricultural production and biodiversity conservation through landscape-level strategies. These strategies can be informed by hemeroby, providing guidance on where interventions are required.
Ecosystem-based adaptation (EbA) focuses on strengthening the resilience of ecosystems to challenges such as climate change. In this context, hemeroby can guide landscape management, identifying key areas for connectivity and adapting livestock practices to minimize their impact on biodiversity. A well-connected landscape with sustainable livestock practices can provide essential ecosystem services, benefiting both nature and human communities (Perfecto and Vandermeer, 2012).
4.2 Hemeroby, as the central indicator of a connectivity model, can encompass landscape complexity that includes livestock activity
Indices such as hemeroby provide insights into the condition of ecological systems, aid in decision-making, and contribute to the monitoring and evaluation of political and administrative strategies (Steinhardt et al., 1999). Hemeroby is a measure of landscape heterogeneity in terms of ecological sustainability and is acknowledged as a crucial indicator of biodiversity at the landscape level (Peterseil et al., 2004). Additionally, it is recognized as a comprehensive concept, offering methodological aspects for comparing landscapes (Steinhardt et al., 1999; Fehrenbach et al., 2015).
In practical terms, applying adaptive management using hemeroby as an indicator, where livestock farmers can adapt their practices to minimize their impact on key areas for biodiversity, can be very useful for livestock management, as well as for the development of a biodiversity conservation strategy and a better use of resources (Niño et al., 2023). For example, they may avoid grazing in areas of low hemeroby during certain times of the year to protect breeding species (Figure 4).
4.3 Connectivity model in a livestock landscape integrated into an ecosystem-based adaptation strategy
The maintenance of both structural and functional connectivity in livestock landscapes through hemeroby management can contribute to improving the resilience of these landscapes as well as of the livestock production systems involved, allowing species to move and adapt to changing conditions and at the same time generate conditions that support activities and aspects of livestock systems.
In this sense, a well-connected landscape with sustainable livestock farming can provide essential ecosystem services, such as pollination, pest control and water regulation, which benefit both nature and livestock production systems. Additionally, in livestock landscapes, it is essential to maintain connectivity to allow the movement of species and maintain healthy populations. Hemeroby can help identify areas where livestock has fragmented the landscape and where connectivity corridors are needed (Figure 9).
The relationship between connectivity and Hemeroby is established since the latter allows the identification of areas of high, medium, and low human influence in a landscape (Figure 4). Where, areas of low hemerobics, which have minimal human influence, can act as refuges for biodiversity. Areas of medium hemeroby, which have some human influence but still retain natural features, can act as connectivity corridors between refuge areas (Figures 4, 8–10).
Hemeroby proves its utility in evaluating landscape connectivity and human impact. This is a significant advantage over other methodologies that might not simultaneously consider these aspects. The criticality of incorporating the degree of human disturbance (hemeroby) in landscape connectivity assessments is emphasized, marking an advantage over methods that might overlook this crucial factor.
Contrary to some methods that primarily focus on intrinsic vegetation characteristics or environmental factors, hemeroby places particular emphasis on the extent of human influence, ranging from entirely natural to completely altered environments at various scales. This comparison can underscore the applicability or relevance of hemeroby in specific contexts, particularly in areas where human impact significantly affects vegetation conditions.
Tree conservation in agricultural landscapes, especially in tropical regions, is essential to maintain biodiversity and ecosystem services. Harvey et al. (2011) highlight that these trees provide key resources for many species. However, grassland management practices often threaten the conservation of these trees, underscoring the need for sustainable agricultural practices.
According to an ongoing analysis of tree cover change using EVI as a proxy measuring absolute changes I in the period 2016–2021 (EVI2021 - EVI2016), it was observed that in the state of Chiapas there was a loss in vegetation vigor (assumed as loss of tree cover) with −0.0434 (Figure 11). Although it was determined from the analysis that deforestation predominates in the territory, in some farms where sustainable practices were implemented, vegetation is maintained and in others the vigor of the vegetation increases (Figure 11).
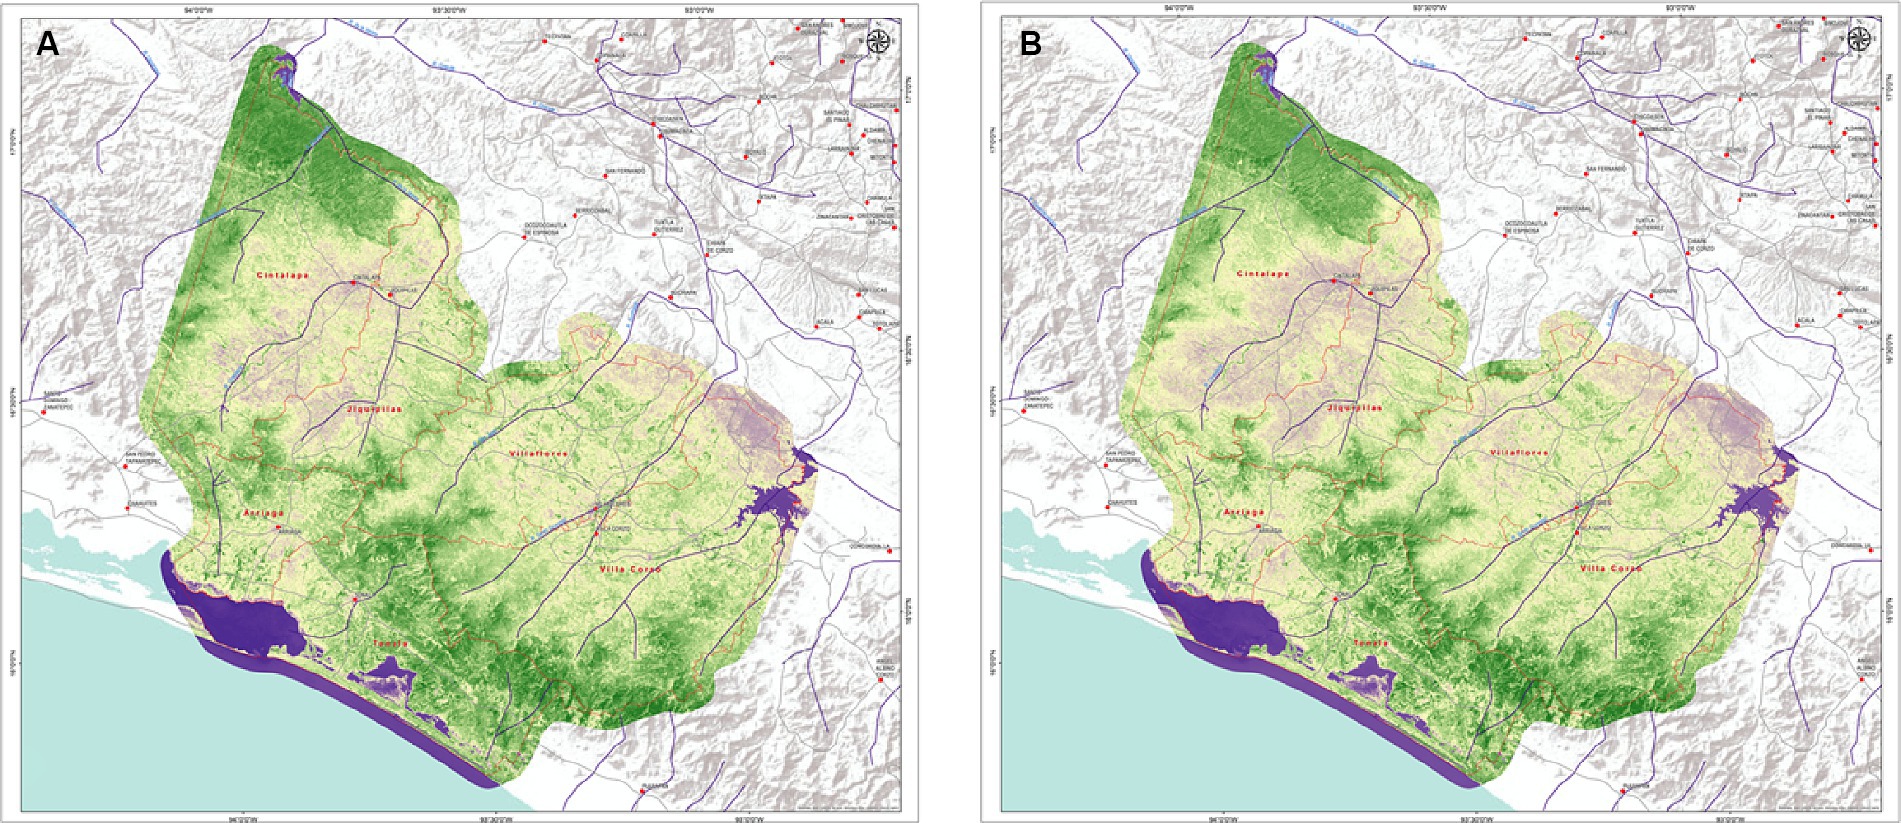
Figure 11. Temporal vegetation dynamics: comparing enhanced vegetation index (EVI) as proxy to vegetation vigor for (A) 2016; (B) 2021.
In summary, in the context of sustainable livestock farming, biodiversity conservation and EbA, Hemeroby can offer insights on how agricultural practices impact landscape connectivity, since this indicator allows us to identify areas with this priority for the intervention of sustainable livestock practices both to maintain the health of ecosystems, Strengthen the resilience of the landscape and communities to climate change. Moreover, hemeroby enables mapping to evaluate and compare landscape quality using an ordinal numerical scale. This is crucial for understanding the impact of human activities on landscape quality.
5 Conclusion
The approach of Ecosystem-based Adaptation from a landscape approach, as a first step in the development of sustainable livestock projects is desirable and necessary, in order to give an initial guideline or guidelines that allow identifying the specific sustainable practices to be implemented in the territory, since one of the gaps in the implementation of the practices is that they are already carried out at the farm level. However, the approach at the landscape level is left aside or for the end of the studies, often ignoring the ecological structure and functionality of the landscape and therefore of the territory.
Hemerobics, along with a deep understanding of sustainable agricultural practices and conservation approaches, can guide effective strategies for biodiversity conservation and ecosystem-based adaptation in agricultural landscapes. The integration of these elements is essential for a sustainable and resilient future.
Using this index offers a unique perspective on how livestock and conservation can coexist. The choice between the Land Sparing and Land Sharing approaches and their relationship to Hemeroby will depend on the local context and the specific characteristics of the landscape. However, in both cases, it is essential to consider landscape connectivity and ecosystem resilience to ensure a balance between livestock production and biodiversity conservation.
The Hemeroby index makes it possible to identify key areas for connectivity and thus adapt livestock practices according to hemeroby, leading to a sustainable livestock model that benefits both biodiversity and human communities, aligning with the principles of Ecosystem-based Adaptation.
Hemeroby offers a holistic approach to assessing human impact on the landscape, integrating data on land use and the extent of human transformation. This is particularly valuable in landscapes where human activities have substantially altered the natural environment. Differing from indices solely based on landscape geometry, the hemeroby Index is ecologically sound and more straightforward to interpret regarding human influence on the landscape.
Data availability statement
The raw data supporting the conclusions of this article will be made available by the authors, without undue reservation.
Author contributions
LP-H: Conceptualization, Investigation, Supervision, Writing – original draft, Writing – review & editing, Methodology. CS: Funding acquisition, Resources, Visualization, Writing – review & editing. JJ: Project administration, Visualization, Writing – review & editing. JB: Visualization, Writing – review & editing. EP-S: Writing – review & editing. LN: Conceptualization, Data curation, Formal analysis, Investigation, Methodology, Project administration, Software, Writing – original draft, Writing – review & editing.
Funding
The author(s) declare that financial support was received for the research, authorship, and/or publication of this article. This study was developed within the framework of the project “Promoting biodiversity conservation through the implementation of climate-smart agrosilvopastoral practices in landscapes dominated by livestock in three regions of Mexico - BioPaSOS.” Funded by the International Climate Initiative (IKI) of the German Ministry for the Environment, Nature Conservation, Nuclear Safety and Consumer Protection. Executed by CATIE in collaboration with IICA, AGRICULTURA, and CONABIO.
Acknowledgments
The authors thank to the project “Promoting biodiversity conservation through the implementation of climate-smart agrosilvopastoral practices in landscapes dominated by livestock in three regions of Mexico - BioPaSOS,” executed by CATIE in collaboration with IICA, AGRICULTURA, and CONABIO, funded by the German Federal Ministry for the Environment. We also extend appreciation to the producers, authorities, universities, and organizations that contributed, enriching this study with their valuable insights and experiences.
Conflict of interest
The authors declare that the research was conducted in the absence of any commercial or financial relationships that could be construed as a potential conflict of interest.
Publisher’s note
All claims expressed in this article are solely those of the authors and do not necessarily represent those of their affiliated organizations, or those of the publisher, the editors and the reviewers. Any product that may be evaluated in this article, or claim that may be made by its manufacturer, is not guaranteed or endorsed by the publisher.
References
Akar, Ö., and Güngör, O. (2012). Classification of multispectral images using random Forest algorithm. J. Geodesy Geoinform. 1, 105–112. doi: 10.9733/jgg.241212.1
Alonso, A. J., and Lamata, T. M. (2006). Consistency in the analytic hierarchy process: a new approach. Int. J. Uncertain. Fuzziness Knowledge-Based Syst. 14, 445–459.
Azzari, G., and Lobell, D. (2017). Landsat-based classification in the cloud: An opportunity for a paradigm shifts in land cover monitoring. Remote Sens. Environ. 202, 64–74. doi: 10.1016/j.rse.2017.05.025
Baeza, S., Paruelo, J. M., and Altesor, A. (2006). Caracterización funcional de la vegetación del Uruguay mediante el uso de sensores remotos. Interciencia 31, 382–388.
Belgiu, M., and Dragut, L. (2016). Random forest in remote sensing: a review of applications and futuredirections. ISPRS J. Photogramm. Remote Sens. 114, 24–31. doi: 10.1016/j.isprsjprs.2016.01.011
CONABIO. (2020). Cobertura del suelo de México 30 metros. Comisión Nacional Para El Conocimiento y Uso de La Biodiversidad. Available at: http://www.conabio.gob.mx
Congalton, R. (1991). A review of assessing the accuracy of classifications of remotely sensed data. Remote Sens. Environ. 37, 35–46. doi: 10.1016/0034-4257(91)90048-B
Daszak, P., Das Neves, C., Amuasi, J. H. D., Kuiken, T., Roche, B., Zambrana-Torrelio, C. B. P., et al. (2020). IPBES Workshop on Biodiversity and Pandemics. Execut. Sum. doi: 10.5281/zenodo.4147317
Estrada-Carmona, N., Sanchez, A. C., Remans, R., and Jones, S. K. (2022). Complex agricultural landscapes host more biodiversity than simple ones: a global meta-analysis. PNAS 119, 1–10. doi: 10.1073/pnas
Fehrenbach, H., Grahl, B., Giegrich, J., and Busch, M. (2015). Hemeroby as an impact category indicator for the integration of land use into life cycle (impact) assessment. Int. J. Life Cycle Assess. 20, 1511–1527. doi: 10.1007/s11367-015-0955-y
Fischer, J., Abson, D. J., Butsic, V., Chappell, M. J., Ekroos, J., Hanspach, J., et al. (2014). Land sparing versus land sharing: moving forward. Conserv. Lett. 7, 149–157. doi: 10.1111/conl.12084
Fu, B. J., Hu, C. X., Chen, L. D., Honnay, O., and Gulinck, H. (2006). Evaluating change in agricultural landscape pattern between 1980 and 2000 in the loess hilly region of Ansai County, China. Agric. Ecosyst. Environ. 114, 387–396. doi: 10.1016/j.agee.2005.11.012
Gómez, M., and Barredo, J. (2006). Sistemas de información geográfica y evaluación multicriterio en la ordenación del territorio. Madrid, España: RA-MA.
Gorelick, N., Hancher, M., Dixon, M., Ilyushchenko, S., Thau, D., and Moore, R. (2017). Google earth engine: planetary-scale geospatial analysis for everyone. Remote Sens. Environ. 202, 18–27. doi: 10.1016/j.rse.2017.06.031
Harvey, C. A., Martínez-Rodríguez, M. R., Cárdenas, J. M., Avelino, J., Rapidel, B., Vignola, R., et al. (2017). The use of ecosystem-based adaptation practices by smallholder farmers in Central America. Agric. Ecosyst. Environ. 246, 279–290. doi: 10.1016/j.agee.2017.04.018
Harvey, C. A., Villanueva, C., Esquivel, H., Gómez, R., Ibrahim, M., Lopez, M., et al. (2011). Conservation value of dispersed tree cover threatened by pasture management. For. Ecol. Manag. 261, 1664–1674. doi: 10.1016/j.foreco.2010.11.004
INEGI. (2013). Continuo de Elevaciones Mexicano 3.0 (CEM 3.0). Mapas de Relieve Continental. Available at: https://www.inegi.org.mx
INEGI. (2019). Vías terrestres de Jalisco, Campeche y Chiapas. Infraestructura de Datos Espaciales de CentroGeo. Available at: https://biopasos.geoint.mx/
Jiménez, J. (2002). El proceso analítico jerárquico (AHP). Fundamentos, metodología y aplicaciones. Rect@ Revista Electrónica de Comunicaciones y Trabajos de ASEPUMA 1, 28–77.
Jiménez Trujillo, A. J., Díaz Ramírez, R., Niño Hernández, J. G., and Galdámez Moreno, D. (2020). Caracterización de la ganadería bovina del Estado de Chiapas. México. Documento de trabajo.
Jin, H., Stehman, S., and Mountrakis, G. (2014). Assessing the impact of training sample selection on accuracy of an urban classification: a case study in Denver, Colorado. Int Journal of Remote Sensing 26, 217–222. doi: 10.1080/01431160412331269698
Kumar, L., and Mutanga, O. (2018). Google earth engine applications since inception: usage, trends, and potential. Remote Sens. 10, 1–15. doi: 10.3390/rs10101509
Liu, C., Frazier, P., and Kumar, L. (2007). Comparative assessment of the measures of thematic classification accuracy. Remote Sens. Environ. 107, 606–616. doi: 10.1016/j.rse.2006.10.010
Malczewski, J. (2006). GIS-based multicriteria decision analysis: a survey of the literature. Int. J. Geogr. Inf. Sci. 20, 703–726. doi: 10.1080/13658810600661508
Mutanga, O., and Kumar, L. (2019). Google earth engine applications. Remote Sens. 11, 1–4. doi: 10.3390/rs11050591
NASA (2023). Fire information for resource management system FIRMS National Aeronautics and Space Administration NASA. MODIS Active Fire Data URL: firms.modaps.eosdis.nasa.gov
Neyret, M., Fischer, M., Allan, E., Hölzel, N., Klaus, V. H., Kleinebecker, T., et al. (2021). Assessing the impact of grassland management on landscape multifunctionality. Ecosyst. Serv. 52:101366. doi: 10.1016/j.ecoser.2021.101366
Niño, L. (2017). Zonificación minera basada en la integración de la evaluación ambiental estratégica y modelado con múltiples criterios en la región de La Macarena, departamento del Meta, Orinoquía Colombiana. Revista Biollania 15, 634–666.
Niño, L. (2019). “Aspectos cartográficos de la vegetación, los ecosistemas y las amenazas en la Serranía de Manacacías (Meta) Orinoquía colombiana” in Colombia Diversidad Biótica Vol. XVII: La región de la Serranía de Manacacías (Meta) Orinoquía colombiana. eds. J. O. Rangel-Ch, G. Andrade-C, C. Jarro-F, and G. Santos-C (Bogotá, Colombia: Universidad Nacional de Colombia), 573–600.
Niño, L., Jaramillo, A., Villamizar, V., and Rangel, O. (2023). Geomorphology, land-use, and hemeroby of foothills in Colombian Orinoquia: classification and correlation at a regional scale. Pap. Appl. Geogr. 9, 295–314. doi: 10.1080/23754931.2023.2189921
Olofsson, P., Foody, G., Herold, M., Stehman, S., Woodcock, C., and Wulder, M. (2014). Good practices for estimating area and assessing accuracy of land change. Remote Sens. Environ. 148, 42–57. doi: 10.1016/j.rse.2014.02.015
Pal, M. (2005). Random forest classifier for remote sensing classification. Int. J. Remote Sens. 26, 217–222. doi: 10.1080/01431160412331269698
Perfecto, I., and Vandermeer, J. (2012). Separación o integración para la conservación de biodiversidad: la ideología detrás del debate “land-sharing” frente a “land-sparing.” Available at: http://www.revistaecosistemas.net/articulo.asp?Id=715
Peterseil, J., Wrbka, T., Plutzar, C., Schmitzberger, I., Kiss, A., Szerencsits, E., et al. (2004). Evaluating the ecological sustainability of Austrian agricultural landscapes—the SINUS approach. Land Use Policy 21, 307–320. doi: 10.1016/j.landusepol.2003.10.011
Pezo, D., Muschler, R., Tobar, D., and Pulido, A. (2019). Intervenciones y tecnologías ambientalmente racionales (TAR) para la adaptación al cambio climático del sector agropecuario de América Latina y el Caribe.
Plourde, L., and Congalton, R. (2003). Sampling method and sample placement:how do they affect the accuracy ofRemotely sensed maps? Photogramm. Eng. Remote Sens. 69, 289–297. doi: 10.14358/PERS.69.3.289
Probst, P., Wright, M., and Boulesteix, A. (2019). Hyperparameters and tuning strategies for random forest. WIREs Data Mining Knowledge Dis. 9:e1301. doi: 10.1002/widm.1301
Raed, M., Gari, J., Berlles, J., Sedeño, A., Porta, P., Delise, L., et al. (1996). Métodos de clasificación supervisada y no supervisada de imágenes SAR ERS 1/2. Proceedings of an Lnternational Seminar on the Use and Applications of ERS in Latin America, (Viña del Mar, Chile: European Space Agency). 287–292.
Reiche, J., Lucas, R., Mitchell, A., Verbesselt, J., Hoekman, D., Haarpaintner, J., et al. (2016). Combining satellite data for better tropical forest monitoring. Nat. Clim. Chang. 6, 120–122. doi: 10.1038/nclimate2919
Rosenfield, G., and Fitzpatrick-Lins, K. (1986). A coefficient of agreement as ameasure of thematic classification accuracy. Photogramm. Eng. Remote Sens. 52, 223–227.
Saaty, T. (1994). How to make a decision: the analytic hierarchy process. Interfaces 24, 19–43. doi: 10.1287/inte.24.6.19
Saaty, T., and Shang, J. (2011). An innovative orders-of-magnitude approach to AHP-based mutli-criteria decision making: prioritizing divergent intangible humane acts. Eur. J. Oper. Res. 214, 703–715. doi: 10.1016/j.ejor.2011.05.019
Schneiders, A., and Müller, F. (2017). “A natural base for ecosystem services” in Mapping ecosystem services. eds. B. Burkhard and J. Maes (Sofia, Bulgaria: Pensoft Publishers), 33–38.
Serbin, S., and Townsend, P. (2020). “Scaling functional traits from leaves to canopies” in Remote sensing of plant biodiversity. eds. J. Cavender-Bares, J. Gamon, and P. Townsend (Cham, Switzerland: Springer), 43–82.
Singh, A. (1987). Spectral separability of tropical forest cover classes. Int. J. Remote Sens. 8, 971–979. doi: 10.1080/01431168708954741
Steinhardt, U., Herzog, F., Lausch, A., Müller, E., and Lehmann, S. (1999). “Hemeroby index for landscape monitoring and evaluation” in First international conference on environmental indices: Systems analysis approach. eds. Y. Pykh, D. Hyatt, and R. Lenz (EOLSS Publ: Oxford), 237–254.
Tobar-López, D., Bonin, M., Andrade, H. J., Pulido, A., and Ibrahim, M. (2019). Deforestation processes in the livestock territory of La Vía Láctea, Matagalpa, Nicaragua. J. Land Use Sci. 14, 225–241. doi: 10.1080/1747423X.2019.1671907
Tsai, Y., Stow, D., Chen, J., Lewison, R., An, L., and Shi, L. (2018). Mapping vegetation and land use types in Fanjingshan National Nature Reserve Using Google Earth Engine. Remote Sens. 10, 1–14. doi: 10.3390/rs10060927
Tscharntke, T., Klein, A. M., Kruess, A., Steffan-Dewenter, I., and Thies, C. (2005). Landscape perspectives on agricultural intensification and biodiversity - ecosystem service management. Ecol. Letters 8, 857–874. doi: 10.1111/j.1461-0248.2005.00782.x
Walz, U., and Stein, C. (2009). Indicators of hemeroby for the monitoring of landscapes in Germany. J. Nat. Conserv. 22, 279–289. doi: 10.1016/j.jnc.2014.01.007
Keywords: livestock, landscape connectivity, AbE, hemeroby, multi-criteria analysis
Citation: Pulido-Herrera LA, Sepulveda C, Jiménez JA, Betanzos Simon JE, Pérez-Sánchez E and Niño L (2024) Landscape connectivity in extensive livestock farming: an adaptive approach to the land sharing and land sparing dilemma. Front. Sustain. Food Syst. 8:1345517. doi: 10.3389/fsufs.2024.1345517
Edited by:
Jacques Avelino, Centre de Coopération Internationale en Recherche Agronomique pour le Développement, Institut National de la Recherche Agronomique (INRA), FranceReviewed by:
Kikuko Shoyama, National Research Institute for Earth Science and Disaster Resilience (NIED), JapanJavier Velázquez, Universidad Católica de Ávila, Spain
Copyright © 2024 Pulido-Herrera, Sepulveda, Jiménez, Betanzos Simon, Pérez-Sánchez and Niño. This is an open-access article distributed under the terms of the Creative Commons Attribution License (CC BY). The use, distribution or reproduction in other forums is permitted, provided the original author(s) and the copyright owner(s) are credited and that the original publication in this journal is cited, in accordance with accepted academic practice. No use, distribution or reproduction is permitted which does not comply with these terms.
*Correspondence: Luz Astrid Pulido-Herrera, YXB1bGlkb0BjYXRpZS5hYy5jcg==
†These authors have contributed equally to this work and share first authorship