
94% of researchers rate our articles as excellent or good
Learn more about the work of our research integrity team to safeguard the quality of each article we publish.
Find out more
ORIGINAL RESEARCH article
Front. Sustain. Food Syst., 19 June 2024
Sec. Sustainable Food Processing
Volume 8 - 2024 | https://doi.org/10.3389/fsufs.2024.1344370
This article is part of the Research TopicFermented-Based Foods As Sustainable Alternative Sources To Meet Future Demand For ProteinView all 8 articles
 Oznur Oztuna Taner1*
 Andaç Batur Çolak2
This study models milk product processing and sustainable of the shelf-life extension in a dairy factory using artificial intelligence. The Cappadocia dairy factory was used to study chemical processes and computational system modeling and simulation. Levenberg–Marquardt algorithm was used to create an artificial neural network model from real-time data. An AI-based method utilizing a Multilayer Perceptron (MLP) Artificial Neural Network (ANN) model was employed to precisely analyze productivity data in dairy factories. There are 9 product types and production quantities used as input parameters, and 90 datasets of actual dairy products used as output values. The model was trained using the Levenberg–Marquardt algorithm on 62 datasets for training, 14 for validation, and 14 for testing. The accuracy of the model is affected by the optimal data segmentation. The model showed how AI algorithms can improve processes and industrial production by increasing dairy production efficiency from 20 to 40%. Model efficiency values were compared to observed values to determine prediction accuracy. Model mean squared error was 4.02E-06, and coefficient of determination was 0.99984. Model efficiency predictions and observed values differed by −0.04% on average. This study investigated using artificial intelligence to optimize salvage processes and systems to increase energy efficiency and reduce environmental impact. The results show that a neural network model trained with real data can predict dairy plant productivity.
Advanced technology is being used in food production to boost efficiency. Future dairy milk factories will use artificial intelligence (AI) to boost productivity and energy efficiency. There have been several significant advancements in information technology in recent years (Khan and Turowski, 2016). Lifestyles and industrial processes have changed due to these upgrades. To improve quality, resource utilization, risk reduction, and market competitiveness, companies are adopting new technologies to transform client service. Thus, Khan and Turowski (2016) built a new set of production models to produce new values for their consumers and cash for themselves. Recent work in the field of AI by Funes et al. (2015) has proven significant in this regard. This study sought to create a human-like, capable technology. AI can work for long periods of time without interruption and assist people find information that is simple but difficult to do. Lamrini et al. (2012) recommended new modeling tools due to the increasing complexity of food industry applications due to various occupations and methodologies. Complex operations require a more precise representation of technology, especially in systems with difficult instrumentation or analytical methods. Process nonlinearities and significant operational factor interactions complicate physical phenomenon research. In complex and large-scale industrial operations, Guine (2019) developed scientific and engineering methods to save and quantify energy. Statistics-based artificial neural networks (ANN) are widely used in scientific literature to model and predict flow rates. Unlike empirical equations, ANNs can explain multiple experiments, creating them generalizable and accurate. Exergy optimization was used by Fang et al. (1995) to evaluate the ML (Milk) processing system’s energy use and maximize energy quality. Thus, while ML coolers, heaters, and regenerators have near-maximum energy usage efficiencies, suggestions for improving exergy performance, such as minimizing homogenizer pressure drop and maximizing heat exchanger heat transfer constants, have been crafted. The efficiency of the spray drying process of creating white cheese powder (WCP) was assessed using energetic, exergy, and exergoeconomic analyses, as per Erbay and Koca's (2012) work, and the impact of progression variables on the process’s efficiency. Numerical software ANN can learn from examples and relate input and output parameters without process-variable correlations. ANNs are used like biological neurons. Learning and adaptability help systems adapt to environmental changes, nonlinearity improves data fit, noise insensitivity ensures accurate predictions, and high parallelism allows fast processing and hardware failure tolerance because the model can use unlearned data due to generalization (Silva et al., 2015). Azadbakht et al. (2017) explored the impacts on energy consumption (EECT), energy efficiency, and employment rate, as well as exergy loss and efficiency. ANNs were utilized to estimate the energy and exergy types, and the constructed ANN was used to simulate the thermodynamic drying process. ANNs can be utilized in intelligent drying processes, which significantly consume energy in the food industry, due to statistical analyses. ANNs were used by Tripathy and Kumar (2009) to predict food product temperature changes during sun drying. ANNs had the highest predictive capacity among completely predicted reproductions, regardless of food illustration shape, according to error analysis. ANN was used by Momenzadeh et al. (2011) to estimate drying time from sample and grain moisture content. With microwave power, drying air temperature, and grain moisture content, the model calculated well. A Tansig (hyperbolic tangential sigmoid) transference occupation and trainer backpropagation ANN network produces the most accurate maize husk drying estimates, the study found. León-Roque et al. (2016) improved and validated a quantitative picture using color measurement and ANN. Mobile device apps can estimate fermented cocoa bean fermentation index (FI) using ANNs at low cost.
The literature has identified some drawbacks of the ANN model. AI has both benefits and drawbacks in today’s technological landscape. Enhancing agriculture through food science and technology involves utilizing a combination of food science and AI to enhance crop classification, develop new food and nutraceutical products, improve formulations, conduct precise sensory evaluations, optimize industrial processing, ensure food quality and safety, manage supply chains, recycle waste, and predict calorie and nutrient levels. One drawback is the limited availability of extensive and easily accessible information needed to produce the most thorough review article. The benefits of exploring a novel topic, particularly one related to fundamental human needs like food and artificial intelligence, offer significant research opportunities that surpass any drawbacks (Esmaeily et al., 2024). Barthwal et al. (2024) indicated different methods, such as creating hybrid systems that merge ANNs with conventional heuristics, meta-heuristics, evolutionary algorithms, and other techniques. They stated that evolutionary ANNs aim to address the limitations of traditional ANNs.
Simic et al. (2016) suggested economic conditions that maximize total polyphenolic content (TPC) output while minimizing abstraction period, solvent, and energy utilize. Response surface methodology (RSM) and ANN modeled and optimized TPC MAE using ANN, which outperformed R2, RMSE, and MAE.
A multilayer perceptron (MLP) and ANN are used to assess dairy factory production in this study. A Cappadocia factory that produces cheddar cheese (CPP), curd cheese (PCP), tulum cheese (TCP), WCP, cream (CRM), butter (BPP), yoghurt (YPO), ayran (APY), and other raw ML cheeses provided the data. The trained model was used to estimate dairy plant productivity from input parameters. This research aims to reduce EECT in factory product manufacturing to improve quality. This study reveals that deep learning (DL) improves energy and product efficiency prediction in production. Few studies have used DL to predict food processing and factory energy efficiency. Most research focuses on manufacturing and energy data. Finally, this study estimated dairy ML factory energy efficiency using MLPs. A comprehensive production estimation system was built with adjustable input parameters. ML production energy data are used as input parameters (product and energy) to estimate output value using MLP (EECT and production). These traits make the MLP model suitable for supervised learning. This study used advanced intelligence networks to optimize energy and production efficiency in local dairy milk factories. Thus, this study proposes using DL to forecast dairy ML facility output and energy efficiency. Food drying and related research dominates the literature review, but milk and related products are understudied. This study sought to boost dairy milk plant output and efficiency. The first of its kind, this study could be groundbreaking.
The raw ML cheese varieties APLA, CPC, PCP, TCP, WCP, BPP, YPO, and APY, and others were collected from a local factory in the Cappadocia area. The production and energy input–output data used in this analysis was provided by the management of a facility that produces multiple types of ML and its products. Effectiveness and output were evaluated according to ML production criteria. In addition, it was able to ascertain the efficiency of the factory’s utilization energy by applying the principles of thermodynamics to the data it had gathered. The current production and energy input–output data was used to rearrange 10 scenarios with optimization, revealing production and energy efficiencies. The precision of these numbers was calculated using AI-powered algorithm-based estimation methods.
The APLA, CPC, PCP, TCP, WCP, BPP, YPO, and APY products made at this dairy ML plant all start with raw ML that is purchased and then passed through a pasteurizer (Figure 1). The energy requirements of the equipment used to process ML and its by-products vary depending on the product. This study presents energy-efficient examples by utilizing case studies to explore alternative optimization strategies.
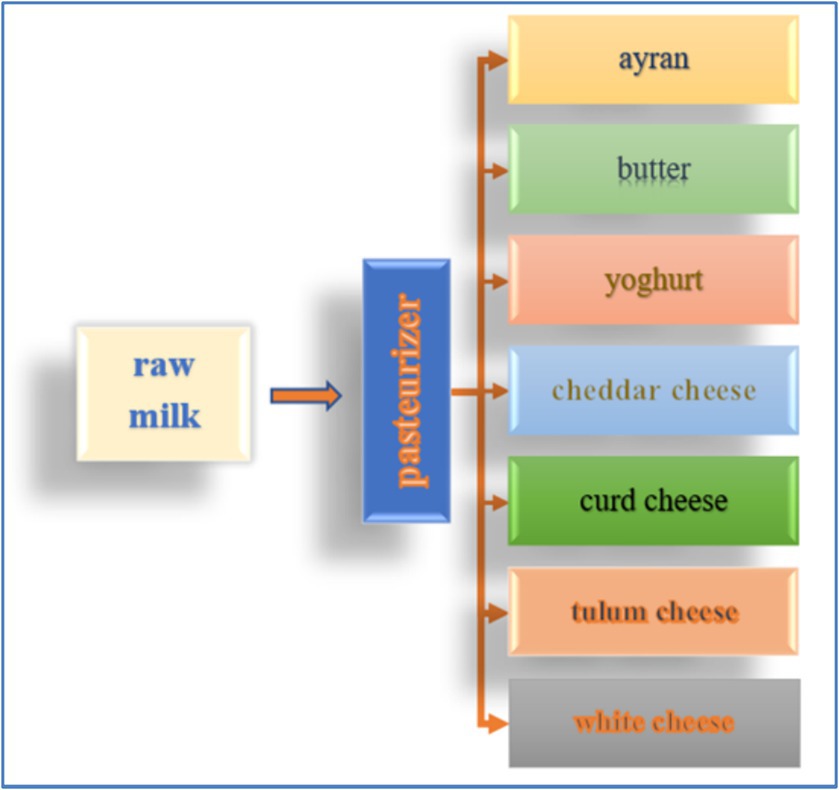
Figure 1. Production process of the dairy milk plant.
The energy cycle of the dairy ML plant is depicted in Figure 2. Plant energy can originate from a variety of sources, including lignite coal (boiler process), electric energy (machine process), and steam energy (heat transfer during the production process).
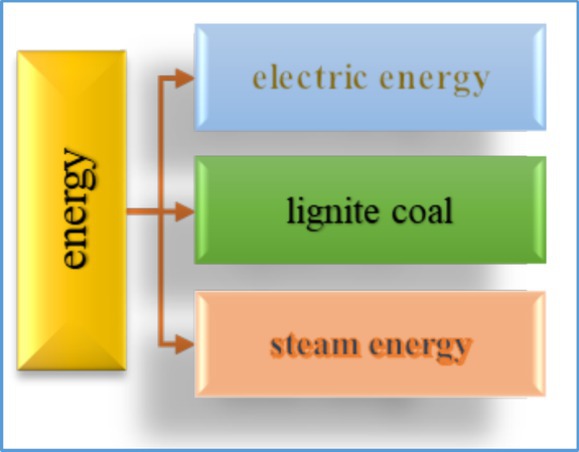
Figure 2. Energy process of the dairy milk plant.
The energy and production inputs and outputs of the dairy ML plant using AI are shown in Figure 3. The pasteurization process provides input production data. The energy requirements of the firm are met by a combination of lignite coal (boiler process), electric energy (machine process), and steam energy (heat transfer in the production process). The primary product is APLA, while other milk products include CPC, PCP, TCP, WCP, BPP, YPO, and APY, which are also produced and marketed. The output energy was calculated by subtracting the total machine and apparatus power consumptions from the total input energy.
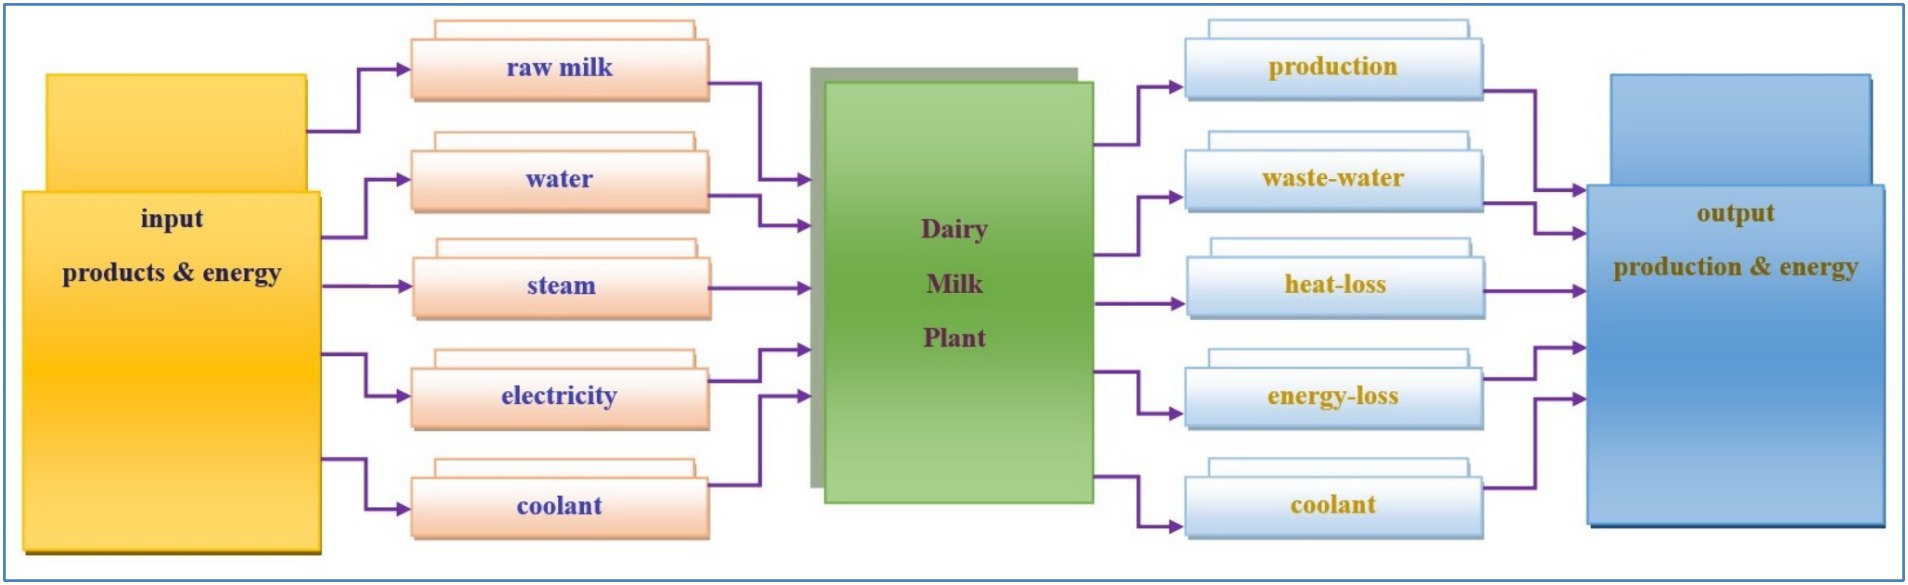
Figure 3. Input and output of the production and energy of the dairy milk plant for using AI.
In Table 1, the plate pasteurizer capacity can be obtained using Equation (1) through Equation (8) to regulate the amounts of APLA, CPC, PCP, TCP, WCP, BPP, YPO, and APY that can be produced [Prabhakar et al., 2015; UCCET (The Union of Chambers and Commodity Exchanges of Turkey): Industry Directorate, 2023]. It is possible to choose between several hypotheses to create ML dairy products.
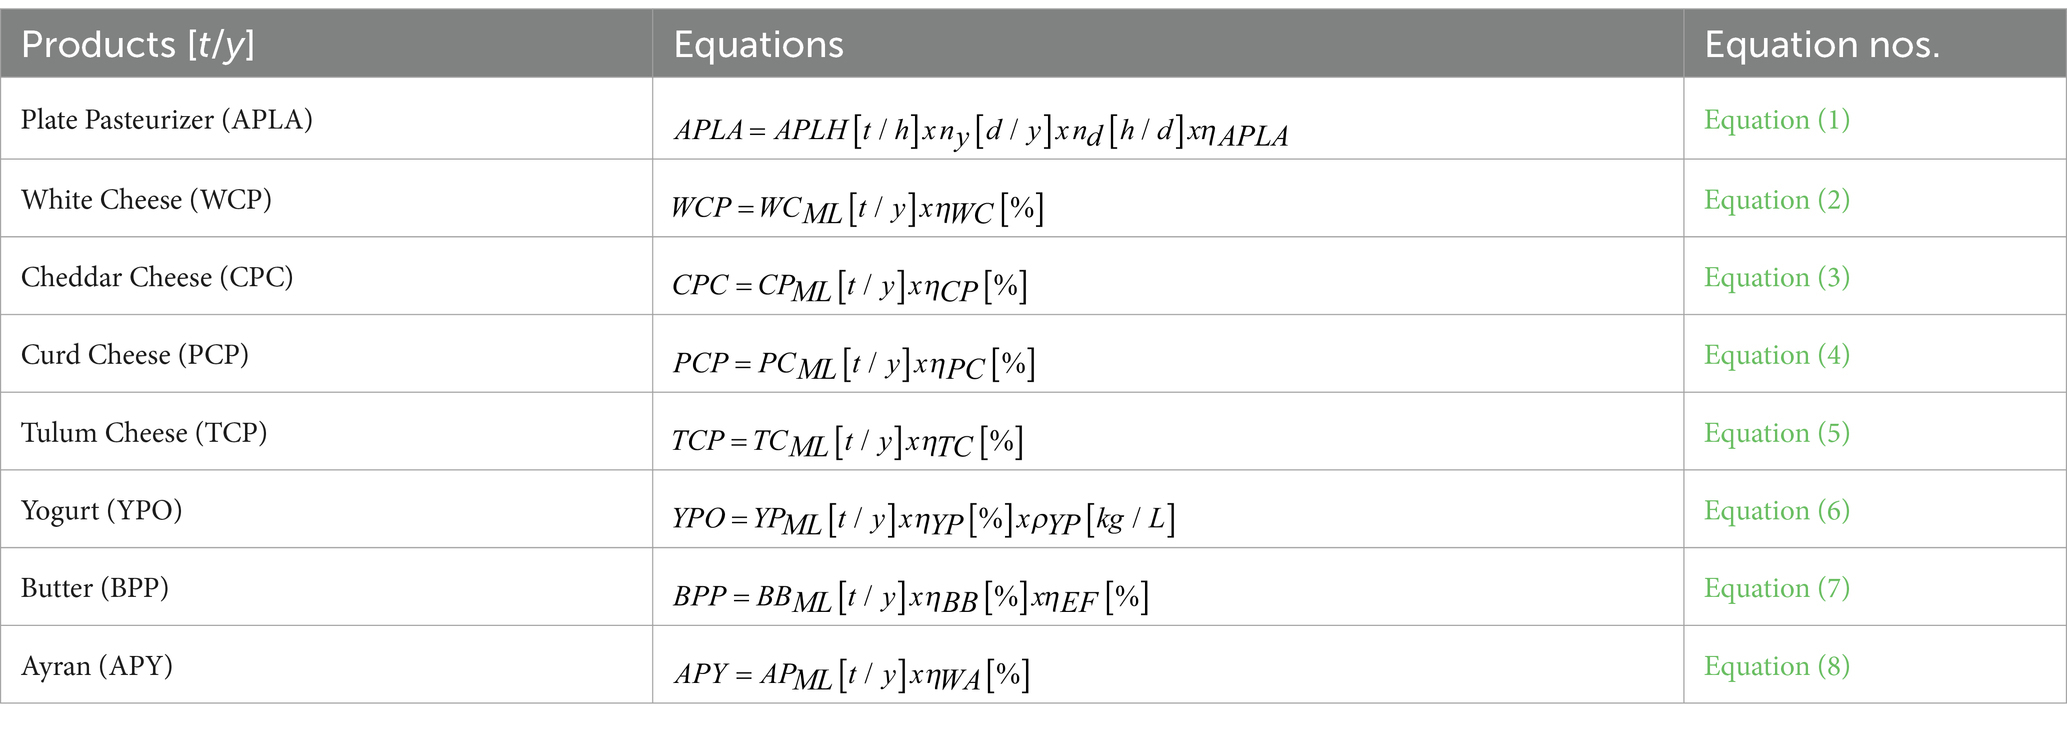
Table 1. Equations of the production analysis [UCCET (The Union of Chambers and Commodity Exchanges of Turkey): Industry Directorate, 2023].
Additionally, SPSS 18.0, was made available for use in analyzing the collected data. Regression analysis was employed to observe the credibility of the data in each scenario. Scatter plotting the equations; R2 = 0.98. Given the high value of R2, it is crucial to infer that the data can be derived from the scale and that the production and energy data are reliable and can be mathematically represented. The threshold for statistical significance was established at a p-value of less than 0.05.
The design of the dairy processing plant’s total SEECT table and energy target plan (food engineering core actions) is informed by case studies and present conditions (Montgomery et al., 2001; Huang et al., 2016; Li, 2021; Sarkar, 2022; Nathaphan and Therdyothin, 2023).
The regression analysis performed between heat and electrical energy alongside the SEECT and EECT. The utilization of linear regression analysis in the estimating procedure was primarily driven by the associations between energy consumption (month/year) and production volume. The yearly fundamental energy equation can be calculated by utilizing the R2 value of this estimation method, as demonstrated by Montgomery et al. (2001) and Nathaphan and Therdyothin (2023). The expected value ( ) can be calculated using Equation (9) (Nathaphan and Therdyothin, 2023):
The total target specific energy consumption ( ) can be determined from Equation (10) as follows:
In this study, heat and electricity consumption data were obtained from factory management and measurements during the process and calculated using thermodynamic equations. The factory management, which produces more than one dairy product, provided the production and energy input–output data used in these calculations. Efficiency and output were evaluated according to ML production criteria. In addition, by applying the principles of thermodynamics to the data collected, the efficiency of the energy used by the plant could also be determined. The available production and energy input and output data was used to optimize the 10 scenarios and to reveal the production and energy efficiency. The total EECT was computed by adding the thermal and electric energy used by machines and appliances during production. All machinery and equipment could be shipped straight from the factory thanks to precise thermal and electrical energy calculations and measurements. As a result, this research quantified the overall quantities of thermal and electrical energy consumed across all industrial processes.
From Equation (11), the total power ( ) amounts of the processes (electric energy, k is 25 machine devices through EECT) were determined as follows (Cengel et al., 2019):
According to the Thermodynamics 1st Law and Equation (12), the total heat transfer of the input process ( ) was calculated by considering the Thermodynamic tables considering the temperature variations of the process (thermal energy) as follows:
The internal, kinetic, and potential energies were neglected because of the small energy in the cunnings.
It is generally agreed that this system is open and produces a continuous output stream. From Equations (13) to (14), the Thermodynamics 1st Law can be designed as follows (Cengel et al., 2019; Başaran et al., 2021):
Thermodynamic Tables were used to assess the quantity of steam energy generated within each process by computing the reaction that occurred in the steam at a predetermined loading using Equation (15) (Cengel et al., 2019; Başaran et al., 2021):
The (Thermodynamics 1st Law) can be derived from Equations (16, 17) as follows (Cengel et al., 2019; Başaran et al., 2021):
Based on these equations, predictions and optimizations were created according to the energy and mass scenarios. Thus, the study models were constructed to be utilized in ANN with the designed input and output data.
To accurately identify data on productivity in dairy factories, an AI-based method was applied to the model of a MLP based on ANN. Nine different product types and production quantities serve as input parameters, while 90 different datasets of actual dairy products serve as output values. The optimal data grouping can affect the model’s prediction accuracy. In the developed MLP model, the Levenberg–Marquardt training algorithm, which is one of the training algorithms that can provide high accuracy due to its strong structural features, was used (Karimi et al., 2022). In selecting the transfer functions to be used in the hidden and output layers of the MLP network model, information obtained from the literature was used and the widely used transfer functions Tan-Sig and Purelin transfer functions were selected (Çolak, 2021a). Levenberg–Marquardt was used as the training algorithm, and Tan-Sig and Purelin transfer functions were used in the hidden and output layers. This model was trained using the Levenberg–Marquardt algorithm on 62 training, 14 justification, and 14 testing datasets. The best data grouping affects model accuracy. Tan-Sig and Purelin transfer functions in the hidden and output layers can be given Equations (18, 19) as follows (Khan et al., 2023; Rehman et al., 2023; Reis et al., 2023; Shilpa and Leela, 2023):
The study evaluated the performance of the MLP model for estimating dairy factory productivity values using commonly used literature parameters. The mathematical expressions used in the calculation of the mean squared error (MSE), R2, and margin of deviation (MoD) parameters that were obtained as performance parameters, are indicated Equations (20, 21, 22) as follows (Rehman et al., 2022; Srinivasacharya and Kumar, 2022; Khan et al., 2023; Rehman et al., 2023; Reis et al., 2023; Shilpa and Leela, 2023):
One of the difficulties in developing MLP models is the lack of a fixed model used to determine the number of neurons in the hidden layers of MLP networks (Bonakdari and Zaji, 2016). To overcome this difficulty, the methodology also applied in the literature was used and the number of neurons in the hidden layer was determined by analyzing the prediction performances of models with different numbers of neurons in the hidden layer (Çolak, 2021b). The number of neurons in the hidden layer was optimized to 13. The basic configuration architecture and model parameters are shown in Figure 4. The developed ANN model was created using MATLAB software.
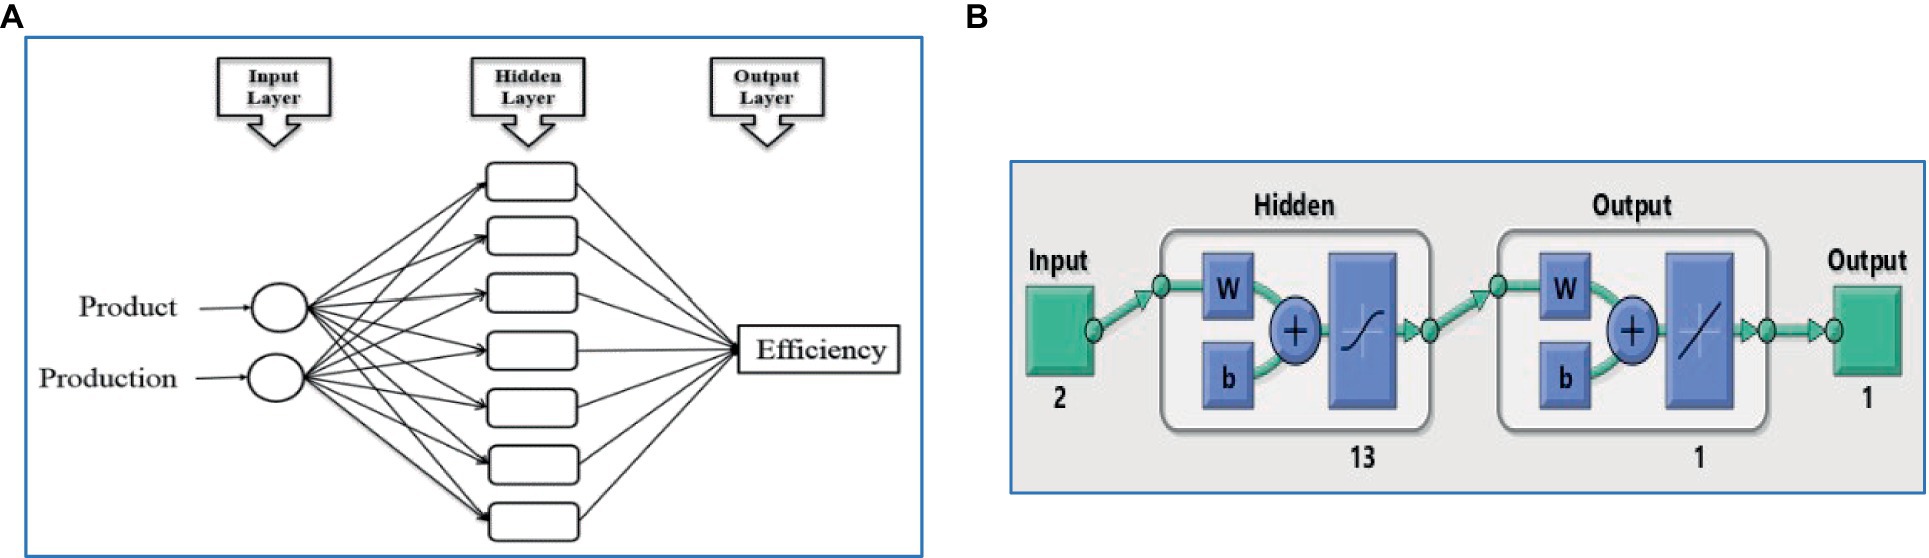
Figure 4. Information of the model developed to analyze the efficiency of the dairy factory (A) the basic configuration architecture and (B) model parameters of the MLP network.
This study considers an industrialized system in which the trained model is used to predict the output of dairy plants given various input variables. The study reduces production energy use and improve quality by using MLP to predict energy and product efficiency in manufacturing. The MLP branding system predicts dairy machine learning factory production and energy efficiency, making it ideal for supervised learning and allowing input parameter adjustments.
This study’s analysis displays the facility’s output and energy efficiency utilizing optimization methodologies reinforced by data from the factory and technical assessments. Thus, the quality of the operation is proved by algorithms that validate productivity and energy efficiency under optimal conditions. This study provides in-depth comparisons of the existing situation with graphics, production, and energy input outputs and scenarios. In this study, 10 scenarios were organized based on the production amount of milk and products planned to be produced according to the processes, to make improvements according to the current situation. By optimizing the production quantities of milk and dairy products, both energy efficiency and production efficiency, the focus of the study, were revealed.
Figure 5 depicts the outcomes of the scenario analyses using the optimization approach based on the existing annual capacity and product efficiency. When evaluating the tools for assessing a dairy ML facility, the total daily ML yield was computed by dividing the energy analysis production efficiencies, which are based on the production and efficiency of various ML and products. The total dairy products may be used to assess the efficiency of current production. The R2 value was 0.9877 and y = 0.0768 ln (x) + 0.1986. In the production and productivity graph, 10 scenarios were created with the optimization methods in the current production, the logarithmic slope of the data was drawn, and the most suitable conditions for the factory were determined. In Figure 5, while the current production amount was approximately 3,800 [t/y] and the current production efficiency was in the range of 21–22%, the scenario production amount was approximately 6,900 [t/y] and the scenario production efficiencies in the range of 38–39% were reached with 10 scenarios. Thus, the production efficiency increases when the volume integral in the production of ML and products in the optimization methods increases. Products per total dairy product is a good way to figure out the yearly production efficiency (Margolies et al., 2017).
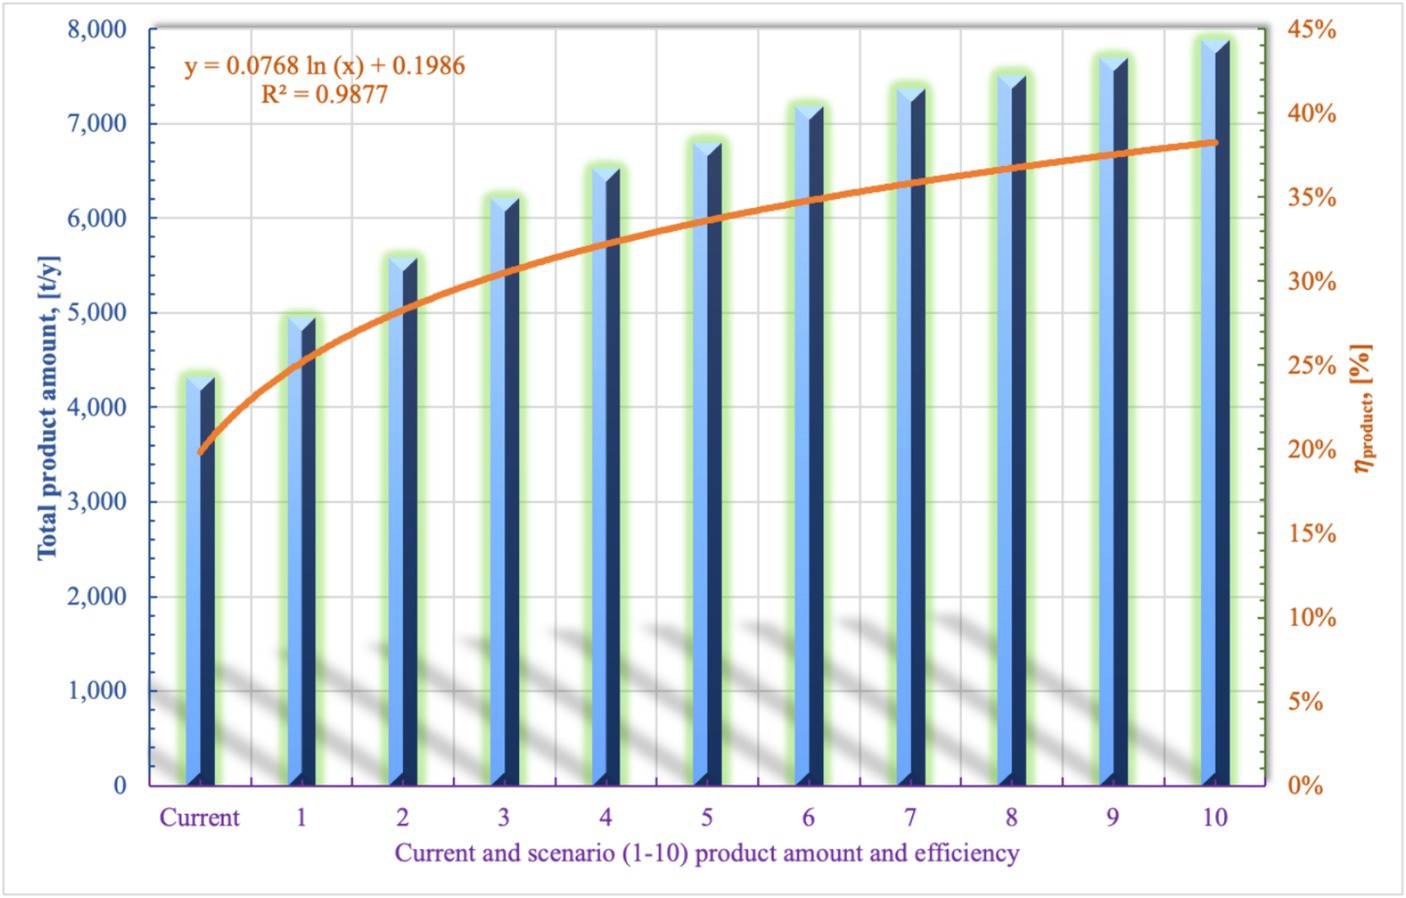
Figure 5. Current and scenario product amount and efficiency chart.
The volumetric changes related to the quantities in the process stages of milk and milk products production and the applied milk design and equipment were analyzed, optimizations were implemented and the optimum cases were established.
Figure 6 shows the current energy input and the 10 scenarios for the factory’s EECT. The R2 value was 0.9967, and the equation was y = −38.08 ln (x) + 397.7. The logarithmic slope clearly indicates that when the optimization approach is applied to the factory’s energy inputs, the EECT may be visibly lowered. The case study results (EECT) can be accessed based on the research conducted by Nathaphan and Therdyothin (2023).
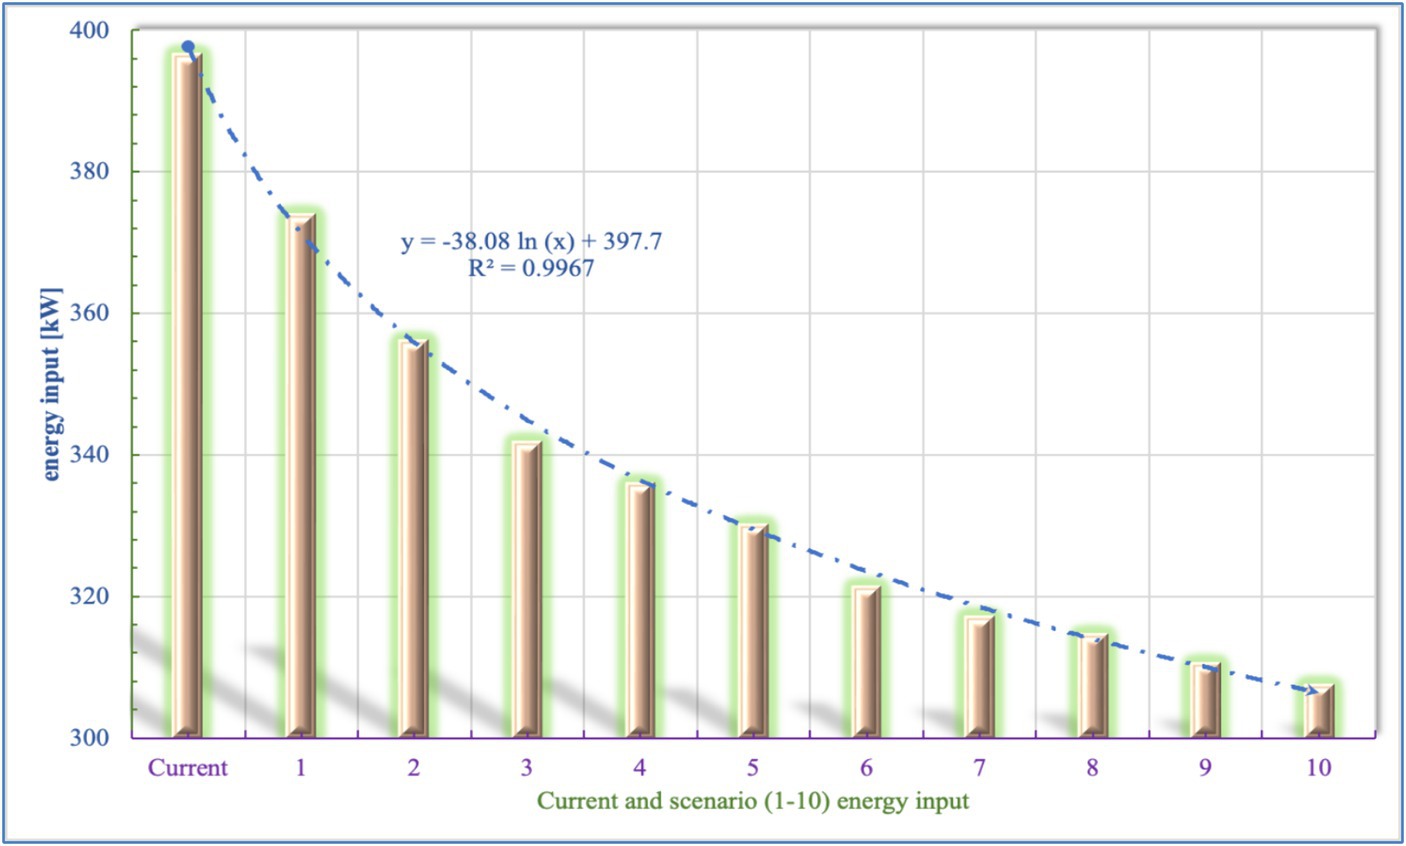
Figure 6. Current and scenario energy input chart.
Regression analyses and equations were created by establishing the correlation between the current situation in the factory and the scenarios to find the optimal situation for the factory, resulting in an increase in productivity. In addition, scatter plotting the equations; R2 = 0.98. Because R2 is close to 1, it is important to conclude that the data can be obtained from the scale and that the anaerobic power test is accurate and can be represented mathematically. Statistical significance was set at p < 0.05.
Figure 7 illustrates a comparison of the product and energy efficiencies in the current and scenarios. The R2 value was 0.9877, and the equation y = 0.07688 ln (x) + 0.1986. The logarithmic slope illustrates that when the optimization approach is utilized for the factory’s products, energy efficiency may be significantly increased by optimization.
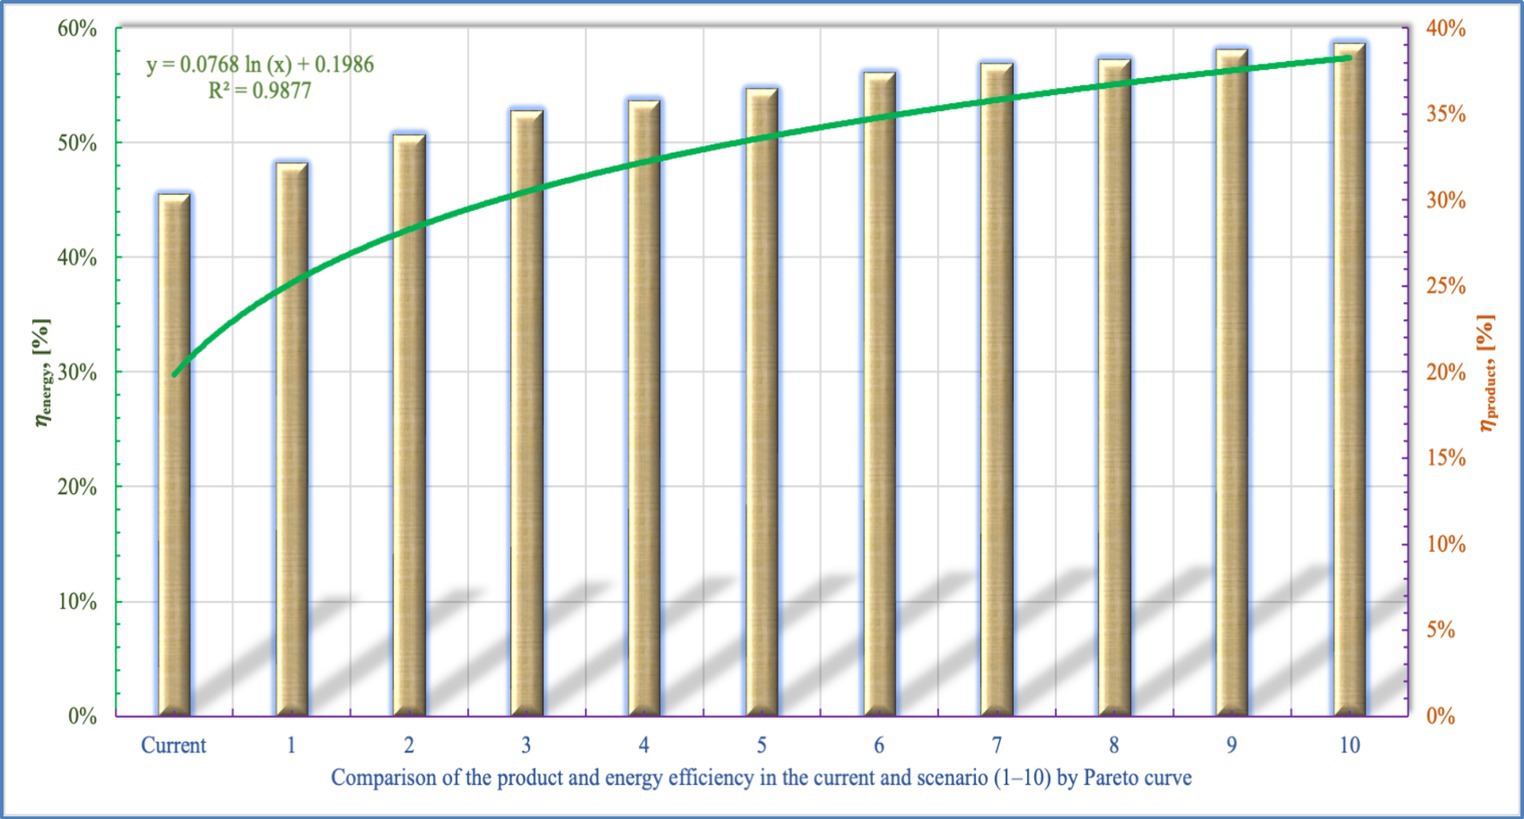
Figure 7. Comparison of the product and energy efficiency in the current and scenarios curve.
Figure 8 illustrates the outcomes of a plant’s energy and production efficiency. The current factory’s energy efficiency is 45%, and it may grow from 48.2 to 58.7% when scenarios are configured using optimizations. Although the current factory’s production efficiency is 21.2%, it can be seen in several situations that it may improve to 38.6% with the implemented modifications. Bühler et al. (2019) achieved a 48% reduction in electricity input and a 35% decrease in heat rate through electrification. Lincoln et al. (2022) accomplished a 21% energy savings through process integration and electrification in efficient milk evaporation systems. Volume and design changes in the production of milk and dairy products were made to ensure more efficient production through optimization. Energy efficiency was also achieved by optimizing production efficiency. Production and energy improvements were achieved by using production methods (design and volumetric changes) and heat transfer methods for some similar energy efficiencies carried out in the dairy industry and applied in this study. Therefore, several comparable energy efficiency studies of the dairy industry have been conducted, and a few of them are included in this study. These scenario analyses are compatible with studies in literature, and it has been proven that energy efficiency will develop under different conditions because of optimization procedures in the dairy industry.
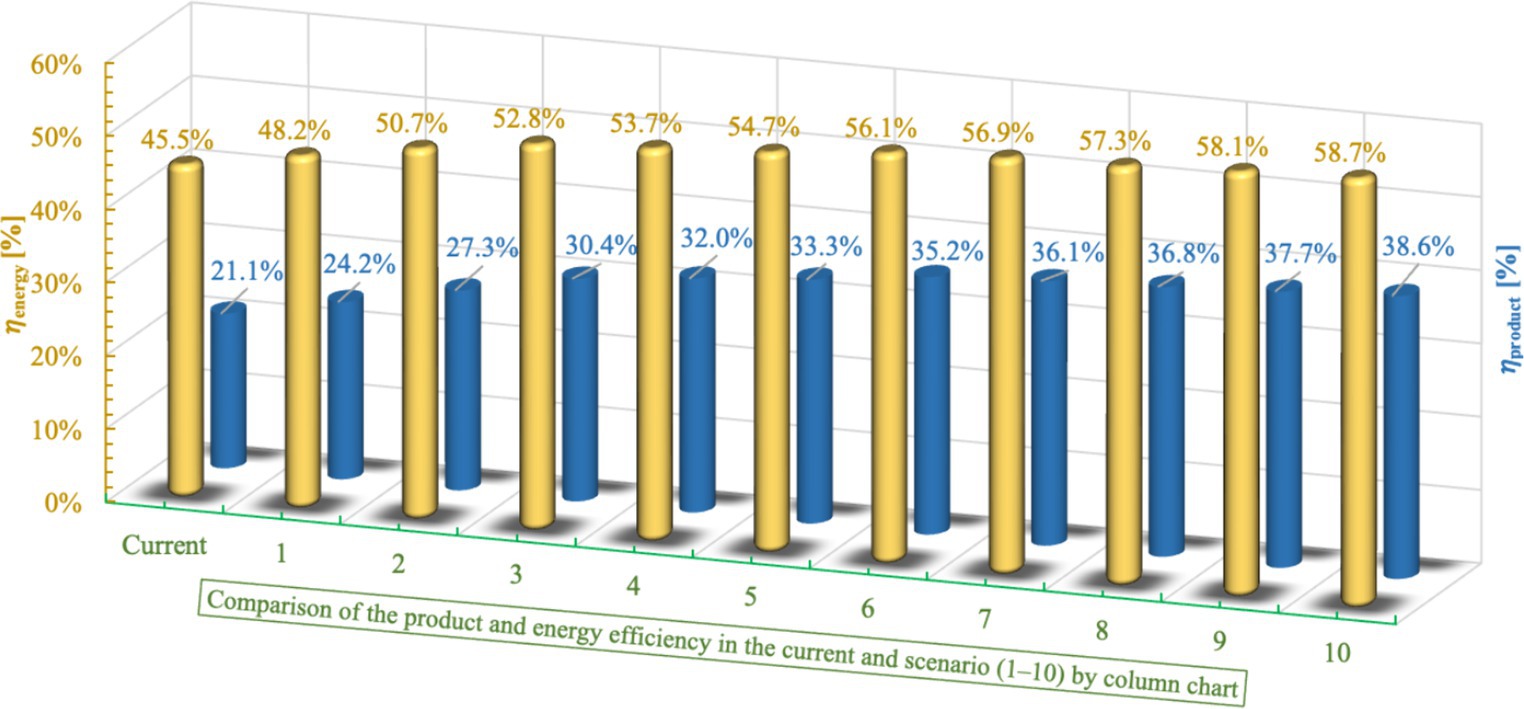
Figure 8. Comparison of the product and energy efficiency in the current and scenarios chart.
In Figure 9, the performance analysis of MLP networks began with the validation of the training phase. The model’s performance was assessed by feeding input data to subsequent layers, comparing output data with actual data, and sending back data to minimize errors. The model’s MSE values decreased with each epoch, as expected. The training phase showed a decrease in MSE values for each epoch, indicating a reduction in errors. This approach was crucial in enhancing the performance of MLP networks.
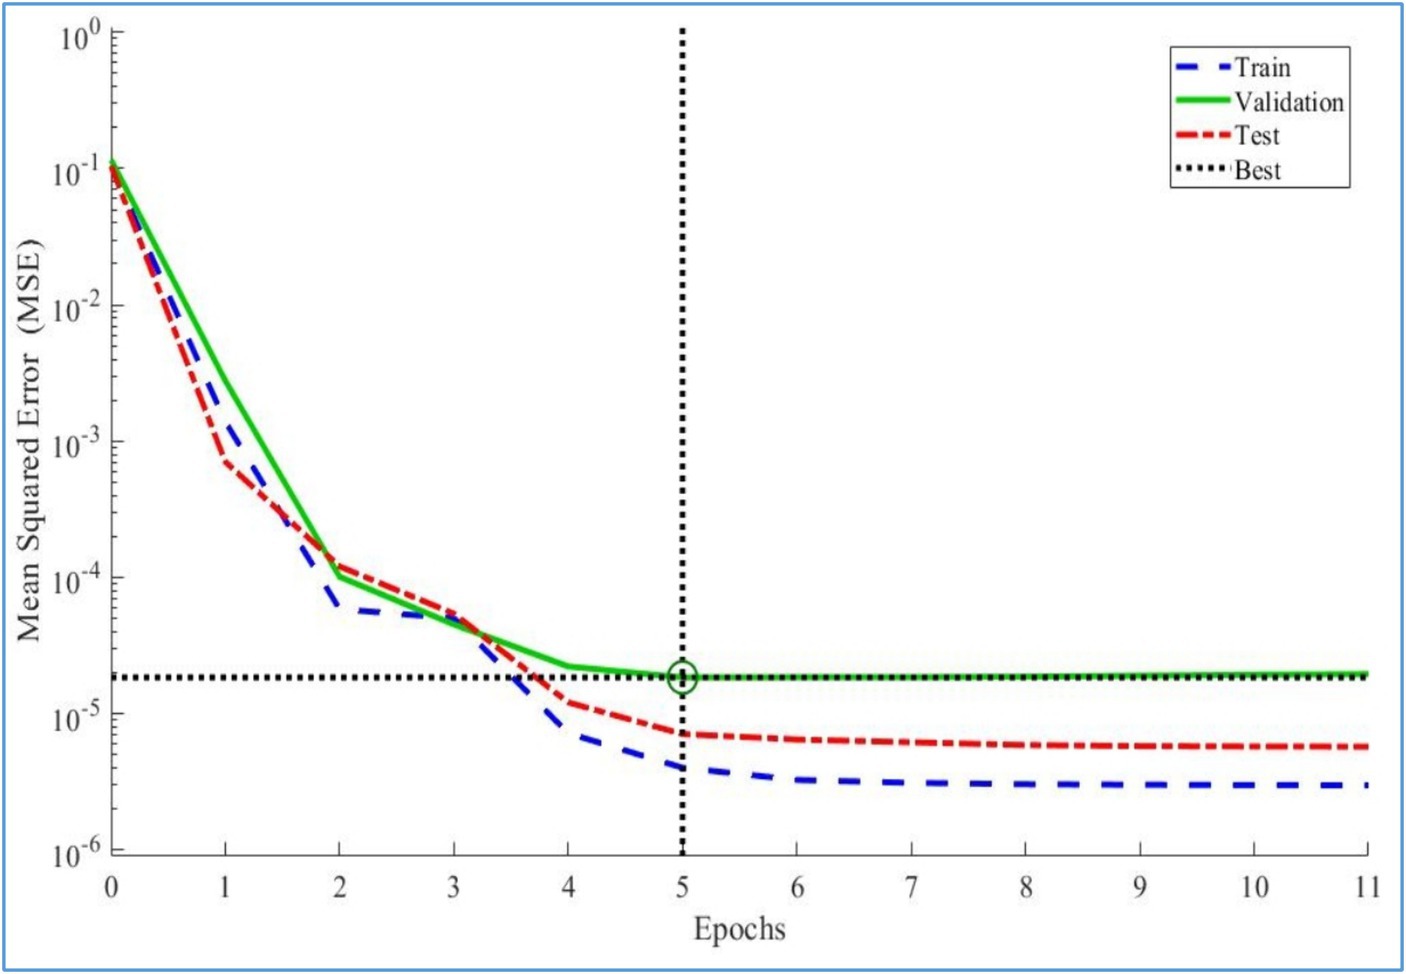
Figure 9. Training performance graph for the MLP model.
In Figure 10, the training phase of the MLP model was accomplished when the MSE values reached their lowest values for all three datasets. The error histogram and training performance graph showed that the error values for the training, validation, and test datasets were generally close to the zero-error line, with low numerical errors. These findings reveal that the training phase of the progressed MLP model is ideally fulfilled.
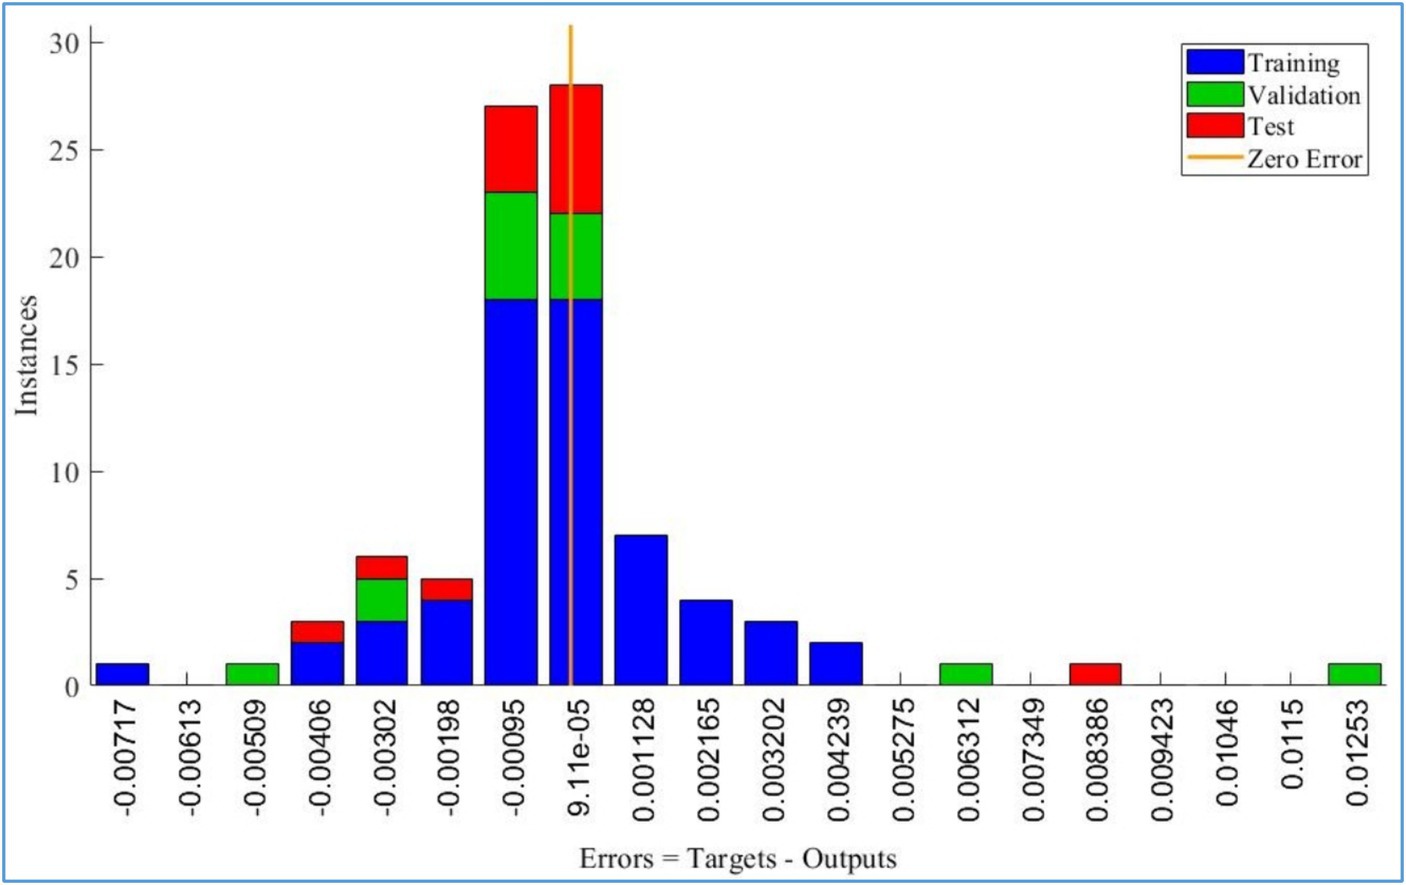
Figure 10. Error histogram for the ANN model.
Figure 11 displays the regression plot generated by the trained ANN model. Upon examining the graphs provided for the training, validation, test, and all data sets individually, it is evident that the data points align with the regression line. It is important to ensure that the R values for each dataset are close to 1. The regression plot results indicate that the developed ANN model was trained effectively.
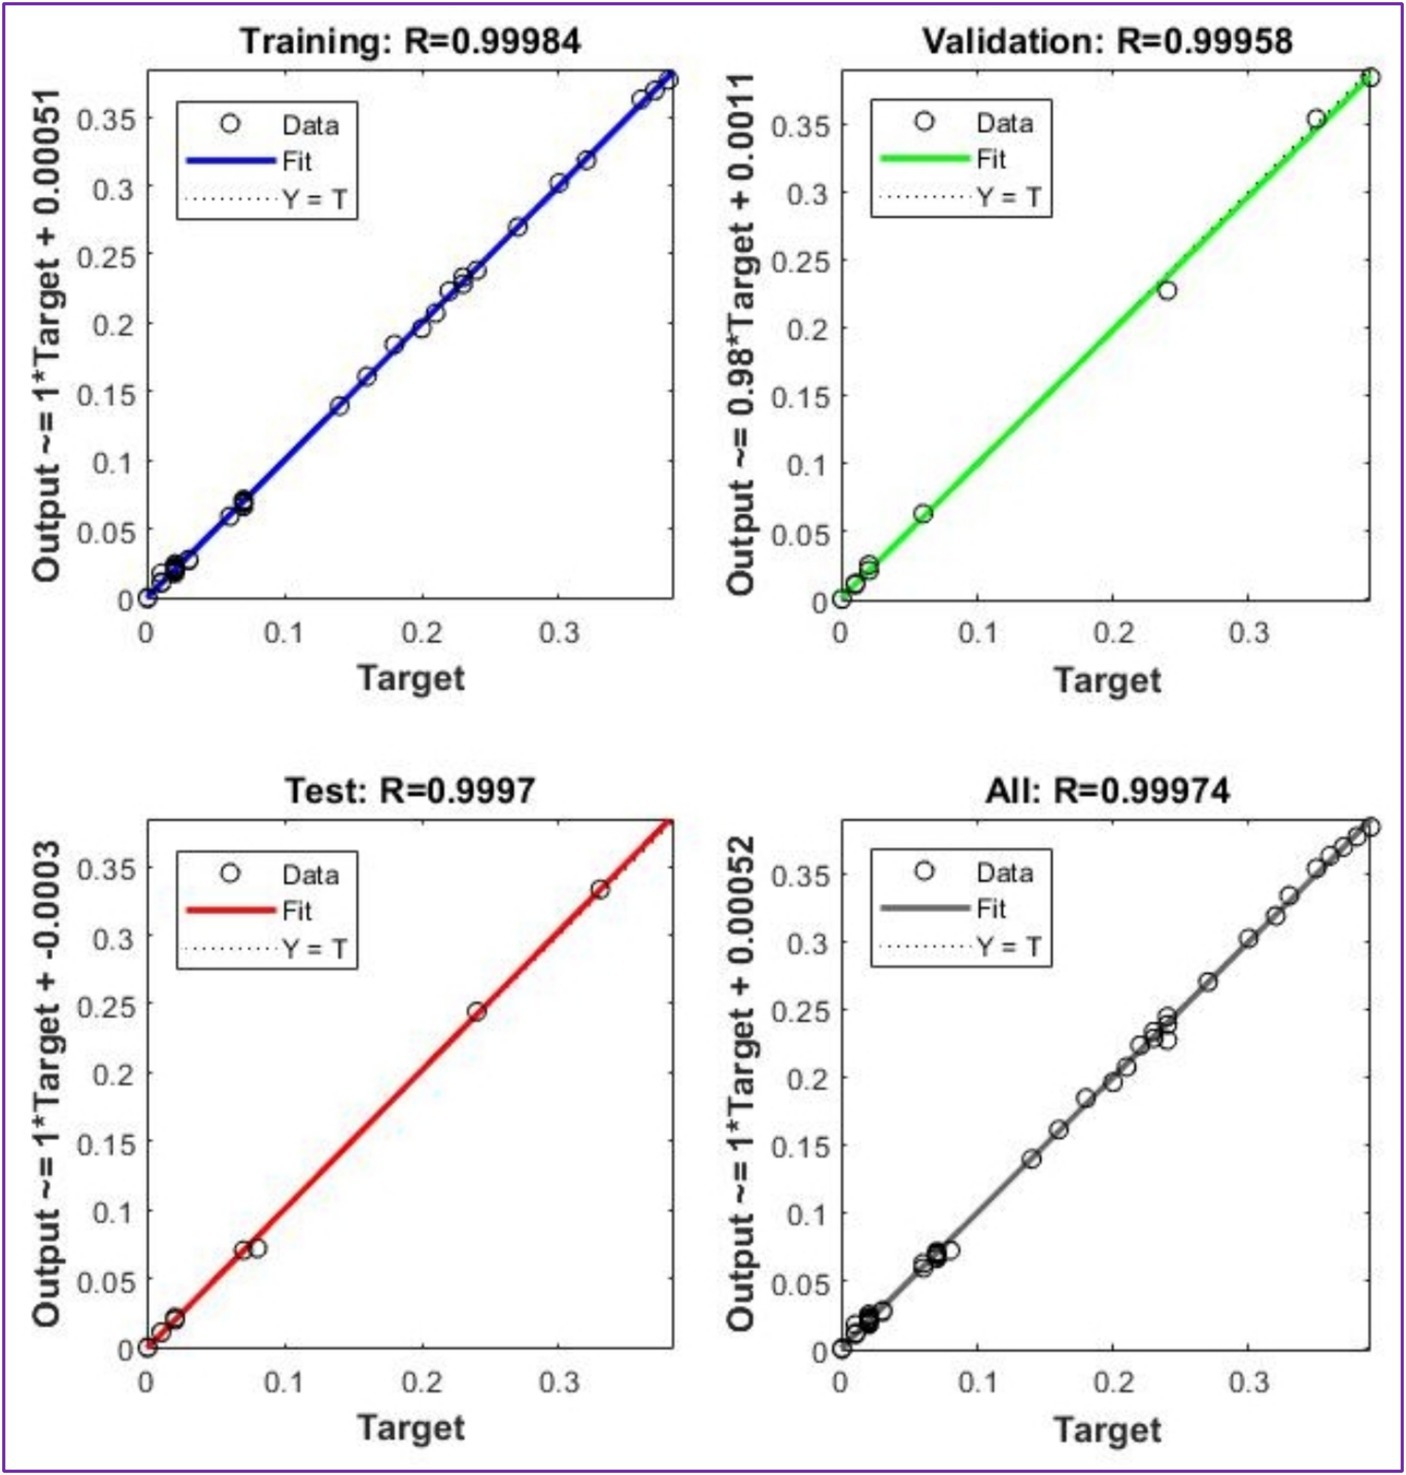
Figure 11. The regression plot of the trained ANN model.
In Figure 12, the MLP model’s prediction performance was evaluated after verifying its training phase. The model’s production efficiency values were compared with actual values, revealing perfect settlement between the MLP model and actual data points. This perfect harmony indicates that the MLP model may precisely forecast dairy factory production values, demonstrating its high accuracy in predicting efficiency values. Figure 12 illustrates the experimental efficiency values for each data point.
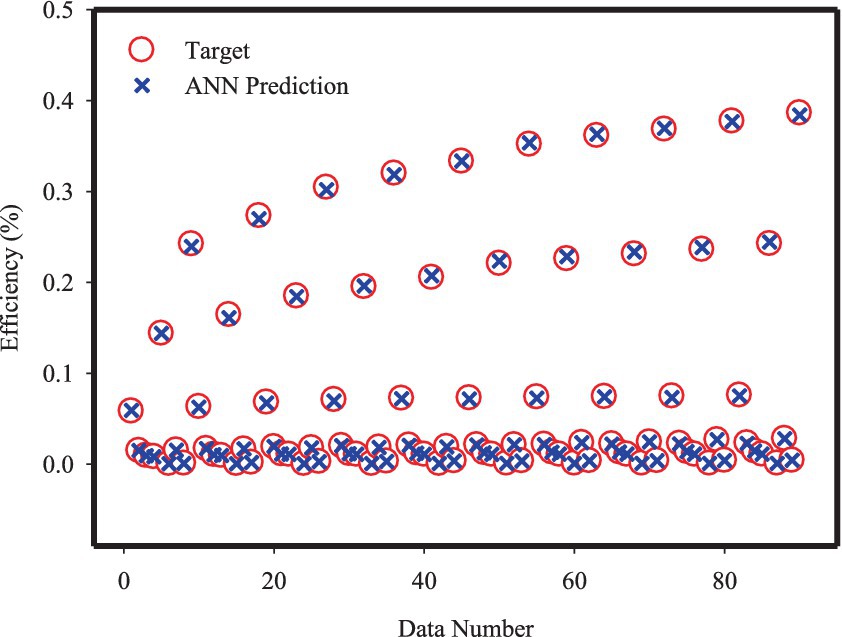
Figure 12. Compatibility of MLP outputs with actual efficiency values.
The MLP model’s efficiency values were compared with actual values, and the model’s estimation errors were assessed. The MoD values for 90 data points were calculated, showing a close-to-zero-deviation region in the graph line. The mean MoD value for the 90 data points was −0.004%, indicating a close-to-zero deviation ratio between the MLP model and actual values (Figure 13).
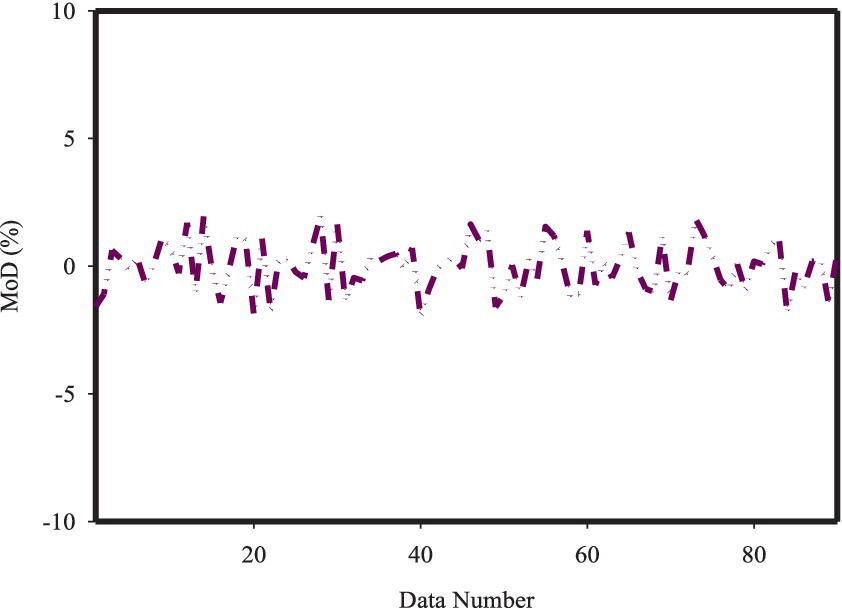
Figure 13. The deviation rates between the efficiency values obtained from the MLP model and the actual values.
The MLP model was used to predict dairy factory production values with very low errors, as demonstrated by the low deviation rates and differences between the MLP model’s efficiency values and actual efficiency values. The MLP model was developed to accurately guess the factory’s production values, resulting in minimal errors in the model’s performance (Figure 14).
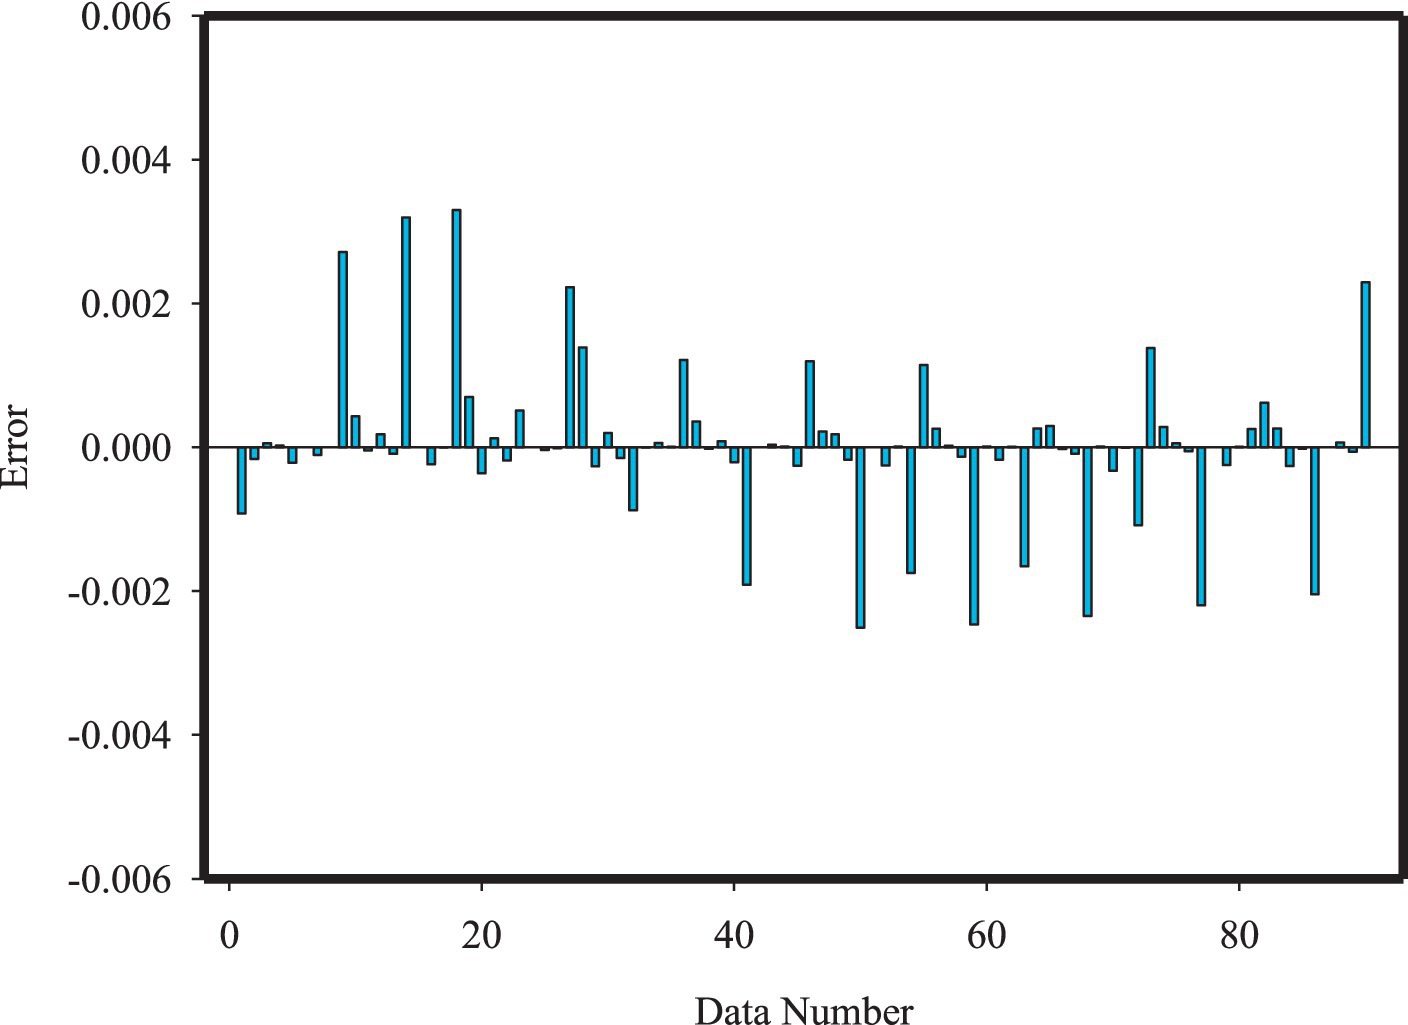
Figure 14. Errors between the efficiency values obtained from the MLP model and the actual values.
The efficiency values in Figure 15 are on the x-axis, while the efficiency values from the MLP model are on the y-axis. All data points are on the zero-error line, indicating that the estimated values from the model are very close to the actual values. The MSE value was calculated to be 4.02E-06, and the R2 value was 0.99984, indicating that the advanced MLP model may accurately compute the production values of a dairy factory.
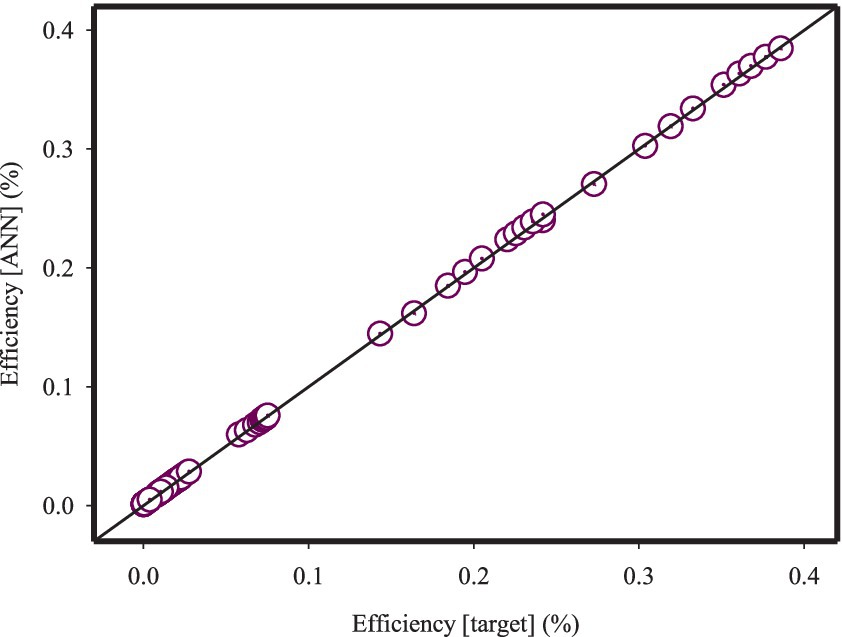
Figure 15. The efficiency values obtained from the MLP model against the actual efficiency values.
It is important that critical parameters, which can be determined as a result of long-term experimental studies, can be determined with high accuracy without the need for experimental studies. Obtaining important parameters without the need for experimental studies by using the artificial intelligence tool developed in this study will provide great advantages in terms of both financial and time. For this reason, using the proposed approach will provide significant advantages in industrial applications and scientific studies.
There has been a recent shift toward product solutions in the field of science-based AI research, but this field is still in its infancy. This study demonstrates the necessity of implementing artificial intelligence (AI) and Multilayer Perceptron (MLP) models in the food processing industry. The MLP model was specifically designed to evaluate the effectiveness of AI tools in estimating the energy and production efficiency of a dairy factory. The developed MLP model was trained using data obtained from a factory in the Cappadocia region that produces various dairy products, such as main product as APLA, and other products as CPC, PCP, TCP, WCP, BPP, YPO, and APY. This study indicated that AI applications increased dairy production efficiency from 20 to 40%. The study uses 90 real-time datasets to study the impact of AI algorithms on industrial production processes. The Levenberg–Marquardt training algorithm was used in the MLP network model, with Tan-Sig and Purelin transfer functions used in the hidden and output layers. The model, with 13 neurons in the hidden layer, predicted dairy factory productivity values with an average deviation of −0.04% from real data. The low MSE value and closeness of the R2 value to 1 confirm that the ANN model was developed to make predictions with high accuracy. The study findings showed that an MLP network model trained using real production data can accurately predict dairy plant productivity. The proposed AI-based approach shows promising results for predicting the energy and product efficiency in dairy factory operations. Compared with traditional empirical equations, ANN models offer better generalizability and accuracy by allowing them to represent a set of experiments.
This study contributes to the existing body of knowledge by outlining a strategy for estimating production and energy efficiency in dairy plants by AI tools. With production-level energy data readily available, the MLP model excelled at supervised learning. By better utilizing the available energy, this study reveals how AI can be used to enhance processes and systems to reduce the environmental impact of salvage operations. This study would allow more researchers and familiar readers to apply the study’s findings to the dairy industry. Other researchers will almost certainly cite it.
The original contributions presented in the study are included in the article/supplementary material, further inquiries can be directed to the corresponding author.
OOT: Writing – review & editing, Writing – original draft, Methodology, Investigation, Conceptualization. ABÇ: Writing – review & editing, Writing – original draft, Visualization, Validation, Supervision, Software, Investigation, Data curation, Conceptualization.
The author(s) declare that no financial support was received for the research, authorship, and/or publication of this article.
This case study was supported by the Biçenler Dairy Agriculture and Animal Products Industry Trade Limited Company for energy and production data of AI. Thank appreciation to the factory management for their assistance with the plant production and energy data systems. The authors also thank them for their invaluable advice and support during this investigation.
The authors declare that the research was conducted in the absence of any commercial or financial relationships that could be construed as a potential conflict of interest.
All claims expressed in this article are solely those of the authors and do not necessarily represent those of their affiliated organizations, or those of the publisher, the editors and the reviewers. Any product that may be evaluated in this article, or claim that may be made by its manufacturer, is not guaranteed or endorsed by the publisher.
Azadbakht, M., Aghili, H., Ziaratban, A., and Torshizi, M. V. (2017). Application of artificial neural network method to exergy and energy analyses of fluidized bed dryer for potato cubes. Energy 120, 947–958. doi: 10.1016/j.energy.2016.12.006
Barthwal, R., Kathuria, D., Joshi, S., Kaler, R., and Singh, N. (2024). New trends in the development and application of artificial intelligence in food processing. Innov. Food Sci. Emer. Techn. 92:103600. doi: 10.1016/j.ifset.2024.103600
Başaran, A., Yılmaz, T., Azgın Şükrü, T., and Çivi, C. (2021). Comparison of drinking milk production with conventional and novel inductive heating in pasteurization in terms of energetic, exergetic, economic and environmental aspects. J. Clean. Prod. 317:128280. doi: 10.1016/j.jclepro.2021.128280
Bonakdari, H., and Zaji, A. H. (2016). Open channel junction velocity prediction by using a hybrid self-neuron adjustable artificial neural network. Flow Measur. Instrum. 49, 46–51. doi: 10.1016/j.flowmeasinst.2016.04.003
Bühler, F., Zühlsdorf, B., Nguyen, T.-V., and Elmegaard, B. (2019). A comparative assessment of electrification strategies for industrial sites: case of milk powder production. Appl. Energy 250, 1383–1401. doi: 10.1016/j.apenergy.2019.05.071
Cengel, Y. A., Boles, M. A., and Kanoglu, M. (2019). Thermodynamics: An engineering approach. New York: Mcgraw-Hill Education.
Çolak, A. B. (2021a). Experimental analysis with specific heat of water based zirconium oxide nanofluid on the effect of training algorithm on predictive performance of artificial neural network. Heat Tran. Res. 52, 67–93. doi: 10.1615/HeatTransRes.2021036697
Çolak, A. B. (2021b). A novel comparative investigation of the effect of the number of neurons on the predictive performance of the artificial neural network: an experimental study on the thermal conductivity of ZrO2 nanofluid. Int. J. Energy Res. 45, 18944–18956. doi: 10.1002/er.6989
Erbay, Z., and Koca, N. (2012). Energetic, exergetic, and exergoeconomic analyses of spray-drying process during white cheese powder production. Dry. Technol. 30, 435–444. doi: 10.1080/07373937.2011.647183
Esmaeily, R., Razavi, M. A., and Razavi, S. H. (2024). A step forward in food science, technology and industry using artificial intelligence. Trends Food Sci. Technol. 143:104286. doi: 10.1016/j.tifs.2023.104286
Fang, Z., Larson, D. L., and Fleishmen, G. (1995). Exergy analysis of a milk processing system. Trans. ASAE 38, 1825–1832. doi: 10.13031/2013.28011
Funes, E., Allouche, Y., Beltrán, G., and Jiménez, A. (2015). A review: artificial neural networks as tool for control food industry process. J. Sensor. Tech. 5, 28–43. doi: 10.4236/jst.2015.51004
Guine, R. P. F. (2019). The use of artificial neural networks (ANN) in food process engineering. Int. J. Food Eng. 5, 15–21. doi: 10.18178/ijfe.5.1.15-21
Huang, W., Shu, L., and Jiang, W. (2016). A gradient approach to the optimal design of CUSUM charts under unknown mean-shift sizes. J. Qual. Tech. 48, 68–83. doi: 10.1080/00224065.2016.11918152
Karimi, M., Alibak, A. H., Alizadeh, S. M. S., Sharif, M., and Vaferi, B. (2022). Intelligent modeling for considering the effect of bio-source type and appearance shape on the biomass heat capacity. Measurement 189:110529. doi: 10.1016/j.measurement.2021.110529
Khan, A., and Turowski, K. (2016). A survey of current challenges in manufacturing industry and preparation for industry 4.0. Proc. First Int. Sci. Conf. 450, 15–26. doi: 10.1007/978-3-319-33609-1_2
Khan, Z., Zuhra, S., Islam, S., Raja, M. A. Z., and Ali, A. (2023). Modeling and simulation of Maxwell nanofluid flows in the presence of Lorentz and Darcy–Forchheimer forces: toward a new approach on Buongiorno’s model using artificial neural network (ANN). Eur. Phys. J. Plus 138:107. doi: 10.1140/epjp/s13360-022-03583-w
Lamrini, B., Della Valle, G., Trelea, I. C., Perrot, N., and Trystram, G. (2012). A new method for dynamic modelling of bread dough kneading based on artificial neural network. Food Cont. 26, 512–524. doi: 10.1016/j.foodcont.2012.01.011
León-Roque, N., Abderrahim, M., Nuñez-Alejos, L., Arribas, S. M., and Condezo-Hoyos, L. (2016). Prediction of fermentation index of cocoa beans (Theobroma cacao L.) based on color measurement and artificial neural networks. Talanta 161, 31–39. doi: 10.1016/j.talanta.2016.08.022
Li, J. (2021). Nonparametric adaptive CUSUM chart for detecting arbitrary distributional changes. J. Qual. Tech. 53, 154–172. doi: 10.1080/00224065.2019.1694398
Lincoln, B. J., Kong, L., Pineda, A. M., and Walmsley, T. G. (2022). Process integration and electrification for efficient milk evaporation systems. Energy 258:124885. doi: 10.1016/j.energy.2022.124885
Margolies, B., Adams, M. C., Pranata, J., Gondoutomo, K., and Barbano, D. M. (2017). Effect of uncertainty in composition and weight measures in control of cheese yield and fat loss in large cheese factories. J. Dairy Sci. 100, 6822–6852. doi: 10.3168/jds.2016-12295
Momenzadeh, L., Zomorodian, A., and Mowla, D. (2011). Experimental and theoretical investigation of shelled corn drying in a microwave-assisted fluidized bed dryer using artificial neural network. Food Bioprod. Process. 89, 15–21. doi: 10.1016/j.fbp.2010.03.007
Montgomery, D. C., Peck, E. A., and Vining, G. G. (2001). Introduction to linear regression analysis. 3rd Edn. New York: John Wiley & Sons.
Nathaphan, S., and Therdyothin, A. (2023). Effectiveness evaluation of the energy efficiency and conservation measures for stipulation of Thailand energy management system in factory. J. Clean. Prod. 383:135442. doi: 10.1016/j.jclepro.2022.135442
Prabhakar, P. K., Srivastav, P. P., and Murari, K. (2015). Energy consumption during manufacturing of different dairy products in a commercial dairy plant: a case study. Asian J. Dairy Food Res. 34, 98–103. doi: 10.5958/0976-0563.2015.00020.2
Rehman, K. U., Çolak, A. B., and Shatanawi, W. (2022). Artificial neural networking (ANN) model for convective heat transfer in thermally magnetized multiple flow regimes with temperature stratification effects. Math 10:2394. doi: 10.3390/math10142394
Rehman, K. U., Shatanawi, W., and Çolak, A. B. (2023). Computational analysis on magnetized and non-magnetized boundary layer flow of casson fluid past a cylindrical surface by using artificial neural networking. Math 11:326. doi: 10.3390/math11020326
Reis, B. D., Oliveira, F., Santos-Ebinuma, V. C., Filletti, E. R., and Baptista Neto, A. (2023). Assessment of artificial neural networks to predict red colorant production by Talaromyces amestolkiae. Bioprocess Biosyst. Eng. 46, 147–156. doi: 10.1007/s00449-022-02819-4
Sarkar, D. (2022). Advanced materials management for Indian construction industry by application of statistical process control tools. Mater. Today Proceed. 62, 6934–6939. doi: 10.1016/j.matpr.2021.12.082
Shilpa, B., and Leela, V. (2023). Galerkin finite element analysis of heat and mass transfer of Jeffrey, Maxwell and Oldroyd-B nanofluids in a vertical annulus with an induced magnetic field and a non–uniform heat source/sink. Int. J. Amb. Energy 44, 1887–1903. doi: 10.1080/01430750.2023.2196988
Silva, S. F., Anjos, C. A., Cavalcanti, R. N., and Celeghini, R. M. (2015). Evaluation of extra virgin olive oil stability by artificial neural network. Food Chem. 179, 35–43. doi: 10.1016/j.foodchem.2015.01.100
Simic, V. M., Rajković, K. M., Stojičević, S. S., Veličković, D. T., Nikolić, N., Lazić, M. L., et al. (2016). Optimization of microwave-assisted extraction of total polyphenolic compounds from chokeberries by response surface methodology and artificial neural network. Separ. Purif. Tech. 160, 89–97. doi: 10.1016/j.seppur.2016.01.019
Srinivasacharya, D., and Kumar, R. S. (2022). Artificial neural network modeling of the Casson fluid flow over unsteady radially stretching sheet with Soret and Dufour effects. J. Therm. Anal. Calorim. 147, 14891–14903. doi: 10.1007/s10973-022-11694-w
Tripathy, P. P., and Kumar, S. (2009). Neural network approach for food temperature prediction during solar drying. Int. J. Ther. Sci. 48, 1452–1459. doi: 10.1016/j.ijthermalsci.2008.11.014
UCCET (The Union of Chambers and Commodity Exchanges of Turkey): Industry Directorate (2023). Capacity criteria 3112 Milk and products capacity calculation. Turkey: UCCET.
Keywords: food process, dairy milk production, artificial intelligence, modeling, energy efficiency
Citation: Oztuna Taner O and Çolak AB (2024) Dairy factory milk product processing and sustainable of the shelf-life extension with artificial intelligence: a model study. Front. Sustain. Food Syst. 8:1344370. doi: 10.3389/fsufs.2024.1344370
Edited by:
Dimas Rahadian Aji Muhammad, Sebelas Maret University, IndonesiaReviewed by:
Seyed-Hassan Miraei Ashtiani, Dalhousie University, CanadaCopyright © 2024 Oztuna Taner and Çolak. This is an open-access article distributed under the terms of the Creative Commons Attribution License (CC BY). The use, distribution or reproduction in other forums is permitted, provided the original author(s) and the copyright owner(s) are credited and that the original publication in this journal is cited, in accordance with accepted academic practice. No use, distribution or reproduction is permitted which does not comply with these terms.
*Correspondence: Oznur Oztuna Taner, b290YW5lckBha3NhcmF5LmVkdS50cg==
Disclaimer: All claims expressed in this article are solely those of the authors and do not necessarily represent those of their affiliated organizations, or those of the publisher, the editors and the reviewers. Any product that may be evaluated in this article or claim that may be made by its manufacturer is not guaranteed or endorsed by the publisher.
Research integrity at Frontiers
Learn more about the work of our research integrity team to safeguard the quality of each article we publish.