
94% of researchers rate our articles as excellent or good
Learn more about the work of our research integrity team to safeguard the quality of each article we publish.
Find out more
ORIGINAL RESEARCH article
Front. Sustain. Food Syst., 31 January 2024
Sec. Climate-Smart Food Systems
Volume 8 - 2024 | https://doi.org/10.3389/fsufs.2024.1321472
This article is part of the Research TopicModelling Approaches for Climate Variability and Change Mitigation and Adaptation in Resource Constrained Farming SystemsView all 12 articles
 Kamlesh Kumar1,2
 C. M. Parihar1*D. R. Sena3Samarth Godara4Kiranmoy Patra1
 Ayan Sarkar1K. Srikanth Reddy1P. C. Ghasal2
 Sneha Bharadwaj5A. L. Meena2T. K. Das1S. L. Jat6D. K. Sharma1Y. S. Saharawat7
 Mahesh K. Gathala8Upendra Singh9
 Hari Sankar Nayak1,10
Context: Agricultural field experiments are costly and time-consuming, and their site-specific nature limits their ability to capture spatial and temporal variability. This hinders the transfer of crop management information across different locations, impeding effective agricultural decision-making. Further, accurate estimates of the benefits and risks of alternative crop and nutrient management options are crucial for effective decision-making in agriculture.
Objective: The objective of this study was to utilize the Crop Environment Resource Synthesis CERES-Wheat model to simulate crop growth, yield, and nitrogen dynamics in a long-term conservation agriculture (CA) based wheat system. The study aimed to calibrate the model using data from a field experiment conducted during the 2019-20-2020-21 growing seasons and evaluation it with independent data from the year 2021–22.
Method: Crop simulation models, such as the Crop Environment Resource Synthesis CERES-Wheat (DSSAT v 4.8), may provide valuable insights into crop growth and nitrogen dynamics, enabling decision makers to understand and manage production risk more effectively.
Therefore, the present study employed the CERES-Wheat (DSSAT v 4.8) model and calibrated it using field data, including plant phenological phases, leaf area index, aboveground biomass, and grain yield from the 2019-20-2020-21 growing seasons. An independent dataset from the year 2021–22 was used for model evaluation. The model was used to investigate the relationship between growing degree days (GDD), temperature, nitrate and ammonical concentration in soil, and nitrogen uptake by the crop. Additionally, the study explored the impact of contrasting tillage practices and fertilizer nitrogen management options on wheat yields. The experimental site is situated at ICAR-Indian Agricultural Research Institute (IARI), New Delhi, representing Indian Trans-Gangetic Plains Zone (28o 40’N latitude, 77o 11’E longitude and an altitude of 228 m above sea level). The treatments consist of four nitrogen management options, viz., N0 (zero nitrogen), N150 (150 kg N ha−1 through urea), GS (Green seeker based urea application) and USG (urea super granules @150 kg N ha−1) in two contrasting tillage systems, i.e., CA-based zero tillage (ZT) and conventional tillage (CT).
Result: The outcomes exhibited favorable agreement between the model’s simulations and the observed data for crop phenology (With less than 2 days variation in 50% onset of flowering), grain and biomass yield (Root mean square error; RMSE 336 kg ha−1 and 649 kg ha−1, respectively), and leaf area index (LAI) (RMSE 0.28 & normalized RMSE; nRMSE 6.69%). The model effectively captured the nitrate-N (NO3−-N) dynamics in the soil profile, exhibiting a remarkable concordance with observed data, as evident from its low RMSE = 12.39 kg ha−1 and nRMSE = 13.69%. Moreover, as it successfully simulated the N balance in the production system, the nitrate leaching and ammonia volatilization pattern as described by the model are highly useful to understand these critical phenomena under both conventional tillage (CT) and CA-based Zero Tillage (ZT) treatments.
Conclusion: The study concludes that the DSSAT-CERES-Wheat model has significant potential to assess the impacts of tillage and nitrogen management practices on crop growth, yield, and soil nitrogen dynamics in the western Indo-Gangetic Plains (IGP) region. By providing reliable forecasts within the growing season, this modeling approach can facilitate better planning and more efficient resource management.
Future implications: The successful implementation of the DSSAT-CERES-Wheat model in this study highlights its applicability in assessing crop performance and soil dynamics. Future research should focus on expanding the model’s capabilities by reducing its sensitivity to initial soil nitrogen levels to refine its predictions further. Moreover, the model’s integration with decision support systems and real-time data can enhance its usefulness in aiding agricultural decision-making and supporting sustainable crop management practices.
In recent decades, Indian agriculture has made significant strides toward achieving self-sufficiency in food production. The dominant rice-wheat cropping system in the Indo-Gangetic Plains (IGP) region has played a crucial role for ensuring food security (Jat et al., 2019; Sidhu et al., 2019). Wheat, as a major cereal crop, is vital for food and nutritional security globally and in India as well. However, the tillage practices under conventional puddled rice cultivation have many negative impacts on soil health, and wheat sowing and establishment. As an alternative, conservation agriculture based zero tillage (ZT)-based maize-wheat cropping system improves the soil health and facilitates timely planting and establishment of wheat (Parihar et al., 2016). The maize-wheat (MW) system is the third most important cropping system in the region and has the potential to expand in the face of emerging water crisis in the Indo-Gangetic Plains (IGP) (Jat et al., 2019; Sidhu et al., 2019). Conservation agriculture, with its core principles of minimal soil disturbance, efficient residue cover/retention, and crop diversification, has scientifically been proven to enhance soil health and boost crop productivity (Jat et al., 2019; Sidhu et al., 2019). Additionally, with better soil condition, ZT improves the plant metabolic activities, yield, leaf area index (LAI), early canopy development and crop root and shoot architecture (Norman and Campbell, 1989; Nayak et al., 2022). Understanding the complex interaction of soil, plant, and atmospheric continuum and its effect on wheat growth and development under contrasting soil and crop establishment methods (as in ZT based vs. conventional maize-wheat system), is a challenging task and it requires extensive field experimentation and simulation exercises for detailed understanding.
Nitrogen, in both conventional (CT) and conservation agriculture based zero tillage (ZT), is a vital element for plant growth and development and it is commonly applied through fertilizers due to its widespread deficiency in soil. The economic and environmental cost–benefit of fertilizer use is a major challenge in the era of rising production costs and environmental sustainability issues (Rosswall and Paustian, 1984). Nitrogen use efficiency (NUE) is one of the lowest in cereal-based agroecosystems, with cereals only taking up 40–60% of the applied nitrogen (Herrera et al., 2016). Among cereals, rice and wheat have the least NUE (<30–40%) (Norton et al., 2015; Taulemesse et al., 2015; Herrera et al., 2016). In the pursuit of enhancing grain yield, farmers frequently resort to higher applications of nitrogen (N) fertilizer. Unfortunately, this practice leads to the excessive loss of nitrogen, nutrient imbalance, groundwater contamination and the greenhouse gasses emission, which are detrimental to environmental health and have socio-economic consequences (Hawkesford, 2017; Huang et al., 2017). In order to enhance nitrogen use efficiency (NUE) and minimize nitrogen losses, the adoption of novel fertilizer sources such as slow-release fertilizers and urea deep placement (UDP) technology are promising available technology, yet their feasibility in most of the crop production systems are not evaluated. This technique entails the deployment of large-sized fertilizer granules or briquettes of urea super granules (USG), which are positioned at a depth of 7–10 cm in close proximity to the crop’s root zone (IFDC, 2013, 2015). Previous research has demonstrated that these technologies can result in increased crop yields and reduced fertilizer requirements under conventional crop management practices, including traditional intensive tillage methods, among others. However, their effectiveness under ZT-based cropping systems is yet to be fully evaluated for agricultural productivity, profitability, and environmental foot print.
To enhance the efficiency of nitrogenous fertilizer use, it is essential to comprehend the crop’s peak nitrogen demand and uptake patterns. The fate of mineral nitrogen in the crop-soil system plays a vital role in agricultural productivity and must be carefully managed to optimize crop yields and reduce environmental impact. Considering the complexity and dynamic nature of nitrogen in soil, plant and atmosphere, it is almost impossible to capture and measure the ways it moves in different directions. Indeed, field experiments are valuable in generating useful information for refinement of crop production practices and enhancing crop yield, yet they are costly and time-consuming. Moreover, in agricultural research and field experiments, some parameters can be particularly difficult to measure accurately. This is especially true for dynamic and complex processes, such as nitrogen dynamics, where precise measurements are crucial for understanding and optimizing crop management practices, especially in contrasting tillage conditions. Additionally, the experimental data may possess certain limitations in devising optimal practical management practices as they are affected by diverse factors, such as observation frequency and sample size (Sun et al., 2013). The limitations and challenges associated with measuring these parameters from rigorous field experiments often require innovative approaches, such as advanced computer based simulation techniques, to obtain reliable data and make informed decisions in agriculture.
Dynamic crop growth models simulate crop growth, development and nutrient dynamics to quantify the interactions among the genetic potential of the crop, and environmental factors such as weather, soil, water and management factors in the soil–plant-atmosphere system. These models offer an opportunity to quantify the effect of management factors on crop growth. This quantification facilitates the development of optimal management practices and strategies aimed at improving crop production and enhancing nitrogen use efficiency, specific to particular management and environment interactions. One such model is CERES-wheat in the DSSAT (The Decision Support System for Agrotechnology Transfer) model. Widely adopted, this model allows for daily simulations of crop growth, development, and yield (Jones et al., 2003; Hoogenboom et al., 2021). In recent years, the DSSAT model has been successfully used to simulate the results of long-term experiments (Liu et al., 2011; De Sanctis et al., 2012; Yang et al., 2013). For example, researchers have used these models to predict long-term trends in wheat yields (Timsina and Humphreys 2006; liu et al., 2017), the effects of different N application rates on wheat yield (Wu et al., 2013), crop yields and N dynamics in a 50-year continuous maize production experiment (Liu et al., 2011), simulation of the effects of long-term N fertilization on maize yield and soil C and N dynamics in northeast China (Yang et al., 2013), simulation of SOC dynamics in a low-input maize-wheat cropping system using the DSSAT-CENTURY model (Musinguzi et al., 2014). It is essential to highlight that the CERES-wheat model has not undergone evaluation under differing tillage and nitrogen management practices. Therefrore, to evaluate performance and reliability of CERES-wheat for the simulation of wheat growth, development and soil nitrogen dynamics, we used the CERES-wheat model in our study.
The objectives of this study were:(1) to evaluate the CERES-wheat model for simulating the growth behavior of wheat and soil nitrogen dynamics under emerging CA-based ZT practices and application of novel fertilizer products such as urea super granules (USG); (2) to assess the capabilities of DSSAT in predicting the response of wheat to different inputs like fertilizer nitrogen under different/contrasting soil conditions (ZT vs. CT), and (3) to understand the effects of N doses on crop growth and soil N dynamics under long-term conservation agriculture based maize-wheat system.
The study was conducted in wheat seasons (October–April) of 2019–20, 2020–21 and 2021–22 at the experimental field site (block ‘9B’) of the ICAR-Indian Agricultural Research Institute (IARI) in New Delhi (28°40’N latitude, 77°11’E longitude, and an altitude of approximately 228 m above sea level). The site has been in use for ongoing experiments since monsoon/kharif season of 2012 under the maize-wheat system in permanent plots. The experimental site is located in the Indian Trans-Gangetic Plains Zone (Agro Climatic Zone-VI) with a sub-tropical, semi-arid climate. The average annual rainfall of the site is 735 mm, with a hot and dry summer, a wet monsoon season, and a cold winter. The majority of the rainfall, approximately 80%, occurs during the monsoon season (July to September). At the commencement of the experiment, physico-chemical soil properties were assessed using standard procedures, as delineated by Parihar et al. (2020). The initial soil properties at the start of the experiment are provided in Supplementary Table S1.
This study utilized a split plot design (SPD) with three replications to investigate the growth behavior of wheat and nitrogen dynamics in conventional (CT) and zero tillage (ZT)-based crop management practices. The main plots were divided into two tillage methods: conventional tillage with residue incorporation (CT) and zero tillage flat bed (ZT), while the subplots were assigned four different nitrogen sources and rates viz., N0 (zero nitrogen), N150 (150 kg N ha−1 through urea), GS (50% of RDN + Green Seeker–GS based application of split applied N) and USG (50% of RDN applied as basal through urea super granules + GS based application of split applied N). The detail of treatments is given in Table 1.
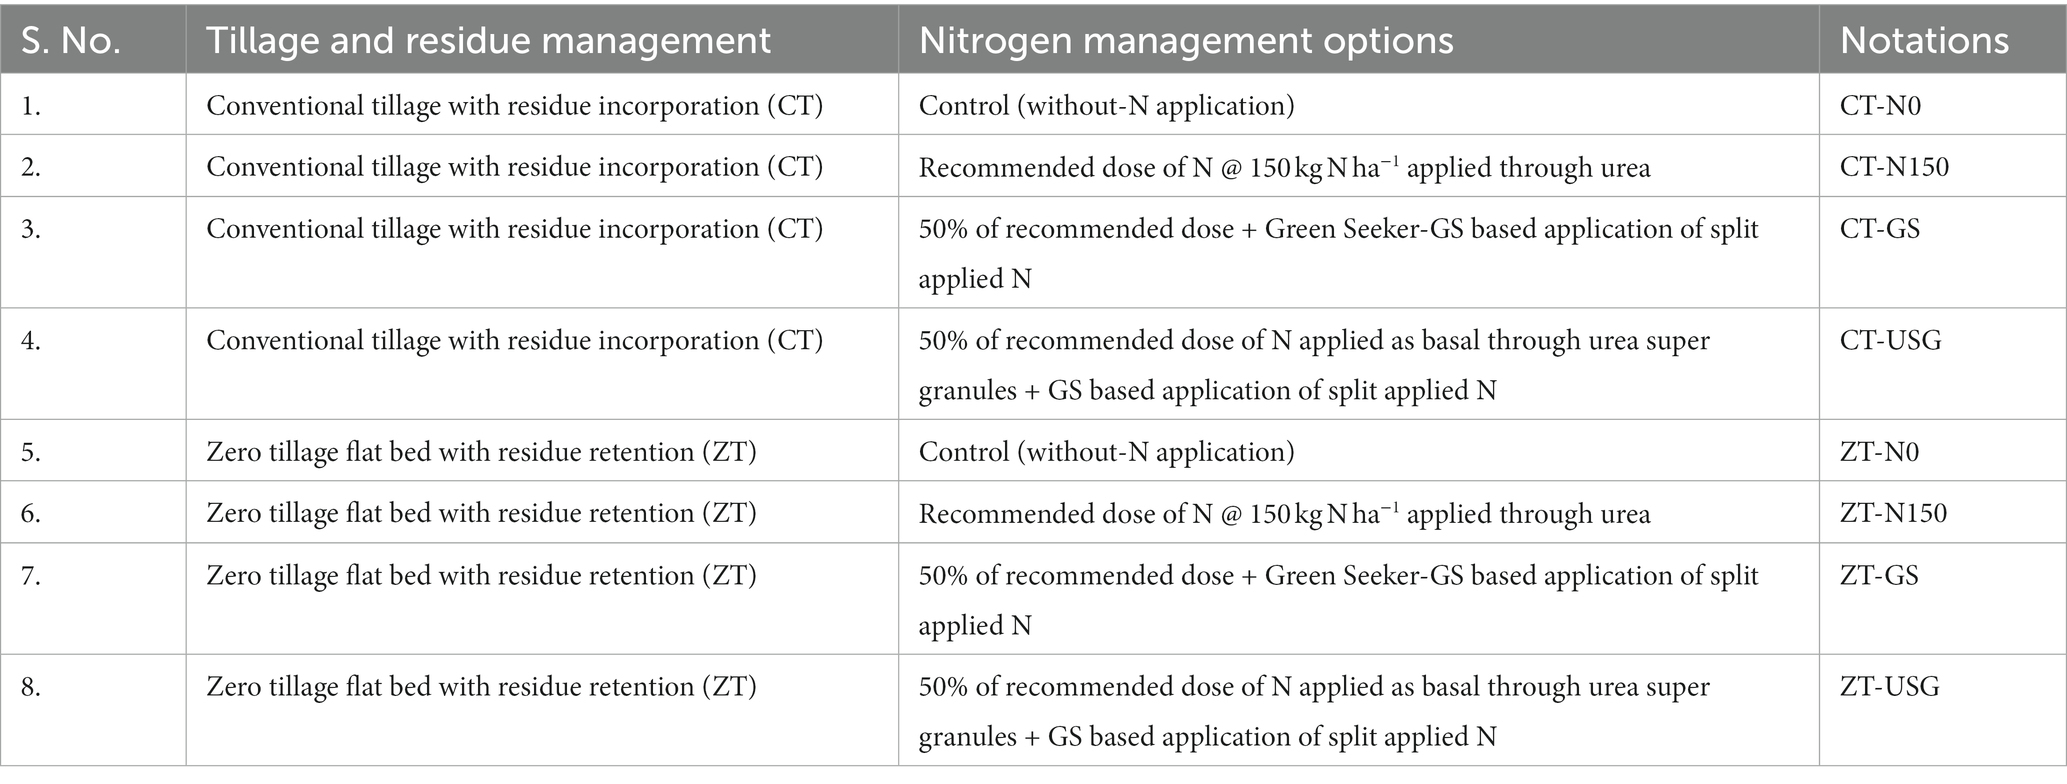
Table 1. Description of imposed treatments.
The CT plots incorporated 30% of the preceding crop residue, while the ZT plots were kept undisturbed from previous years since 2012. The CT plots were prepared with one deep tillage followed by two ploughings with cultivator. Wheat variety HD2967 was planted in 1st fortnight of November during 2019–20, 2020–21 and 2021–22 with a row spacing of 22.5 cm in both ZT and CT plots. At the time of mechanical seeding of wheat, a common dose of 60 kg P2O5 + 40 kg K2O ha−1 was applied to all plots as basal. In the control plot (without nitrogen), only P2O5 and K2O were applied. In contrast, the other plots received 150 kg N ha−1 (RDN), of which 1/3rd was applied as basal, 1/3rd was applied at 37 DAS and the remaining 1/3rd was applied at 84 DAS. In case of USG, the briquettes were placed in the root zone at 7–10 cm depth. Half dose of RDN, i.e., 75 kg ha−1 was applied as basal, whereas the remaining amount was given as two equal splits at 37 DAS and 84 DAS. Representative grain samples were collected, dried and weighed at the time of manual harvesting of the crop.
Periodic measurements of leaf area at 25-days interval were taken using a leaf area meter (Model LI-COR-3100). In this paper, LAI at 90 days after sowing (DAS) is discussed which represents the stage at which the crop attains its maximum LAI values. The leaf area index, which expresses the ratio of total leaf area (one side only) to the total ground area in which the crop is grown, was calculated by dividing the total leaf area by the ground area occupied by the crop. The nitrogen (N) content in the grain and straw of wheat samples was determined using a CHNS analyzer. N uptake was calculated by multiplying the percentage of N in the grain/straw by the grain/straw yield (kg ha−1). The total N uptake (kg ha−1) was calculated by adding the N uptake in the grain to the N uptake in the straw. At the time of harvest, biomass and grain yields of the crop were recorded following the standard protocol as described by Parihar et al. (2020). The harvesting process was performed manually and grain samples were taken. Subsequently, these samples were oven-dried at 65-70°C for 48 h to remove moisture and then weighed to determine their final yield.
In the experiment, the initial soil of the experimental site was identified as sandy loam in texture with a slightly alkaline pH hydraulic conductivity (saturated) of 0.835 cm h−1, and Alkaline KMnO4-N of 152.0 kg ha−1 (Subbiah and Asija, 1956). To determine the soil bulk density (BD), undisturbed soil samples were collected from each plot in triplicate from depths of 0–5 cm, 5–10 cm, 10–15 cm, 15–30 cm, and 30–45 cm before wheat sowing. The soil water content for the same depths was measured volumetrically (gravimetric moisture content × BD) and soil moisture content at saturation, field capacity, and permanent wilting point was determined using a pressure plate apparatus (Klute, 1986). The soil texture parameters (sand, silt, and clay percentages) for the same depths were obtained using the Hydrometer method (Bouyoucos, 1962).
For mineral-N (NH4+-N and NO3−-N) analysis, soil samples were collected randomly at 25 days interval from five locations in each plot from depths of 0–15 cm, 15–30 cm, 30–45 cm, 45–60 cm, 60–75 cm, and 75–100 cm using a soil sampler. The samples were composited for respective depths for each plot. To analyze the mineral-N content, moist soil samples were extracted using 2 M KCl solution. The extraction process involved shaking the samples for 1 h using a mechanical shaker, following the methods described by Bremner (1965) and Keeney and Nelson (1982). The mineral-N fractions in soil were estimated by steam distillation methods (Kjeldahl, 1883), first with MgO for NH4+-N and then separately with MgO and Devarda’s alloy. The ammonium content in the soil extract was determined by estimating the liberated NH3 through distillation of the extract using MgO, which creates the alkaline conditions essential for ammonia liberation. Simultaneously, in the same extract, Devarda’s alloy (a reducing agent) was added to convert NO3−-N to ammonia. The fractions of mineral-N content of the soil samples were then expressed on a dry weight basis. While the soil’s nitrate fractions were assessed periodically, this paper specifically focuses on the observed and simulated soil nitrate levels at 50 days after sowing (DAS). This stage is used for simulation due to the rapid crop nitrate-N uptake, which presents a challenging scenario for the model to accurately simulate nitrate dynamics.
CERES-wheat (incorporated within the DSSAT version 4.8, Decision support system for Agro-technology Transfer) used in the present study is a dynamic mechanistic model that calculates phenological development and growth of wheat in response to environmental factors like soil and climate, and management factors like crop variety, fertilization, planting conditions, irrigation, etc. (Jones et al., 2003).
In this study, the CERES-Wheat and the CENTURY-based soil module in DSSAT (version 4.8) (Hoogenboom et al., 2021) were used to conduct simulations. Input required for CERES-Wheat include cultivar coefficients, daily weather data, soil profile data, crop management practices. The crop management data contain crop planting date and density, row space, tillage method and date, fertilization (inorganic and manure) dates and rates, and harvest date, etc. (Hunt et al., 2001). These crop management data were obtained from the data taken from field in rabi/winter season (October–April) 2019–20, 2020–21, and 2021–22.
Crop growth in the CERES-Wheat model is controlled by phenologically defined growth stages, which are in turn driven by energy input in the form of growing degree-days (GDD) (Jones et al., 2003). Growth stages are defined in DSSAT in terms of cultivar coefficients, which are specific to both the crop cultivar and the local climate, and must therefore be individually evaluated under the optimum conditions (i.e., minimum stress in weather and nutrients) for the region (Boote, 1999; Liu et al., 2011). The CERES-Wheat model uses seven cultivar coefficients (Jones et al., 2003), three representing early growth (P1V, P1D and P5), three representing grain filling (i.e., G1, G2, and G3), and one representing the phylochron interval between successive leaf tip appearances (PHINT). The genetic coefficient for the HD 2967 cultivar was calculated using the DSSAT-GLUE and subsequently calibration was made using a ‘Trial and Error’ method by setting up a small change (i.e., ± 5%) of each parameter to produce a close match (within 10%) between simulated and measured grain and biomass yield. The seven critical genetic coefficients and some ecotype coefficients for the model have been calibrated as presented in Table 2.
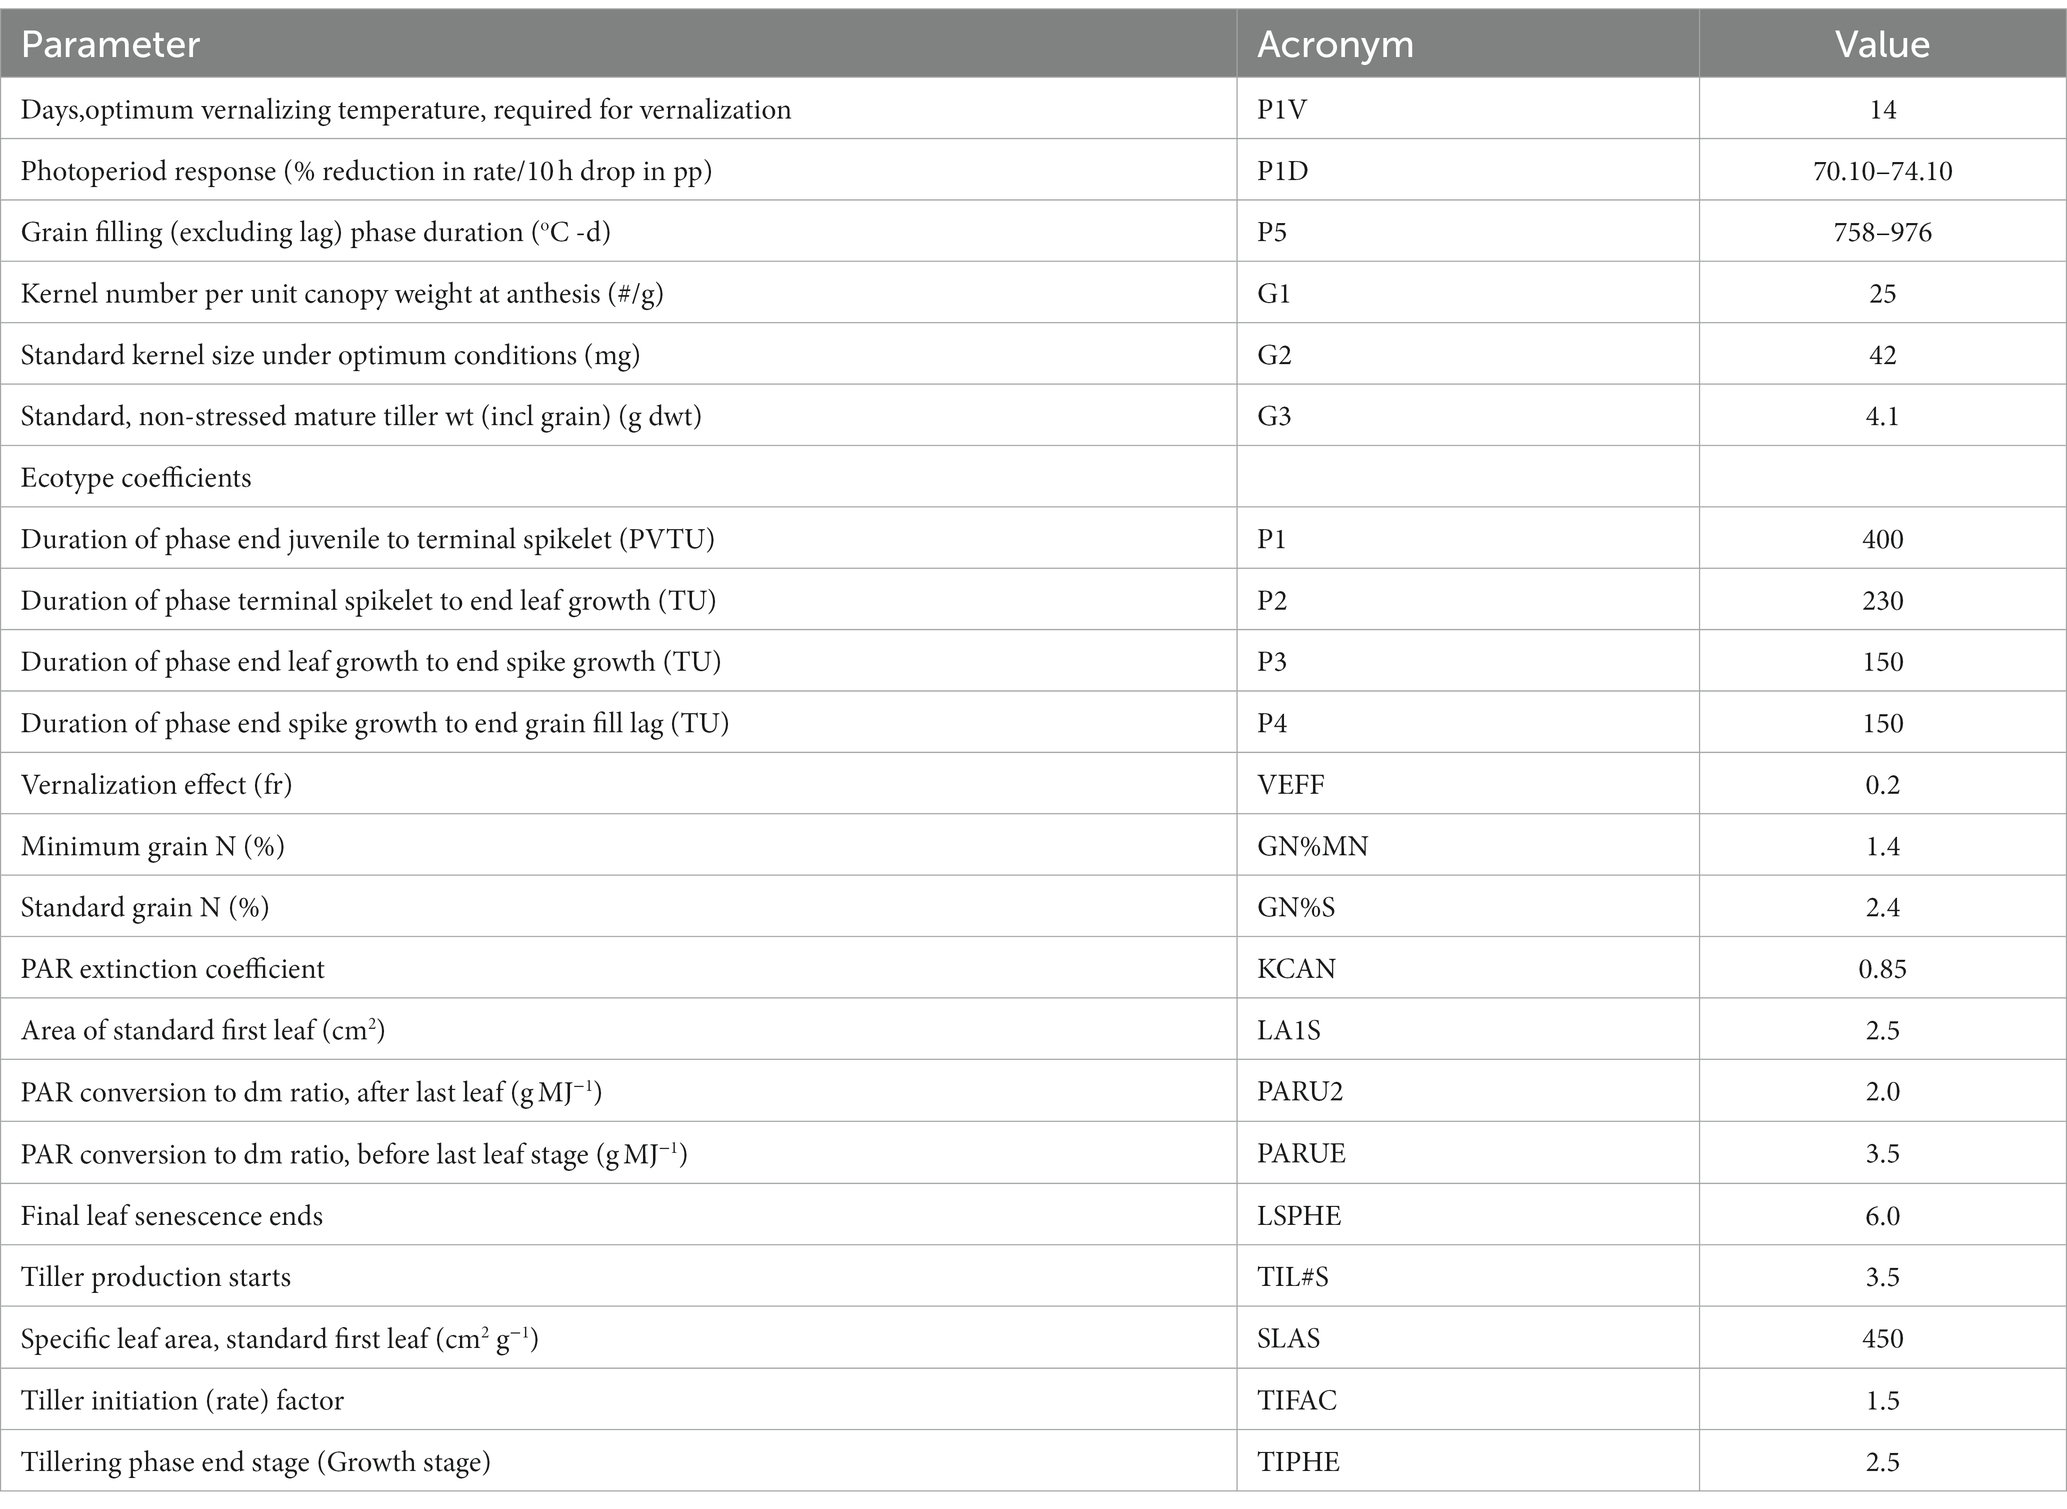
Table 2. Genotype coefficients for wheat (cv HD2967) calibrated for DSSAT model.
To run simulation in DSSAT environment, four input files are required in the following succession: management file, daily weather file, cultivar file (Table 2), and soil profile file (Supplementary Table S1). Local soil and weather parameters, initial conditions of experiment and management practices were used for running the model. The daily outputs from the model includes: crop growth (growth stage, LAI, biomass and grain yield, % N in grain and leaves), and for each soil layer, carbon, mineral N (NH4+-N and NO3−-N) and water content. The output file includes overview, evaluation and soil water balance. The outputs are readily visualized using graphical display packages within DSSAT tools (e.g., GBUILD), or by using EasyGrapher, a supporting software program (Yang et al., 2004).
The experimental data underwent statistical analysis using analysis of variance (ANOVA), as applicable to split plot design as outlined by Gomez and Gomez (1984). The significance of the treatment effects was assessed using the F-test, and the distinction between the means was approximated by utilizing the least significance difference at a 5% probability level. For the model’s calibration, essential crop data from stress-free treatments involving water and nitrogen were selected. This data encompassed days to 50% anthesis and physiological maturity, maximum leaf area index (LAI), soil nitrate, and grain and biomass yield. These details were sourced from two growing seasons, i.e., 2019–20 and 2020–21. To evaluate the model, an independent dataset originating from the field experiment on tillage and nitrogen interaction in 2021–22 was employed. In order to holistically assess the performance of the DSSAT model, a thorough comparison between observed and model-predicted data was executed. This evaluation involved deviation statistics, such as prediction error (PE), root mean square error (RMSE), normalized RMSE (nRMSE, Equation 1, 2 and 3, respectively) and coefficient of determination (R2). Furthermore, a regression analysis was carried out to establish a relationship between the simulated and measured grain yields.
Where, Pi is predicted value, Oi is observed value.
Prediction is considered to be excellent if PE value is close to zero.
The root mean square error (RMSE) was used to calculate the fitness between the estimated and measured results. The RMSE summarizes the average difference between observed and predicted values (Willmott et al., 1985).
The normalized RMSE is expressed as RMSE as percentage over the mean observed value.
Where, Pi is predicted value, Oi is observed value, Ō is observed mean and n is number of samples. The nRMSE (%) shows the relative difference between the predicted and observed data. The prediction is considered excellent, good, fair and poor for the nRMSE<10%, 10–20%, 20–30 and > 30%, respectively (Jamieson et al., 1991).
The amount of rainfall received during the crop seasons (October–April) of 2019, 2020 and 2021 was 302 mm, 76.8 mm and 181.5 mm, respectively. The graphical representation of daily rainfall distribution, minimum & maximum temperature and solar radiation during simulation period have been presented in Figure 1. As the rainfall distribution was erratic, the crops were irrigated timely as and when required. The CERES-wheat model employs the concept of growing degree days (GDD) to gage how the crop develops. GDD serves as a gage for the accumulated warmth that aids growth throughout the season. The model also imitates how the crop absorbs nitrogen. This simulation considers various factors like the characteristics of the soil, prevailing weather, and how the crop is managed (Hoogenboom et al., 2021). This particular investigation revealed a tight connection between growing degree days (GDD), temperature, nitrate levels in the soil, and the crop’s uptake of nitrogen. At the beginning, when temperatures are low and nitrogen uptake by the crop is slow, along with the initial application of basal nitrogen, the concentration of nitrate in the soil is higher. Around 30 DAS, there’s a sharp upswing in the graph representing nitrogen uptake. From roughly 70 to 100 DAS, the rate of nitrogen uptake was decreased. After hitting the 100-day mark post sowing, there was another significant spike in nitrogen uptake.
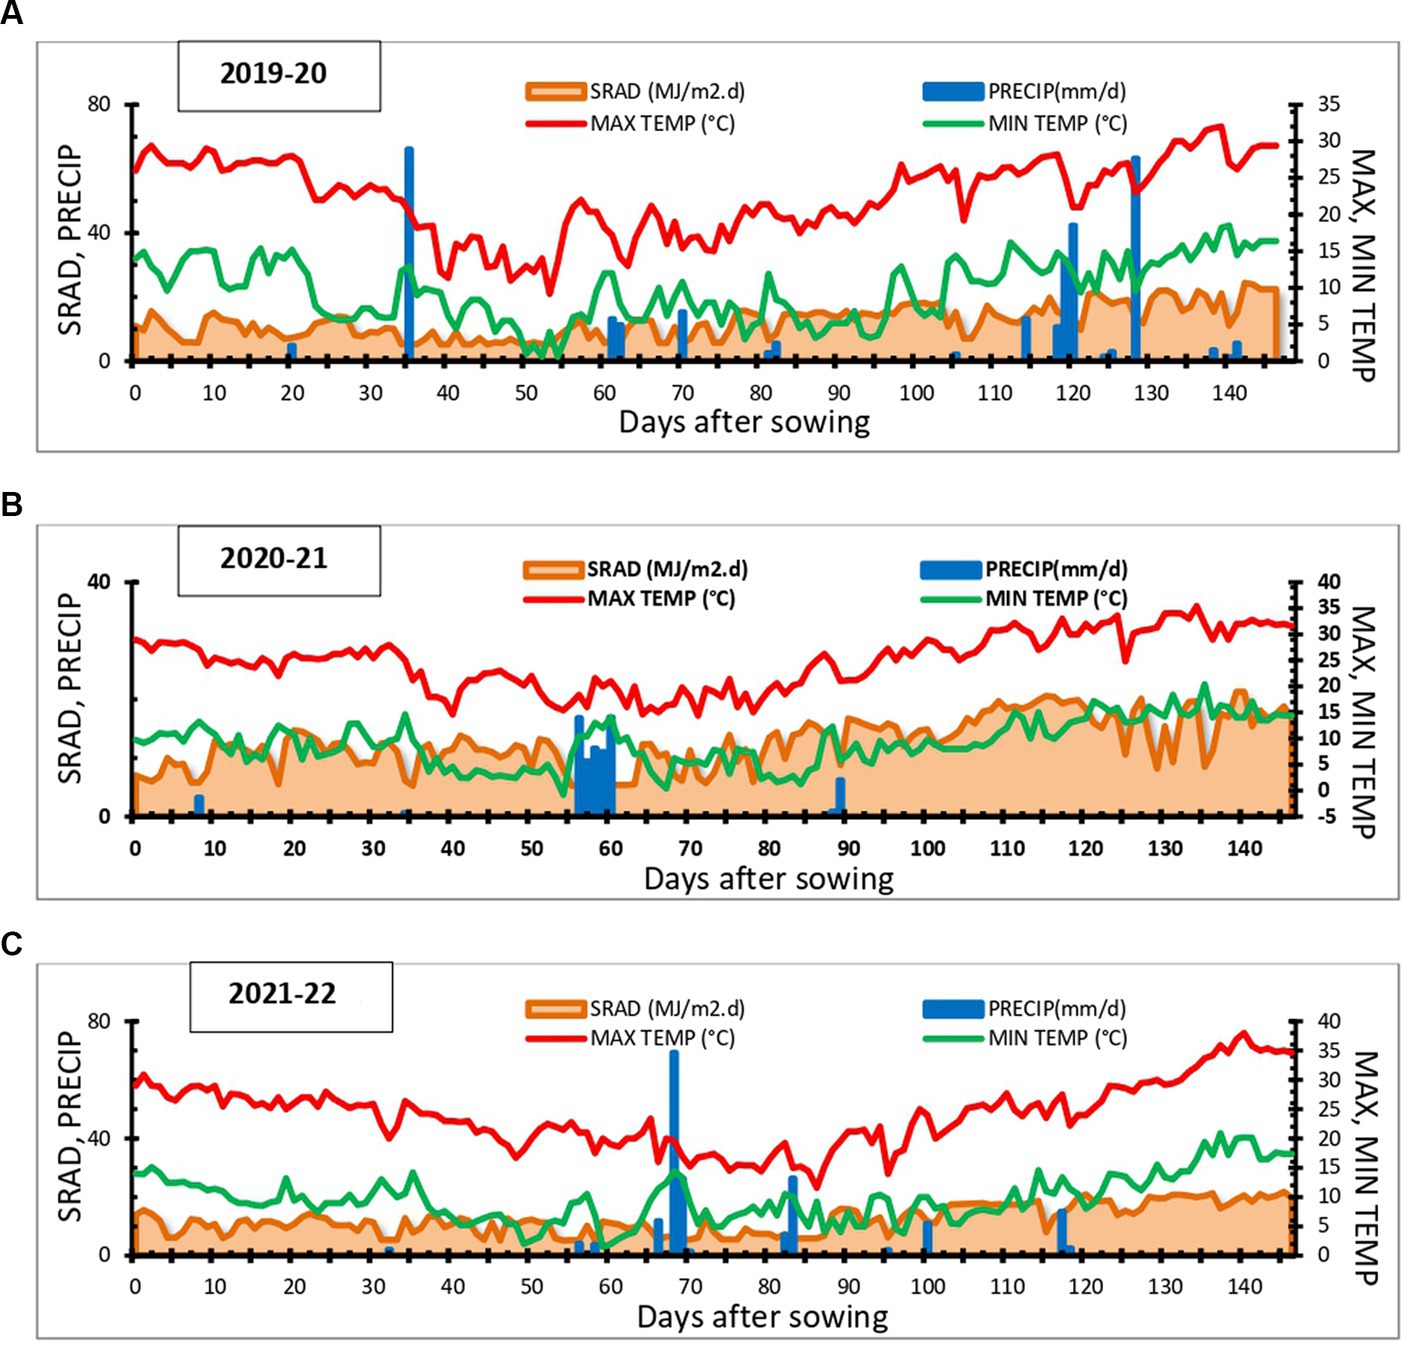
Figure 1. Weather parameters during the experimentation period (A. 2019-20, B. 2020-21, and C. 2021-22).
The CERES-wheat model was calibrated by adjusting critical genetic and ecotype coefficients (Table 2) to match the observed biomass and grain yield data for the years 2019–20 and 2020–21. Critical genetic and ecotype coefficients are presented in Table 2. The performance statistics and goodness of fit are shown in Figures 2A, 3, 4A,C, 5A,C,E. Model successfully predicted the days to anthesis (RMSE = 1.08 days and nRMSE = 1.20%) and days to physiological maturity (RMSE = 2.74 days and nRMSE = 1.92%). During calibration years, the lower values of RMSE (336 kg ha−1 and 649 kg ha−1 for grain and biomass, respectively) and nRMSE (6.79 and 5.46% for grain and biomass yield, respectively) demonstrated the efficacy of the model in accurate simulation of the crop yield. For other parameters, RMSE and nRMSE were in the tune of 0.28 and 6.69%, respectively for LAI, 11.84 kg ha−1 and 9.39%, respectively for N uptake, and 12.39 kg ha−1 and 13.69%, respectively for soil nitrate.
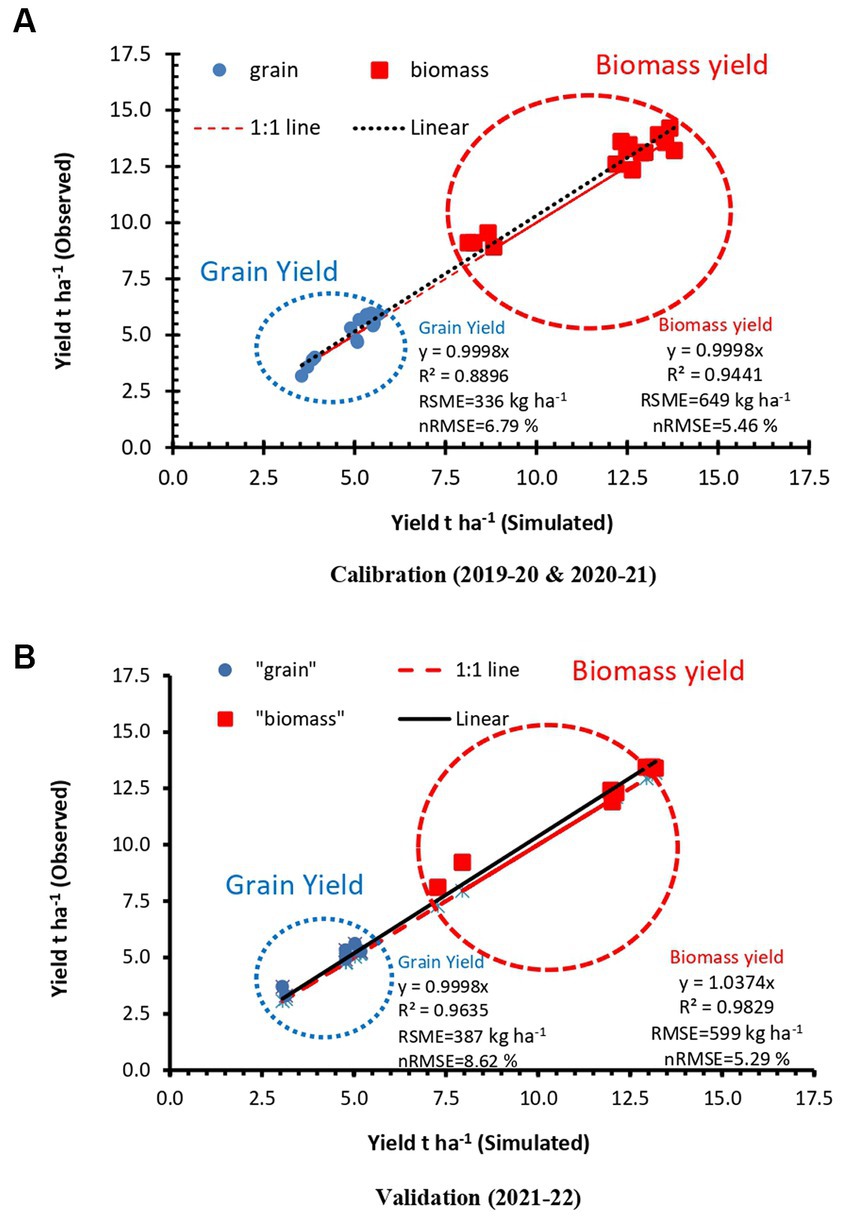
Figure 2. Model calibration (A) and evaluation (B) for yield and biomass using DSSAT.
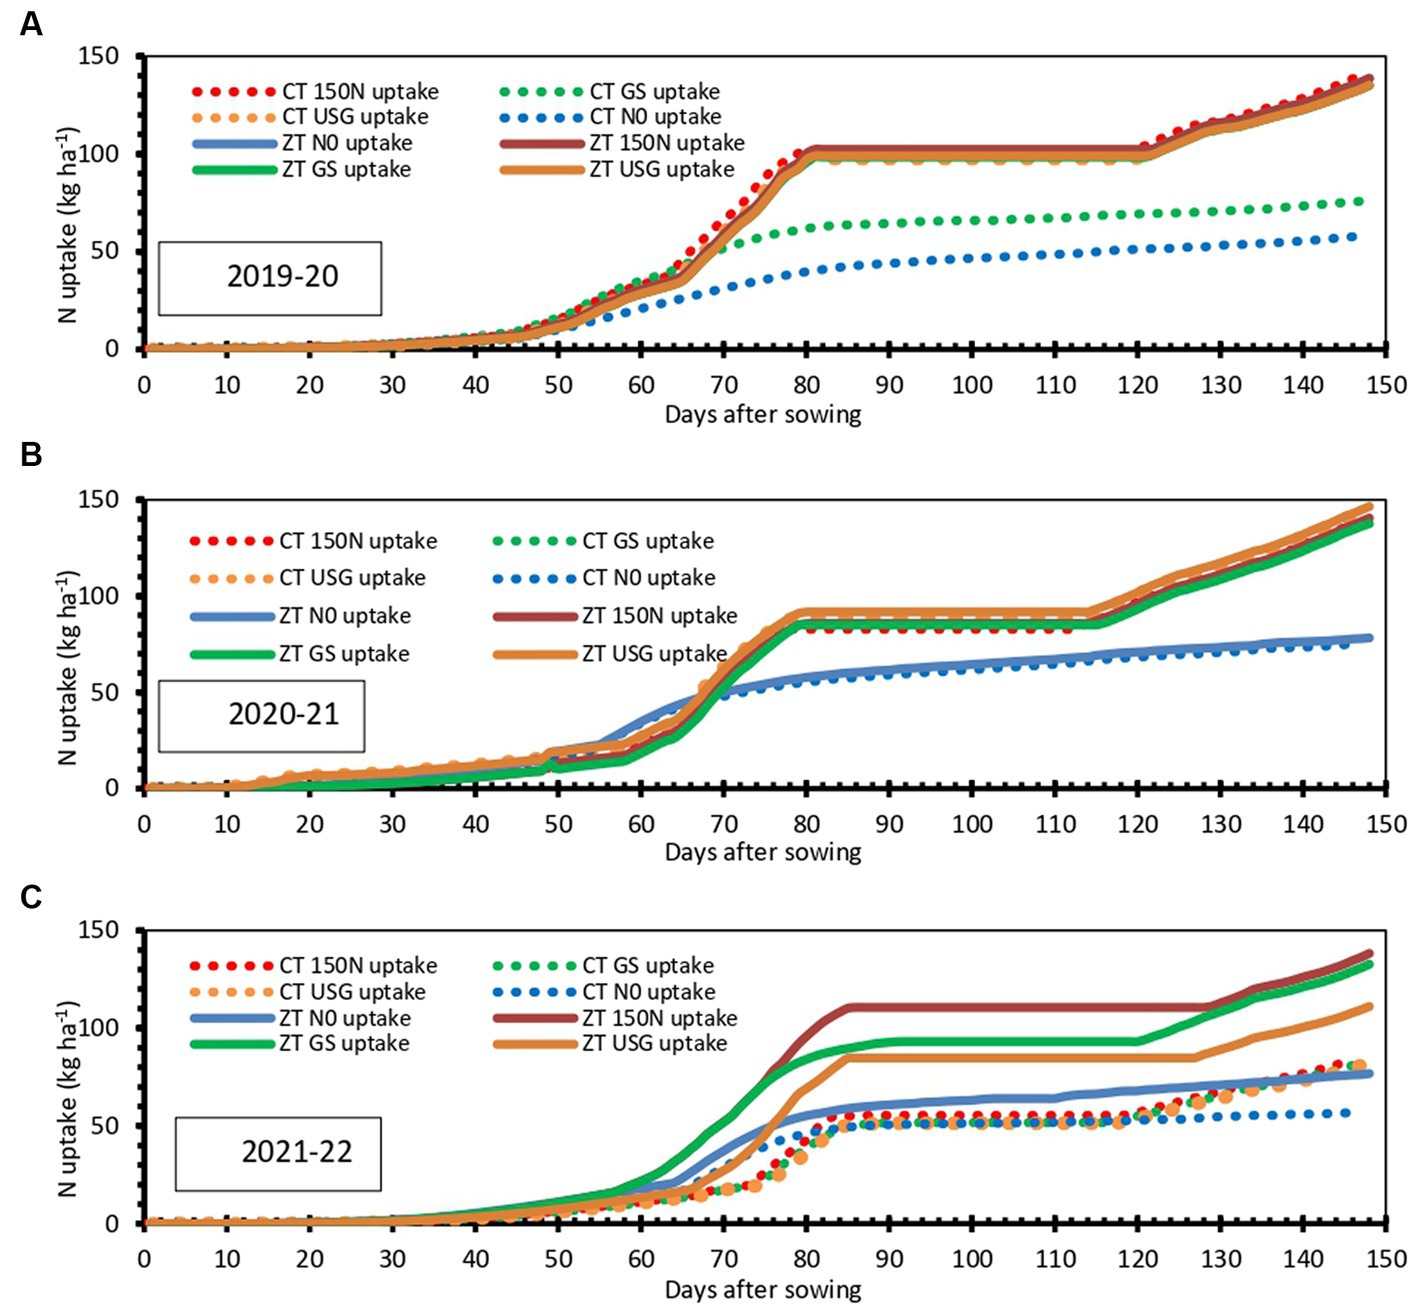
Figure 3. Simulated nitrogen uptake of spring wheat as affected by different nitrogen management options under long-term contrasting tillage practices during 2019–20 (A), 2020–21 (B) and 2021–22 (C).
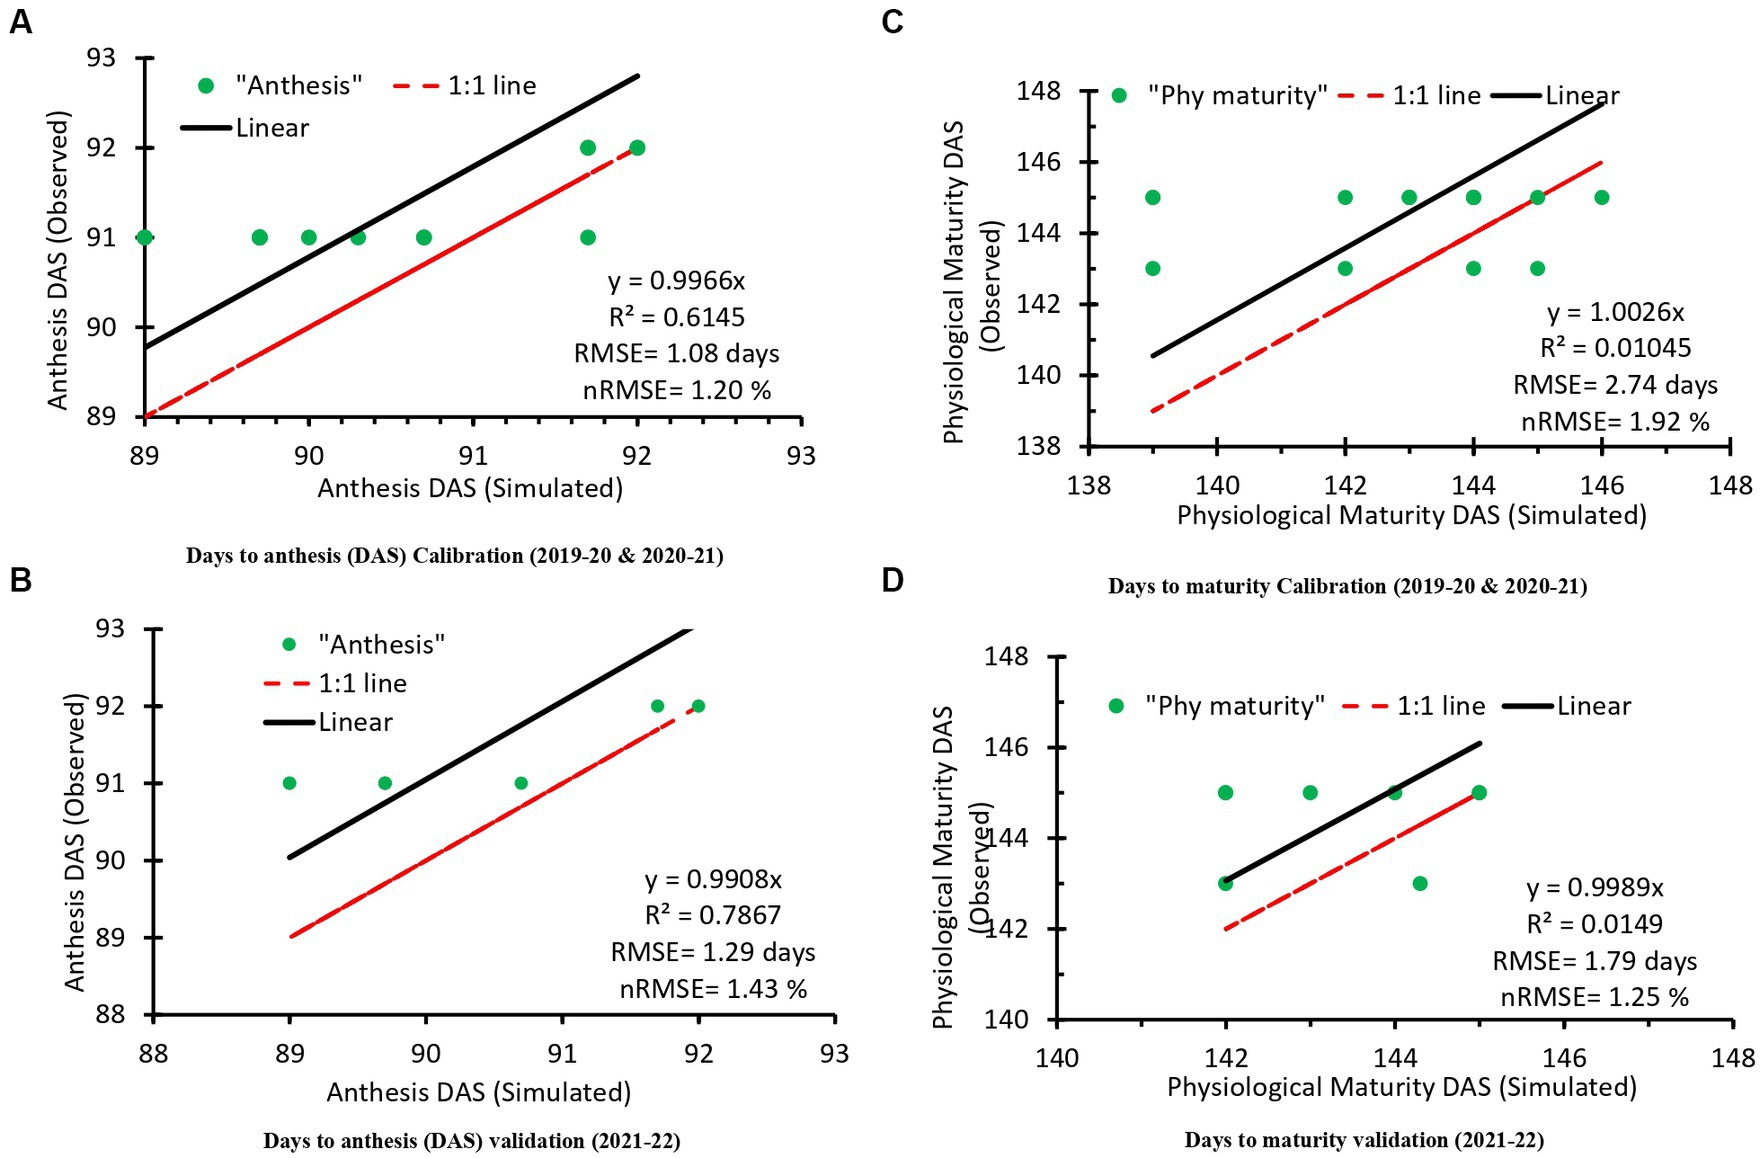
Figure 4. Calibration and evaluation of days to anthesis (A,B) and days to maturity (C,D).
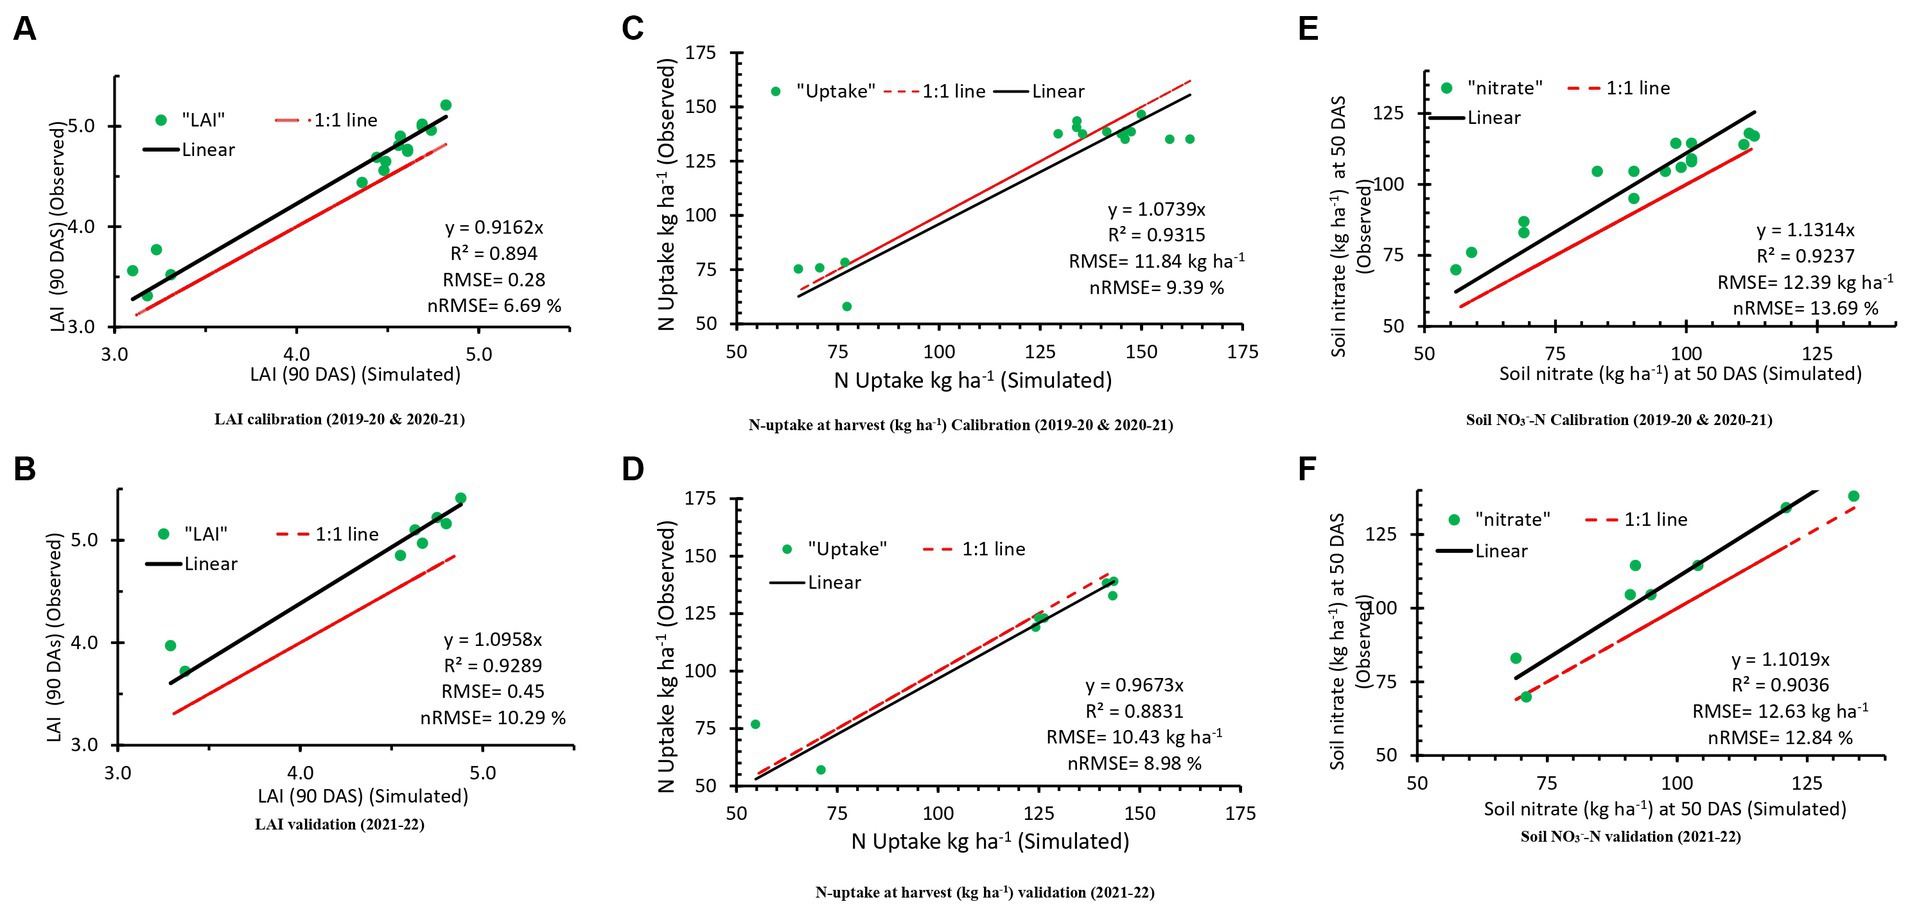
Figure 5. Calibration and evaluation of crop’s LAI (A,B), plant N-uptake (C,D) and soil NO-N (E,F).
The calibrated genetic coefficients were used to evaluate the model in 2021–22. The observed leaf area and nitrogen fluxes, including observations on nitrogen uptake and initial and in-season soil nitrate, were compared with simulation results obtained using the DSSAT model. The statistical indicators indicated a satisfactory fit, with acceptable values of Root Mean Square Error (RMSE) and normalized Root Mean Square Error (nRMSE), as depicted in Figures 4–6. This suggests that the DSSAT model provided a reasonable representation of the observed data, evaluating its accuracy in simulating leaf area and nitrogen dynamics for the studied period.
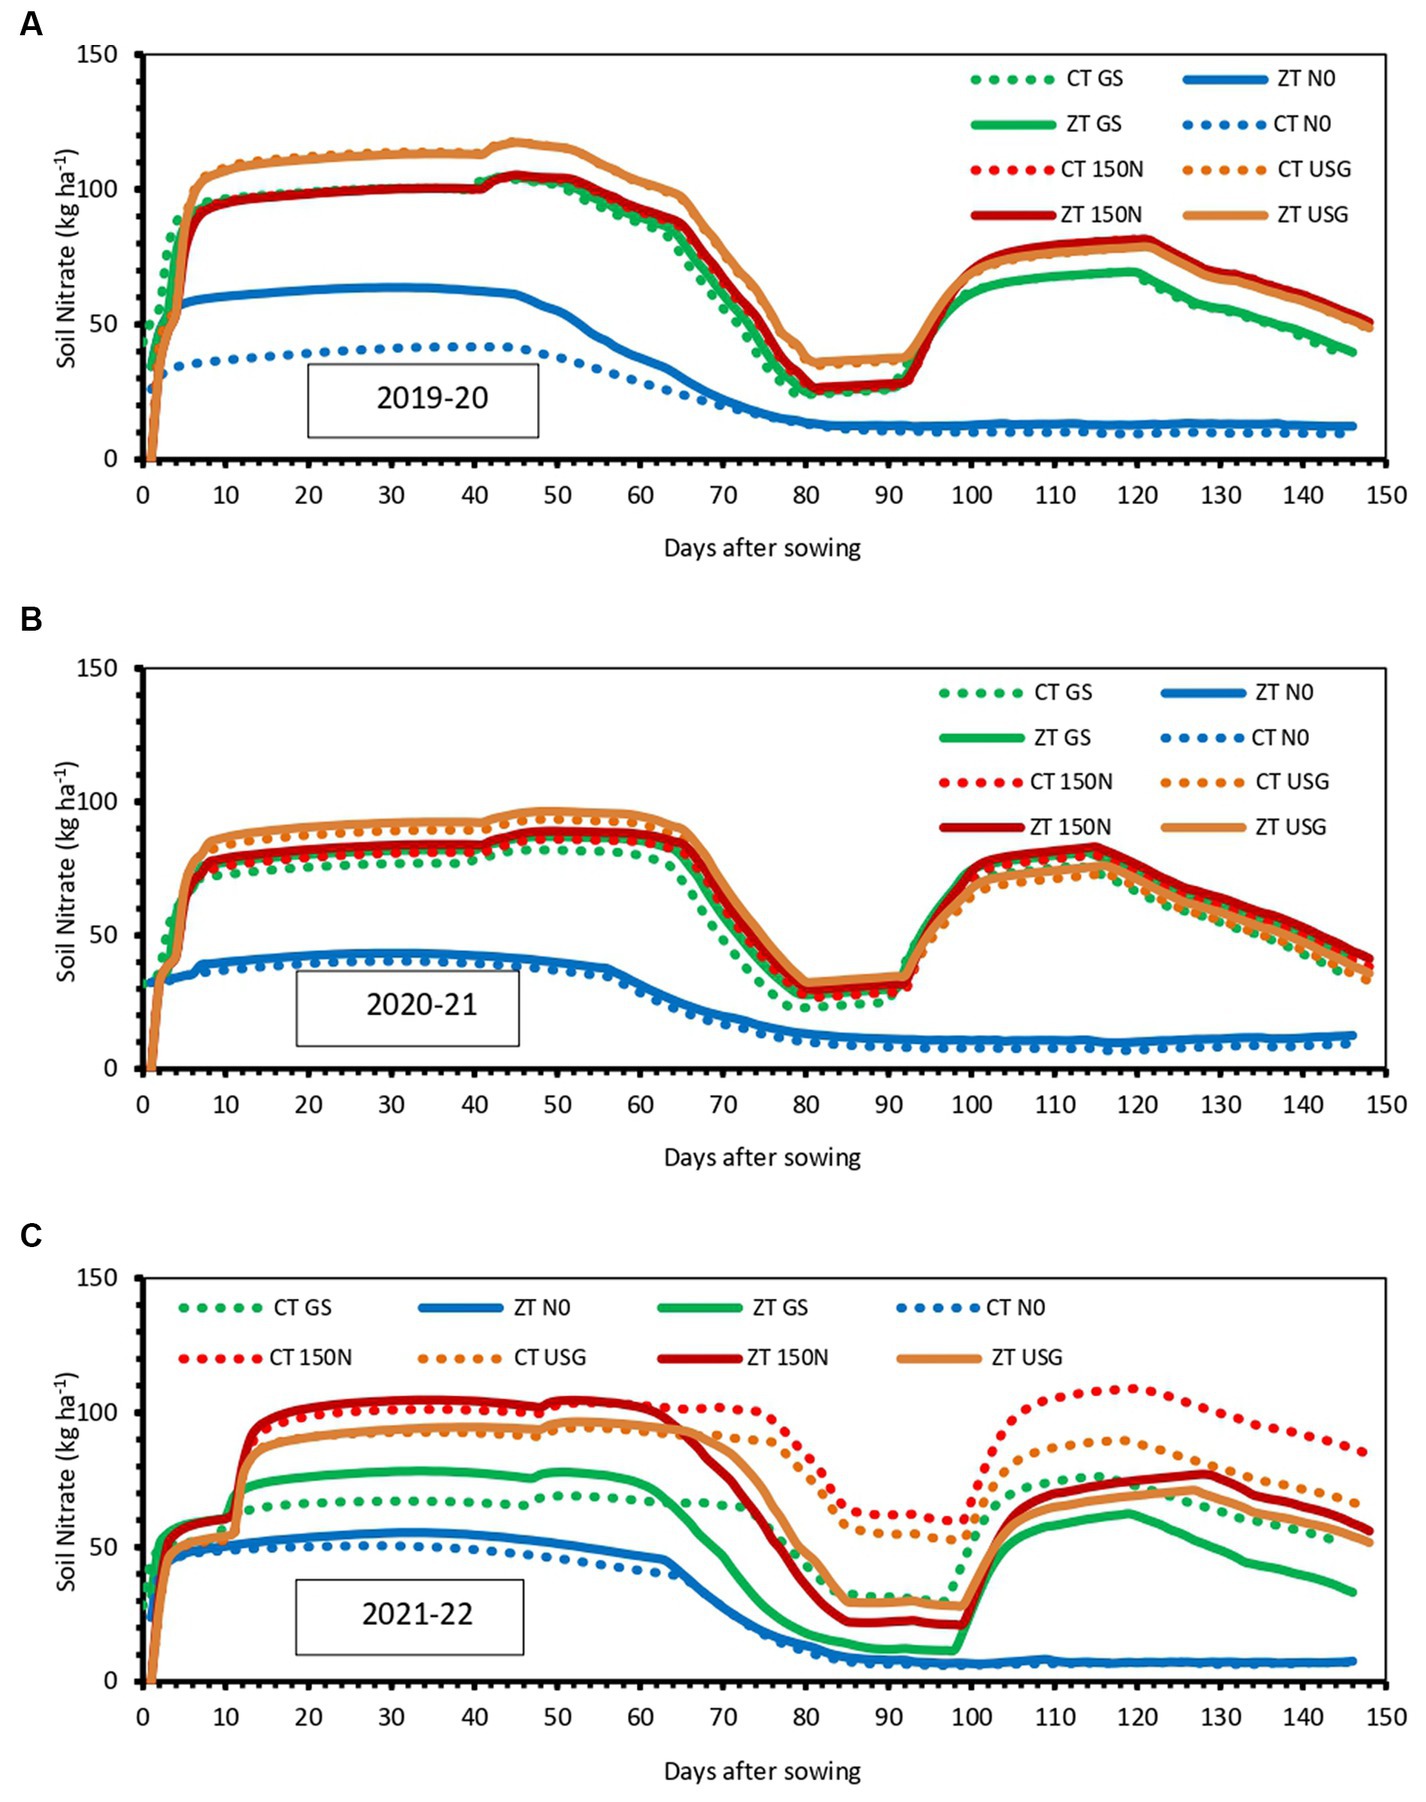
Figure 6. Simulated soil nitrate (NO3−-N) as affected by different nitrogen management options under long-term contrasting tillage practices during 2019-20 (A), 2020-21 (B) and 2021-22 (C).
The DSSAT-CERES-wheat model simulated wheat cultivar anthesis, and physiological maturity at 89–94 and 139–145 DAS, respectively, in all 3-years. The RMSE values for the observed days to anthesis and maturity were 1.29 days and 1.79 days, respectively (Figures 4B,D). This close agreement between predicted and observed data indicates the model’s accuracy to capture the changes in crop phenological stages. The model’s simulation could not capture the treatment difference for the days to anthesis and physiological maturity. However, in field conditions, slight variations were observed between the treatment without nitrogen and the other treatments where nitrogen was applied. Anthesis was delayed in the treatments that did not receive nitrogen. For rest of the treatments, the simulated and observed values for anthesis and physiological maturity were consistent (with difference in onset of flowering and physiological maturity being 2 days and 3 days, respectively), indicating the effectiveness of the model. The application of nitrogen prolonged the time required for the crop to attain physiological maturity.
The results of our study demonstrated that the DSSAT-CERES-Wheat model effectively predicted the leaf area index (LAI) at various growth stages in wheat crops under different tillage and nitrogen treatments. The predicted and measured LAI values were in close agreement in the evaluation year (2021–22), with a very low value of RMSE and nRMSE (0.45 and 10.29%, respectively). Additionally, the simulated LAI values ranged from 3.0 to 5.3 across different treatments, which is consistent with the observed data. The model’s simulation indicated that there was an incline in the LAI up to anthesis and then after the LAI started declining. Additionally, the model also captured the higher LAI values in zero-tillage (ZT) plots.
Analysis of the data revealed that the root mean square error (RMSE) for grain and biomass was 387 kg ha−1 and 599 kg ha−1, respectively, for the evaluation year (2022–23). The wheat yields varied considerably among tillage practices and N fertilizer application levels, where the largest wheat yield of 5.20 t ha−1 was observed under treatment ZT-USG, followed by 5.03 t ha−1 under ZT-N150 treatment. (Figure 2). The simulated grain yields of wheat exhibited a good agreement with the measured values in most treatments. However, there was a slight discrepancy in the N0 (without nitrogen application) treatments in both conventional tillage (CT) and zero tillage (ZT) plots, where the model slightly over-predicted the grain yield. Despite this exception, the model’s performance in predicting grain yields for rest of the treatments was accurate. There was a significant linear correlation between the simulated and the measured grain yields with R2 = 0.96 and 0.98 for grain and biomass yield, respectively, for all crop establishment and N management treatment combinations (Figure 2). Compared to CT, ZT plots obtained higher grain yield, and the model also captured this yield difference between CT and ZT. Thus, the DSSAT model demonstrated excellent agreements in simulating the wheat yield for the treatments with fertilizer N application.
In present study we found that compared to NH4+-N, nitrate-N is generally the principle form of mineral N in soil. In both the CT and ZT conditions, NH4+-N concentrations were very low and the amount of NH4+-N increased after the nitrogen application. As per the model’s simulation, ammonia volatilization exhibited an escalation whenever there was a higher concentration of NH4+-N after fertilizer nitrogen application.
In case of soil nitrate, the RMSE and nRMSE values were 12.63 kg ha−1 and 12.84%, respectively, showing the model’s ability to accurately predict the soil nitrate level (Figure 5F). Model simulations showed that the soil NO3−-N concentration fluctuated greatly with fertilizer application and crop growth stages. Following fertilizer N application, NO3−-N concentration increased markedly with the increases of fertilizer N rates. The nitrate concentration displayed an upward slope with increasing temperature. In general, zero tillage (ZT) plots exhibited higher nitrate content in the soil compared to conventional tillage (CT) plots (Figure 6). Among the nitrogen management options, the nitrate content was highest in the USG (urea super granules) plots, followed by GS and 150 N (150 kg N ha−1) treatments. The lowest nitrate content was recorded in the N0 treatment (without nitrogen application). Among the nitrogen options, the highest nitrate content was observed with USG plots followed by GS and 150 N.
The observed and simulated nitrogen uptake showed a good agreement for evaluation year (2021–22) with an RMSE = 10.43 kg ha−1 and nRMSE = 8.98% (Figure 5d). A perusal of observed data suggested a rapid turnover of nitrate N within the soil–plant system during the rapid plant growth period and the nitrate nitrogen (N) concentration remained highly dynamic. During the initial slow growth of the crop, there was an accumulation of nitrate in the soil (Figure 6). During the peak growth of the crop, i.e., at 60 DAS, nitrate concentration was lower in the soil. At around 85–90 DAS, in spite of nitrogen application, the rise in the nitrate curve was moderate as compared to the initial crop growth phase. After the application of fertilizer, nitrogen uptake exhibited a sharp upward curve in all treatments. The pattern of nitrogen uptake in all 3 years remained similar with the maximum uptake in ZT-USG and lowest in CT-N0 (Figure 3). One noticeable observation was presence of a clustering behavior among the group of nitrogen application methods, such as CT-USG/ ZT-USG behaved in the same direction. CT-GS, CT-150 N, ZT-GS, and ZT-150 N treatments exhibited similar uptake patterns for nitrogen. Similarly, CT-N0 and ZT-N0 treatments displayed comparable nitrogen uptake. However, ZT across all clusters outperformed its CT counterparts, indicating the superiority of zero tillage in terms of nitrogen uptake in all nitrogen management options.
In this and next section, we have only simulated data and the discussion is based on the similarity between the simulated results and previous findings. The model simulation revealed that ammonia volatilization exhibited a rise when NH4+-N levels were elevated following the application of fertilizer nitrogen. There was a sudden rise of the volatilization curve in the start of the experiment and at around 39–40 DAS (Figure 7). This increment was noticed in all the nitrogen management options across the years and the highest volatilization was observed in case of USG. In case of plots without nitrogen application, the volatilization was negligible. During 2019 and 2020, the amount of nitrogen leaching was negligible (Figure 8). The leaching was triggered slightly in 2021 at around 80–90 DAS, which was coincided with a rainfall event and the application of fertilizer N. Notably, nitrogen leaching was more pronounced in the ZT system when compared to the CT.
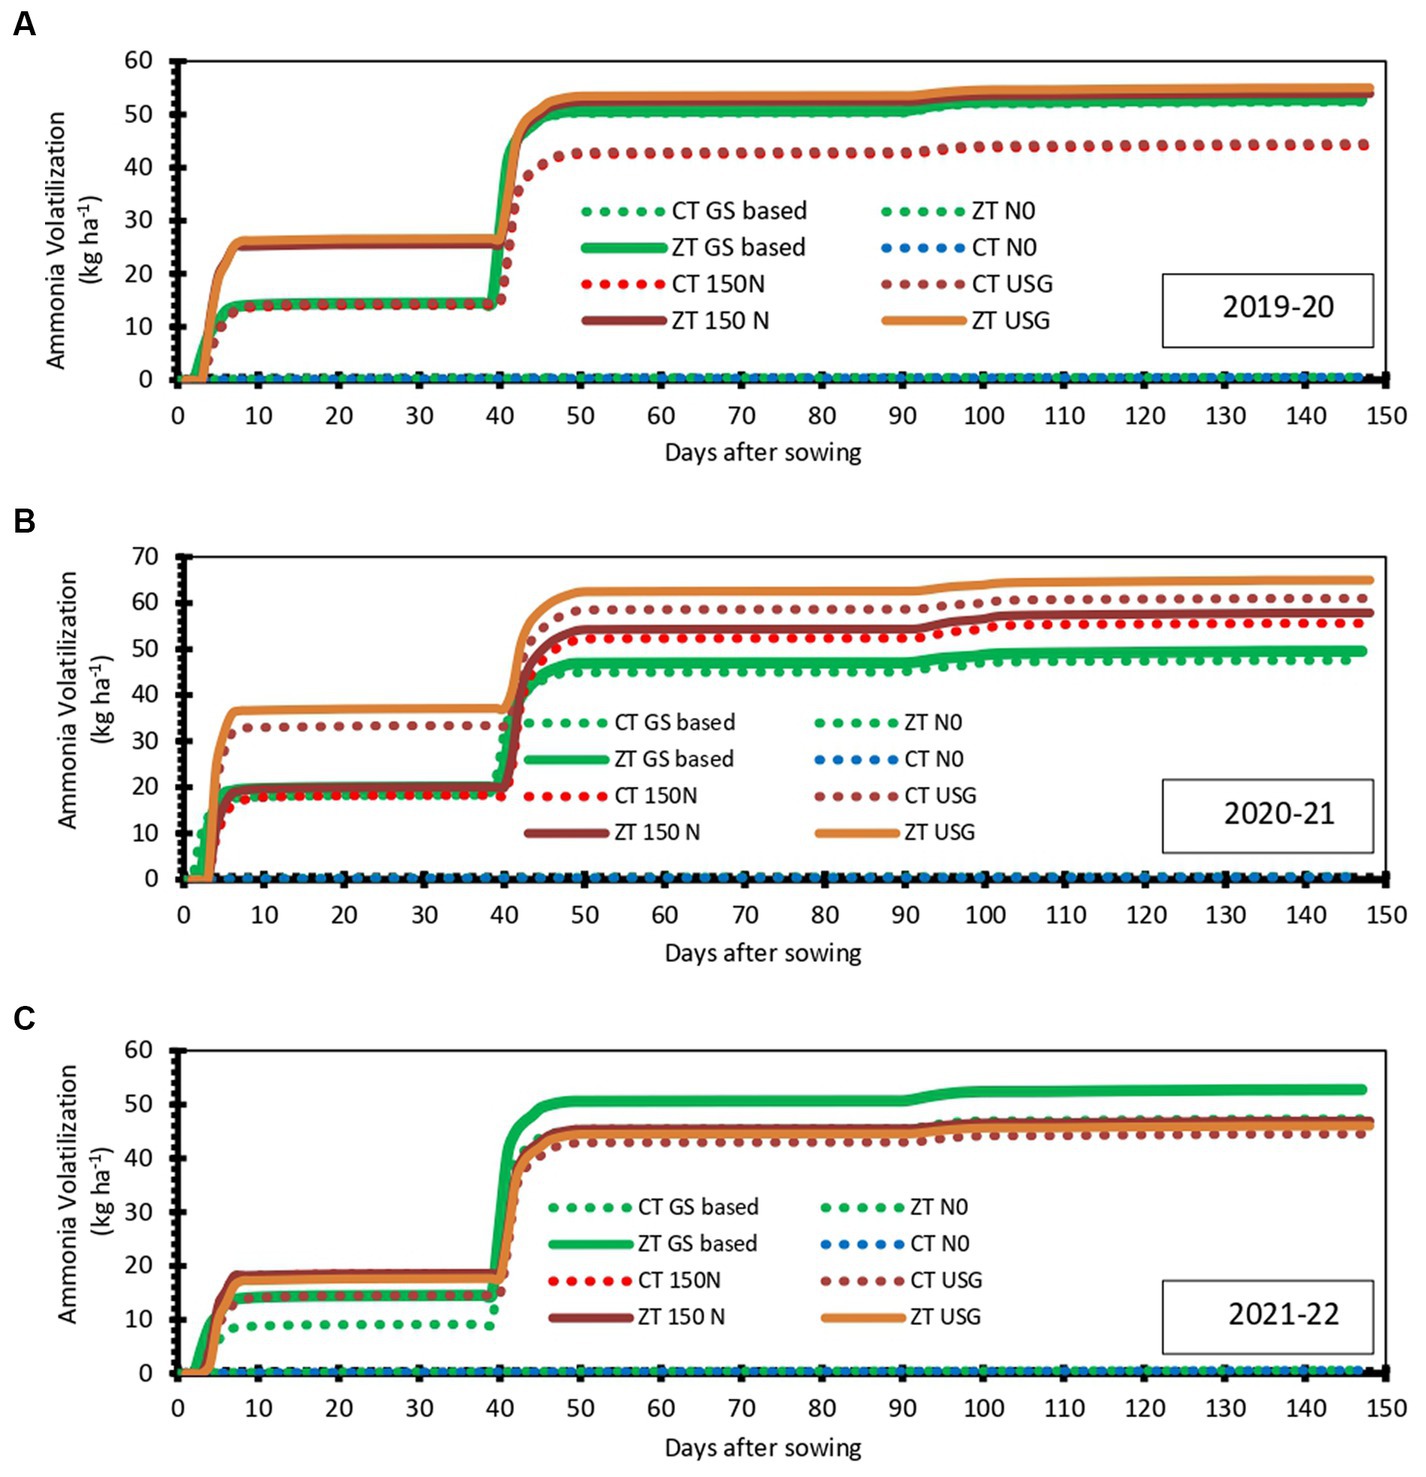
Figure 7. Simulated ammonia volatilization as affected by different nitrogen management options under long-term contrasting tillage practices during 2019–20 (A), 2020-21 (B) and 2021–22 (C).
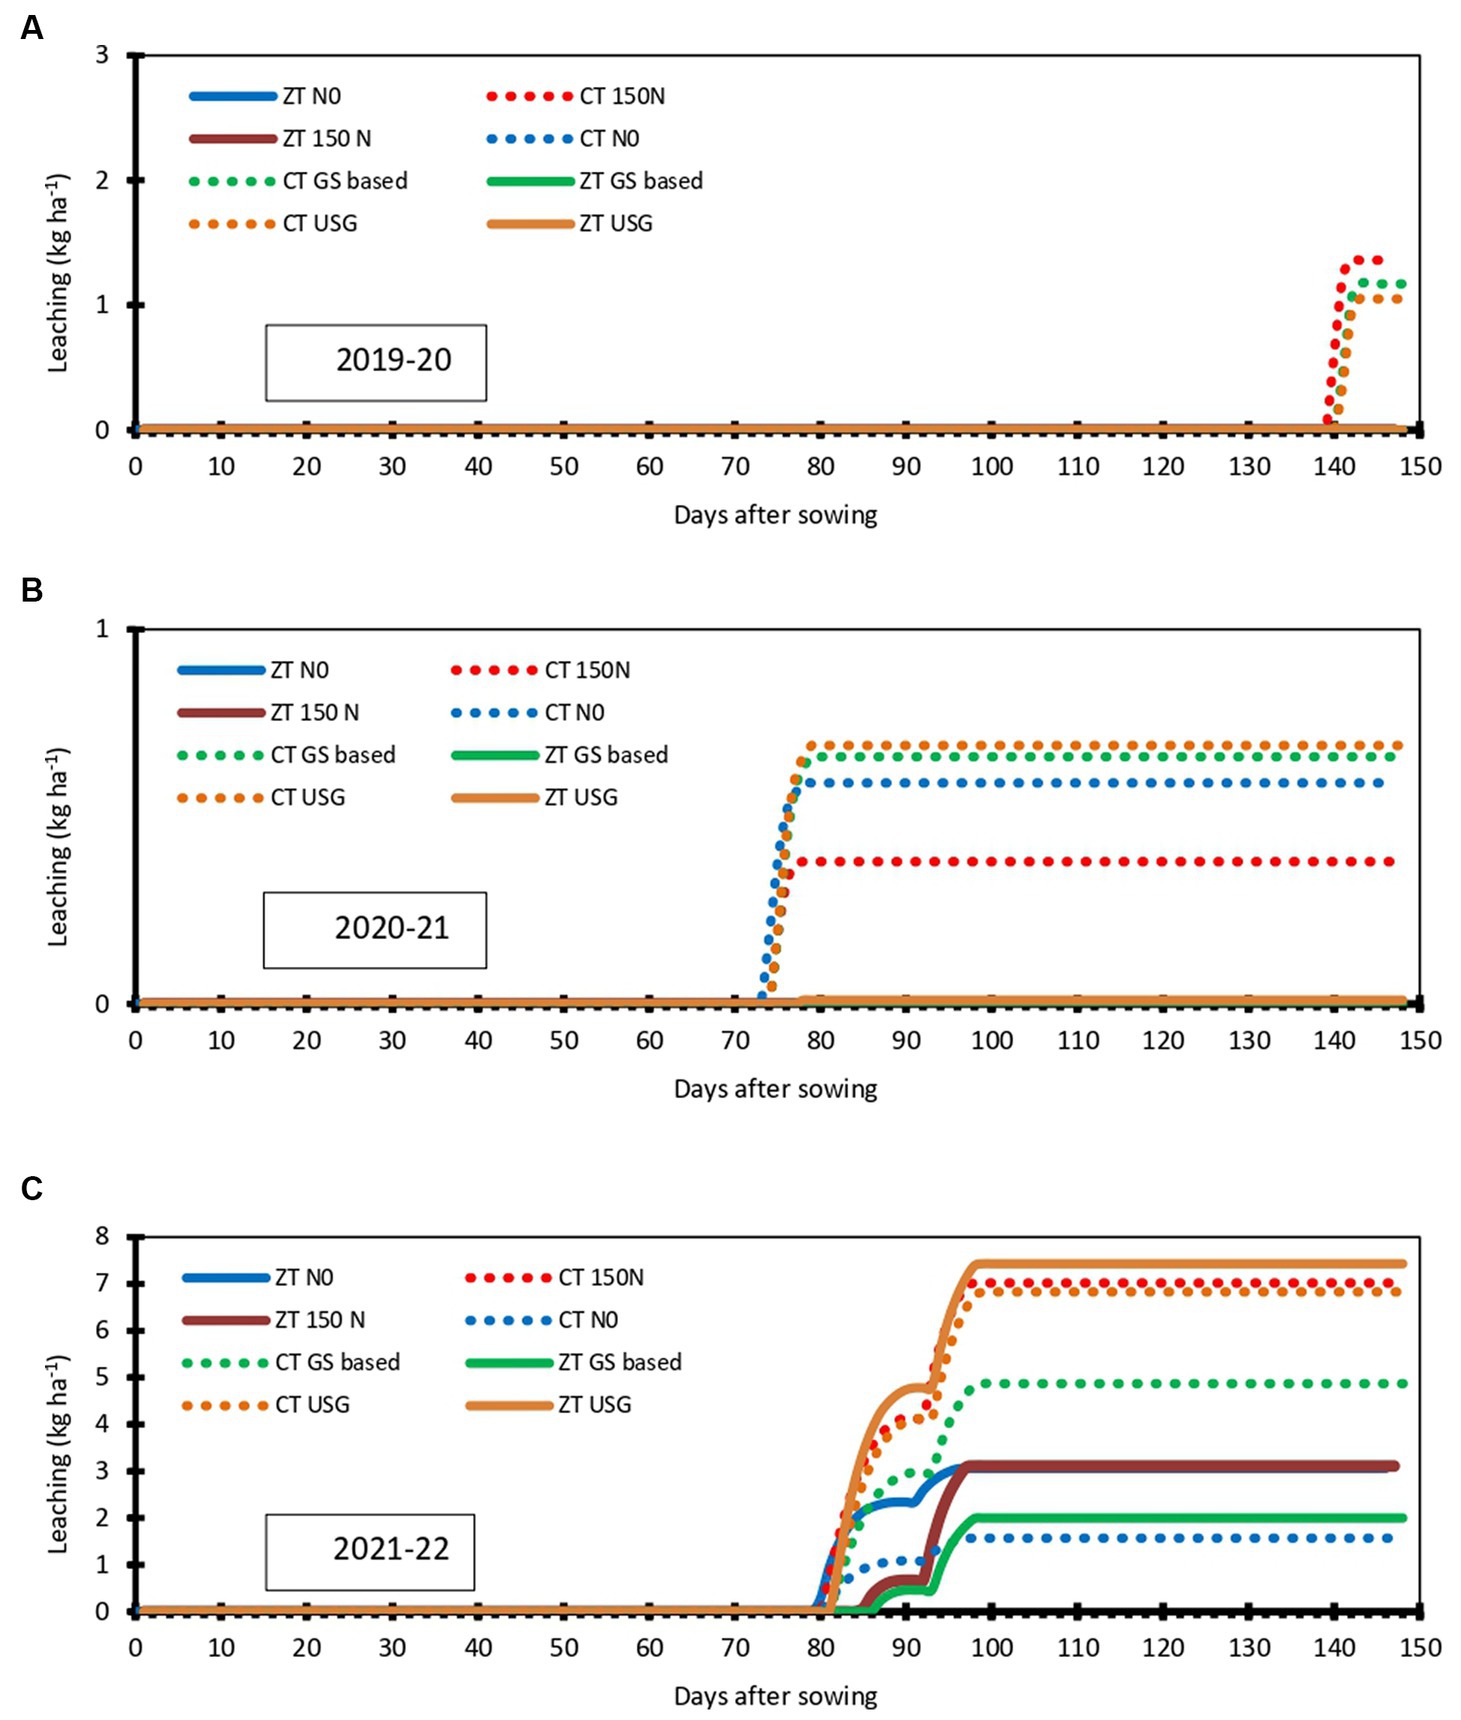
Figure 8. Simulated nitrate leaching as affected by different nitrogen management options under long-term contrasting tillage practices during 2019–20 (A), 2020-21 (B) and 2021–22 (C).
The sharp rise in the graph representing nitrogen uptake at around 30 days after sowing (DAS) can be explained by two key factors: firstly, there’s more nitrate available in the soil during this period, and secondly, the temperature was higher. These favorable conditions synergistically empower the plants to absorb more nitrogen, leading to a substantial increase in nitrogen uptake during this growth phase. The next significant rise in the nitrogen uptake after 100 DAS might be due to the increased temperatures and a growing accumulation of growing degree days (GDD). The advantageous combination of higher temperatures and GDD during this interval substantially enhanced nitrogen uptake by the crop, thereby giving an extra boost to its growth and overall development. So the DSSAT-Ceres-wheat model provides a precious instrument for mimicking and grasping the effects of weather variables on the nitrogen uptake and utilization of this model may facilitate a deeper understanding of how fluctuations in temperature and GDD might influence crop performance.
The close agreement between simulated and observed anthesis and physiological maturity dates indicated the model’s accuracy to capture the changes in phenological crop growth stages. Our results are consistent with the findings of Ahmed (2011) in which the percent prediction error (% PE) for anthesis and maturity of wheat (using DSSAT-CERES-Wheat model) were close to or equal to zero. The model’s simulations illustrated that the treatments did not significantly affect days to anthesis and physiological maturity. However, in field conditions, slight variations were observed between the treatment without nitrogen and the other treatments with nitrogen which highlights the subtle effects that nitrogen application can have on crop development, even though the varietal characteristics remained the primary drivers of anthesis and physiological maturity. The treatments without nitrogen delayed the anthesis dates but advanced physiological maturity. This observation supports the well-established concept that any stress occurring before flowering tends to increase the duration of the crop’s pre-anthesis stage, while stress occurring after anthesis typically reduces the duration of the post-anthesis stage (Gungula et al., 2007; Zhang et al., 2022). This relationship highlights the differential impact of stress on different growth stages of the crop. Treatments with nitrogen application took a longer time to reach physiological maturity, primarily because of the extended nitrogen availability, which led to the expansion of the post-anthesis duration of the crop.
The close agreement between simulated and measured LAI values suggested the model’s efficiency in accurate simulation of the leaf area index of the crop. These results are in agreement with the results observed by Chisanga et al. (2015). The model also accurately simulated the trend of LAI growth, including the incline up to anthesis and subsequent decline as the plant transferred its photosynthates to the sink. This was consistent with previous research that used the DSSAT model (DeJonge et al., 2012). Additionally, the model was able to accurately predict the higher LAI values in zero-tillage (ZT) plots, which can be attributed to improved nitrogen availability and favorable soil conditions such as lower bulk density and better root growth. These results are consistent with the findings of Parihar et al. (2016).
The model slightly over-predicted the grain yield in treatments without (N0) nitrogen application. Previous studies such as Yang et al. (2013) and Timsina and Humphreys (2006) also reported poorer performance of the DSSAT model for without N fertilizer treatments than with N fertilizer treatments. In our study, the initial soil nitrogen level was slightly higher, and the model over predicted the grain yield in N0 plots. This might be due to the DSSAT crop model being more sensitive to initial soil nitrogen conditions than the real crop growth under without N fertilizer conditions. ZT plots recorded higher grain yield than CT, which was primarily due to higher nitrogen availability and uptake due to more favorable soil conditions.
It was observed that NH4+-N concentration was very low in both the CT and ZT plots compared to nitrate-N. When ammonium is added to the soil, or released from organic matter by mineralization, it is usually nitrified rapidly to NO3−-N. This is due to the fact that the diffusion rate of NO3− and NH4+ in the rhizosphere is greatly different, with NH4+ being adsorbed to the soil solid phase and having an effective diffusion coefficient that is 121 times less than that of NO3−-N (Barber, 1995). In both the CT and ZT conditions, model simulations suggested that NH4+-N concentrations were similar and the amount of NH4+-N increased after the nitrogen application. But instantly it underwent nitrification and converted into nitrate and gradually, its concentration decreased to insignificance. After fertilizer nitrogen application, higher concentration of NH4+-N resulted in higher ammonia volatilization. This is because NH4+-N acts as a substrate for ammonia volatilization, leading to an elevated release of ammonia into the atmosphere. Earlier (Hu and Li, 1993) and recent work (Miao et al., 2015) revealed that soil ammonium N was small and neither its content (mg kg−1) nor its amount (kg ha−1 at a given depth) had correlation with wheat yield.
The nitrate concentration displayed an upward slope with increasing fertilizer N rates and temperature, as warmer conditions may stimulate nitrifying bacteria and enhance the nitrification rate. (Figure 6). The findings obtained in this study align with the experimental results reported by Liu et al. (2003) and Zhao et al. (2006). In contrast to NH4+-N, nitrate-N exhibits distinct characteristics in soil. Notably, nitrate-N has the ability to rapidly diffuse through the soil and can continuously transport toward plant roots via mass flow, facilitated by the process of plant transpiration. These dynamic properties enable nitrate-N to efficiently supply nutrients to the roots and influence plant growth and development more actively compared to NH4+-N. Zero tillage (ZT) plots recorded higher soil nitrate content compared to conventional tillage (CT) plots (Figure 6). This observation can be attributed to two primary factors. Firstly, ZT plots had higher initial nitrate content, contributing to the overall higher nitrate levels in the soil throughout the season. Secondly, the higher available nitrogen and more favorable conditions for nitrification in ZT plots facilitated the conversion of ammonium to nitrate, further augmenting the nitrate content in the soil.
During the rapid growth of crop, the soil nitrate concentration remained low and highly dynamic, indicating that it was consumed at a rate comparable to its production. Basal application of the nitrogen resulted in the higher accumulation of nitrate in the soil as the crop uptake was negligible at this time (Figure 6). During the rapid growth of the crop, i.e., at 60 DAS, nitrate concentration was comparatively low in the soil due to higher demand during peak crop growth stage. At around 85–90 DAS, in spite of nitrogen application, soil nitrate did not accumulate. This can be attributed to the fact that there was synchronization of crop N demand and soil supply of the nitrogen. After the application of fertilizer, nitrogen uptake exhibited a sharp upward curve in all treatments. The model’s simulations were in agreement with the findings of Jackson et al. (1989, 2008), further supporting the accuracy of the model.
Nitrate-N accumulation in plants is common and considered a safe nitrogen source with no detrimental effects (Wang and Li, 1996; Gruda, 2005), ensuring smooth N nutrition, and vigorous growth of the plants, guaranteeing nitrogen availability (Van der Leij et al., 1998; Li et al., 2009). Consequently, plants with higher nitrate accumulation experience an elongated growth period, allowing them to accumulate more photosynthetic products. This could be the likely reason for the wheat plants with higher soil nitrate and fertilizer N application taking more days to reach physiological maturity compared to plants with lower soil nitrate and no fertilizer N application. The additional nitrogen resources likely support prolonged growth, leading to increased photosynthetic activity and delayed maturity.
In our study, ammonia volatilization increased when NH4+-N levels were higher after the fertilizer nitrogen application. This phenomenon is attributed to NH4+-N acting as a substrate for ammonia volatilization, thereby resulting in an increased release of ammonia into the atmosphere. The rise of the volatilization curve in the initial stage and at around 39–40 DAS may be attributed to the N applications as basal dose and at 37 DAS, respectively (Figure 7). This increment was noticed in all the nitrogen management options across the years and the highest volatilization was observed in case of USG. This outcome can be attributed to the fact that the rate of nitrogen application through USG as a basal treatment was the highest among all the other treatments. This increase in the volatilization rate was also coincided with the higher temperature at both the stages of fertilizer application, substantiating the notion that volatilization is a temperature-dependent and substrate-dependent reaction. In case of plots without nitrogen application, the volatilization was negligible as there was no NH4+ was available as substrate for volatilization. Ammonia volatilization may also diminish the NH4+ in soil, reducing the nitrate nitrogen in soil which, in turn, may reduce the subsequent nitrate leaching. Therefore, these loss mechanisms are intricately interconnected, with temperature assuming a pivotal role and acting as the primary catalyst of these reactions.
In the years 2019 and 2020, nitrogen leaching was minimal. It may be attributed to the absence of intense precipitation increasing the amount of effective rainfall, and controlled irrigation during the cropping season. Another possible explanation could be attributed to the water-solubility of nitrate, which allows it to leach and subsequently rise through capillary action back to the root zone. The model also incorporates this phenomenon, accounting for the upward water flux facilitated by capillary action. This observation is corroborated by the findings of Godwin and Singh (1998). In the year 2021, the leaching was triggered slightly at around 80–90 DAS, which was due to coinciding N fertilizer application and a rainfall event. The N leaching loss was higher under ZT system when compared to the CT which may be attributed to the higher soil porosity observed in the ZT system. The significance of this information lies in its contribution to enhancing comprehension of crop-soil nitrogen dynamic processes, thereby highlighting the DSSAT model’s immense potential in simulating soil NO3−-N dynamics.
The comprehensive study’s findings hold substantial implications for agriculture, specifically in enhancing crop growth, yield, and understanding soil nitrogen dynamics. The observed sharp increases in nitrogen uptake around 30 and 100 days after sowing (DAS) underscore the critical influence of both nitrate availability and higher temperatures on enhancing crop nitrogen absorption. This knowledge offers farmers valuable insights into optimizing nitrogen application strategies concerning specific growth stages, maximizing nutrient uptake, and subsequently improving crop productivity. The accurate simulation of phenological growth stages by the DSSAT-Ceres-wheat model emphasizes its usefulness in predicting plant development under varying conditions. Farmers can leverage this information to fine-tune cultivation practices, such as the timing of nitrogen application, considering its impact on both anthesis and physiological maturity. Additionally, the model’s capacity to simulate leaf area index (LAI) growth and its correlation with nitrogen availability presents a practical tool for predicting plant vigor and adjusting management practices. Moreover, the identification of higher grain yields in zero-tillage (ZT) plots due to improved soil conditions and nitrogen availability provides a clear directive for farmers aiming to enhance productivity through soil management techniques.
Comparing these results with existing knowledge in weather and nitrogen dynamics reveals nuanced insights. The study evaluates previous research indicating the sensitivity of the DSSAT model to initial soil nitrogen conditions, thereby emphasizing the importance of accurately accounting for nitrogen levels in model simulations. Moreover, the study corroborates the role of temperature in ammonia volatilization and nitrate leaching, emphasizing the need for climate-informed management strategies to minimize nitrogen losses and maximize its availability for crops. The detailed observations on nitrate dynamics underscore the impact of temperature and soil management practices, highlighting the potential for optimizing nitrogen application rates based on these factors to mitigate leaching losses and enhance nutrient use by crops.
Policymakers can benefit from these findings by understanding the intricate relationship between weather, nitrogen dynamics, and crop performance. Incorporating this knowledge into agricultural policies can support initiatives promoting efficient nitrogen management practices, potentially reducing environmental impacts associated with excessive nitrogen application. Additionally, these insights can aid in formulating guidelines or advisories for farmers, promoting efficient nitrogen use to optimize crop yield while minimizing environmental pollution risks.
In this study, the used the CSM-CERES-Wheat model showcased its efficacy in replicating crop growth and nutrient dynamics across diverse soil environmental conditions for the widely cultivated wheat HD2967 variety. The model demonstrated satisfactory simulation of grain yield, biomass yield, leaf area index, and various components of nitrogen dynamics under different nitrogen management options, both in conventional tillage (CT) and CA-based zero tillage (ZT) systems.
The results of this research contribute significantly to the field of agricultural modeling by demonstrating the practical application of the CSM-CERES-Wheat model in predicting wheat growth and nutrient dynamics. By offering insights into the genotype-environment-management interactions, this study aids in optimizing agricultural practices for improved wheat yield in varying climatic conditions. The identified model challenges serve as a catalyst for further refinement, emphasizing the importance of continued testing and fine-tuning using expanded datasets to enhance its accuracy and applicability.
The original contributions presented in the study are included in the article/Supplementary material, further inquiries can be directed to the corresponding author.
KK: Formal analysis, Investigation, Writing – review & editing. CP: Conceptualization, Data curation, Resources, Supervision, Writing – original draft. DRS: Writing – review & editing. SG: Software, Writing – review & editing. KP: Writing – review & editing. AS: Writing – review & editing. KR: Writing – review & editing. PG: Writing – review & editing. SB: Writing – review & editing. AM: Writing – review & editing. TD: Writing – review & editing. SJ: Writing – review & editing. DKS: Writing – review & editing. YS: Conceptualization, Writing – review & editing. MG: Writing – review & editing. US: Writing – review & editing. HN: Writing – review & editing.
The author(s) declare that no financial support was received for the research.
KK would like to express his sincere gratitude to the Indian Council of Agricultural Research (ICAR) for granting the study leaves as in-service candidates to complete his PhD. Additionally, we would like to thank the ICAR-Indian Agricultural Research Institute (IARI) for the facilities they provided. KK would also like to acknowledge the ICAR-IIFSR for their support and assistance in granting study leaves. We would like to acknowledge Indian Council of Agricultural Research (ICAR)-W3 grant to CIMMYT for Conservation Agriculture for support. We would like to acknowledge to the Divisions of Agronomy, Plant Physiology, Agricultural Physics, and Soil Science & Agricultural Chemistry of ICAR-IARI, New Delhi and ICAR-Indian Institute of Maize Research (IIMR) for their support. Special thanks to Dr. Renu Pandey, Pr. Scientist, ICAR-IARI, Dr. V. K. Sharma, Pr. Scientist, ICAR-IARI, Dr. Rajkumar Dhakad, Scientist, ICAR-IARI, and Mr. Sanjeev Kumar of ICAR-IIMR for their help in data management and analysis.
The authors declare that the research was conducted in the absence of any commercial or financial relationships that could be construed as a potential conflict of interest.
All claims expressed in this article are solely those of the authors and do not necessarily represent those of their affiliated organizations, or those of the publisher, the editors and the reviewers. Any product that may be evaluated in this article, or claim that may be made by its manufacturer, is not guaranteed or endorsed by the publisher.
The Supplementary material for this article can be found online at: https://www.frontiersin.org/articles/10.3389/fsufs.2024.1321472/full#supplementary-material
Ahmed, M. (2011) APSIM and DSSAT models as decision support tools. In Proceedings of the 19th international congress on modelling and simulation, MODSIM. Perth, Australia; pp. 1174–1180.
Barber, S. A., (1995). Soil nutrient bioavailability: a mechanistic approach, JohnWiley, New York, 180–181.
Boote, K. J. (1999). “Concepts for calibrating crop growth models” in DSSAT. eds. G. Hoogenboom, P. W. Wilkens, and G. Y. Tsuji (Honolulu: University of Hawaii), 179–199.
Bouyoucos, G. J. (1962). Hydrometer method improved for making particle size analysis of soil. Agron. J. 54, 464–465. doi: 10.2134/agronj1962.00021962005400050028x
Bremner, J. M. (1965). “Inorganic forms of nitrogen” in Methods of soil analysis. Part 2. Chemical and microbiological properties. ed. A. G. Norman (Madison, WI: ASA and SSSA), 1179–1237.
Chisanga, C. B., Phiri, E., Chizumba, S., and Sichingabula, H. (2015). Evaluating CERES-maize model using planting dates and nitrogen fertilizer in Zambia. J. Agric. Sci. 7, 79–97. doi: 10.5539/jas.v7n3p79
De Sanctis, G., Roggero, P. P., Seddaiu, G., Orsini, R., Porter, C. H., and Jones, J. W. (2012). Long-term no tillage increased soil organic carbon content of rain-fed cereal systems in a Mediterranean area. Eur. J. Agron. 40, 18–27. doi: 10.1016/j.eja.2012.02.002
DeJonge, K. C., Ascough Ii, J. C., Andales, A. A., Hansen, N. C., Garcia, L. A., and Arabi, M. (2012). Improving evapotranspiration simulations in the CERES-maize model under limited irrigation. Agric. Water Manag. 115, 92–103. doi: 10.1016/j.agwat.2012.08.013
Godwin, D. C., and Singh, U. (1998). “Nitrogen balance and crop response to nitrogen in upland and lowland cropping systems” in Understanding options for agricultural production. Systems approaches for sustainable agricultural development. eds. G. Y. Tsuji, G. Hoogenboom, and P. K. Thornton (Dordrecht: Springer)
Gomez, K. A., and Gomez, A. A., (1984). Statistical procedures for agricultural research. John Wiley and Sons, New York. pp. 187
Gruda, N. (2005). Impact of environmental factors on product quality of greenhouse vegetables for fresh consumption. Crit. Rev. Plant Sci. 24, 227–247. doi: 10.1080/07352680591008628
Gungula, D. T., Togun, A. O., and Kling, J. G. (2007). The effects of nitrogen rates on phenology and yield components of early maturing maize cultivars. Global J. Pure Appl. Sci. 13, 319–324. doi: 10.4314/gjpas.v13i3.16711
Hawkesford, M. J. (2017). Genetic variation in traits for nitrogen use efficiency in wheat. J. Exp. Bot. 68, 2627–2632. doi: 10.1093/jxb/erx079
Herrera, J. M., Noulas, C., Stamp, P., and Pellet, D. (2016). Little potential of spring wheat genotypes as a strategy to reduce nitrogen leaching in Central Europe. Agronomy 6, 29–3847. doi: 10.3390/agronomy6020029
Hoogenboom, G., Porter, C. H., Shelia, V., Boote, K. J., Singh, U., White, J. W., et al., (2021). Decision support system for Agrotechnology transfer (DSSAT) version 4.8 DSSAT Foundation, Gainesville, Florida, USA.
Hu, T. T., and Li, S. X., (1993). A reliable soil N availability index, initial NO 3--N in soil profile. Agricultural research in the arid areas, China
Huang, T., Ju, X., and Yang, H. (2017). Nitrate leaching in a winter wheat-summer maize rotation on a calcareous soil as affected by nitrogen and straw management. Sci. Rep. 7:42247. doi: 10.1038/SREP42247
Hunt, L. A., White, J. W., and Hoogenboom, G. (2001). Agronomic data: advances in documentation and protocols for exchange and use. Agric. Syst. 70, 477–492. doi: 10.1016/S0308-521X(01)00056-7
IFDC. (2013). Fertilizer deep placement. IFDC solutions. IFDC, muscle shoals, AL. Available at: http://http//issuu.com/ifdcinfo/docs/fdp_8pg_final_web?e=1773260/1756718
IFDC. (2015). Benefits of the fertilizer deep placement technology for smallholder rice farmers. Available at: http://http//ifdc.org/ifdcmagazine/.
Jackson, L. E., Burger, M., and Cavagnaro, T. R. (2008). Roots, nitrogen transformations, and ecosystem services. Annu. Rev. Plant Biol. 59, 341–363. doi: 10.1146/annurev.arplant.59.032607.092932
Jackson, L. E., Schimel, J. P., and Firestone, M. K. (1989). Short-term partitioning of ammonium and nitrate between plants and microbes in an annual grassland. Soil Biol. Biochem. 21, 409–415. doi: 10.1016/0038-0717(89)90152-1
Jamieson, P. D., Porter, J. R., and Wilson, D. R. (1991). A test of the computer simulation model ARCWHEAT1 on wheat crops grown in New Zealand. Field Crop Res. 27, 337–350. doi: 10.1016/0378-4290(91)90040-3
Jat, S. L., Parihar, C. M., Singh, A. K., Nayak, H. S., Meena, B. R., Kumar, B., et al. (2019). Differential response from nitrogen sources with and without residue management under conservation agriculture on crop yields, water-use and economics in maize-based rotations. Field Crop Res. 236, 96–110. doi: 10.1016/j.fcr.2019.03.017
Jones, J. W., Hoogenboom, G., Porter, C. H., Boote, K. J., Batchelor, W. D., Hunt, L. A., et al. (2003). The DSSAT cropping system model. Eur. J. Agron. 18, 235–265. doi: 10.1016/S1161-0301(02)00107-7
Keeney, D. R., and Nelson, D. W. (1982). “Nitrogen in organic forms” in Methods of soil analysis, agronomy monograph 9, part 2. ed. A. L. Page. 2nd ed (Madison, WI: ASA, SSSA), 643–698.
Kjeldahl, J. (1883). A new method for the determination of nitrogen in organic matter. Zeitschrift. F. Anal. Chemie. 22, 366–382. doi: 10.1007/BF01338151
Klute, A. (1986). “Water retention: laboratory methods” in Methods of soil analysis: part 1 physical and mineralogical methods. ed. A. Klute (Madison, WI: ASSA and SSSA)
Li, S. X., Wang, Z. H., Hu, T. T., Gao, Y. J., and Stewart, B. A. (2009). Nitrogen in dryland soils of China and its management. Adv. Agron. 101, 123–181. doi: 10.1016/S0065-2113(08)00803-1
Liu, X., Ju, X., Zhang, F., Pan, J., and Christie, P. (2003). Nitrogen dynamics and budgets in a winter wheat–maize cropping system in the North China plain. Field Crop Res. 83, 111–124. doi: 10.1016/S0378-4290(03)00068-6
Liu, H. L., Liu, H. B., Lei, Q. L., Zhai, L. M., Wang, H. Y., Zhang, J. Z., et al. (2017). Using the DSSAT model to simulate wheat yield and soil organic carbon under a wheat-maize cropping system in the North China plain. J. Integr. Agric. 16, 2300–2307. doi: 10.1016/S2095-3119(17)61678-2
Liu, H. L., Yang, J. Y., Drury, C. A., Reynolds, W. D., Tan, C. S., Bai, Y. L., et al. (2011). Using the DSSAT-CERES-maize model to simulate crop yield and nitrogen cycling in fields under long-term continuous maize production. Nutr. Cycl. Agroecosyst. 89, 313–328. doi: 10.1007/s10705-010-9396-y
Miao, Y. F., Wang, Z. H., and Li, S. X. (2015). Relation of nitrate N accumulation in drylandsoil with wheat response to N fertilizer. Field Crop Res. 170, 119–130. doi: 10.1016/j.fcr.2014.09.016
Musinguzi, P., Ebanyat, P., Tenywa, J. S., Mwanjalolo, M., Basamba, T. A., Tenywa, M. M., et al. (2014). Using DSSAT-CENTURY model to simulate soil organic carbon dynamics under a low-input maize cropping system. J. Agric. Sci. 6, 120–131. doi: 10.5539/jas.v6n5p120
Nayak, H. S., Parihar, C. M., Mandal, B. N., Patra, K., Jat, S. L., Singh, R., et al. (2022). Point placement of late vegetative stage nitrogen splits increase the productivity, N-use efficiency and profitability of tropical maize under decade long conservation agriculture. European Journal of Agronomy, 133:126417. doi: 10.1016/j.eja.2021.12641
Norman, J. M., and Campbell, G. S. (1989). “Canopy structure” in Plant physiological ecology: field methods and instrumentation. eds. R. W. Pearcy, J. R. Ehlereinger, H. A. Mooney, and P. W. Rundel (London: Chapman and Hall), 301–325.
Norton, R., Davidson, E., Roberts, T., Crosby, G., and Erisman, J. W., (2015). Position paper-nitrogen use efficiency and nutrient performance indicators. A publication of the global partnership on nutrient management contributors about the global partnership on nutrient management. Available at:https://wedocs.unep.org/20.500.11822/10750
Parihar, C. M., Singh, A. K., Jat, S. L., Dey, A., Nayak, H. S., Mandal, B. N., et al. (2020). Soil quality and carbon sequestration under conservation agriculture with balanced nutrition in intensive cereal-based system. Soil Tillage Res. 202:104653. doi: 10.1016/j.still.2020.104653
Parihar, C. M., Yadav, M. R., Jat, S. L., Singh, A. K., Kumar, B., Pradhan, S., et al. (2016). Long term effect of conservation agriculture in maize rotations on total organic carbon, physical and biological properties of a sandy loam soil in north-western indo-Gangetic Plains. Soil Tillage Res. 161, 116–128. doi: 10.1016/j.still.2016.04.001
Rosswall, T., and Paustian, K. (1984). Cycling of nitrogen in modern agricultural systems. Plant Soil 76, 3–21. doi: 10.1007/BF02205563
Sidhu, H. S., Jat, M. L., Singh, Y., Sidhu, R. K., Gupta, N., Singh, P., et al. (2019). Sub-surface drip fertigation with conservation agriculture in a rice-wheat system, a breakthrough for addressing water and nitrogen use efficiency. Agric. Water Manag. 216, 273–283. doi: 10.1016/j.agwat.2019.02.019
Subbiah, B. V., and Asija, G. L. (1956). A rapid procedure for the estimation of available nitrogen in soils. Curr. Sci. 25, 259–260.
Sun, Y., Hu, K., Fan, Z., Wei, Y., Lin, S., and Wang, J. (2013). Simulating the fate of nitrogen and optimizing water and nitrogen management of greenhouse tomato in North China using the EU-Rotate_N model. Agric. Water Manag. 128, 72–84. doi: 10.1016/j.agwat.2013.06.016
Taulemesse, F., Le Gouis, J., Gouache, D., Gibon, Y., and Allard, V. (2015). Post-flowering nitrate uptake in wheat is controlled by N status at flowering, with a putative major role of root nitrate transporter NRT2.1. PLoS One 10:e0120291. doi: 10.1371/journal.pone.0120291
Timsina, J., and Humphreys, E. J. A. S. (2006). Performance of CERES-Rice and CERES-wheat models in rice–wheat systems. Agric. Syst. 90, 5–31. doi: 10.1016/j.agsy.2005.11.007
Van der Leij, M., Smith, S. J., and Miller, A. J. (1998). Remobilisation of vacuolar stored nitrate in barley root cells. Planta 205, 64–72. doi: 10.1007/s004250050297
Wang, Z. H., and Li, S. X. (1996). Relationships between nitrate contents and water, total N as well as total P in different organs of vegetable plants. J. Plant Nutr. Fertil. 2, 144–152.
Willmott, C. J., Ackleson, G. S., Davis, R. E., Feddema, J. J., Klink, K. M., Legates, D. R., et al. (1985). Statistics for the evaluation and comparison of models. J. Geophys. Res. 90, 8995–9005. doi: 10.1029/JC090iC05p08995
Wu, C., Anlauf, R., and Ma, Y. (2013). Application of the DSSAT model to simulate wheat growth in eastern China. J. Agric. Sci. 5, 198–208. doi: 10.5539/jas.v5n5p198
Yang, H. S., Dobermann, A., Lindquist, J. L., Walters, D. T., Arkebauer, T. J., and Cassman, K. G. (2004). Hybrid-maize: a maize simulation model that combines two crop modeling approaches. Field Crop Res. 87, 131–154. doi: 10.1016/j.fcr.2003.10.003
Yang, J. M., Yang, J. Y., Dou, S., Yang, X. M., and Hoogenboom, G. (2013). Simulating the effect of long-term fertilization on maize yield and soil C/N dynamics in northeastern China using DSSAT and CENTURY-based soil model. Nutr. Cycl. Agroecosyst. 95, 287–303. doi: 10.1007/s10705-013-9563-z
Zhang, H., Zhang, C., Sun, P., Jiang, X., Xu, G., and Yang, J. (2022). Optimizing planting density and nitrogen application to enhance profit and nitrogen use of summer maize in Huanghuaihai region of China. Sci. Rep. 12:2704. doi: 10.1002/agj2.20334
Keywords: nitrogen dynamics, conservation agriculture, DSSAT-CERES-wheat, mechanistic crop growth models, crop simulation
Citation: Kumar K, Parihar CM, Sena DR, Godara S, Patra K, Sarkar A, Reddy KS, Ghasal PC, Bharadwaj S, Meena AL, Das TK, Jat SL, Sharma DK, Saharawat YS, Gathala MK, Singh U and Nayak HS (2024) Modeling the growth, yield and N dynamics of wheat for decoding the tillage and nitrogen nexus in 8-years long-term conservation agriculture based maize-wheat system. Front. Sustain. Food Syst. 8:1321472. doi: 10.3389/fsufs.2024.1321472
Edited by:
Farirai Rusere, University of the Witwatersrand, South AfricaReviewed by:
Priscilla Ntuchu Kephe, Potsdam Institute for Climate Impact Research (PIK), GermanyCopyright © 2024 Kumar, Parihar, Sena, Godara, Patra, Sarkar, Reddy, Ghasal, Bharadwaj, Meena, Das, Jat, Sharma, Saharawat, Gathala, Singh and Nayak. This is an open-access article distributed under the terms of the Creative Commons Attribution License (CC BY). The use, distribution or reproduction in other forums is permitted, provided the original author(s) and the copyright owner(s) are credited and that the original publication in this journal is cited, in accordance with accepted academic practice. No use, distribution or reproduction is permitted which does not comply with these terms.
*Correspondence: C. M. Parihar, cGFyaWhhcmNtQGdtYWlsLmNvbQ==
Disclaimer: All claims expressed in this article are solely those of the authors and do not necessarily represent those of their affiliated organizations, or those of the publisher, the editors and the reviewers. Any product that may be evaluated in this article or claim that may be made by its manufacturer is not guaranteed or endorsed by the publisher.
Research integrity at Frontiers
Learn more about the work of our research integrity team to safeguard the quality of each article we publish.