 Renée P. M. Cardinaals
 E. Verly Jr2
 O. Jolliet
 H. H. E. Van Zanten
 T. Huppertz
94% of researchers rate our articles as excellent or good
Learn more about the work of our research integrity team to safeguard the quality of each article we publish.
Find out more
ORIGINAL RESEARCH article
Front. Sustain. Food Syst., 30 May 2024
Sec. Nutrition and Sustainable Diets
Volume 8 - 2024 | https://doi.org/10.3389/fsufs.2024.1304752
This article is part of the Research TopicPushing The Frontiers Of Nutritional Life Cycle Assessment (nLCA) To Identify Globally Equitable And Sustainable Agri-Food SystemsView all 15 articles
The triple burden of obesity, undernutrition and climate change calls for systemic action to find solutions that co-benefit human and planetary health. A Nutritional Life Cycle Assessment (nLCA) can be used as a tool to assess the health- and environmental impact of foods and guide a transition to healthy and sustainable diets. Thus far, nLCAs have used the nutrient content of foods to represent their health impact, whereas the disease risk linked to under- or overconsuming certain nutrients, foods or food groups has been largely underutilized. This study explored, for the Dutch diet, the correlation between an indicator for essential nutrient density and for the disease burden of individual food items, i.e., a Nutrient Rich Food index with 24 essential nutrients (NRF24) and the HEalth Nutritional Index (HENI), respectively. NRF24 and HENI scores were calculated for food items contained in the Dutch Food Composition database. A very weak correlation between NRF24 and HENI values confirmed that nutrient density and disease burden should be considered as complementary and thus, that a high nutrient density does not directly imply a low disease burden, and vice versa. Moreover, the direction and strength of the correlation was food group-dependent, with negative correlations between NRF24 and HENI mainly observed for animal-based products, with the exception of dairy. In addition, the correlations between the nutrition-based indicators and indicators for greenhouse gas emissions, land use and water use were mostly weak, which stresses the need to include health impact in traditional LCAs because foods with a high nutrient density and low disease burden can imply trade-offs due to high environmental impacts. We therefore conclude that multiple indicators for health and environmental impact should be considered side-by-side in nLCA to avoid the risk of missing important information and trade-offs when assessing the performance of individual food items for healthy and sustainable diets.
Obesity, undernutrition and climate change are today’s largest threats to human health (Swinburn et al., 2019). Despite attempts, malnutrition continues to increase: trends in obesity, child stunting and wasting, deficiencies in essential micronutrients and maternal anemia are all issues of concern (FAO, IFAD, UNICEF, WFP, and WHO, 2022). Moreover, today’s food systems generate a large share of human-induced environmental impacts, such as greenhouse gas emissions, land use change, acidification, eutrophication and biodiversity loss (Poore and Nemecek, 2018). This “Global Syndemic” calls for systemic action to find solutions that co-benefit human health and planetary health (Swinburn et al., 2019; Branca et al., 2020). In this regard, adopting diets that are simultaneously beneficial for human and planetary health – i.e., healthy and sustainable diets – can be an effective lever of change (Tilman and Clark, 2014; Drewnowski et al., 2020). Such a dietary shift, however, requires the identification of food items that are in line with the desired outcome. If done correctly, such information on food item level can serve as scientific basis for food labeling or food-based dietary guidelines (Bunge et al., 2021).
To identify food items that fit in diets that benefit both human and planetary health, a methodological approach is required that can quantify associated impacts (Green et al., 2020). For environmental impacts of goods and services, Life Cycle Assessment (LCA) is regarded as the principal tool (Thoma et al., 2022). LCA studies can be performed at the food item level to compare or identify products for environment-friendly diets. However, LCA studies generally do not fully consider the primary function of food: to sustain and promote human health via the supply of nutrients and other compounds. This was addressed by the introduction of the nutritional LCA (nLCA) (McLaren et al., 2021). However, there is no consensus about which aspects should be considered and how the function(s) of food should be integrated in an nLCA (McAuliffe et al., 2020; McLaren et al., 2021). For example, an nLCA may use a complementary functional unit that reflects the nutrient content of a food item (Drewnowski et al., 2015; Saarinen et al., 2017; Bianchi et al., 2020). This, however, could favor food items with a high environmental impact relative to a high contribution to daily nutrient requirements. Nutrient profiling systems such as the Nutrient Rich Food (NRF) index, which is commonly referred to as nutrient density, have been used to serve as complementary functional unit in nLCA (Bianchi et al., 2020). However, nutrient profiling systems are subject to several methodological choices that can influence the interpretation of the LCA result (Hallström et al., 2018) as they implicitly weigh the different considered nutrient contributions to recommended daily doses equally irrespective of the magnitude of their health impacts and therefore their application as functional units in nLCA has been debated (McLaren et al., 2021).
Moreover, nutrients are not the only aspect of food that directly affects human health. The consumption of certain foods may also increase or decrease the risks for non-communicable diseases (NCDs) (Afshin et al., 2019). NCDs are chronic diseases that arise from a combination of genetic, physiological, environmental and behavioral risk factors (e.g., cardiovascular diseases, cancers, chronic respiratory diseases and obesity) and are the number one cause of death worldwide. Although highly relevant for human health, very few studies have assessed the direct link between foods and NCDs as an indicator in nLCA (Weidema and Stylianou, 2020). Studies in the United States and Europe have used epidemiologically-based relative risks determined by the Global Burden of Disease (GBD) study for 15 different beneficial and detrimental risk factors (nutrients and food groups) to determine the associated marginal health impacts and to include this as an additional Life Cycle Impact category covering nutritional health impacts (Ernstoff et al., 2020; Stylianou et al., 2021). These studies determined the Disability Adjusted Life Years (DALYs) associated with the food composition in the GBD risk components, but so far they do not cover health impacts that may be related to inadequate nutrient intake for nutrients such as zinc, iron or vitamin A, that are covered separately in the GBD. Other essential nutrients, like vitamin B12, are also not covered. Suggesting the need for combining nutrient based and disease-based approaches. To that regard, some study results suggest that nutrient dense foods will inherently reduce the risk for NCDs (Hoeft et al., 2012; Bruins et al., 2019) but the actual relationship between nutrient density and disease-based indicators on a food item level has not yet been studied. That is, indicators for nutrient density and disease burden have been applied in nLCA independently but this fails to address their possible complementarity (Guo et al., 2022). In the case of some food items, this complementarity may be relevant as a high nutrient density does not rule out other dietary risks, e.g., red meat (Givens, 2018). Moreover, on a dietary level no significant correlation between nutrient density and disease burden has been found, with some diets being nutritionally adequate but linked to high DALYs and other diets being linked to low DALYs but lacking several nutrients (Chen et al., 2019).
In addition to the lack of addressing the relation between nutrient density and disease burden, previous work has shown that trade-offs exist between nutritional and environmental impacts on food item level (Drewnowski et al., 2015; Stylianou et al., 2021). This suggests that there are multiple dimensions that do not correlate and should be considered in nLCA to avoid missing relevant information or make decisions that lead to unforeseen trade-offs or rebound effects. The aim of this study is to gain insight in how indicators for nutrient density and disease burden relate each other, as well as to environmental impacts, and explore how they can be included in nLCA to ultimately make better informed decisions for healthy and sustainable food choices, e.g., through food labelling (Bunge et al., 2021).
Nutrition-based indicators were calculated for 1826 food items in the Dutch Food Composition database, i.e., Nederlands Voedingsstoffenbestand (V7.0) (RIVM, 2021). This database provides nutrient content data on 130 macro- and micronutrients for2207 food items. The following food groups were excluded from the analysis: “alcoholic drinks,” “mixed dishes,” “infant foods,” “herbs and spices” and “miscellaneous.” All non-alcoholic beverages that were either “light” or contained zero calories were also excluded as they may heavily skew the data when scores are calculated on an energy basis. In addition, all food items that lacked data for one or more nutrients required for calculations were omitted from the database. This resulted in a total of 1826 food items divided into 17 food groups (Supplementary Table 1). For these food items two nutrition-based indicators were calculated: a nutrient density score and a score for disease burden.
An NRF24 was calculated based on the algorithm for the commonly used NRF9.3, which calculates the sum of the percentage of recommended daily intakes for nine food components to encourage (i.e., protein, fiber, vitamins A, C, and E, calcium, iron, magnesium, potassium), minus the sum of the percentage of RDAs for three nutrients to limit (i.e., sodium, saturated fat, added sugar) contained in 100 kcal of a food product (Fulgoni et al., 2009; Drewnowski, 2010). The algorithm of the NRF9.3 was adapted so that it only reflected the extent to which a food item can meet recommendations for essential nutrients, and excluded components that have an impact on health by increasing the risk for NCDs (fiber, saturated fat, sugar) (Supplementary Data 1.1). The resulting NRF24 covered 24 essential nutrients: protein, essential fatty acids (DHA, ALA and LA), sodium, potassium, calcium, phosphorous, magnesium, iron, copper, selenium, iodine, zinc, vitamins A, C, D, E, B1, B2, B3, B6, B9 and B12. These 24 nutrients covered all essential vitamins and minerals except for biotin, chloride, choline, chromium, fluoride, manganese, molybdenum and pantothenic acid. These eight nutrients were excluded as nutrient content data was lacking in the NEVO database. The NRF24 was calculated by default per 100 kcal of food item (Equation 1; Supplementary Figure 1).
Equation 1. Algorithm for NRF24 Where ENi = Essential Nutrient i content per 100 g; DRIi = Daily Recommended Intake for nutrient i; E = Energy content of food item (kcal/100 g).
Recommended daily intakes – or adequate intakes when the former were not available – for healthy adults from the Dutch Health Council were used (Health Council of the Netherlands, 2018) (Supplementary Table 2). No distinction was made in recommendations for men and women and an average was used when different for genders. For sodium, the adequate intake of 2000 mg/day as reported by EFSA and WHO was used (WHO, 2012; EFSA, 2023). We assumed no beneficial or unfavorable effects for a nutrient content higher than the recommended intake and therefore the scores were capped at 100% of this value.
The HEalth Nutritional Index (HENI) for a food item is a re-calculation of total Disability Adjusted Life Years (DALYs) due to the content of dietary risk components in the diet to the DALYs per gram of dietary risk component (Stylianou et al., 2021). DALYs represent the sum of years lost due to pre-mature mortality, to time lived in less than full health or to disability due to exposure to a risk factor, such as a dietary risk. Dietary risk components – i.e., calcium, fiber, omega-3 fatty acids from seafood, polyunsaturated fat, trans fatty acids, sodium, fruits, vegetables, milk, legumes, nuts and seeds, red meat, processed meat and whole grains – and the DALYs from insufficient or excess intake levels of these were obtained from the Global Burden of Disease (GBD) study (Afshin et al., 2019). The HENI for a food item indicates the minutes of healthy life lost or gained due to a marginal shift in the dietary risk component content of an adult’s diet under the assumption that the health effect from multiple dietary risk components is independent and additive and that food components not covered by the GBD have neutral health effects. The calculation of HENI scores was similar to Stylianou et al. (2021), while updating the background data, using the latest GBD 2019 relative risks and using Dutch rather than US burden rates. This calculation required three steps: 1. Calculating the Dietary Risk Factors (DRFs) for the Dutch population, using Dutch specific burden rates for the considered diseases, 2. Determining the risk factor content of individual food items from the NEVO database and 3. Multiplying DRFs with risk factor content to calculate the HENI per food item. Calculating DRFs was done by creating a non-linear optimization to find the best dose–response curve for the GBD’s 81 risk-outcome specific relative risks. This resulted in a change in risk per gram change in intake of a dietary risk component. Combining this with the observed burden rates, i.e., μDALYs per 100.000 individuals per year, in the Netherlands for each corresponding disease, resulted in DRFs (Supplementary Data 1.1; Supplementary Table 3). DRFs thereby reflected the amount of μDALYs lost or gained per gram of dietary risk component intake. For each of the 1826 food items the dietary risk component content was either calculated based on data extracted from the food composition data – i.e., for the dietary risks relating to intake of calcium, fiber, seafood omega-3 fatty acids, polyunsaturated fat, trans fatty acids and sodium – or based on the nature of the food item – i.e., for the dietary risks related to fruits, vegetables, milk, legumes, nuts and seeds, red meat, processed meat and whole grains. For composite food items, the dietary risk content was based on ingredient lists published on the website of the premium retailer in the Netherlands (Albert Heijn, 2023). To avoid double counting, the effects of calcium in milk, sodium in processed meat and fiber in fruit, vegetables and legumes, we excluded the diseases that were already considered in the DRFs of calcium, sodium and fiber from the diseases linked to milk, processed meat and fruit, vegetables and legumes, respectively. In the final step, DRFs were multiplied with each food item’s dietary risk component content and a factor of −1 so that a positive HENI reflects minutes of healthy life gained and a negative HENI reflects minutes of healthy life lost per 100 kcal food item consumed (Equation 2; Supplementary Figure 1).
Equation 2. Algorithm for HENI score where DRF=Dietary Risk Factor for i risk factor; R = dietary risk factor component per 100 g; E = energy content (kcal/100 g).
LCA data for three environmental indicators – i.e., Global Warming Potential (GWP), land use (LU) and freshwater use (WU) – was publicly available for a subset of the initial food item dataset, providing LCA data for 200 food items (de Valk et al., 2016; RIVM, 2023). De Valk et al. (2016) selected food items based on their consumption frequency in the Netherlands (de Valk et al., 2016). The LCAs were performed using an attributional approach, followingISO14040 and ISO14044 guidelines. The system boundary was from cultivation to consumer, including end of life processes for food losses and packaging materials. Life Cycle Inventory data was taken from Agri-footprint and Ecoinvent V3, supplemented with in house data from Blonk consultants. For processes with multiple product flows, economic allocation was applied, with the exception for milk products for which physical allocation was applied (IDF, 2015). Inventory data for GWP, land use and freshwater use were translated into midpoint indicators using the LCIA impact model ReCiPe 2016 applying the hierarchical perspective (Huijbregts et al., 2017). GWP was calculated as the sum of CO2 equivalents per kilogram of product for CO2, CH4 and N2O emissions throughout the supply chain of a product. Land use was expressed as the number of square meters required per year for cultivation of food and animal feed and/or for raising livestock (including land transformation if applicable). Freshwater use was calculated as the amount of water consumed by producing 1 kg of product, expressed as m3 per kg. Consumption includes evaporation, incorporation into the product, transfer to other watersheds or disposal into the sea, and is mainly driven by irrigation. For this study, GWP, land use and freshwater use were recalculated per 100 kcal of product. A detailed description of the LCA methodology applied to obtain the environmental indicator data used in this study can be found in Huijbregts et al. (2017).
The analyses were done using the scores of individual food items, food groups and animal-based versus plant-based food items. Food items that contained both animal- and plant-based ingredients were considered “mixed” and were excluded from the animal-based versus plant-based level comparison. All data processing and analyses were performed in RStudio 4.0. First, the correlation between NRF24 and HENI scores for all food items was calculated (n = 1826), and the correlations between NRF24 and HENI, and GWP, LU and WU for the LCA subset of food items were calculated (n = 200). The Spearman rank test was used for all correlations due to non-normality of the scores (Supplementary Figure 2; Supplementary Table 4). Secondly, to evaluate the performance of individual food items and apply this in an n-LCA, food items were categorized based on NRF24 and HENI scores (n = 200). Food items were considered “+/+” when NRF24 scores were ≥ 1.2, based on an optimal score of 24 for a 2000 kcal diet and a 1.2 equivalent for 100 kcal of food item (24 divided by 20), and HENI scores were ≥ 0. Food items were considered “−/−” when NRF24 < 1.2 and HENI <0 while “+/−” and “−/+” food items had an NRF24 ≥ 1.2 and HENI ≥0, and NRF24 < 1.2 and HENI<0, respectively. Thirdly, the categorization of food items in the environmental data subset was evaluated against environmental performance to identify food items that scored well on multiple indicators (n = 200).
Three sensitivity analyses were performed to test the effect of methodological choices on the results. First, we explored the impact of choosing a different reference unit. The correlations described in section 2.4 were therefore performed with NRF24 and HENI scores per 100 g and per serving size. Serving sizes were based on data from the National Institute for Public Health and the Environment (RIVM, 2020). Secondly, an NRF23 score was calculated by excluding sodium from the NRF24 and the correlation between NRF23 and NRF24 was calculated. This was done to assess the impact of excluding sodium as an essential nutrient from the NRF24. Excess sodium intake is not to encouraged for most of the population in developed countries and although capping was applied for individual food items in the main analysis, a combination of multiple high sodium food items into the diet may still result in excess sodium intake. Lastly, the NRF24 was replaced by the more commonly used NRF9.3, calculated as described previously and by Fulgoni et al. (2009) using Dutch recommended intakes (Supplementary Table 2). Nutrient content data could be extracted from the NEVO database, except for added sugars. Because data for added sugar is not included in the NEVO database, and it was not possible to make a distinction between added and natural sugars for each product, data for total sugars was used instead to calculate NRF9.3.
There was no clear association between NRF24 and HENI scores when assessing individual food items (Figure 1). NRF24 scores per 100 kcal ranged from 0.0 to 12.0, with the highest values observed for the food groups Fish and Vegetables and lowest scores for the food groups Sweets & Snacks, Cereal grains, and Condiments (Supplementary Table 5). HENI scores ranged from −38.8 to 50.5 minutes of healthy life lost per 100 kcal, with the highest scores observed for the food group Vegetables and the lowest scores for the food groups Red Meat and Processed Meat (Supplementary Table 5). The Spearman’s rank test confirmed that there was no association between NRF24 and HENI scores with a weak correlation of r = 0.21, p < 0.05. (Supplementary Table 6). However, there was a clustering of food items in the same food group which suggests that food items within food groups have a similar relation between NRF24 and HENI (Figure 1). For the 17 food groups assessed, the correlations showed a large variation in strength and direction among the food groups which explains why the correlation between nutrient density and disease burden for all food items together was very weak (Figure 2; Supplementary Table 7). In general, plant-source products had a strong positive correlation between nutrient density and disease burden (r = 0.62, p < 0.05), especially fruits (r = 0.63), vegetables (r = 0.62), and tubers (r = 0.53), compared to all animal source products together (r = −0.13, p < 0.05) (Supplementary Figure 3). From the plant-source food groups, the correlations for nuts and seeds (r = 0.16) and legumes (r = 0.12) were not significant (p > 0.05). Correlations were negative for poultry, fish, processed meat, red meat, eggs and sweets and snacks. However, only for poultry, fish, processed meat and red meat the animal-based product groups, these negative correlations were significant (p < 0.05). These results show how some specific groups of animal products have a high nutrient density but increase the risk for disease burden while other food groups have a high nutrient density and decrease the risk for disease burden at the same time. In addition, Figure 2 shows that within food groups, there can be a large spread of scores, such as observed for legumes, eggs and dairy.
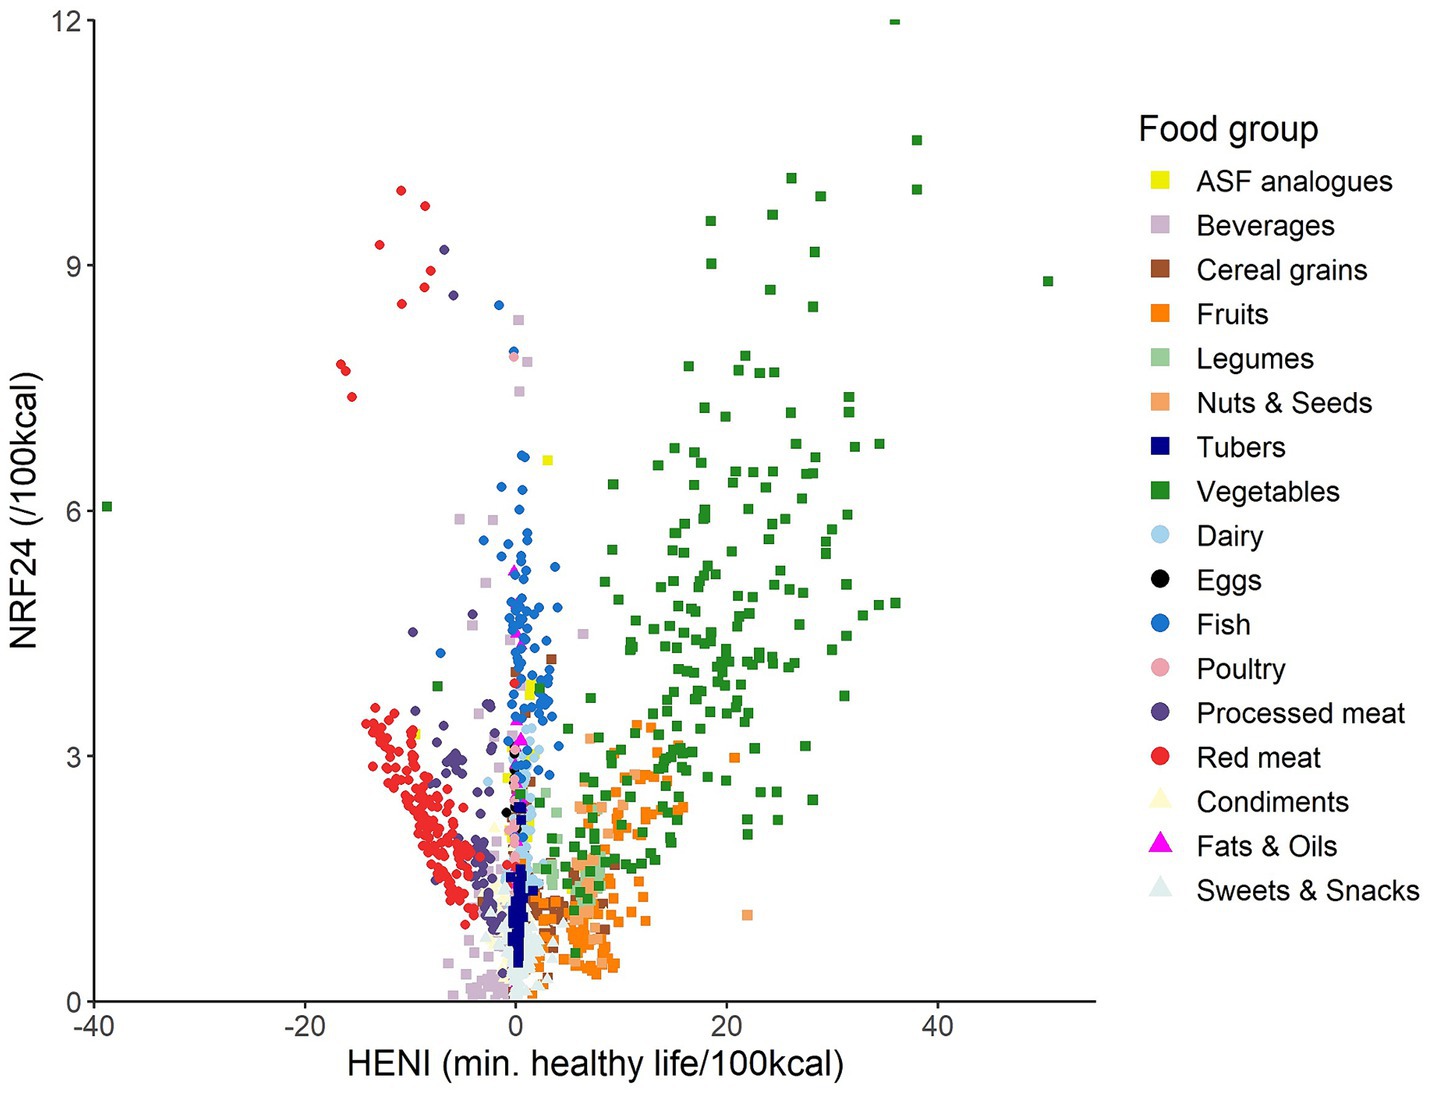
Figure 1. Correlation between NRF24 and HENI scores per 100 kcal for individual food items. Shapes: circles indicate animal-source food items, squares indicate plant-source food items, triangles indicate mixed-source food items.
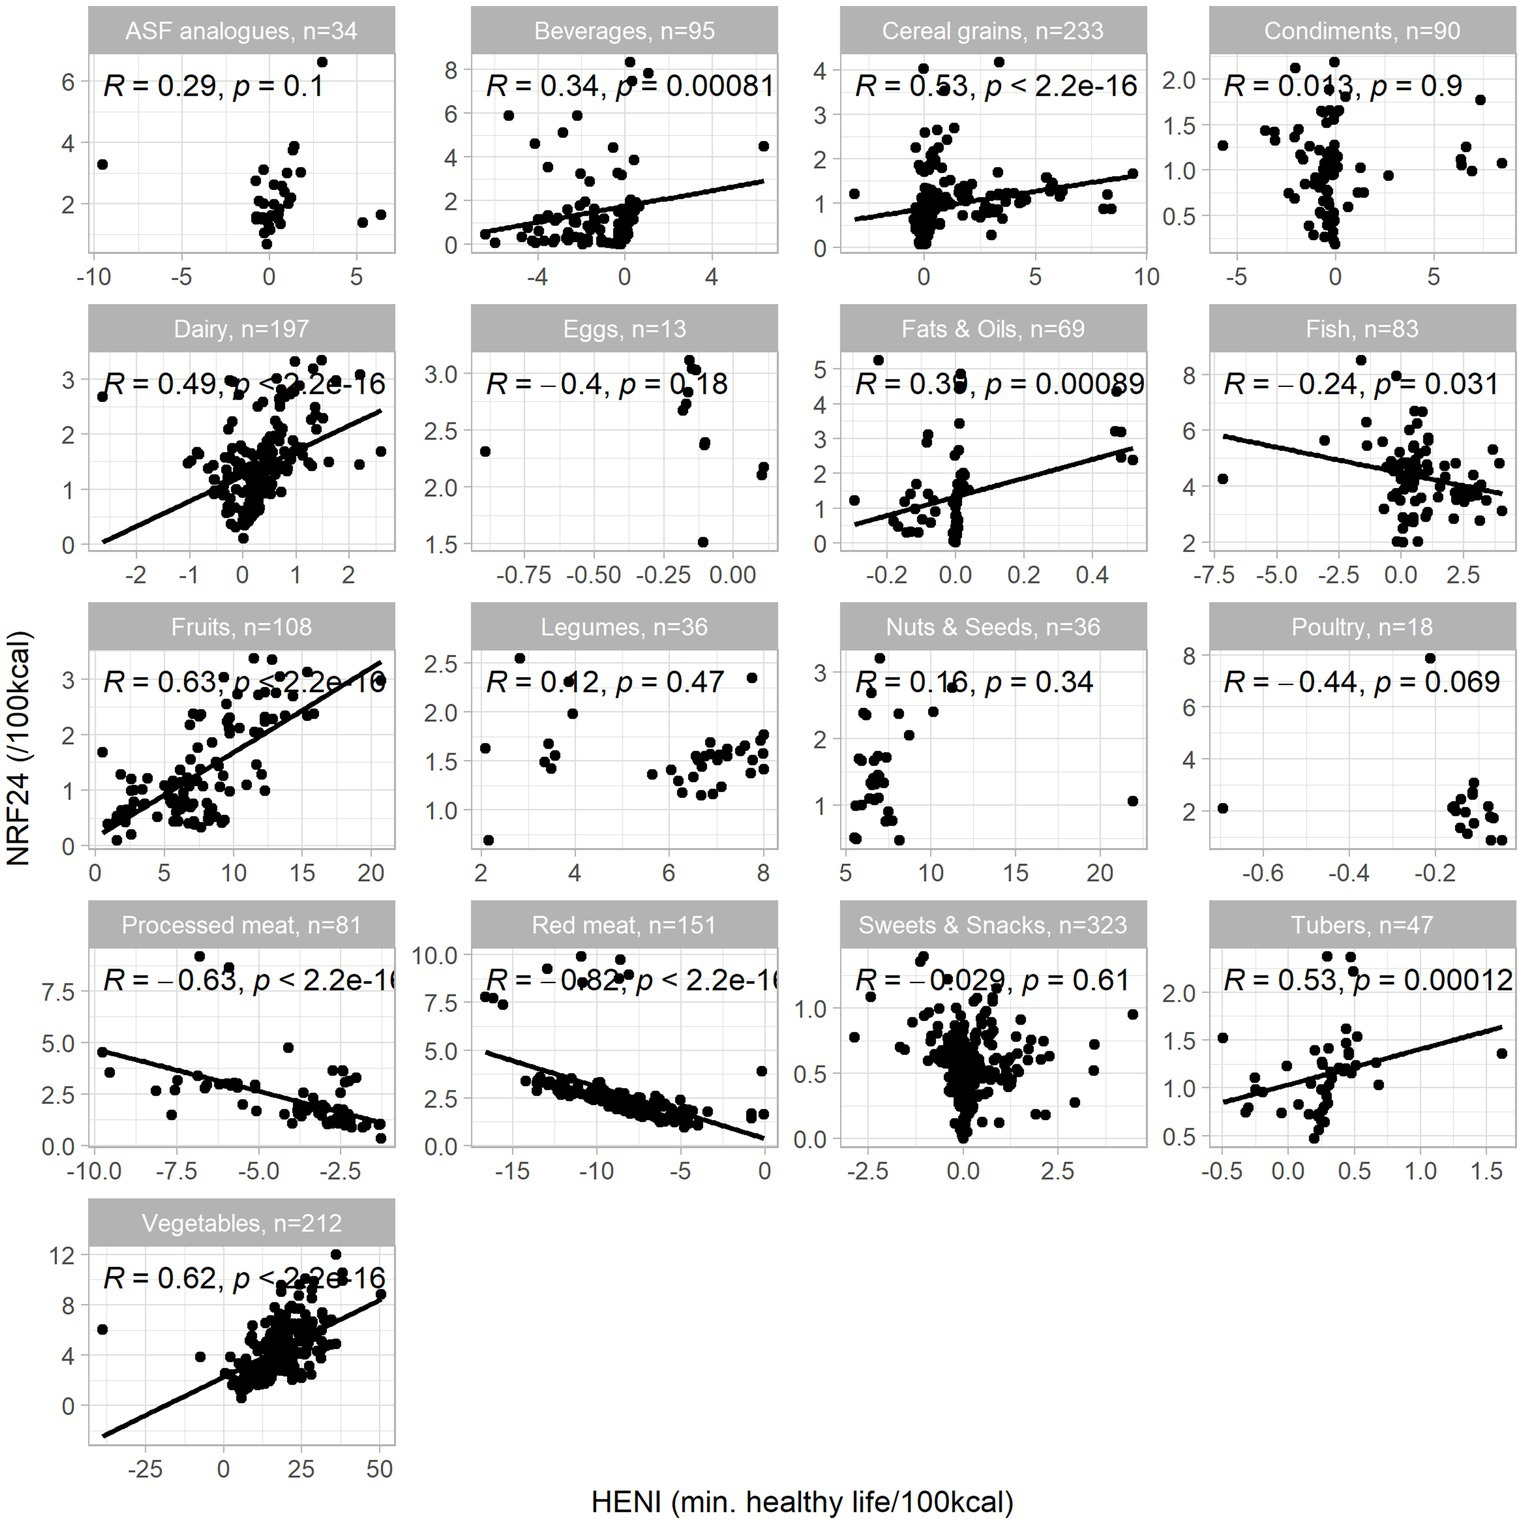
Figure 2. Correlation between NRF24 and HENI scores per 100 kcal for individual food items per food group; n = number of food items included in each food group. Spearman rho (R) and p-values included and best fit lines shown for statistically significant correlations (p < 0.05).
The correlation between NRF24 and HENI and environmental indicators differed widely but no strong correlations were found (Figure 3; Supplementary Table 5). The highest correlation existed between NRF24 and GWP (r = 0.69, p < 0.05), while the correlation for both LU and WU with NRF24 was less strong (r = 0.37 and 0.42, resp.; p < 0.05). There was no significant correlation for both GWP and LU with HENI (p > 0.05) and although statistically significant, HENI and WU were only weakly correlated (r = 0.35). In addition, the relation between HENI and GWP, as well as between HENI and LU, showed a U-shape with an inverse relation that suggests a reduction in environmental impact with an increase in HENI score for the left side of the plot while the right side of the plot suggests that an increase in HENI is related to a higher environmental impact.
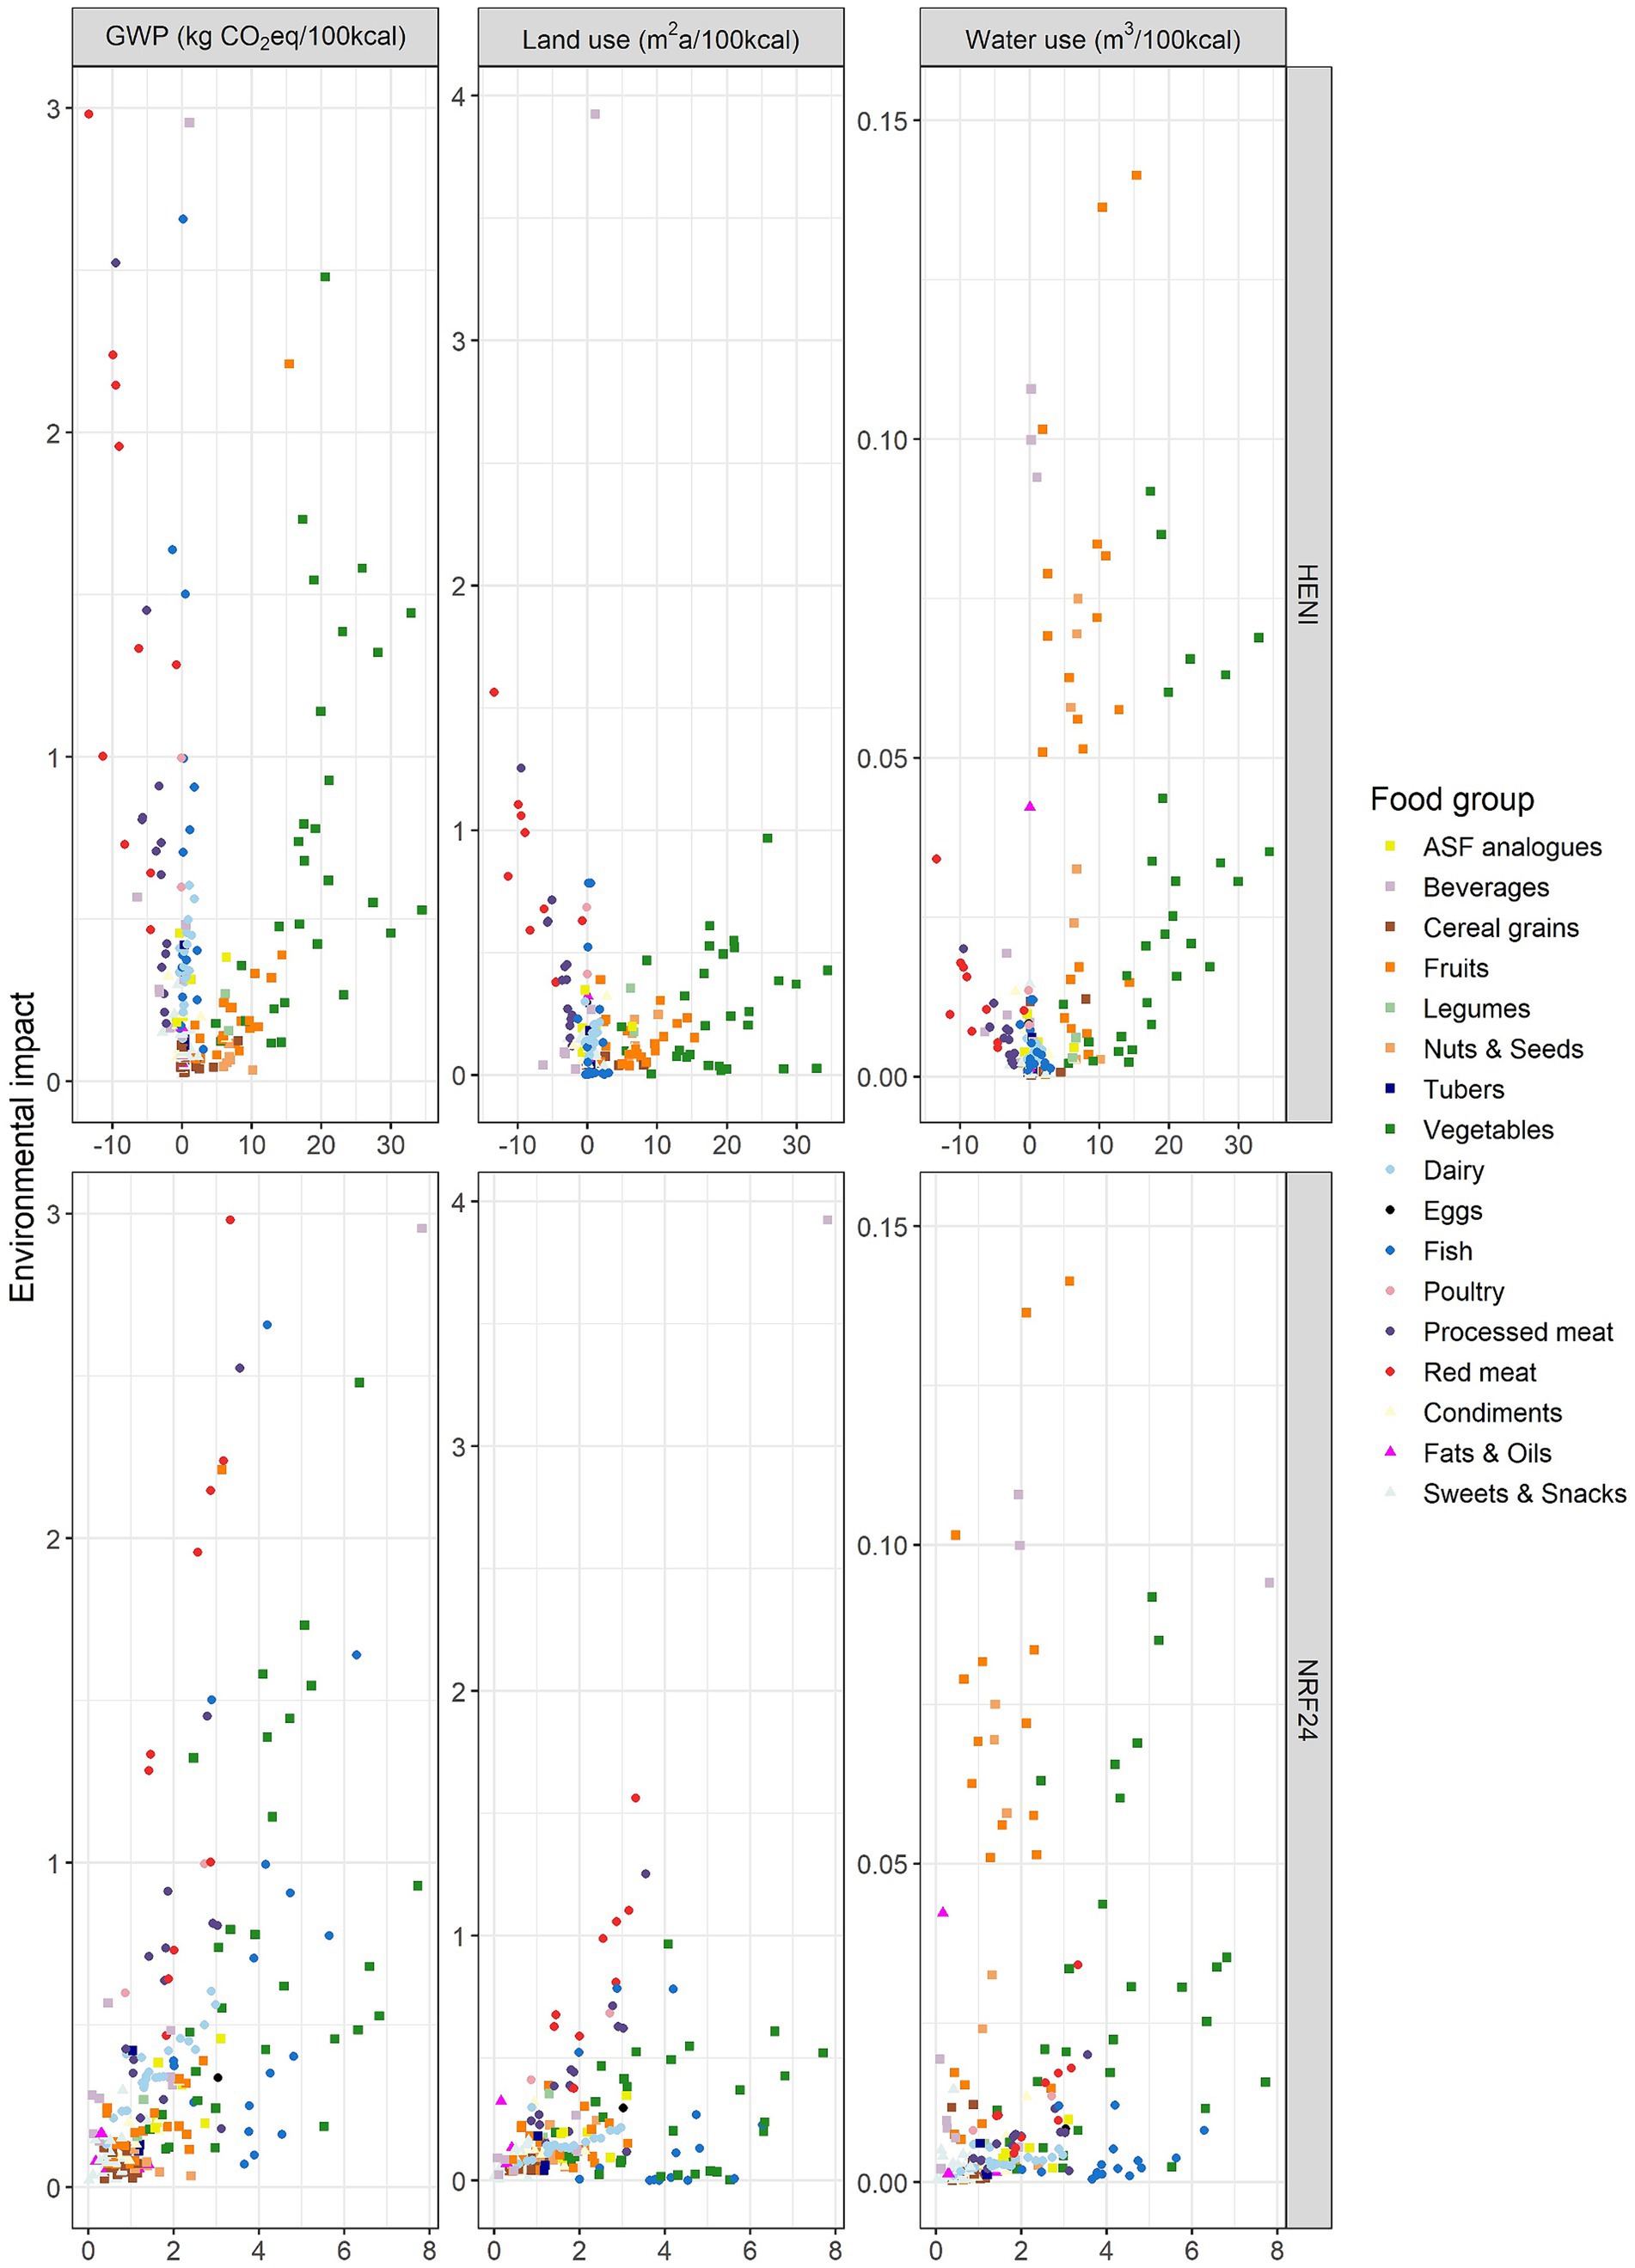
Figure 3. Correlation between nutrition-based indicators (horizontal grids) and environmental impact indicators (vertical grids) per 100 kcal for individual food items. GWP = Global Warming Potential. Shapes: circles indicate animal-source food items, squares indicate plant-source food items, triangles indicate mixed-source food items.
The sensitivity analysis showed that correlations on food group level are different when scores are calculated with mass or serving as reference unit (Supplementary Table 7). The largest changes were observed for food groups containing foods with either a high nutrient density and high energy content (correlations increased) or a low nutrient density and low energy content (correlations decreased). Applying capping in the NRF24 calculation resulted in relatively lower scores than expected when scores were calculated per 100 grams or serving, which ultimately changed the correlation with HENI scores where no capping was applied. Nevertheless, the overall correlation between NRF24 and HENI remains weak with r = −0.16 (p > 0.05) and r = 0.00 (p > 0.05) for scores calculated per 100 grams and per serving, respectively (Supplementary Table 5; Supplementary Figure 4). This indicates that using an alternative reference unit does not change the absence of an association between nutrient density and disease burden.
The correlation between NRF23 (excluding sodium) and NRF24 confirmed little effect from including sodium as an essential nutrient (r = 0.99, p < 0.05). This indicates that it suffices to include the detrimental health effect of excess sodium intake as a dietary risk factor component in the HENI score, and that including it as an essential nutrient in the NRF24 does not skew the results.
The correlation between NRF9.3 and HENI increased compared to NRF24 and HENI (r = 0.20 to r = 0.38) which can be explained by the overlap between the scores, i.e., sodium and fiber are covered by both indicators while added sugar in NRF9.3 is covered to a certain extent by sugar sweetened beverages in the HENI score. Stronger correlations were also found for most food groups (Supplementary Table 8; Supplementary Figure 6). However, the correlation was not strong enough to assume NRF9.3 would suffice as an indicator for both nutrient density and disease burden.
Food items were categorized into “+/+” (NRF24 ≥ 1.2 and HENI≥0), “−/−” (NRF24 < 1.2 and HENI<0) or “+/−” (NRF24 < 1.2 and HENI≥0 or vice versa) categories to gain insight how food items and food groups are performing for both nutrition indicators. We found that most of the assessed food items fell in the “+/+” category (44% of all food items) and the least in the “−/−” category (11% of all food items) (Table 1). Food items that had a high nutrient density but also a high disease burden mainly fell in the food groups red meat and processed meat. Food items with a low nutrient density but a low disease burden were mainly represented by the food groups Cereal grains and Tubers. A large share of food items in the food group Sweets and Snacks also had a low nutrient density and a HENI≥0, although the HENI scores were close to 0. Sweets and Snacks may contain whole grains, nuts, milk, fruits or polyunsaturated fatty acids which gives them an advantage in the HENI score. More so, added sugar is only considered in the HENI score in the case of sugar sweetened beverages – which is globally the largest share of sugar intake (Malik and Hu, 2022) – and therefore Sweets and Snacks are not penalized for their sugar content. This categorization can be used in nLCA as an initial tool to identify health consequences of food items that are preferably avoided from an environmental perspective, e.g., “+/+” foods that have a high environmental impact. Such food items may require a more detailed evaluation before determining their role in a healthy and sustainable diet, depending on the specific context. For example, strawberries would require a high water use per 100 kcal and have a relatively high GWP while at the same time performing well on nutrition-based indicators (Figure 4). Honey, on the other hand, has a low environmental impact but scores low for nutrition-based indicators (Figure 4). Overall, Figure 4 shows that, for the selection of food items assessed, those with the lowest nutrient density and disease burden (red) relatively have lower environmental impacts (left lower corner). Animal source foods had a low water use compared to plant source foods but LU was variable with the highest LU observed for veal and smoke-dried beef.

Table 1. Classification of individual food items based on NRF24 and HENI scores in food items per food group and percentage of food items per food group.
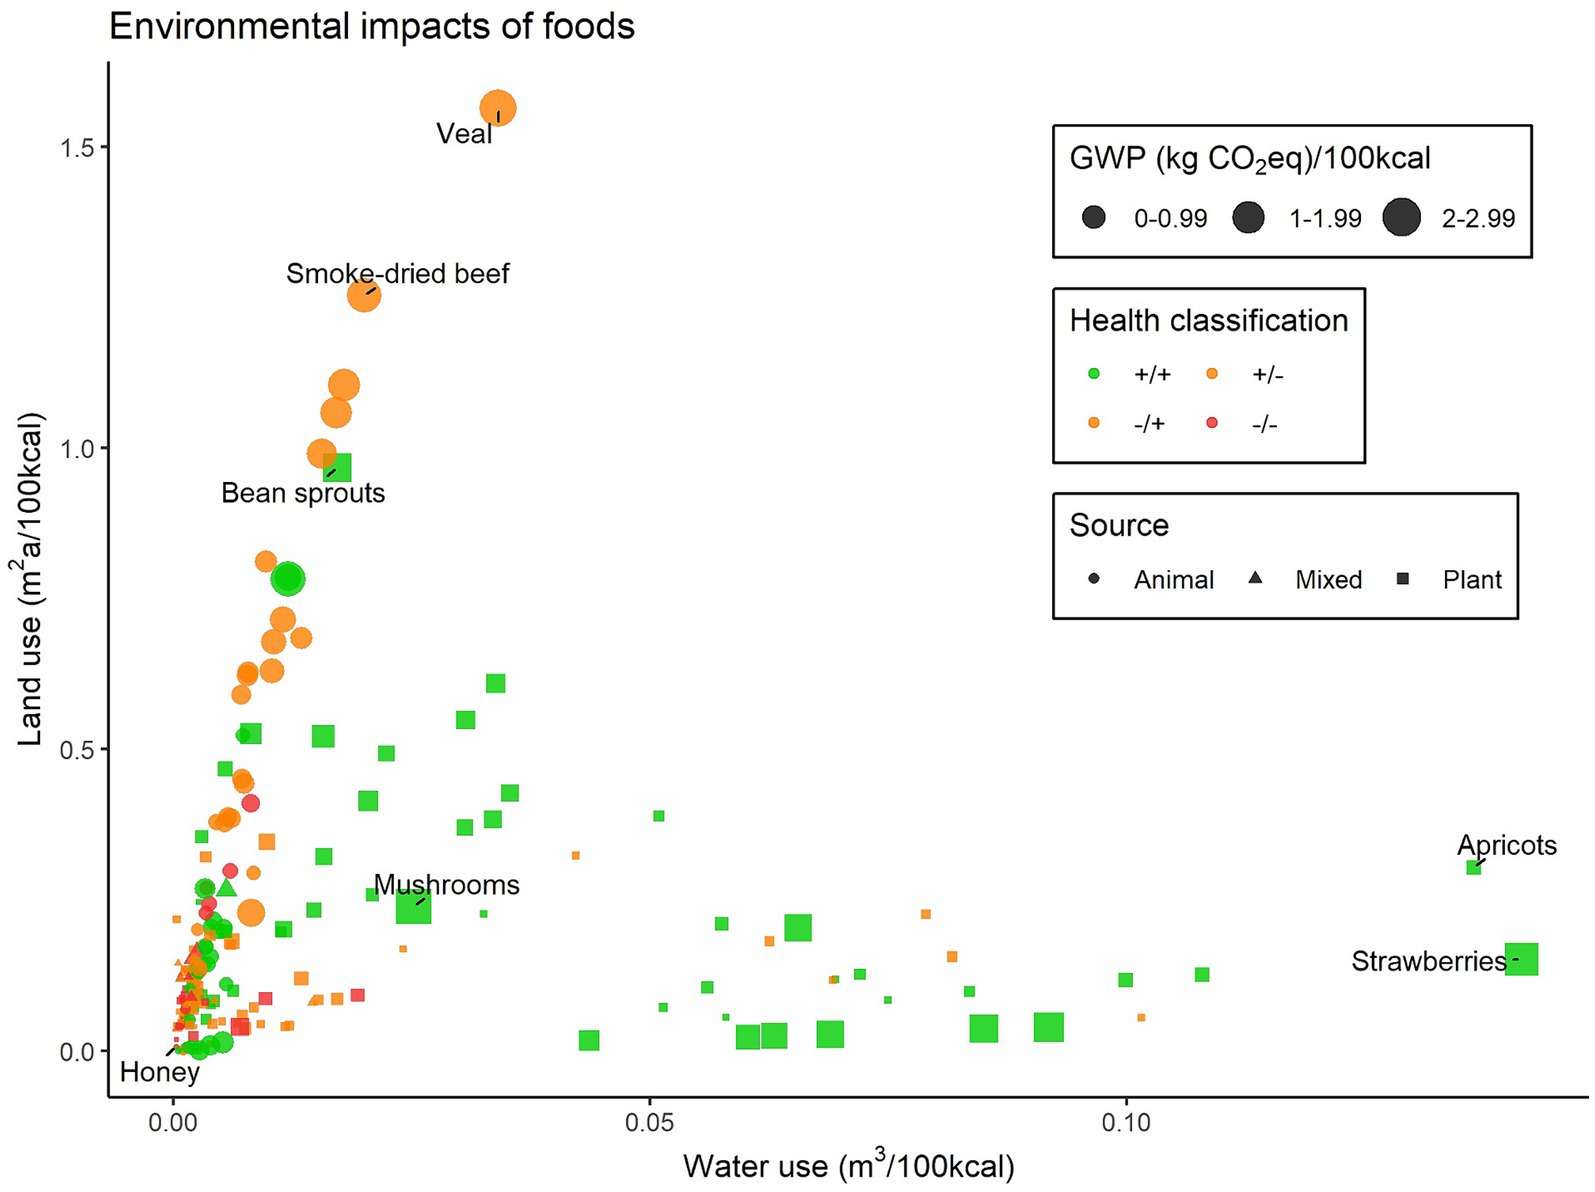
Figure 4. Relation between nutrition-based indicators and environmental impact indicators. Colors indicate the classification of food items based on NRF24 and HENI scores. +/+ = NRF24 ≥ 1.2/HENI≥0, +/− = NRF ≥ 1.2/HENI<0, −/+ = NRF24 < 1.2/HENI≥0, −/− = NRF24 < 1.2/HENI<0. Shapes indicate the source (animal, plant or mixed), size of the shape indicates global warming potential per 100 kcal.
Using nutrition-based indicators as complementary functional units is a method to integrate the nutritional performance of food items into the LCA results. However, the downside of using a nutrition-based indicator with a value below zero as complementary functional unit is that it may lead to wrong interpretation of the LCA result, i.e., a negative value would erroneously suggest positive environmental impacts (Supplementary Figure 7). Negative HENI scores were in this case rescaled so that the lowest value was 0. By using the nutrition-based indicators as complementary functional unit, the relative performance of individual food items may shift. For example, while the values for all environmental indicators go down for almonds when using NRF24 as complementary functional unit, the values for apples increase for all environmental indicators expressed on NRF24 (Figure 5). Such an integrated assessment may be useful to simplify a comparison of relative environmental impacts between food items while taking the function of food into account (Sonesson et al., 2019).
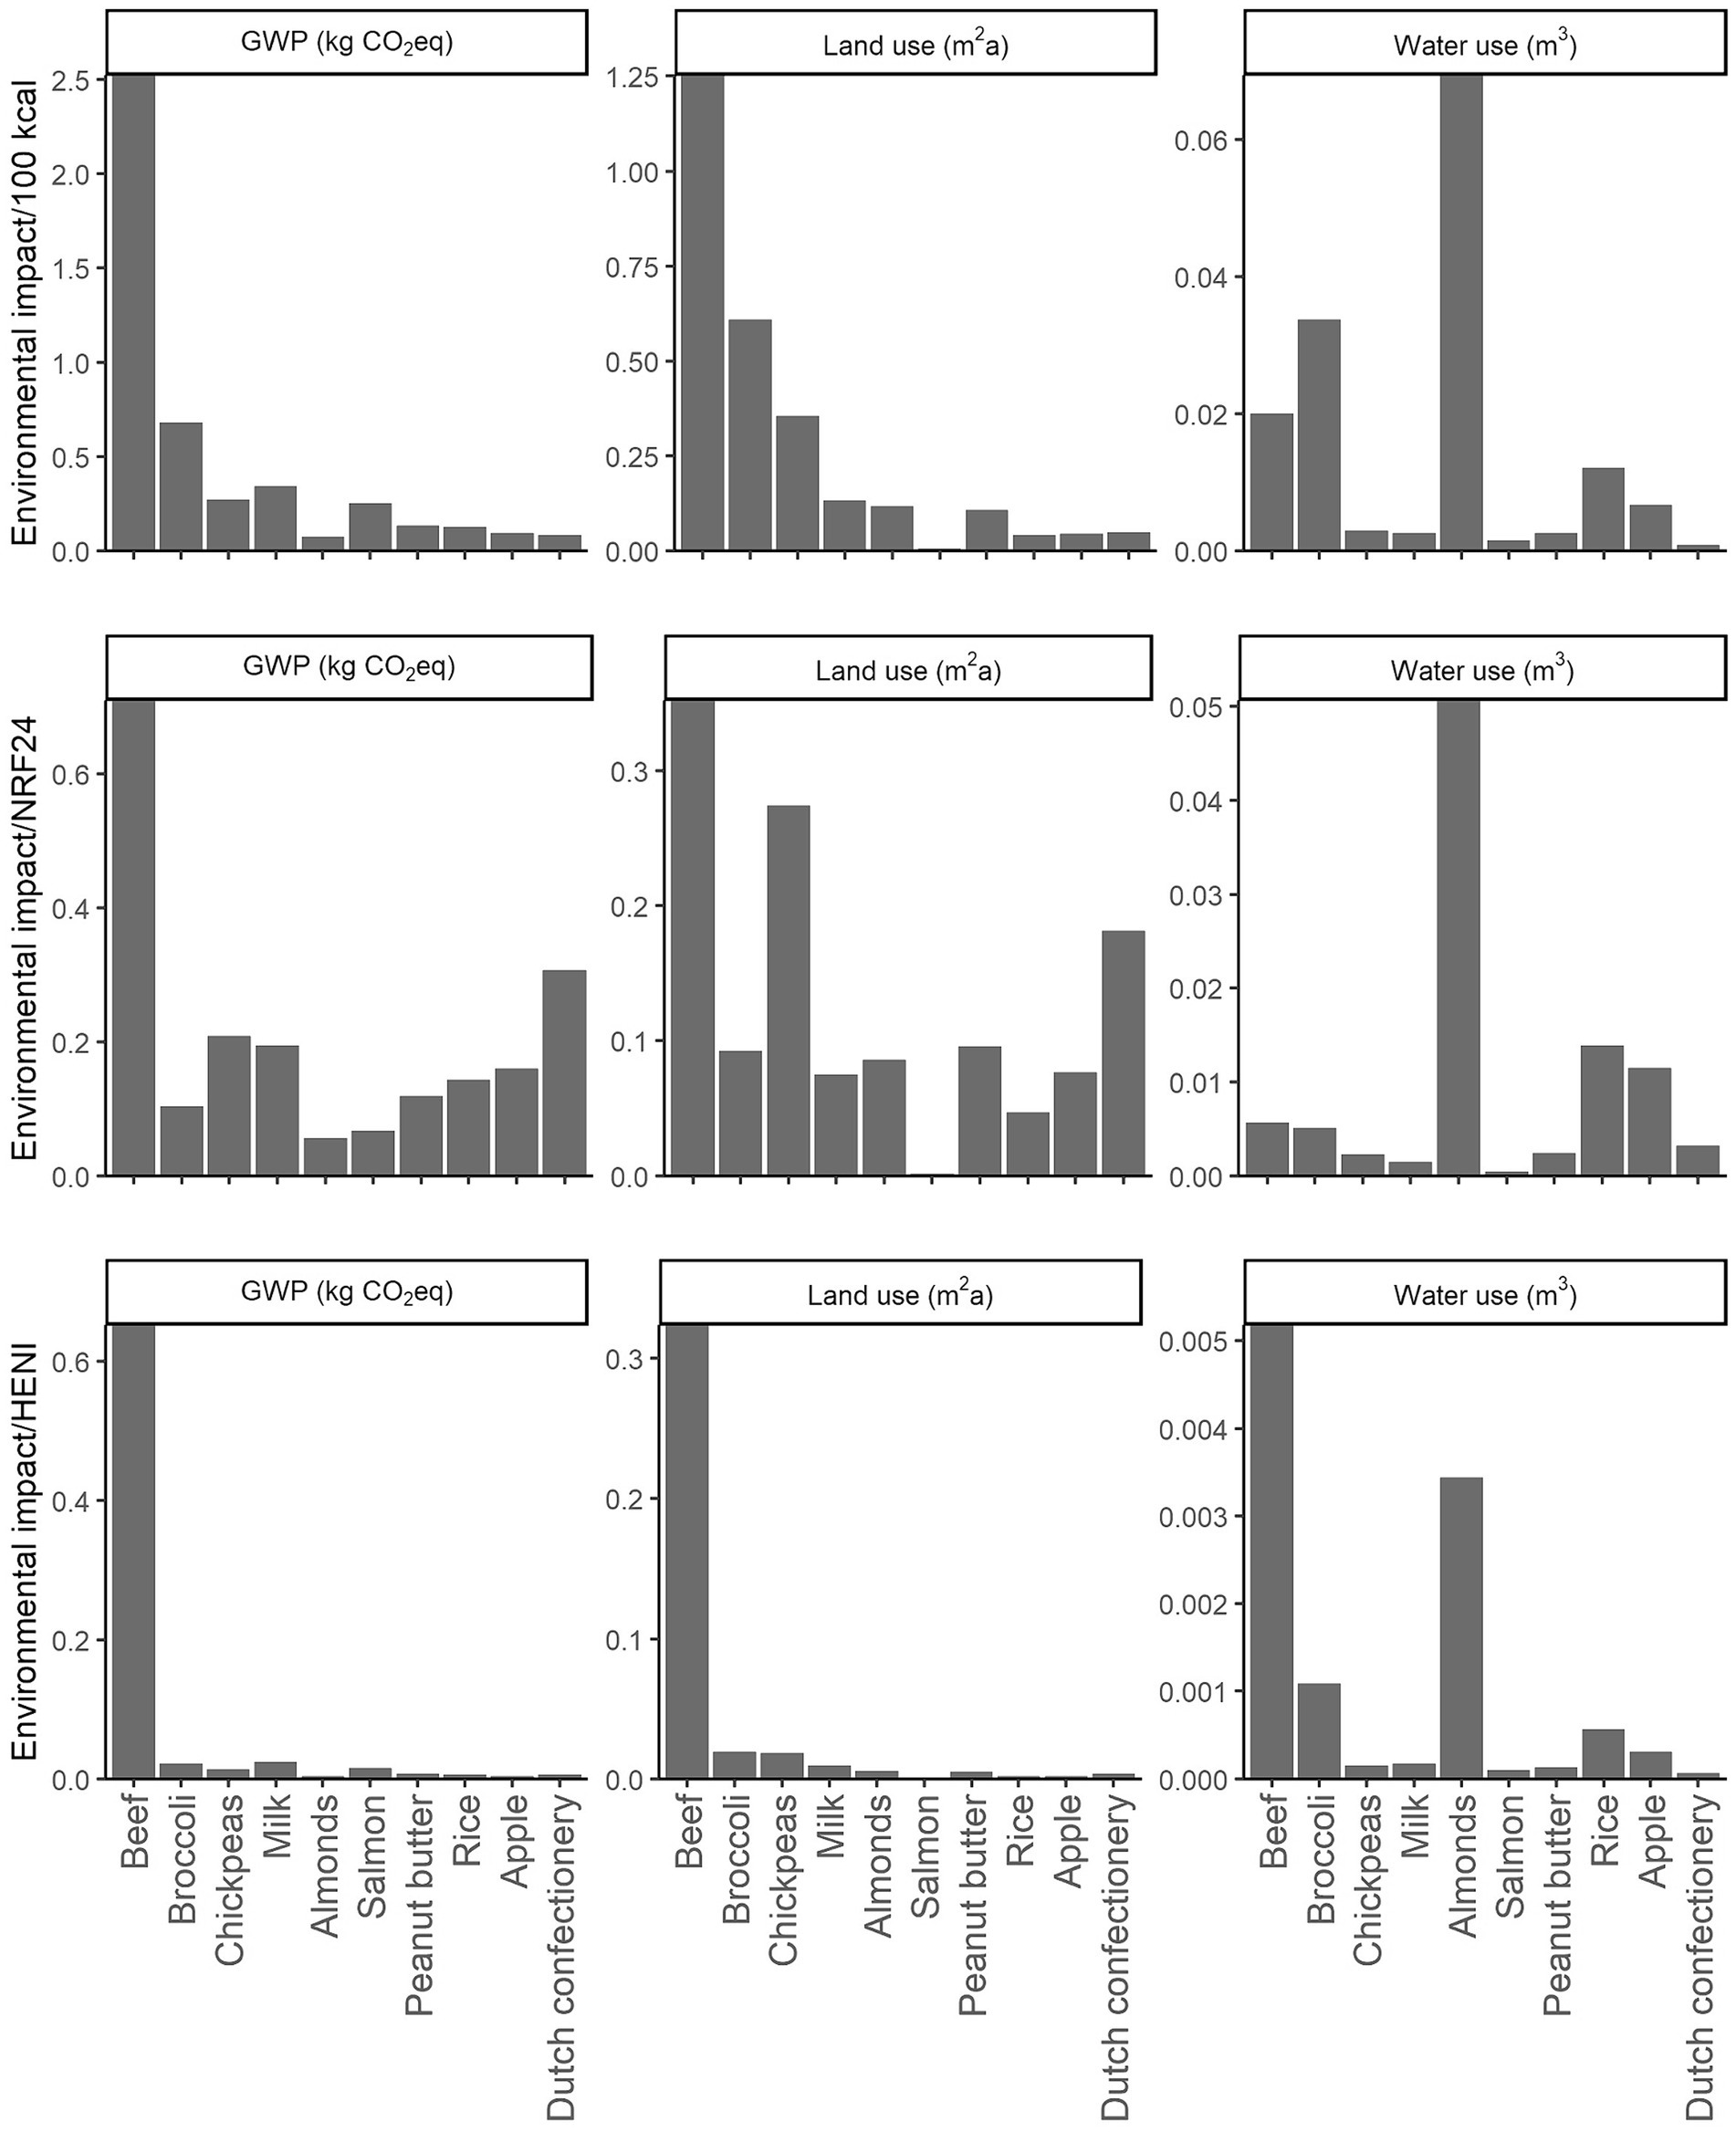
Figure 5. Environmental impacts expressed per 100 kcal (top), NRF24 (middle) or positively scaled HENI (bottom) for a selection of ten food items. GWP, Global Warming Potential.
The results of this study confirm our hypothesis that for individual food items, essential nutrient density and disease burden are independent indicators. That is, a high nutrient density does not directly imply a low disease burden or vice versa. This was supported by an overall weak correlation between NRF24 and HENI of r = 0.32 but with high variation between food groups (Figures 1, 2). Although data sources used were specific for the Netherlands, dietary risks have also been calculated for the US (Stylianou et al., 2021) and for Switzerland (Ernstoff et al., 2020) and we expect the lack of correlation between nutrient density and disease burden to exist regardless of the data source for nutrient content, dietary risk exposure or observed burden.
Assessing indicators that provide unique information helps to identify trade-offs and rebound effects of food consumption choices, and of the encouragement of such choices through policy instruments (Masset et al., 2015; Saarinen et al., 2017; Walker et al., 2019). The high positive correlation between NRF24 and GWP (r = 0.69) suggests that food items with a higher nutrient density have a higher global warming potential (Figure 3). On the other hand, products with both a very low and very high HENI had a higher GWP. This contradicts the suggestion that changing toward a healthy diet inherently reduces the overall impact of the diet (Stehfest et al., 2009; Springmann et al., 2016) but is in line with others (Payne et al., 2016; Saarinen et al., 2017). Our results can confirm that there are certain food products that are “+/+” and some that are “−/−” and thus in- or decreasing those in the diets can lead to synergic benefits for human and planetary health (Table 1). Thus, when diets are far from optimal with a high “−/−” content, synergies can be expected when these foods are replaced with “+/+” foods (Westhoek et al., 2014; Stylianou et al., 2021). In this context, focusing on nutritious diets that are low in dietary risk factors such as trans-fatty acids, sugar sweetened beverages and processed meat is urgently needed to reduce diet-related diseases and obesity. This focus is also applicable to low-income countries where current diets suffer from nutrient inadequacy (Han et al., 2022). In this regard, some studies have shown that there is a point to which health and environmental impact can be improved simultaneously when current diets are far for optimal, while the trade-offs between health and environment appear mainly when it comes to marginal changes within diets (Stylianou et al., 2021; Heerschop et al., 2023). Moreover, the synergic environmental and health benefit from a reduction of animal source foods is also dependent on the functional unit used, e.g., water use in our study is relatively high for 100 kcal of fruits and vegetables, and will even be higher when expressed on protein content, but when expressed on a mass base, these food groups perform relatively well (Sokolow et al., 2019). To complicate things further, unsustainable consumption is not limited to the types of food consumed but also the extent of overconsumption and food waste, two aspects that are positively associated with the environmental impact of the diet (BajŽelj et al., 2015).
Assessments on a food item level can enable stakeholders to create advice or regulations that have shown to be effective for both consumers as well as industry practices (Shangguan et al., 2019). However, food items are not consumed in isolation but together in a meal, as part of a whole diet. Some food items may score low on nutrient density but may be important for the overall dietary quality because they provide unique nutrients that cannot be provided by other foods. Additionally, food items may contain safe amounts of a certain nutrient while a combination of multiple foods in a diet would risk exceeding a threshold above which the nutrient intake becomes detrimental, i.e., as would be the case for sodium or copper. Measuring the health impact of a diet requires a different approach and will lead to different outcomes than assessing the health impact of individual food items. To this regard, it has been shown that nutrient density of the whole diet is associated with modestly lower risks of chronic diseases and all-cause mortality (Chiuve et al., 2011), which contradicts some of our results on food item level. On the other hand, when reporting one score on dietary level, “+/+” food items elevate the score and can thereby make up for “−/−” food items. Therefore, to include the dietary context, a two-step LCA analysis could be useful, where data on individual food item level is assessed first, and the results are then combined into a daily diet (Sonesson et al., 2017).
Methodological choices largely impact the interpretation of data (Conrad et al., 2020), e.g., related to the nutrients selected for nutrient profiling models, the choice of reference unit or how food groups are defined. Firstly, most commonly-used nutrient profiling models include health risks from, e.g., components like fiber, sugar, saturated fat, carbohydrates, cholesterol, flavonoids or omega-3 fatty acids, which are not considered essential nutrients (Bianchi et al., 2020). We showed the value of using a nutrient density score that includes a wide range of essential nutrients, i.e., those nutrients that cannot be synthesized by the human body at all or not in sufficient quantities and should therefore be sourced from food (Challem, 1999). However, only including beneficial nutrients also makes the need for using a complementary indicator for disease burden greater as otherwise detrimental health impacts are overlooked. Generally, the choice of nutrient profiling model depends on the aim of the study but when both nutrient density and disease burden are considered side-by-side, overlap between two scores should be avoided to minimize double rewarding or penalization. This overlap is reflected in the stronger correlation between nutrient density and disease burden for all food items together, as well as for most food groups, when NRF9.3 was used instead of NRF24 (Supplementary Figure 6). Furthermore, a narrow selection of nutrients can limit the comparison of food items over a wide variety of food groups (McAuliffe et al., 2020) and it has been recommended to include as many essential nutrients as possible in nLCA (Jolliet, 2022). Therefore, a nutrient density score specific for essential nutrients that avoids overlap with health risks but still covers a wide range of nutrients can provide relevant information on individual food items. However, it should be noted that the calculations of both NRF24 and HENI included some nutrients that are both essential and have a positive association with NCDs – i.e., calcium, omega-3 fatty acids. We thereby assumed that health impacts related to inadequate nutrient intakes are independent from health impacts from an insufficient intake of these dietary risk components. However, there is currently no underlying evidence for this assumption which means using NRF24 alongside HENI may double count health effects from calcium and omega-3 fatty acids.
Secondly, the choice of reference unit changes nLCA output values. In our study, the calculation on energy basis favors the nutritional impact and disfavors environmental impact of low energy foods, such as fruits vegetables. That is, reaching 100 kcal for low energy foods will require a higher volume of production and consumption and thereby higher benefits for human health and a higher environmental impact. Generally, expressing nutrient density on an energy basis is in favor as it represents the ratio of nutrients to energy which plays an important role in healthy dietary patterns. In addition, calculating scores on a mass- or serving basis, decreases the NRF24/HENI correlation for beverages and dairy, while increasing the correlation for eggs, legumes, nuts and seeds, and spreads and sauces (Supplementary Table 7), which is partly explained by the negative relation between serving size and energy density (Drewnowski et al., 2009). This emphasizes the importance of communicating the results using different reference units or clearly supporting the choice of a certain reference unit.
Thirdly, a unified definition of food groups is lacking. We found both positive and negative correlations ranging from very weak to strong, depending on the food group. These correlations would change depending on how food groups are selected. If the aim is to draw conclusions for entire food groups based on nLCA results, it would be necessary to have a common definition on how food items should be categorized. In addition, we observed large variability within food groups suggesting that conclusions for entire food groups may be reductive.
Building on the previous section, we acknowledge that statements about the role of food items, or food groups, in healthy and sustainable diets rely on how data is interpreted on the one hand but also on which input data is used to draw conclusions. Estimating health and environmental impacts of food consumption involves a high level of uncertainty due to the uncertainty of input data. This can be related to, for example, unreliable dietary reporting and confounding factors (Gibney et al., 2020) but also to how environmental impact data is established. Additionally, associations between food consumption and the development of NCDs may be debated, not well understood, or not yet identified (Gibson et al., 2009; Lescinsky et al., 2022). On top of this, the GBD identifies health risks on a dietary level while the HENI brings these back to food item level. This emphasizes the aim of this study which was to highlight the importance of assessing both essential nutrient density and disease burden in nLCA by evaluating how these two factors of food consumption are associated, as opposed to drawing hard conclusions about the role of certain food items, or food groups, in healthy and sustainable diets.
This finding has implications for the methodology on how the performance of food items are evaluated in regards to healthy and sustainable diets, e.g., through the use of an nLCA. In addition, we showed that both nutritional- and environmental impact indicators show large variability among individual food items, and it may be difficult to draw general conclusions for food groups as this will depend on how the food groups are defined, thus the importance to provide food specific evaluations. Overall, the health impact from food consumption is a complex issue and it is important to assess the extent to which simplified indicators reflect this complexity. In other words, there may be more value of showing multiple indicators side-by-side as opposed to combining multiple indicators into one value. On the other hand, the latter may be desired from a policy perspective to communicate sustainability information to consumers, e.g., through food labelling (Brown et al., 2020). Although nLCA would be an appropriate tool to support food labelling, combining multiple indicators risks losing important information and may subsequently not provide the accurate information and confuse consumers, thus the interest to use common units such as DALYs or minutes of life lost across all food items and risk factors that can be understood by the population and possibly lead to behavioral changes (Pink et al., 2022). Categorization or labeling is further complicated by the fact that there are no generic cut-off values to define which environmental impacts can be considered “high” or “low” (Bunge et al., 2021). Food labeling has, however, potential in providing consumers with information and has shown to be effective (Potter et al., 2023). Therefore, while methods are being refined, food labeling can be a way to encourage the consumption of products that are beneficial on most, if not all, indicators.
The methodology used in this study is useful for assessing marginal dietary shifts, i.e., interchanging food items. This approach assumes that dietary changes occur within the same food environment, producing the same foods with similar production methods. For short-term solutions, it is useful to identify dietary shifts that stay close to current dietary patterns because these shifts will be more accepted by consumers. However, the gains made with such changes are also marginal, both from a human health and planetary health perspective. Therefore, if the aim is to radically redesign food systems for long-term sustainability and to achieve bigger gains, the data used to calculate the health scores and impact indicators in this study, are no longer valid. The DRFs for calculating HENI scores are based on current exposure to dietary risk and current food intake. Moreover, LCA data is calculated assuming the current production systems and, often, an average value for one product is used while no distinction is made in how the food item is produced, e.g., cattle in feedlots fed with a lot of products humans can also consume versus cattle grazing on marginal lands (de Vries and de Boer, 2010; van Zanten et al., 2018).
This study stresses the importance of addressing essential nutrient content and disease burden of single food items individually in nLCA. The side-by-side calculation of a nutrient density indicator that exclusively included essential nutrients and an indicator for disease burden, showed useful to represent complementary information about food items’ nutritional impact. This was supported by the fact that, across all assessed food items, no correlation was observed between the two indicators, and therefore a high nutrient density does not directly imply a low risk for non-communicable diseases, or the other way around. This may be more relevant for some food groups than for others. In addition, trade-offs and synergies between nutrition and environment are also different for nutrient density and disease burden, with a high variety for individual food items. Our results therefore do not support the statement that changing towards a healthy diet inherently reduces the overall environmental impact of the diet. Moreover, the findings contribute to the methodological discussions in the field of nLCA because focusing on single indicators or aggregating multiple indicators into one can lead to the risk of missing important information and may lead to wrong conclusions.
The raw data underlying the conclusions made in this study are provided as Supplementary Data 2 and can be found in the publicly accessible repository Figshare (10.6084/m9.figshare.24223345). The LCA data used for this study is publicly available via https://www.rivm.nl/documenten/database-milieubelasting-voedingsmiddelen. The nutrient content data was extracted from the NEVO database, which is publicly accessible via https://nevo-online.rivm.nl/. All other relevant data underlying the conclusions made in the manuscript are contained within the article and the Supplementary Data 1, further inquiries can be directed to the corresponding author.
RC: Methodology, Visualization, Writing – original draft. EV: Methodology, Writing – original draft, Writing – review & editing. OJ: Methodology, Writing – review & editing. HZ: Supervision, Writing – review & editing. TH: Methodology, Supervision, Writing – review & editing.
The author(s) declare that no financial support was received for the research, authorship, and/or publication of this article.
The authors thank Evert-Jan Bakker from Biometris, Wageningen University and Research, for his revision of the statistical analysis on the data.
The authors declare that the research was conducted in the absence of any commercial or financial relationships that could be construed as a potential conflict of interest.
All claims expressed in this article are solely those of the authors and do not necessarily represent those of their affiliated organizations, or those of the publisher, the editors and the reviewers. Any product that may be evaluated in this article, or claim that may be made by its manufacturer, is not guaranteed or endorsed by the publisher.
The Supplementary material for this article can be found online at: https://www.frontiersin.org/articles/10.3389/fsufs.2024.1304752/full#supplementary-material
(μ)DALY, (micro) Disability Adjusted Life Years; DRF, Dietary Risk Factor; GBD, Global Burden of Disease; GWP, Global Warming Potential; HENI, HEalth and Nutritional Index; LU, Land use; NCD, Non-communicable disease; (n)LCA, (nutritional) Life Cycle Assessment; NRF, Nutrient Rich Food index; WU, Freshwater use.
Afshin, A., Sur, P. J., Fay, K. A., Cornaby, L., Ferrara, G., Salama, J. S., et al. (2019). Health effects of dietary risks in 195 countries, 1990–2017: a systematic analysis for the global burden of disease study 2017. Lancet 393, 1958–1972. doi: 10.1016/S0140-6736(19)30041-8
Albert Heijn. (2023). Available: https://www.ah.nl/ (Accessed 06 November 2022 2022).
BajŽelj, B., Benton, T. G., Clark, M., Garnett, T., Marteau, T. M., Richards, K. S., et al. (2015). Synergies between healthy and sustainable diets. Brief for Gsdr.
Bianchi, M., Strid, A., Winkvist, A., Lindroos, A., Sonesson, U., and Hallström, E. (2020). Systematic evaluation of nutrition indicators for use within food Lca studies. Sustain. For. 12:8992. doi: 10.3390/su12218992
Branca, F., Demaio, A., Udomkesmalee, E., Baker, P., Aguayo, V. M., Barquera, S., et al. (2020). A new nutrition manifesto for a new nutrition reality. Lancet 395, 8–10. doi: 10.1016/S0140-6736(19)32690-X
Brown, K. A., Harris, F., Potter, C., and Knai, C. (2020). The future of environmental sustainability labelling on food products. Lancet Planet Health 4, e137–e138. doi: 10.1016/S2542-5196(20)30074-7
Bruins, M. J., Van Dael, P., and Eggersdorfer, M. (2019). The role of nutrients in reducing the risk for noncommunicable diseases during aging. Nutrients 11:85. doi: 10.3390/nu11010085
Bunge, A. C., Wickramasinghe, K., Renzella, J., Clark, M., Rayner, M., Rippin, H., et al. (2021). Sustainable food profiling models to inform the development of food labels that account for nutrition and the environment: a systematic review. Lancet Planet Health 5, e818–e826. doi: 10.1016/S2542-5196(21)00231-X
Challem, J. (1999). Toward a new definition of essential nutrients: is it now time for a third ‘vitamin’paradigm? Med. Hypotheses 52, 417–422. doi: 10.1054/mehy.1997.0685
Chen, C., Chaudhary, A., and Mathys, A. (2019). Dietary change scenarios and implications for environmental, nutrition, human health and economic dimensions of food sustainability. Nutrients 11:856. doi: 10.3390/nu11040856
Chiuve, S. E., Sampson, L., and Willett, W. C. (2011). The association between a nutritional quality index and risk of chronic disease. Am. J. Prev. Med. 40, 505–513. doi: 10.1016/j.amepre.2010.11.022
Conrad, Z., Blackstone, N. T., and Roy, E. D. (2020). Healthy diets can create environmental trade-offs, depending on how diet quality is measured. Nutr. J. 19:117. doi: 10.1186/s12937-020-00629-6
De Valk, E., Hollander, A., and Zijp, M. (2016). Milieubelasting van de voedselconsumptie in Nederland.
De Vries, M., and De Boer, I. J. M. (2010). Comparing environmental impacts for livestock products: a review of life cycle assessments. Livest. Sci. 128, 1–11. doi: 10.1016/j.livsci.2009.11.007
Drewnowski, A. (2010). The nutrient rich foods index helps to identify healthy, affordable foods. Am. J. Clin. Nutr. 91, 1095S–1101S. doi: 10.3945/ajcn.2010.28450D
Drewnowski, A., Finley, J., Hess, J. M., Ingram, J., Miller, G., and Peters, C. (2020). Toward healthy diets from sustainable food systems. Curr. Dev. Nutr. 4:nzaa083. doi: 10.1093/cdn/nzaa083
Drewnowski, A., Maillot, M., and Darmon, N. (2009). Should nutrient profiles be based on 100 g, 100 kcal or serving size? Eur. J. Clin. Nutr. 63, 898–904. doi: 10.1038/ejcn.2008.53
Drewnowski, A., Rehm, C. D., Martin, A., Verger, E. O., Voinnesson, M., and Imbert, P. (2015). Energy and nutrient density of foods in relation to their carbon footprint. Am. J. Clin. Nutr. 101, 184–191. doi: 10.3945/ajcn.114.092486
EFSA. (2023). Dietary reference values | Efsa [Online]. European Food Safety Authority. Available: https://www.efsa.europa.eu/en/topics/topic/dietary-reference-values [Accessed].
Ernstoff, A., Stylianou, K. S., Sahakian, M., Godin, L., Dauriat, A., Humbert, S., et al. (2020). Towards win-win policies for healthy and sustainable diets in Switzerland. Nutrients 12:2745. doi: 10.3390/nu12092745
FAO, IFAD, UNICEF, WFP, and WHO (2022). The state of food security and nutrition in the world 2022. Repurposing food and agricultural policies to make healthy diets more affordable. Rome: FAO.
Fulgoni, V. L. 3rd, Keast, D. R., and Drewnowski, A. (2009). Development and validation of the nutrient-rich foods index: a tool to measure nutritional quality of foods. J. Nutr. 139, 1549–1554. doi: 10.3945/jn.108.101360
Gibney, M., Allison, D., Bier, D., and Dwyer, J. (2020). Uncertainty in human nutrition research. Nat. Food 1, 247–249. doi: 10.1038/s43016-020-0073-2
Gibson, R. A., Makrides, M., Smithers, L. G., Voevodin, M., and Sinclair, A. J. (2009). The effect of dairy foods on Chd: a systematic review of prospective cohort studies. Br. J. Nutr. 102, 1267–1275. doi: 10.1017/S0007114509371664
Givens, D. I. (2018). Review: dairy foods, red meat and processed meat in the diet: implications for health at key life stages. Animal 12, 1709–1721. doi: 10.1017/S1751731118000642
Green, A., Nemecek, T., Chaudhary, A., and Mathys, A. (2020). Assessing nutritional, health, and environmental sustainability dimensions of Agri-food production. Glob. Food Sec. 26:100406. doi: 10.1016/j.gfs.2020.100406
Guo, A., Bryngelsson, S., Strid, A., Bianchi, M., Winkvist, A., and Hallström, E. (2022). Choice of health metrics for combined health and environmental assessment of foods and diets: a systematic review of methods. J. Clean. Prod. 365:132622. doi: 10.1016/j.jclepro.2022.132622
Hallström, E., Davis, J., Woodhouse, A., and Sonesson, U. (2018). Using dietary quality scores to assess sustainability of food products and human diets: a systematic review. Ecol. Indic. 93, 219–230. doi: 10.1016/j.ecolind.2018.04.071
Han, X., Ding, S., Lu, J., and Li, Y. (2022). Global, regional, and national burdens of common micronutrient deficiencies from 1990 to 2019: a secondary trend analysis based on the global burden of disease 2019 study. Eclinical Med. 44:101299. doi: 10.1016/j.eclinm.2022.101299
Health Council Of The Netherlands (2018). Voedingsnormen Voor Vitamines en Mineralen Voor Volwassenen. The Netherlands: Health Council of The Netherlands The Hague.
Heerschop, S. N., Kanellopoulos, A., Biesbroek, S., and van ‘t Veer, P. (2023). Shifting towards optimized healthy and sustainable Dutch diets: impact on protein quality. Eur. J. Nutr. 62, 2115–2128. doi: 10.1007/s00394-023-03135-7
Hoeft, B., Weber, P., and Eggersdorfer, M. (2012). Micronutrients - a global perspective on intake, health benefits and economics. Int. J. Vitam. Nutr. Res. 82, 316–320. doi: 10.1024/0300-9831/a000125
Huijbregts, M. A. J., Steinmann, Z. J. N., Elshout, P. M. F., Stam, G., Verones, F., Vieira, M., et al. (2017). ReCiPe2016: a harmonised life cycle impact assessment method at midpoint and endpoint level. Int. J. Life Cycle Assess. 22, 138–147. doi: 10.1007/s11367-016-1246-y
IDF (2015). A common carbon footprint approach for the dairy sector. The IDF guide to standard life cycle assessment methodology. Bull. Int. Dairy Fed. Brussels, Belgium: International Dairy Federation.
Jolliet, O. (2022). Integrating dietary impacts in food life cycle assessment. Front. Nutr. 9:898180. doi: 10.3389/fnut.2022.898180
Lescinsky, H., Afshin, A., Ashbaugh, C., Bisignano, C., Brauer, M., Ferrara, G., et al. (2022). Health effects associated with consumption of unprocessed red meat: a burden of proof study. Nat. Med. 28, 2075–2082. doi: 10.1038/s41591-022-01968-z
Malik, V. S., and Hu, F. B. (2022). The role of sugar-sweetened beverages in the global epidemics of obesity and chronic diseases. Nat. Rev. Endocrinol. 18, 205–218. doi: 10.1038/s41574-021-00627-6
Masset, G., Vieux, F., and Darmon, N. (2015). Which functional unit to identify sustainable foods? Public Health Nutr. 18, 2488–2497. doi: 10.1017/S1368980015000579
Mcauliffe, G. A., Takahashi, T., and Lee, M. R. F. (2020). Applications of nutritional functional units in commodity-level life cycle assessment (Lca) of Agri-food systems. Int. J. Life Cycle Assess. 25, 208–221. doi: 10.1007/s11367-019-01679-7
Mclaren, S., Berardy, A., Henderson, A., Holden, N., Huppertz, T., Jolliet, O., et al. (2021). Integration of environment and nutrition in life cycle assessment of food items: Opportunities and challenges.
Payne, C. L., Scarborough, P., and Cobiac, L. (2016). Do low-carbon-emission diets lead to higher nutritional quality and positive health outcomes? A systematic review of the literature. Public Health Nutr. 19, 2654–2661. doi: 10.1017/S1368980016000495
Pink, A. E., Stylianou, K. S., Ling Lee, L., Jolliet, O., and Cheon, B. K. (2022). The effects of presenting health and environmental impacts of food on consumption intentions. Food Qual. Prefer. 98:104501. doi: 10.1016/j.foodqual.2021.104501
Poore, J., and Nemecek, T. (2018). Reducing food’s environmental impacts through producers and consumers. Science 360, 987–992. doi: 10.1126/science.aaq0216
Potter, C., Pechey, R., Cook, B., Bateman, P., Stewart, C., Frie, K., et al. (2023). Effects of environmental impact and nutrition labelling on food purchasing: an experimental online supermarket study. Appetite 180:106312. doi: 10.1016/j.appet.2022.106312
RIVM. (2023). ReCiPe 2016. Online download. [Online]. Available: https://www.rivm.nl/en/life-cycle-assessment-lca/downloads (Accessed 25 January, 2023).
Saarinen, M., Fogelholm, M., Tahvonen, R., and Kurppa, S. (2017). Taking nutrition into account within the life cycle assessment of food products. J. Clean. Prod. 149, 828–844. doi: 10.1016/j.jclepro.2017.02.062
Shangguan, S., Afshin, A., Shulkin, M., Ma, W., Marsden, D., Smith, J., et al. (2019). A Meta-analysis of food labeling effects on consumer diet behaviors and industry practices. Am. J. Prev. Med. 56, 300–314. doi: 10.1016/j.amepre.2018.09.024
Sokolow, J., Kennedy, G., and Attwood, S. (2019). Managing crop tradeoffs: a methodology for comparing the water footprint and nutrient density of crops for food system sustainability. J. Clean. Prod. 225, 913–927. doi: 10.1016/j.jclepro.2019.03.056
Sonesson, U., Davis, J., Flysjö, A., Gustavsson, J., and Witthöft, C. (2017). Protein quality as functional unit – a methodological framework for inclusion in life cycle assessment of food. J. Clean. Prod. 140, 470–478. doi: 10.1016/j.jclepro.2016.06.115
Sonesson, U., Davis, J., Hallström, E., and Woodhouse, A. (2019). Dietary-dependent nutrient quality indexes as a complementary functional unit in Lca: a feasible option? J. Clean. Prod. 211, 620–627. doi: 10.1016/j.jclepro.2018.11.171
Springmann, M., Godfray, H. C. J., Rayner, M., and Scarborough, P. (2016). Analysis and valuation of the health and climate change cobenefits of dietary change. Proc. Natl. Acad. Sci. 113, 4146–4151. doi: 10.1073/pnas.1523119113
Stehfest, E., Bouwman, L., Van Vuuren, D. P., Den Elzen, M. G. J., Eickhout, B., and Kabat, P. (2009). Climate benefits of changing diet. Clim. Chang. 95, 83–102. doi: 10.1007/s10584-008-9534-6
Stylianou, K. S., Fulgoni, V. L., and Jolliet, O. (2021). Small targeted dietary changes can yield substantial gains for human health and the environment. Nat. Food 2, 616–627. doi: 10.1038/s43016-021-00343-4
Swinburn, B. A., Kraak, V. I., Allender, S., Atkins, V. J., Baker, P. I., Bogard, J. R., et al. (2019). The global Syndemic of obesity, undernutrition, and climate change: the lancet commission report. Lancet 393, 791–846. doi: 10.1016/S0140-6736(18)32822-8
Thoma, G., Blackstone, N. T., Nemecek, T., and Jolliet, O. (2022). “Life cycle assessment of food systems and diets” in Food Systems Modelling (Cambridge, United States: Academic Press).
Tilman, D., and Clark, M. (2014). Global diets link environmental sustainability and human health. Nature 515, 518–522. doi: 10.1038/nature13959
Van Zanten, H. H. E., Bikker, P., Meerburg, B. G., and De Boer, I. J. M. (2018). Attributional versus consequential life cycle assessment and feed optimization: alternative protein sources in pig diets. Int. J. Life Cycle Assess. 23, 1–11. doi: 10.1007/s11367-017-1299-6
Walker, C., Gibney, E. R., Mathers, J. C., and Hellweg, S. (2019). Comparing environmental and personal health impacts of individual food choices. Sci. Total Environ. 685, 609–620. doi: 10.1016/j.scitotenv.2019.05.404
Weidema, B. P., and Stylianou, K. S. (2020). Nutrition in the life cycle assessment of foods—function or impact? Int. J. Life Cycle Assess. 25, 1210–1216. doi: 10.1007/s11367-019-01658-y
Westhoek, H., Lesschen, J. P., Rood, T., Wagner, S., De Marco, A., Murphy-Bokern, D., et al. (2014). Food choices, health and environment: effects of cutting Europe’s meat and dairy intake. Glob. Environ. Chang. 26, 196–205. doi: 10.1016/j.gloenvcha.2014.02.004
Keywords: nutrition, planetary health, life cycle assessment, healthy and sustainable diets, diet-related diseases, nutrient density
Citation: Cardinaals RPM, Verly E Jr, Jolliet O, Van Zanten HHE and Huppertz T (2024) The complementarity of nutrient density and disease burden for Nutritional Life Cycle Assessment. Front. Sustain. Food Syst. 8:1304752. doi: 10.3389/fsufs.2024.1304752
Edited by:
Nepal Dey, BRAC University, BangladeshReviewed by:
Elena Narcisa Pogurschi, University of Agronomic Sciences and Veterinary Medicine, RomaniaCopyright © 2024 Cardinaals, Verly, Jolliet, Van Zanten and Huppertz. This is an open-access article distributed under the terms of the Creative Commons Attribution License (CC BY). The use, distribution or reproduction in other forums is permitted, provided the original author(s) and the copyright owner(s) are credited and that the original publication in this journal is cited, in accordance with accepted academic practice. No use, distribution or reproduction is permitted which does not comply with these terms.
*Correspondence: Renée P. M. Cardinaals, cmVuZWUuY2FyZGluYWFsc0B3dXIubmw=
Disclaimer: All claims expressed in this article are solely those of the authors and do not necessarily represent those of their affiliated organizations, or those of the publisher, the editors and the reviewers. Any product that may be evaluated in this article or claim that may be made by its manufacturer is not guaranteed or endorsed by the publisher.
Research integrity at Frontiers
Learn more about the work of our research integrity team to safeguard the quality of each article we publish.