
94% of researchers rate our articles as excellent or good
Learn more about the work of our research integrity team to safeguard the quality of each article we publish.
Find out more
ORIGINAL RESEARCH article
Front. Sustain. Food Syst., 01 May 2024
Sec. Nutrition and Sustainable Diets
Volume 8 - 2024 | https://doi.org/10.3389/fsufs.2024.1304275
This article is part of the Research TopicPushing The Frontiers Of Nutritional Life Cycle Assessment (nLCA) To Identify Globally Equitable And Sustainable Agri-Food SystemsView all 15 articles
 Kate Wingett1*
 Robyn Alders2,3,4
To achieve sustainable development, United Nation members have agreed to reduce food loss along the pre-consumer food supply chain. Food loss and waste is a significant challenge facing Australia and the world, with an estimated one third of all food produced locally being lost or wasted. Globally, Australia is the second largest producer of sheep meat and, locally in Australia sheep meat is the second largest meat industry. Previous assessments of Australian livestock industries estimate low levels of food product losses from the sheep meat chain. This case study aimed to quantify nutrient losses at the point of slaughter of Australian lambs and sheep, using a mass balance approach with secondary data. The results from this study align with this previous assessment with respect to the level of products and nutrients downgraded at the point of slaughter, except for the impact of cadmium contamination on adult sheep liver and kidney downgrades. In turn, cadmium contamination emerged as a key contributor to micronutrient losses, notably dietary folate equivalents, and vitamin A retinol equivalents (RE). There was moderate to high uncertainty in the outputs of the assessment, predominantly due to the absence of data. Addressing these challenges, particularly the absence of offal production data, is crucial as it influences the overall accuracy of the results. This study identifies areas for improvement in the Australian sheep meat value chain, including data governance, at both the macro and micro levels. It also serves as a foundational step in understanding how reducing food and nutrient losses in the Australian sheep meat value chain could contribute to food security and nutrition goals.
In 2015, all United Nations members adopted the 2030 Agenda for Sustainable development(United Nations, 2015). The Agenda includes 17 Sustainable Development Goals (SDGs) that form a framework to achieve global health of people and the planet, both now and for future generations (United Nations, 2015). Achieving SDG 12, “responsible consumption and production patterns,” will optimize the use of natural resources and indirectly help to protect soils, water, the atmosphere and biodiversity, while simultaneously assisting with food security, nutrition and potentially, the economy (Food and Agricultural Organization, 2019). According to Food and Agricultural Organization (2009) “Food security exists when all people, at all times, have physical, social and economic access to sufficient, safe and nutritious food to meet their dietary needs and food preferences for an active and healthy life. The four pillars of food security are availability, access, utilization, and stability. The nutritional dimension is integral to the concept of food security”.
Despite Australia being one of the most food secure countries in the world, food insecurity affects a not insignificant proportion of the population. In the Australian Health Survey 2011–13, approximately 4% of respondents reported having run out of food and not being able to buy more food (Australian Bureau of Statistics, 2013b). It is thought the level of food insecurity in Australia is under-reported due to the sensitive nature of the question and the exclusion of homeless and very remote populations from the survey (Booth and Smith, 2001; Australian Bureau of Statistics, 2013b). Bowden (2020) found the level of food insecurity in the general population of Australia ranged from 4 to 13%. This review also noted that there was no regular monitoring of food security levels in the Australian population. The Foodbank Hunger Report presented a worsening picture with 3.7 million Australian households (approximately 36%) reporting food insecurity during 2022 (IPSOS, 2023).
Food insecurity has been negatively associated with health outcomes in children and the elderly in the United States (Gundersen and Ziliak, 2015). Canadian adults and adolescents who experienced food insecurity were more likely to suffer from nutrient inadequacy than those living in food secure households (Kirkpatrick and Tarasuk, 2008). Concurrently, it is estimated that 25% of pregnant women in Australia are anemic, with an estimated half of anemia cases worldwide being caused by iron deficiency (World Health Organization, 2020). Due to the public health impacts of micronutrient deficiencies in the Australian population, there is mandatory fortification of staple foods with folic acid, iodine, thiamine (B1) and vitamin D (Food Standards Australia New Zealand, 2019b).
Reducing food loss and waste has potential to positively impact food security and nutrition (Food and Agricultural Organization, 2019). Target 12.3 of SDG 12 is to halve retail and consumer food waste and reduce food loss along each step of the supply chain (United Nations, 2015). Globally and in Australia, it is estimated that one third of food produced is lost or wasted (Food and Agricultural Organization, 2011; Commonwealth of Australia, 2017). It is recognized that post-consumer food waste is collectively greater in quantity than pre-consumer food loss (Food and Agricultural Organization, 2011; ARCADIS, 2019). However, reducing pre-consumer food losses may still make a valuable contribution to achieving food security and optimizing natural resource management. Kuiper and Cui (2021) predicted, via modeling, that a 25% reduction in food loss in Australia, would lead to a reduction in primary production, land use and greenhouse gas emissions associated with food production, while simultaneously increasing food accessibility, availability of macro- and micronutrient, and increasing gross domestic product. Research on the role of reducing food loss and waste to achieve food security in Australian is very limited at this point in time and there is opportunity to explore this area further (Lai et al., 2022).
There are challenges in estimating food loss and waste and assessing its impact on the economy, community, and environment (Food and Agricultural Organization, 2011; Cattaneo et al., 2021; Hoehn et al., 2023). These challenges include defining what is considered food loss and waste, data availability, and balancing public benefit and private cost in setting policy. To assist with some of the measurement challenges, the Global Food Loss Index has been developed as the indicator to monitor the world’s progress toward the target of reducing food loss. In this indicator, food losses are defined as “all the crop and livestock human-edible commodity quantities that, directly or indirectly, completely exit the post-harvest/slaughter production/supply chain by being discarded, incinerated or otherwise, and do not re-enter in any other utilization (such as animal feed, industrial use, etc.), up to, and excluding, the retail level. Losses that occur during storage, transportation, and processing, also of imported quantities, are therefore all included. Losses include the commodity as a whole with its non-edible parts” (Food and Agricultural Organization, 2018).
The Australian Government (2024) has not published results on the contribution of Australian food loss to this indicator. According to the FAOs Food Loss and Waste Database (Food and Agricultural Organization, 2023d) and the FAOs Supply Utilization Accounts / Food Balance Sheets (Food and Agricultural Organization, 2023a), the two datasets used in modeling food loss for the Global Food Loss Index (Food and Agricultural Organization, 2023c) there are zero recorded losses of Australian sheep meat and edible offal or diversions of these products to animal feed or non-food uses. This is as the scope of “loss” in the Food Balance Sheets starts post-slaughter and “food” is defined as products that have been produced with the intention of being consumed by people (Food and Agricultural Organization, 2021d).
There has been a national baseline assessment of food loss and waste published (ARCADIS, 2019), based on the Food Loss and Waste Standard (Food Loss and Waste Protocol, 2016). The majority of food losses from livestock value chains were reported to occur during processing at the abattoir (ARCADIS, 2019).To date, these losses have been measured based on weight of product and/or economic value (Lane et al., 2015; Byran et al., 2016; ARCADIS, 2019; Shephard et al., 2022). Losses from the livestock industries were reported aggregated, including cattle, sheep, and pigs. A total of 123 kilotonnes of livestock products was reported as lost during manufacturing in base year 2015; accounting for approximately 2% of the supply of livestock products (ARCADIS, 2019). Food losses from the Australian livestock chains excluded all materials being diverted to pet food (ARCADIS, 2019) due to the inability to differentiate whether product food products downgraded to animal feed were destined for livestock or pet food supply chains (ARCADIS, 2019).
Animal source foods, including meat and offal, are energy and nutrient dense foods, rich in protein and micronutrients, including iron, zinc and vitamin B12, in high bioavailable forms (Murphy and Allen, 2003; Drewnowski and Fulgoni, 2008; De Bruyn et al., 2020; Beal and Ortenzi, 2022). Globally, food-based dietary guidelines include animal-source foods as part of a healthy diet (Food and Agricultural Organization, 2021a). Australian mutton, meat from an adult sheep, is more micronutrient dense than lamb, beef, pork or chicken meat (Williams et al., 2007) and lambs’ liver and kidney are more micronutrient dense than mutton (Wingett et al., 2018). According to Supply and Utilization Accounts, each Australian has approximately 32 g of sheep meat available each day (Food and Agricultural Organization, 2023a). According to the Australian Dietary Guidelines, this level of food supply accounts for approximately one-third of the recommended upper intake of lean red meat for Australian adults (National Health and Medical Research Council, 2013).
Australia is the second largest sheep meat producer in the world by weight (Food and Agricultural Organization, 2023b) and sheep meat is the second largest meat industry in Australia, based on weight of product and gross economic value of carcases from slaughter (Australian Bureau of Statistics, 2022b). In financial year 2021–2022, there were approximately 70 million head in the national flock and 31,000 businesses in the industry (Australian Bureau of Statistics, 2023). The industry produced 513 kilotonnes (kt) of lamb carcase meat (meat from young sheep without any adult teeth in wear, typically up to 1 year old) and 164 kt of mutton carcase meat (meat from animals with at least one adult tooth in wear, typically 1 year-old or more) that was fit for human consumption. The majority of both lamb meat and mutton meat is exported (ABARES, 2020). Reducing pre-consumer food losses from the Australian sheep meat value chain has potential to significantly impact nutrient availability for both Australians and in those countries receiving Australian grown sheep meat and offal.
This study aimed to quantify the loss of nutrients from the direct human food chain at Australian sheep abattoirs and explore the underlying reasons for the nutrient losses, using national datasets. Better understanding of the quantity of food losses, with respect to nutrient composition and cause, is important to both sustainable management of nutrient flows to and from livestock production systems and to support food security through increasing nutrient-dense food availability at the societal level.
To contextualize the effect of the direct nutrient losses from the Australian sheep meat value chain on Australian food and nutrition security, the authors explored the impact of the losses with respect to satisfying the nutritional needs of women of reproductive age. This subset of the population was chosen as they have a heightened demand for nutrients before and during pregnancy and lactation, and deficiencies of micronutrients can have intergenerational impacts; as such women of reproductive age are considered nutritionally vulnerable (Allen, 2005; Torheim and Arimond, 2013; Food and Agricultural Organization, 2021c). The World Health Organization (WHO) estimated 5.2–15.3% of Australian women of reproductive age were anemic in 2019 (World Health Organization, 2023) and that the prevalence of anemia in pregnant Australian women is 25% (World Health Organization, 2015). Carter et al. (2023) found the overall incidence of iron-deficiency anemia in pregnant women in far north Queensland in 2018 was 34.9%, with 48.7% of women identifying as Aboriginal or Torres Strait Islanders in the area experiencing iron-deficiency anemia during pregnancy.
The Food Loss and Waste Accounting and Reporting Standard (FLWS) is a guidance document developed to facilitate countries (and other entities) to account for and report food loss and waste, including reporting against SDG12.3.1 (Food Loss and Waste Protocol, 2016). The FLWS states that each entity defines food loss depending on the reason for accounting and reporting the food loss (e.g., food security and nutrition, environmental assessment, economic assessment). The scope of the food loss is defined by material type (i.e., edible, inedible or both), destination or pathway of the materials, timeframe and boundaries of the food loss inventory (i.e., food category, life cycle stage and geography) (Food Loss and Waste Protocol, 2016). The FLWS allows for holistic accounting and reporting of food loss, as the unit of measure for food loss can range from nutrients to money, to environmental indicators such as water use and greenhouse gas emissions.
Nutrient losses (by weight) from the pre-consumer Australian sheep meat value chain were quantified, based on the FLWS (Food Loss and Waste Protocol, 2016) using the principles of a material flow analysis (Brunner and Rechberger, 2017).
The scope of the food loss accounting and reporting included timeframe, material type, destination and system boundaries (food category, lifecycle stage and geography), as per the FLWS (Food Loss and Waste Protocol, 2016).
The base year was calendar year 2015, and as per the Food loss and waste accounting and reporting standard, this was an average of calendar years 2014–2016 (Food Loss and Waste Protocol, 2016) where the data were available. Disease prevalence data from abattoir monitoring included data from calendar years 2010–2016, due to only having access to published data from Export Production and Condemnation Statistics (Lane et al., 2015) from July 2010 – June 2013. All other timeframes were as per the Food loss and waste accounting and reporting standard (Food Loss and Waste Protocol, 2016).
Food only products from the Australian sheep meat value chain were the material types quantified, expressed both in raw weight of products and, weight of nutrients in the raw, edible components of the products. Products were considered food if they were listed in the Australia New Zealand Food Standards Code – Standard 2.2.1 – Meat and meat products (Australian Government, 2016), Handbook of Australian Meat (AUSMEAT, 2020) or on the AUSNUT database (Food Standards Australia New Zealand, 2014).
Nutrients included in this study were those included in AUSNUT 2011–13 – Food nutrient database, except for nutrients imputed as zero (Food Standards Australia New Zealand, 2014). Only an estimate of the total nutrient was included in cases where numerous forms of the nutrient appeared in the database. For example, folate, natural, total folates, and dietary folate equivalents were represented by dietary folate equivalents in this study (Table 1). In the AUSNUT database, the carcase meat nutrient values were derived using a recipe approach, based on analyzed data and, the lamb offal nutrient composition data was analyzed. In this instance, the recipe approach for muscle meat was utilized as the cuts of meat were analyzed for gross composition, fatty acid profile and nutrient profile individually and then combined to create the food nutrient profile.
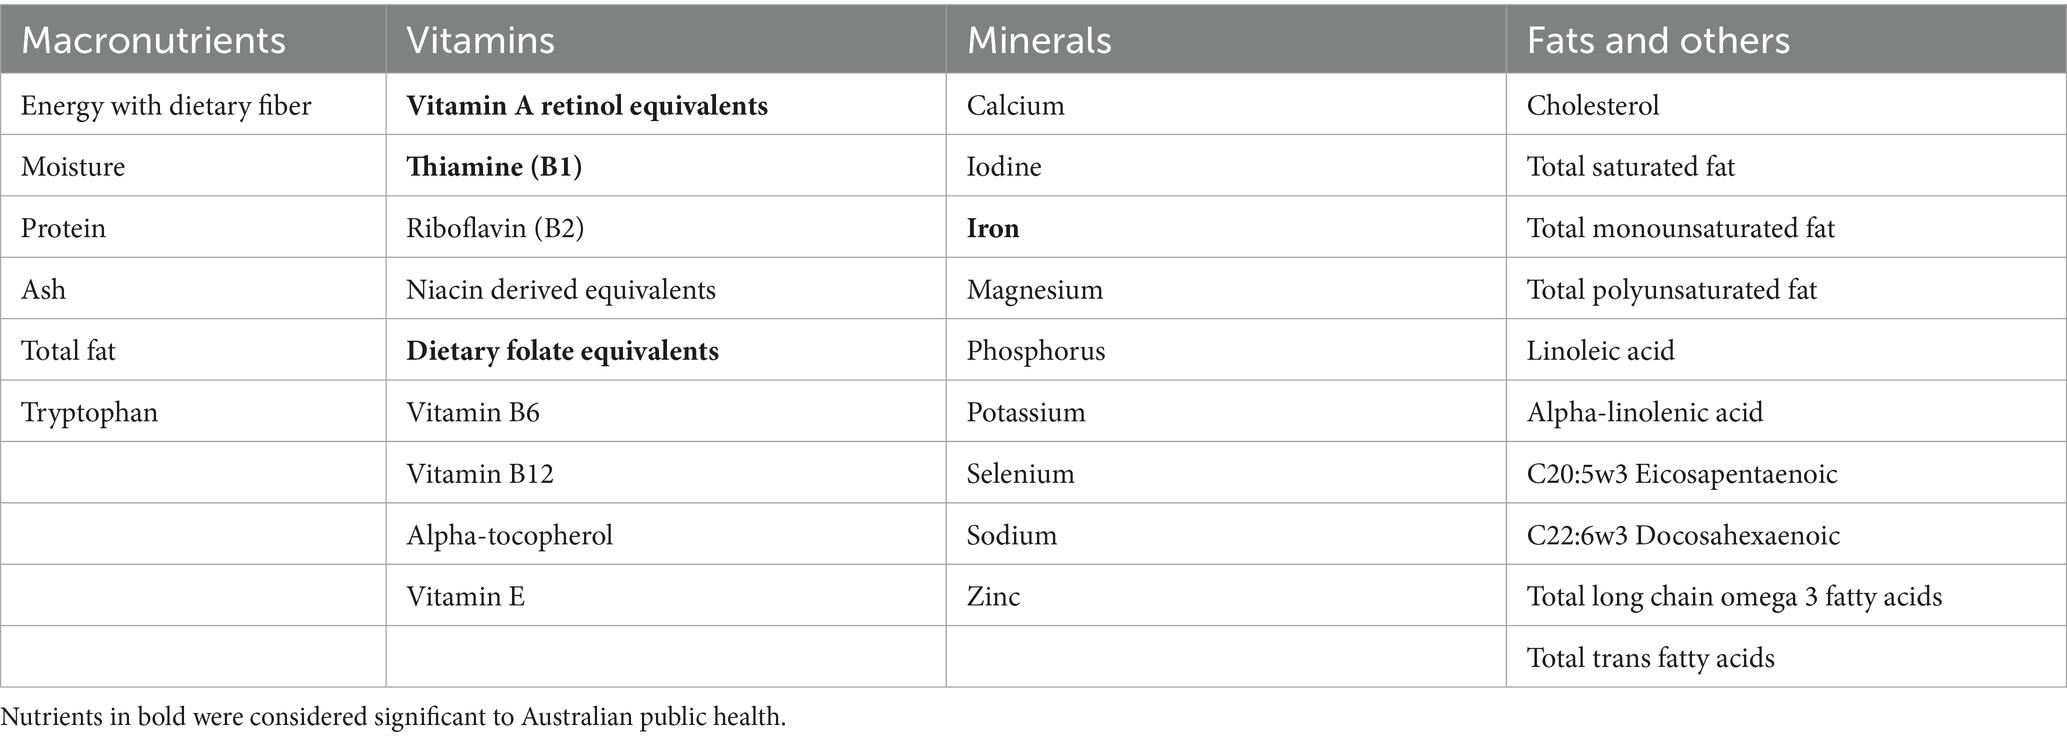
Table 1. Nutrients included in the food and nutrient loss assessment of the Australian sheep meat value chain.
We assumed adult sheep offal had the same nutrient composition as lamb offal as the authors were unable to find any published data on the nutrient composition of Australian adult sheep offal. This is most likely a conservative estimate of nutrient composition of adult sheep offal, based on the differences between lamb meat and mutton meat i.e., micronutrient levels increased in muscle meat as animals aged (Williams et al., 2007) and that vitamin A concentrations increase in liver tissue as animals age (Majchrzak et al., 2006).
The authors were particularly interested in nutrients they considered to be significant to Australian public health. Criteria for nutrients to be classified as significant to public health in this study included:
• nutrients where a 100 g raw serve of any of the lamb or mutton carcase cuts or offal pieces supplies at least 20% of the recommended daily intake for Australian men and women (aged 19–50 years) is considered a good source for Australians (Australian Government, 2018) and the nutrient is either,
• monitored by the World Health Organization (WHO) (World Health Organization, 2020), or
• there is a mandate to fortify staple foods with the nutrient in Australia (Food Standards Australia New Zealand, 2019b).
A pathways approach was taken when determining the flow of food products and nutrients through the Australian sheep meat value chain, rather than the preferred destination approach. This meant the initial paths taken by the food product on their way to their destination, either downgraded or fit-for-human consumption, were considered as the two options The pathway approach was selected due to inadequate detail being included in published national data on the destination of products of the Australian sheep meat value chain. Food products and nutrients entered one of two pathways at the abattoirs, either fit for human consumption or unfit for human consumption (Figure 1).
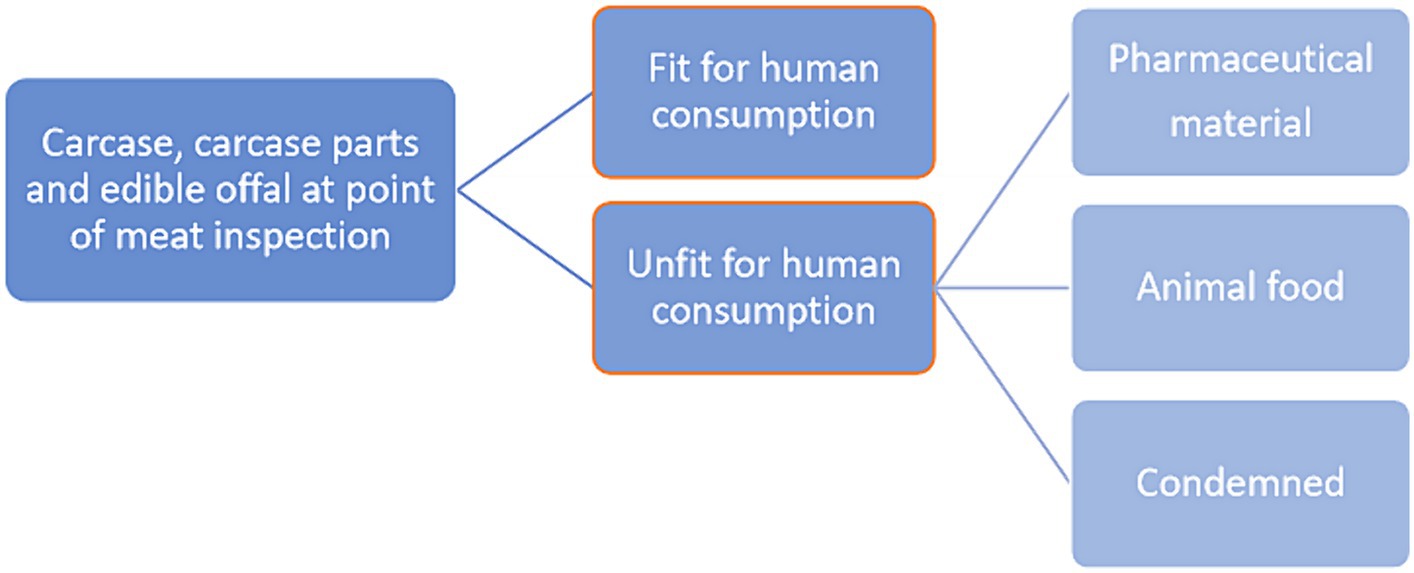
Figure 1. Destination of food products from the Australian sheep meat value chain at the abattoir. Boxes highlighted in orange represent the pathways included in this food and nutrient loss assessment.
Four areas were considered in regards to the system boundaries of the food loss model – geography, organization, life cycle stage and, food category, as per the FLWS (Food Loss and Waste Protocol, 2016).
The geography was set to Australia, country code 036 (Statistics Division of the United Nations Secretariat, 2022). The organization was the sheep meat value chain. The sheep meat value chain was separated into lambs and adults to account for the variation in nutrient profile of the food products as animals age (Williams et al., 2007) and the variation in the prevalence of disease and contamination as animals age (Animal Health Australia, 2021).
One life cycle stage was selected, the abattoir (Figure 2). This is the point in the supply chain where animals are processed into food and other products (Figure 3). This stage was chosen as this is the first step where losses from animal-source value chains are accounted for in the FLWS (Food Loss and Waste Protocol, 2016).
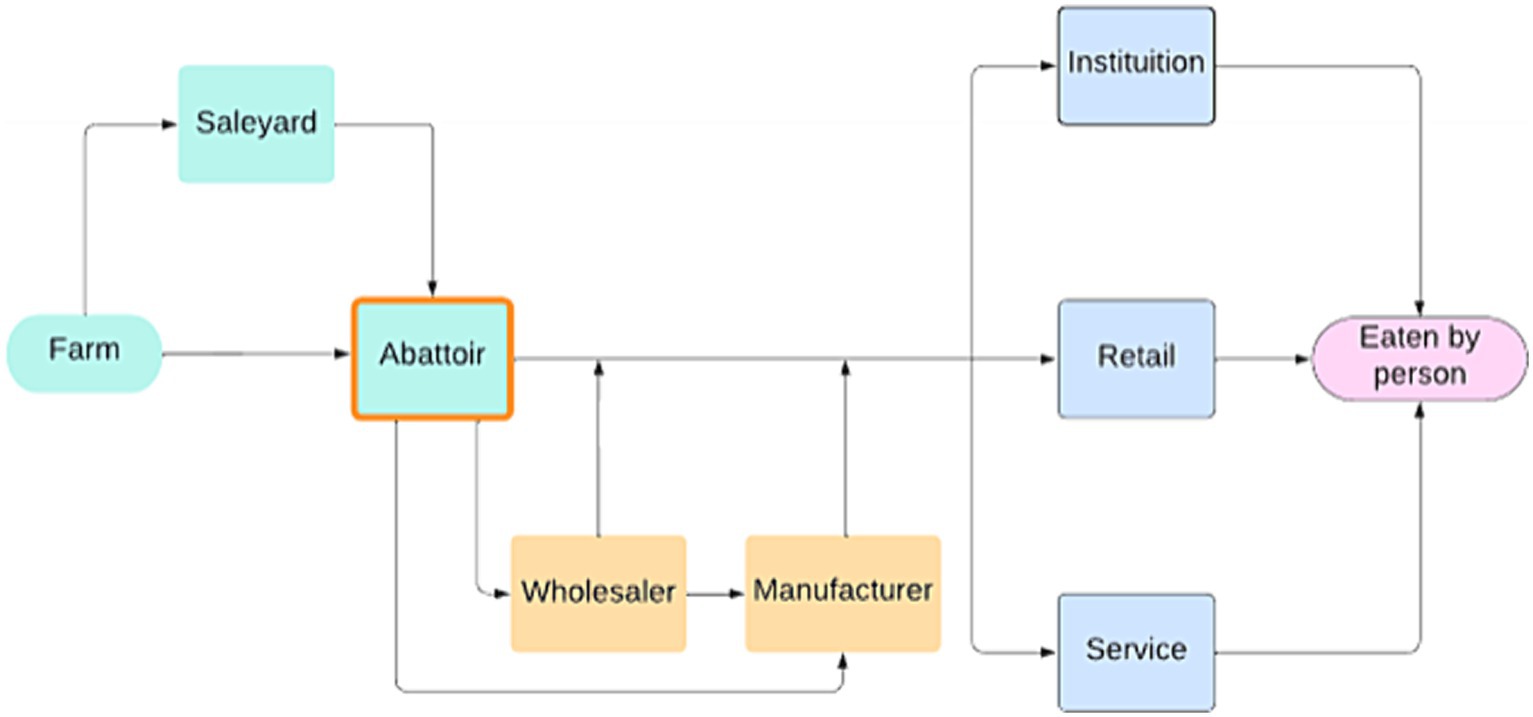
Figure 2. Australian sheep meat supply chain, highlighting the abattoir stage.
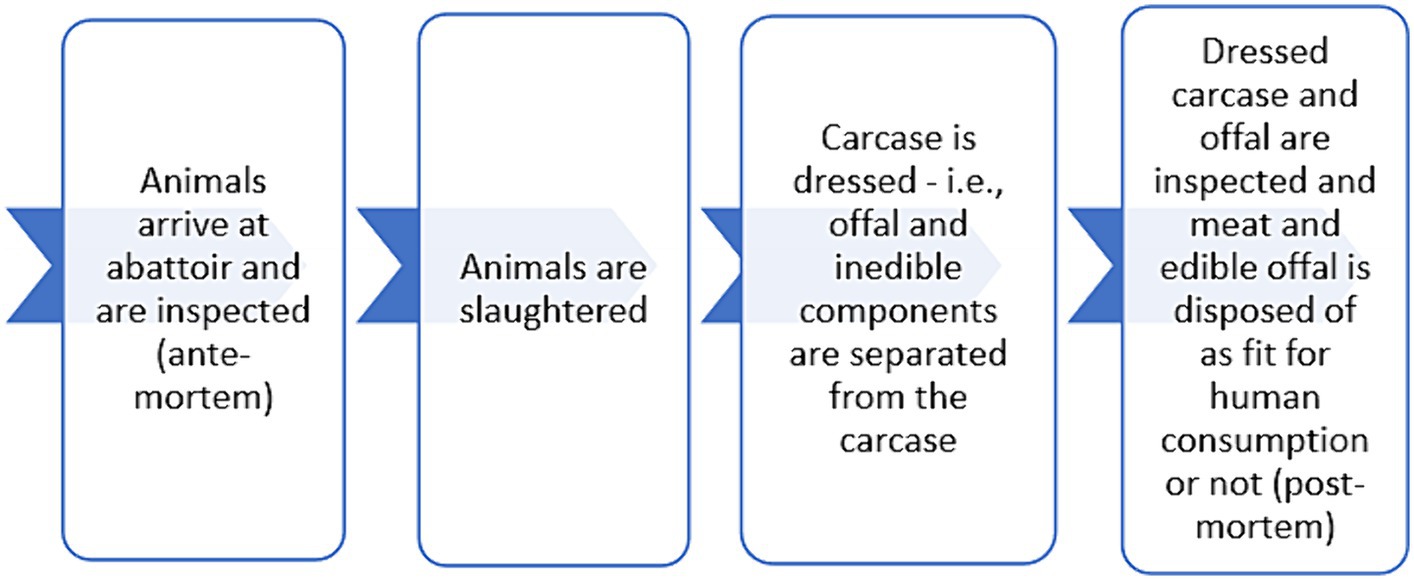
Figure 3. Processing flow at Australian sheep abattoirs.
Food categories included were those that had published Australian weight data (including edible portion information) and food composition data, noting the substitution of lamb offal nutrient composition data for adult sheep offal nutrient composition (Table 2). Based on the available data, from here on in this manuscript offal refers to liver, kidney, heart, tongue, and brain.
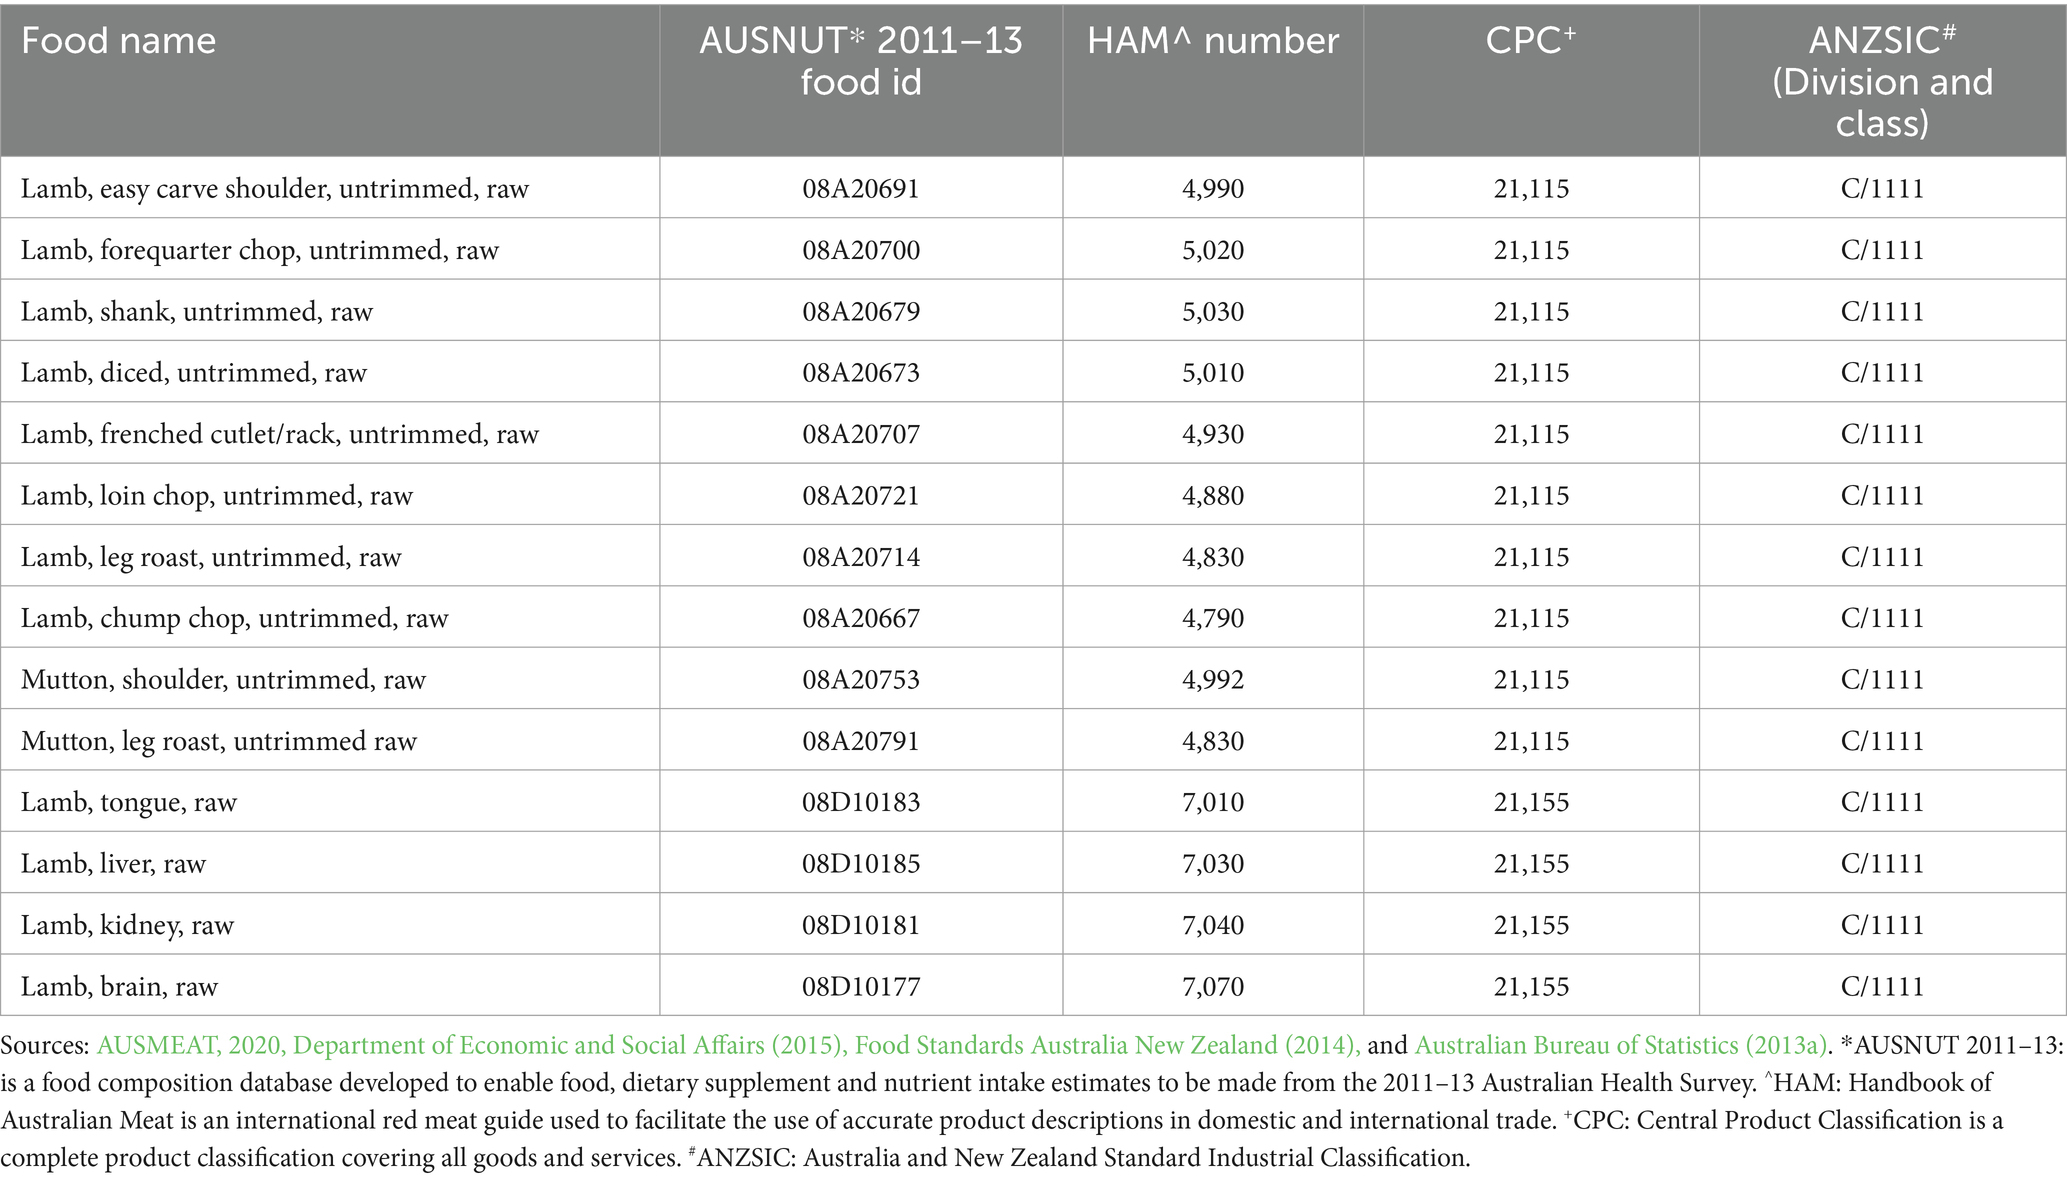
Table 2. Food categories included in the mass balance calculation of food and nutrient losses from the Australian sheep meat value.
Raw liver, kidney and heart weights were taken from analyzed data in Sentance (2011). These weights were not disaggregated by age, so we assumed the weight for lamb and adult sheep offal was the same. Tongue and brain raw weights were taken from analyzed data in Hutchison et al. (1987); this data is for lambs only and we assumed that adult sheep had the same tongue and brain weights as lambs (Table 3).
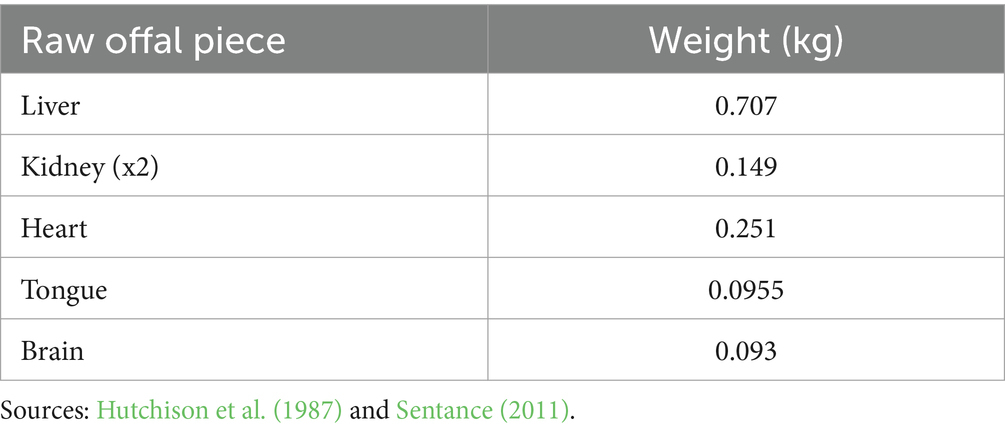
Table 3. Raw offal weights.
Food and nutrient losses from the Australian sheep meat value chain were estimated using inference by calculation. The FLW Quantification Method Ranking Tool (Food Loss and Waste Protocol, 2016) was used to select the method to achieve the aims stated in the Introduction. Mass Balance was the highest ranked methodology, scoring 90/100, and the only “green” category, i.e., based on our answers to the FLW Quantification Method Ranking Tool questionnaire, this was the only method recommended for further consideration.
The mass balance principle sequentially accounts for the weight of food and nutrients that arrived at the abattoir in animals ready for slaughter through to the weight of the edible portion of food and nutrients that were passed as fit for human consumption (Figure 4). This process was performed for the Australian lamb and the adult sheep meat (aka mutton) value chains. By combining the results of the Australian lamb and adult sheep value chains mass balance food and nutrient calculations, the combined food and nutrient flow for the Australian sheep meat value chain was determined.
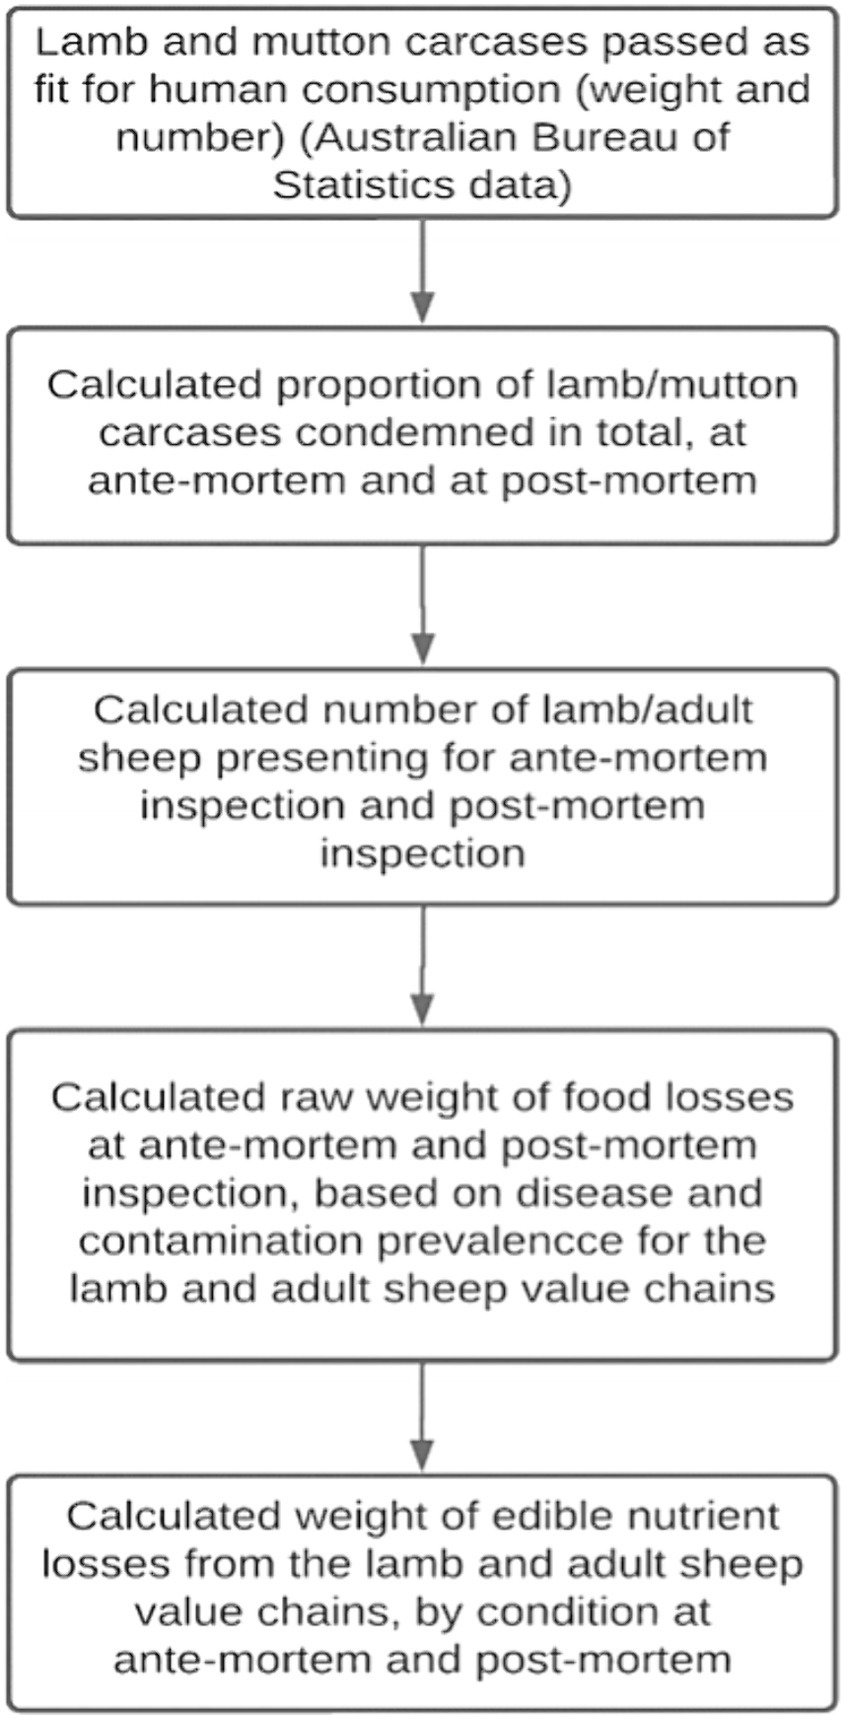
Figure 4. Framework for calculating the food and nutrient losses from the abattoir stage of the Australian lamb and adult sheep value chains.
Details on the calculations used to quantify ante-mortem and post-mortem direct nutrient losses from the Australian sheep meat value chain in 2015 are available in Appendix 1. The following is a summary of the steps taken and the data sources used in these calculations.
To begin with, the number of lamb and mutton carcases passed fit for human consumption was calculated from the dataset published by the Australian Bureau of Statistics, Livestock Products (Australian Bureau of Statistics, 2020b). Then, the ante-mortem and post-mortem populations were estimated, using these data and Export Production and Condemnation Statistics published in Lane et al. (2015).
Next, the prevalence of disease was calculated using data from the National Sheep Health Monitoring Project (Animal Health Australia, 2021) and the priority list of endemic diseases of the red meat industries (Lane et al., 2015). As a result, thirty (30) conditions were considered in this estimate of losses through the abattoir, with variation in what product was downgraded depending on the condition (Table 4). The weight of raw product downgraded due to these conditions was then calculated, based on analyzed data from Hernandez-Jover et al. (2013), Food Regulation Standing Committee (2007), expert elicitation and the prevalence calculations. Then, the weight of liver and kidneys condemned due to cadmium contamination was calculated based on the Meat Notice: Establishment sourcing of stock to comply with importing country requirements for cadmium levels in offals (Australian Government, 2015). The condemnation rate of offal due to cadmium contamination was adjusted to take into consideration condemnation due to disease. The edible nutrient losses were then calculated using the method described in Wingett and Alders (2023). The number of Australian women of reproductive age whose annual supply of red meat and key nutrients could have been supplied by the downgraded products and nutrients was then calculated, based on the Australian Dietary Guidelines (National Health and Medical Research Council, 2013) and the Australian and New Zealand Nutrient Reference Values (Australian Government and New Zealand Government, 2017).
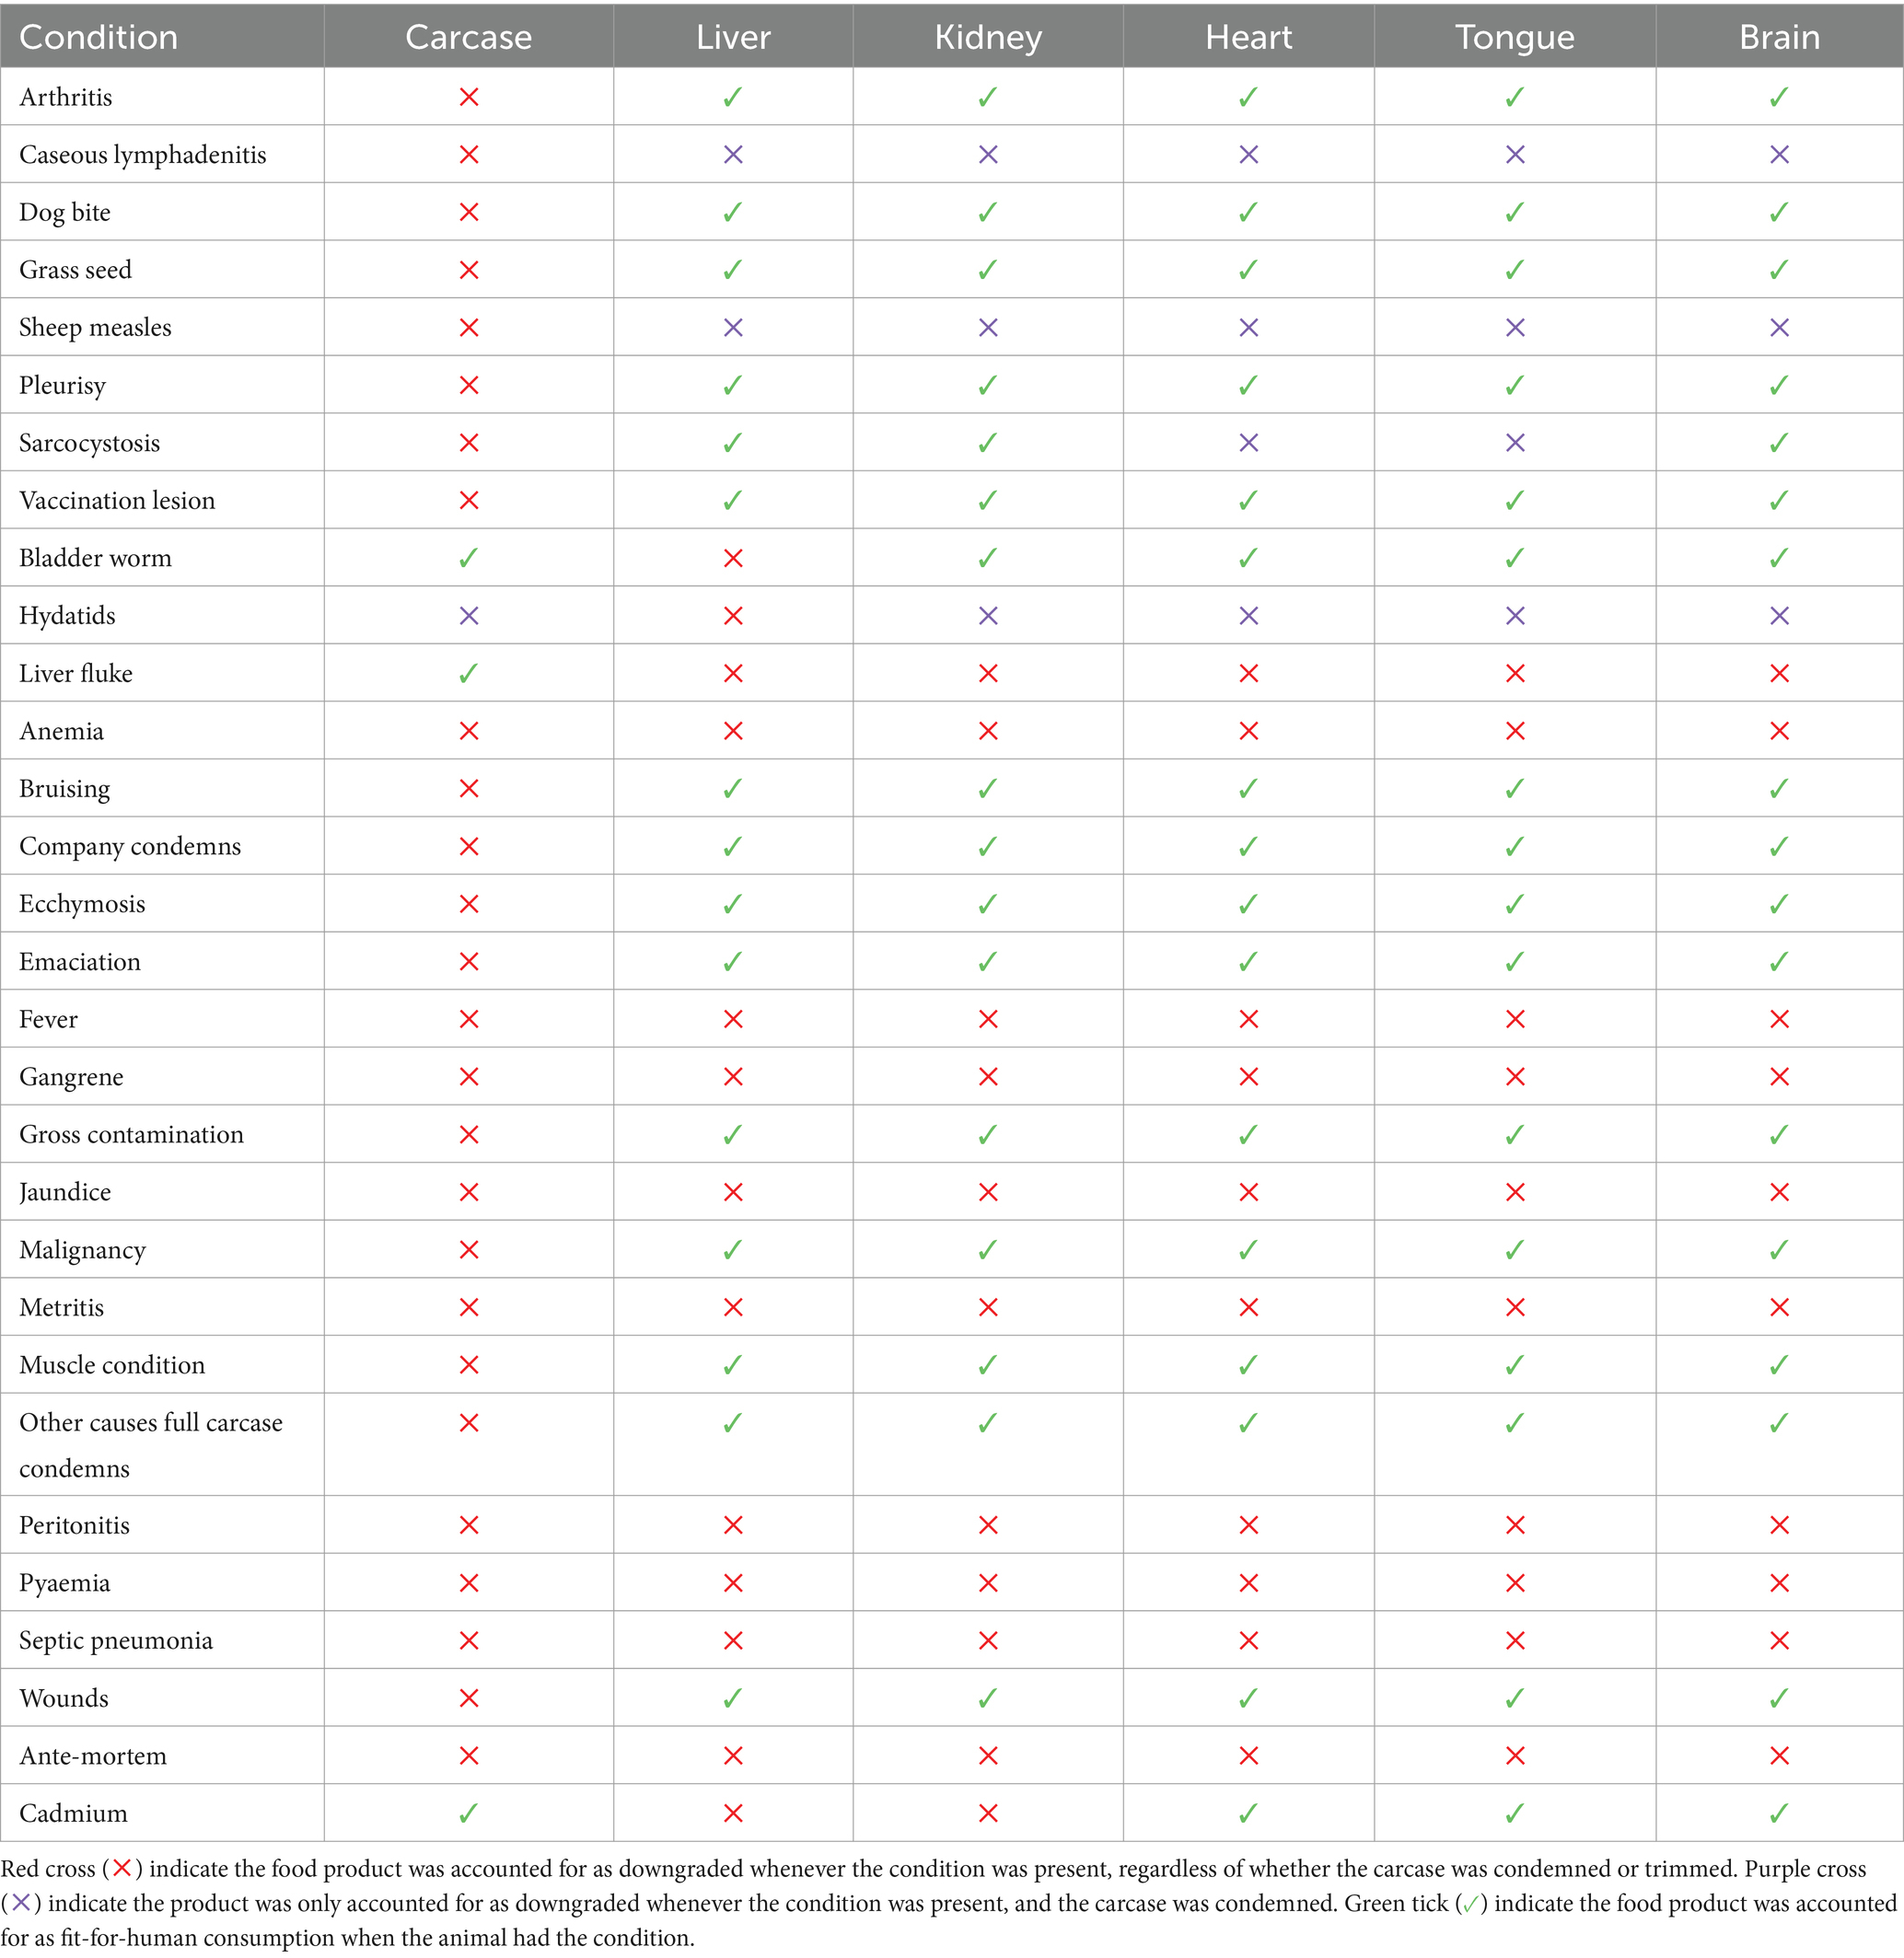
Table 4. Carcase and offal downgrades by condition used in the mass balance calculation of food and nutrient losses from the Australian sheep meat value chain at the abattoir.
As per the FLWS, an uncertainty assessment was performed on the results; a qualitative approach was taken to this assessment, based on the available data in the national datasets. Potential sources of uncertainty considered included systematic errors, assumptions, third-party data, model uncertainty and uncertainty in data used for inference (Food Loss and Waste Protocol, 2016).
Overall, the Australian sheep meat value chain is very efficient at the processing stage, with generally low levels of food and nutrient losses, except for kidney and liver from the adult sheep value chain and, correspondingly, vitamin A RE and dietary folate equivalents. As expected, the lamb value chain was more efficient than the adult sheep value chain, with reduced levels of food loss by product and nutrient weight.
This mass balance analysis had an overall qualitative uncertainty assessment of medium-to-high. It is important to consider this when interpreting the results.
In 2015, 22.69 million lamb and 8.51 million mutton carcases were passed as fit for human consumption. Approximately 99.92% of lambs that arrived at the abattoir passed ante-mortem inspection and had their carcases passed as fit for human consumption at post-mortem inspection. Of the 0.08% of the lamb population that had full carcase condemnations, the majority occurred at post-mortem inspection, i.e., 99.04% of full carcase condemnations occurred at post-mortem inspection. Approximately 99.32% of adult sheep that arrived at the abattoir passed ante-mortem inspection and had their carcases passed as fit for human consumption at post-mortem inspection. Of the 0.68% of the adult sheep population that had full carcase condemnations, the majority occurred at post-mortem inspection, i.e., 98.59% of the full carcase condemnations occurred at post-mortem inspection.
The ante-mortem populations for the lamb and adult sheep value chains were calculated to be 22.71 million and 8.57 million, respectively.
Ante-mortem condemnations were considered a “condition” for the remainder of the analysis, due to their relatively small prevalence compared with post-mortem downgrades, for both carcases/carcase parts and offal pieces.
Less than 1% of carcase meat, kidney, heart, tongue, and brain being downgraded as not-fit-for human consumption. There were mildly elevated losses of lamb liver, with approximately 2% downgraded (Table 5).
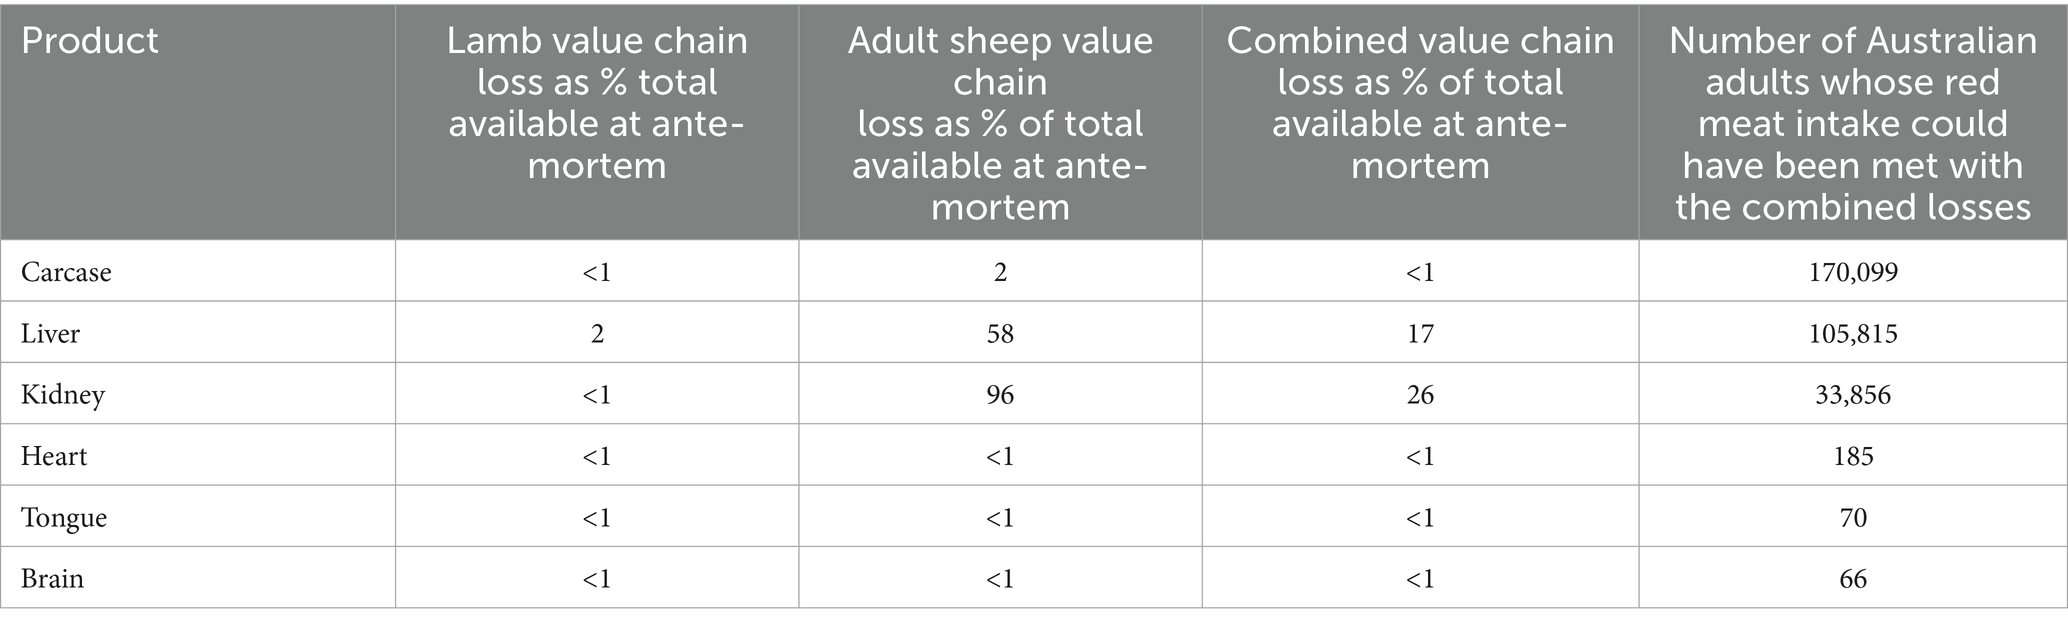
Table 5. Percentage of products downgraded at the abattoir in base year 2015, relative to the amount of product available from animals presented for ante-mortem inspection in the Australian lamb-, adult sheep- and combined sheep meat value chains.
The adult sheep value chain had a greater proportion of losses compared with the lamb value chain for all products. Product losses ranged from <1% (brain) to 96% (kidney) (Table 5). Adult sheep losses for carcase, heart, tongue, and brain were three-to-four-fold those for lamb. Losses for liver and kidney were markedly increased in the adult sheep chain compared with the lamb chain; approximately 26 times greater for liver and more the 1900 times greater for kidney.
Product losses of the adult sheep value chain were buffered by losses in the lamb value chain when the products for both value chains were combined (Table 5). This was due to there being a greater proportion of lambs being slaughtered in 2015 compared with adult sheep; for every adult sheep slaughtered approximately 2.5 lambs were slaughtered. Losses from the adult sheep value chain still formed a significant proportion of total carcase and edible offal pieces. Adult sheep kidney downgrades accounted for more than 99% of combined kidney losses (noting that nephritis was not included in the National Sheep Health Monitoring Project in 2015), 91% of combined liver downgrades, 70% of combined carcase downgrades, 60% of heart and tongue downgrades and, 59% of combined brain downgrades.
Total product losses from the Australian sheep meat value chain ranged from <1% of brains to 26% of kidneys. Less than 1% of carcase meat, heart, tongue, and brain were downgraded from the Australian sheep meat value chain during processing at the abattoir during 2015. Approximately 17% of livers and 26% of kidneys were downgraded as not-fit-for-for human-consumption from the combined Australian sheep meat value chain during the same period (Table 5).
Based on the maximum intake of red meat in the Australian Dietary Guidelines (National Health and Medical Research Council, 2013), and the assumption that a healthy intake of offal is the same as that as carcase meat, the annual product losses from the combined Australian sheep meat value chain could provide approximately 310,000 adult Australians with all their red meat for the year.
As for product losses, there were proportionally more losses of nutrients key to public health from the adult sheep value chain than the lamb value chain. Nutrient losses from the lamb value chain ranged from <1% of thiamine (B1), iron, energy, and protein to 2% of dietary folate equivalents and vitamin A RE. The range of nutrient losses was greater for the adult sheep value chain (4% of energy to 57% vitamin A RE) but followed the same pattern as the lamb value chain. Again, nutrient losses from the Australian sheep meat value chain were skewed toward the lamb value chain, ranging from 1% of energy to 17% of vitamin A RE (Table 6).
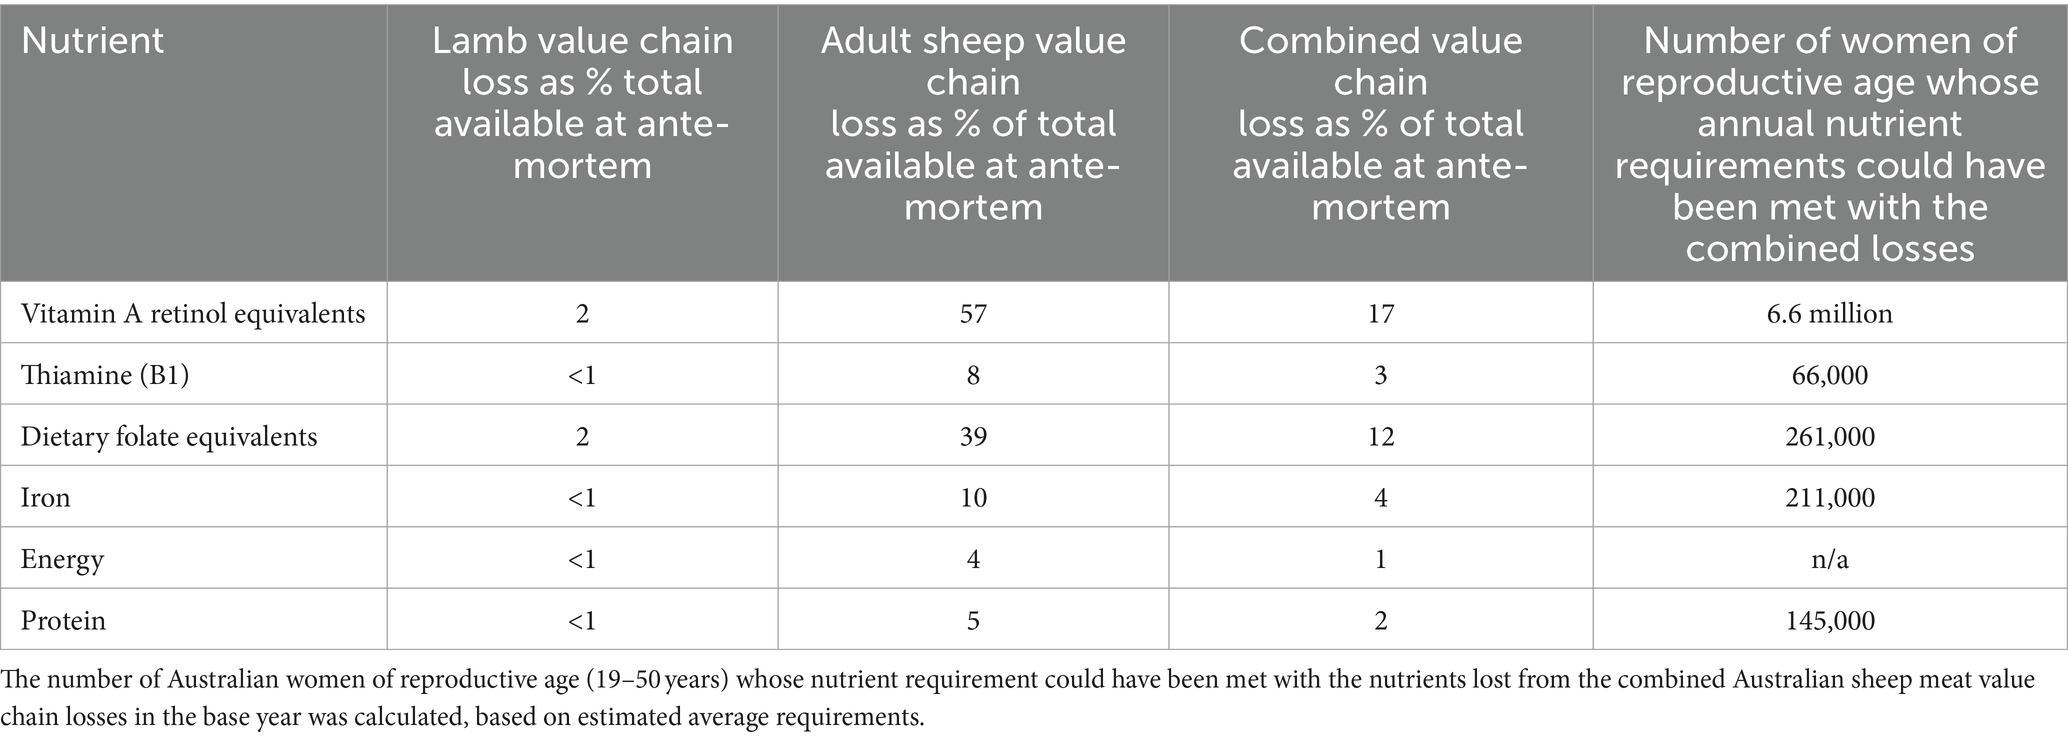
Table 6. Losses of nutrients key to public health at the point of slaughter, as a percent of total available at ante-mortem from the Australian lamb, adult sheep, and combined value chains in base year 2015.
The number of Australian women of reproductive age whose annual nutrient requirements could have been met with the downgraded products ranged from 66,000 for thiamine (B1) to 6.6 million for vitamin A RE. This calculation was based on the estimated average requirement for Australian women aged 19–50 years (National Health and Medical Research Council, 2013).
In this section, the relative contributions of various conditions to the total product downgrades and quantity of nutrient losses at the abattoir in the base year 2015 were analyzed. The Australian lamb and adult sheep value chains were individually assessed, and their combined impact was considered.
The leading causes of lamb and mutton carcase downgrades were identified as arthritis (34%) and caseous lymphadenitis (CLA) (28%). In the combined Australian sheep meat value chain, arthritis continued to be the primary cause (23%), followed by CLA (21%). For specific organs, bladder worm (89%) and cadmium contamination (79%) emerged as the primary causes of downgraded lamb and adult sheep livers (Figure 5).
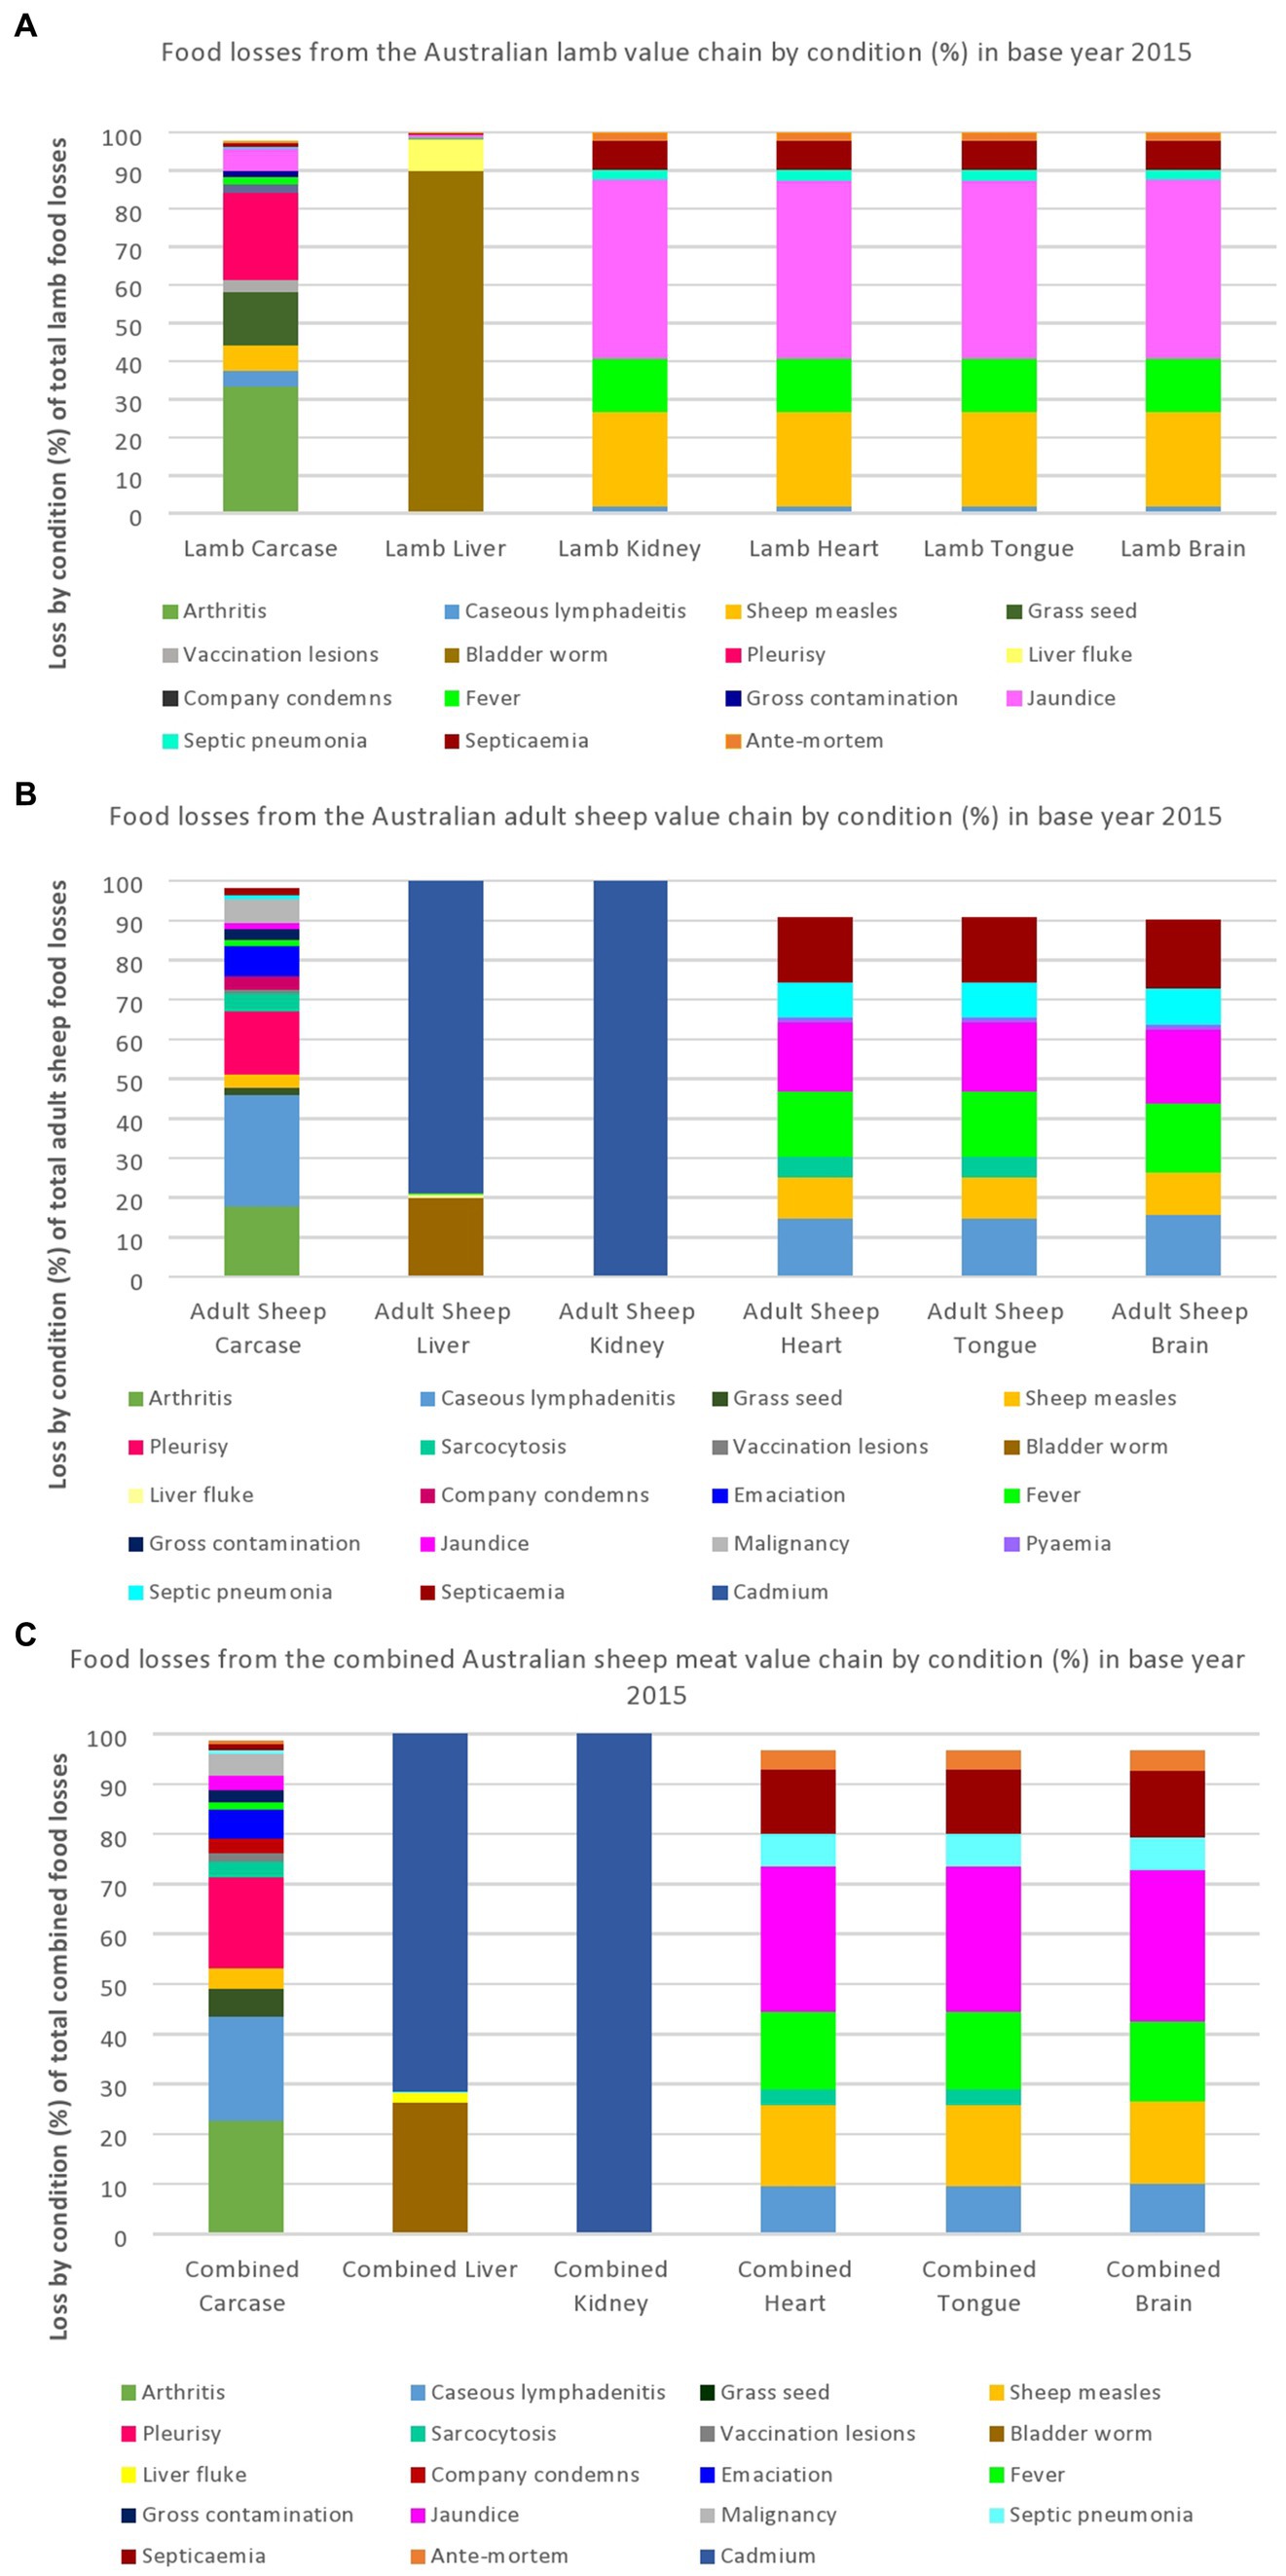
Figure 5. Cause of losses at the abattoir from the Australian lamb (A), adult sheep (B) and combined (C) value chains in base year 2015, represented as a proportion of total losses of products by weight. Some categories do not total to 1.0 as losses from conditions that accounted for less than 1% of the total losses of each product were not included. CLA, caseous lymphadenitis.
The study then estimated the relative contribution of each condition to the total amount of key nutrients downgraded. Cadmium contamination was consistently identified as a significant contributor, accounting for more than 50% of downgrades for vitamin A RE, thiamine (B1), dietary folate equivalents, and iron. When bladder worm was included, this percentage increased to over 70% (Figure 6). The causes of energy and protein losses were less concentrated than for micronutrients. However, cadmium and bladder worm still accounted for a substantial portion, contributing to 42 and 51% of downgraded energy and protein, respectively, in the combined Australian sheep meat value chain (Figure 6).
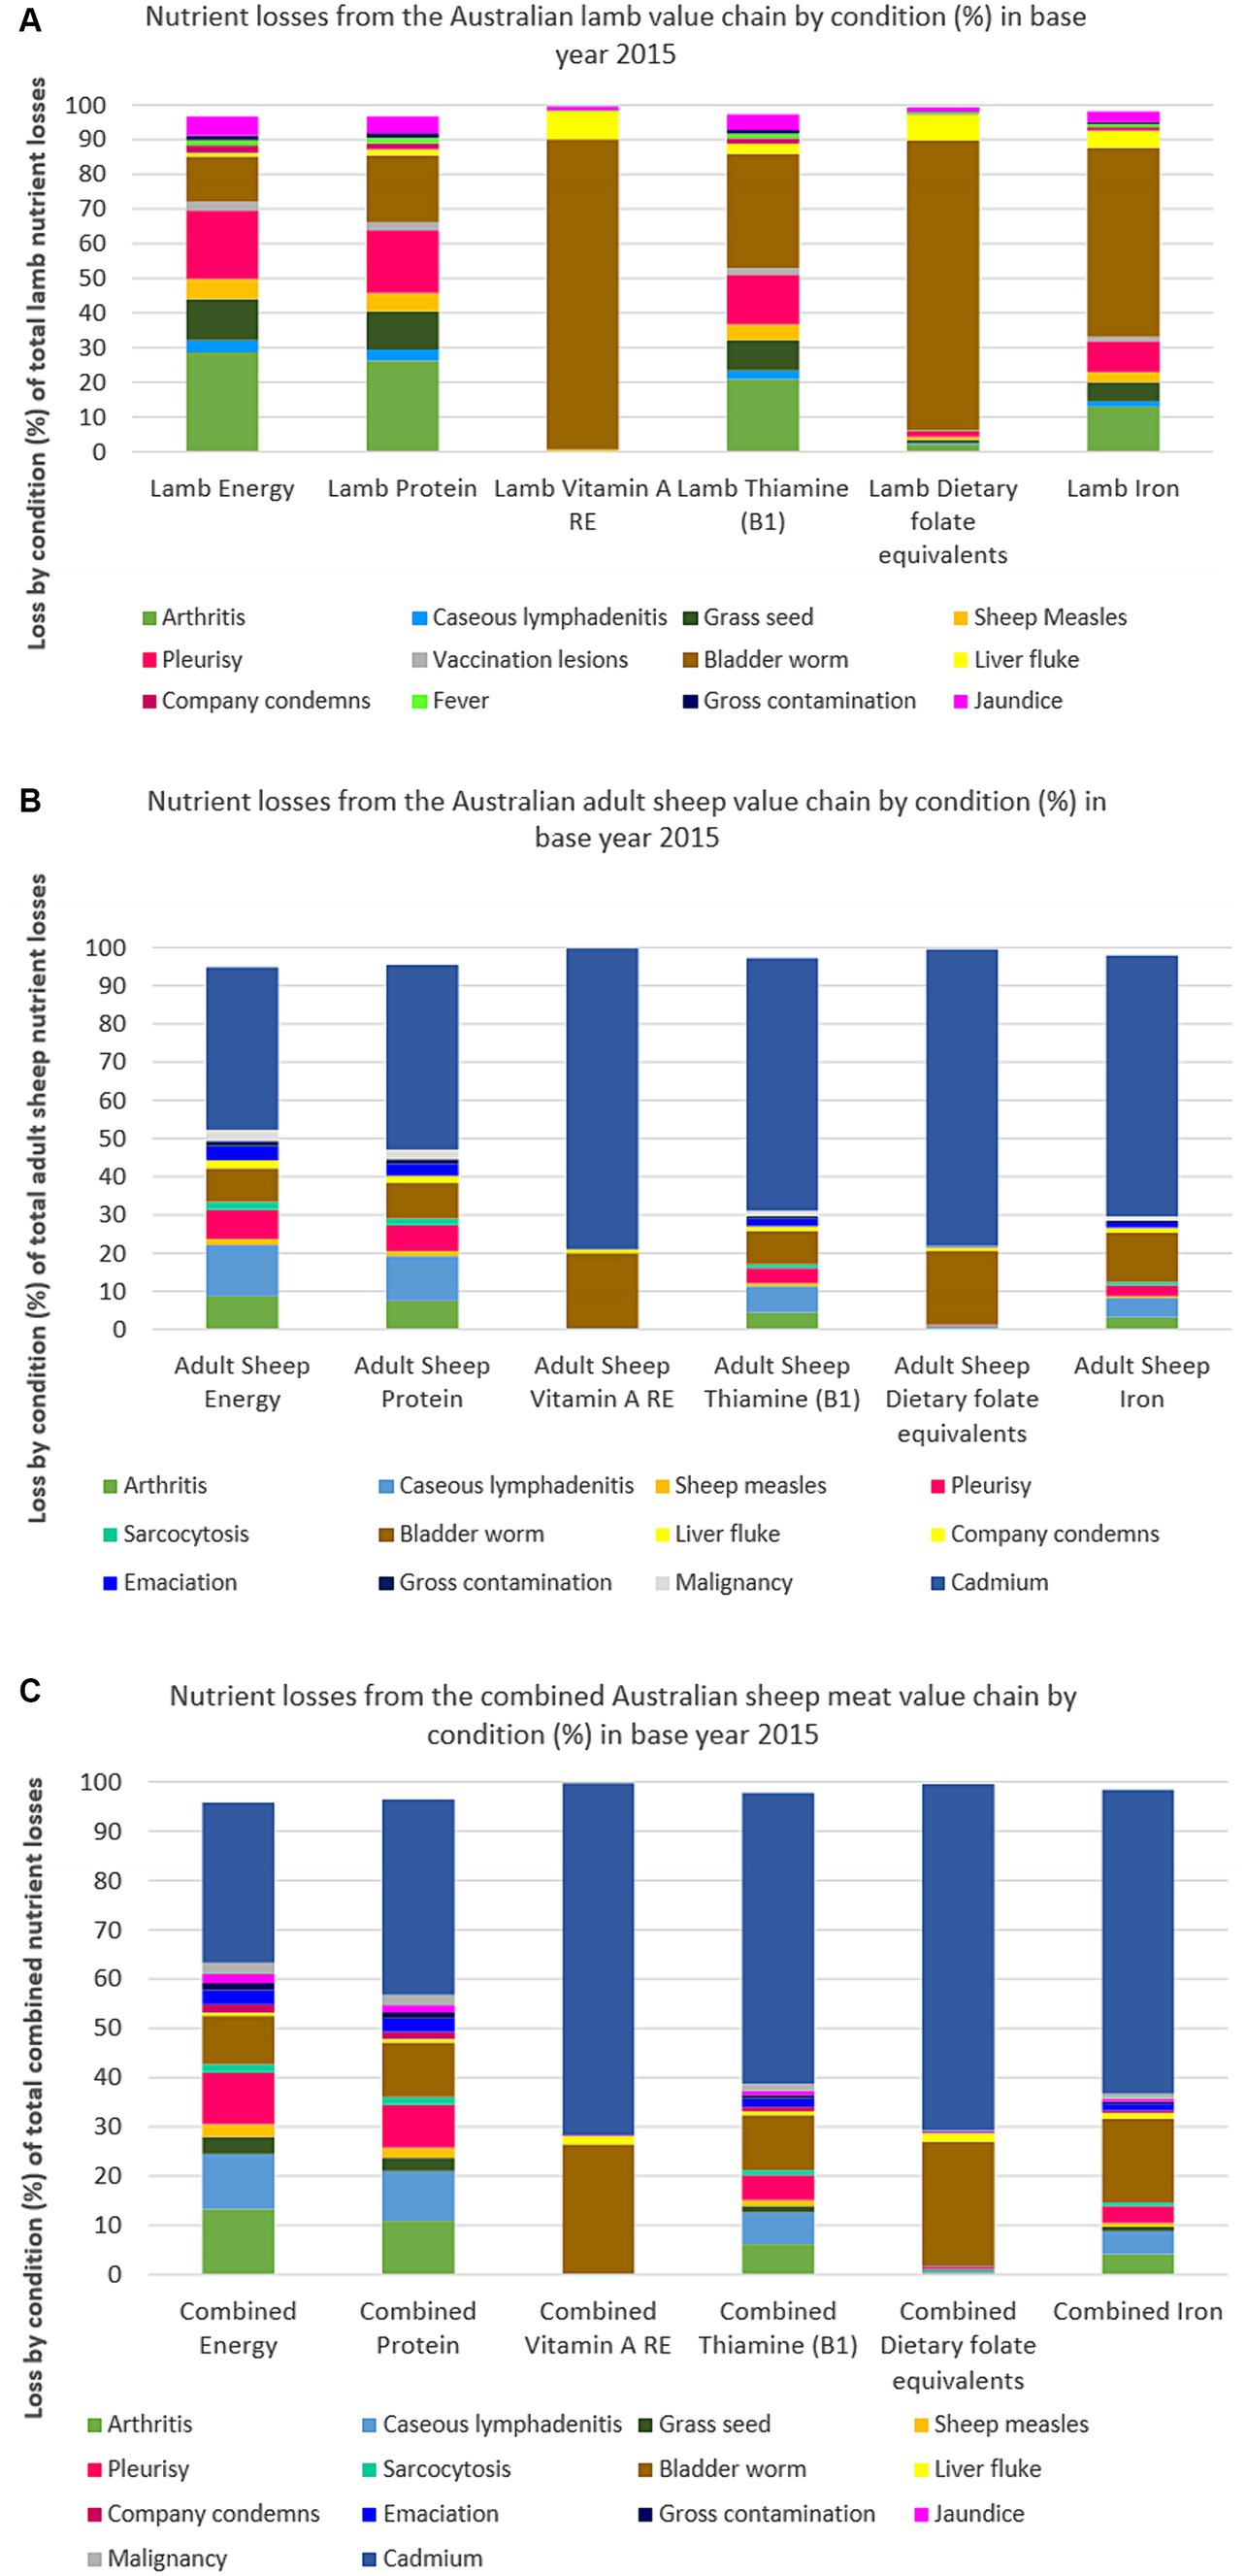
Figure 6. Cause of nutrient losses at the abattoir from the Australian lamb (A), adult sheep (B) and combined (C) value chains in base year 2015, represented as a proportion of total losses of nutrients from the lamb value chain. Some categories do not total to 1.0 as losses from conditions that accounted for less than 1% of the total losses of each nutrient were not included. CLA, caseous lymphadenitis.
There were 11 conditions that contributed to less than 1% loss of any products and any nutrient from the lamb, adult sheep, or combined value chain. These conditions were anemia, bruising, dog bite, ecchymosis, hydatids, gangrene, muscle conditions, metritis, other causes, peritonitis, and wounds.
Uncertainties in the calculation of food and nutrient loss from the Australian sheep meat value chain were qualitatively rated on a five-point scale - very low, low, medium, high, very high – and a justification for the rating provided (Table 7). This method was selected as the Food Loos Waste Accounting and Reporting Standard recommends including a qualitative uncertainty assessment of the assessment as a minimum (Food Loss and Waste Protocol, 2016).
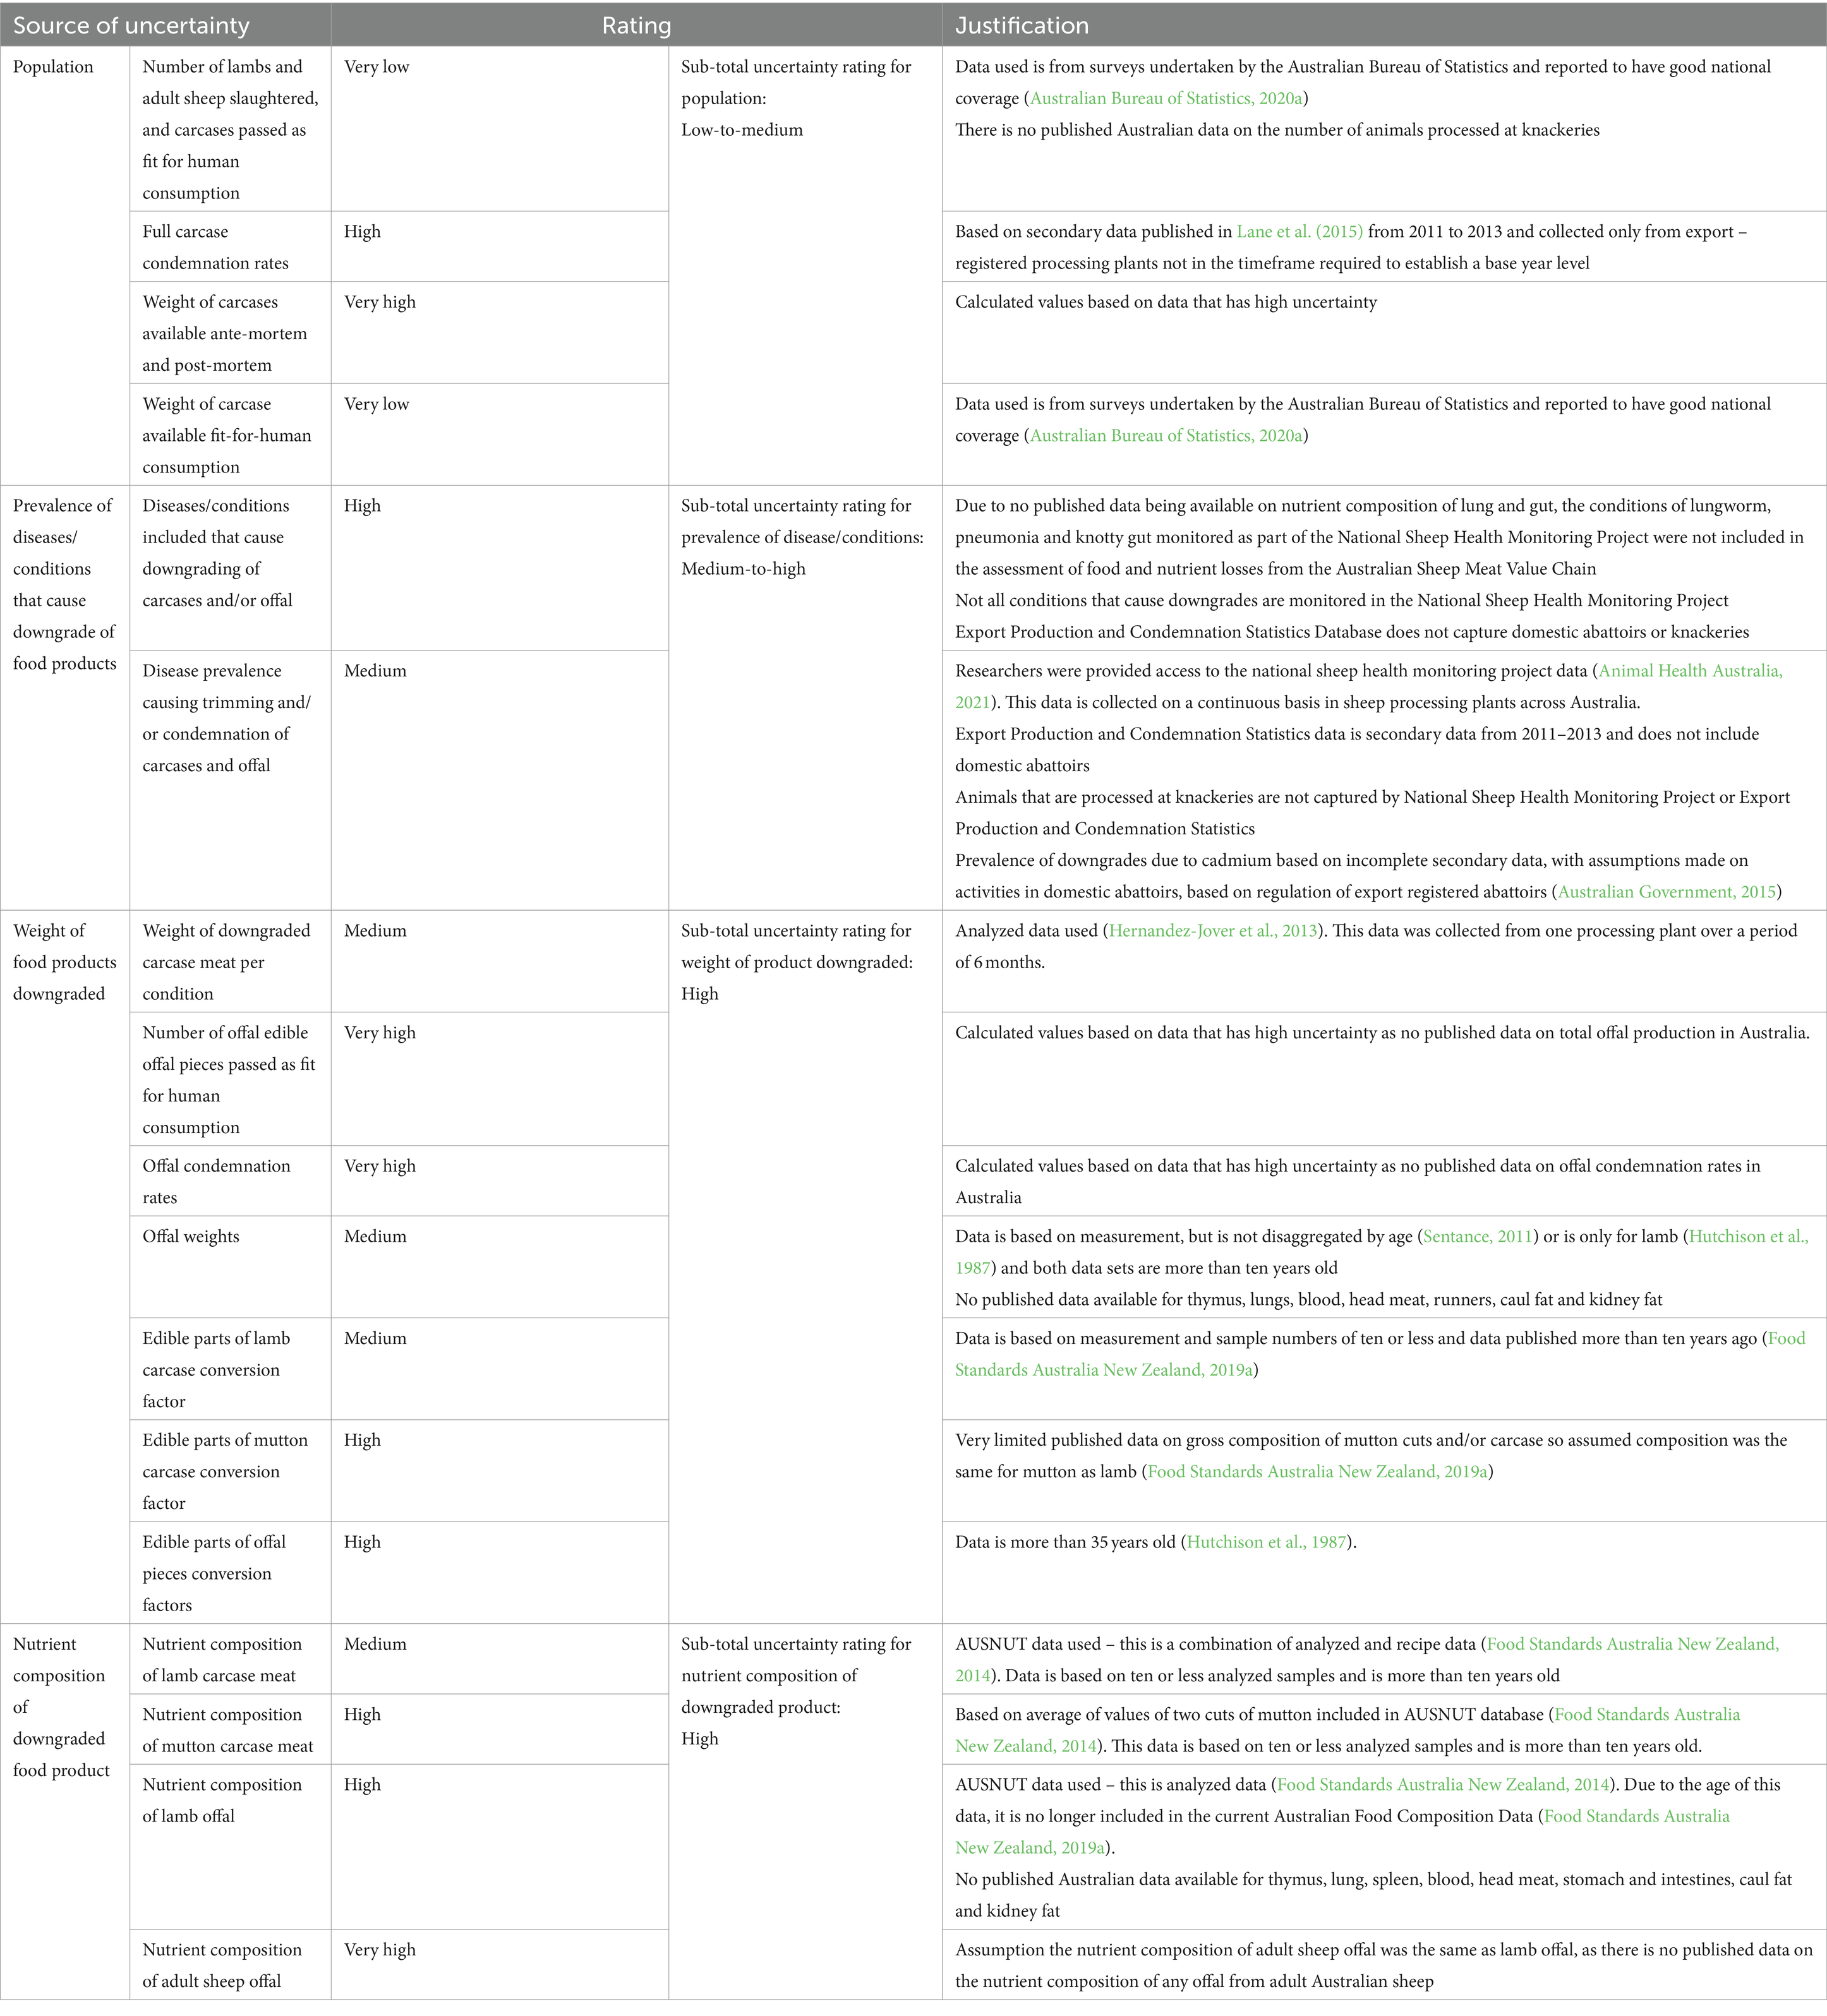
Table 7. Uncertainties in calculating food and nutrient losses from the Australian sheep meat value chain for base year 2015.
Factors taken into consideration in rating uncertainties included:
• the age of the data,
• type of data (analyzed, survey, recipe, secondary),
• the number of samples in the original data set, and
• data availability statement
Averaging the sub-total ratings, overall, the uncertainty in this mass balance analysis is medium-to-high.
The result suggest that the Australian lamb value chain had minimal losses of both products and nutrients during processing in 2015 (Tables 5, 6). Downgrades affected less than 1% of all pre-slaughter products, except for liver, with a 2% downgrade rate. These results are consistent with the findings in the National Food Waste Baseline Assessment (ARCADIS, 2019). Nutrient downgrades were also less than 1% for thiamine (B1), iron, energy, and protein, but vitamin A RE and dietary folate equivalents each having 2% downgrade. On the other hand, the adult sheep value chain had low downgrades for most products, but major downgrades for liver (58%) and kidneys (96%) due to cadmium contamination, resulting in substantial losses of vitamin A RE (57%), dietary folate equivalents (39%), iron (10%), thiamine (B1) (8%), protein (5%), and energy (4%). Combining both value chains, nutrient and energy downgrades from products ranged from 1% for energy to 17% for vitamin A RE.
Bladder worm (89%) and cadmium contamination (79%) were the main causes of downgraded lamb and adult sheep livers, respectively. Conditions causing lamb kidney downgrades were directly related to conditions causing full carcase and offal condemns, however adult sheep kidney downgrades were dominated by cadmium contamination (100%). The top five conditions for downgrades of heart, brain and tongue across the lamb and adult sheep value chains were reflective of the top five conditions causing full carcase and offal condemnations.
The medium to-high uncertainty in the food and nutrient loss calculations have arisen mostly due to assumptions that were made in cases where there was no data. These assumptions were generally conservative in nature and as such, the losses may be underestimated. The level of uncertainty highlights published data gaps in production volumes, destination, and nutrient composition of Australian sheep meat product, particularly of edible offal.
The losses of micronutrients key to public health in Australia reflect the disproportionate losses of edible offal from the Australian sheep meat value chain compared with carcase products, in particular liver and kidney. On a per gram basis, liver and kidney have a greater concentration of all micronutrients key to public health than carcase meat (Food Standards Australia New Zealand, 2014). In an individual lamb, liver absolutely contains greater amounts of vitamin A RE and dietary folate equivalents than the carcase, kidneys, heart, tongue and brain combined (Wingett and Alders, 2023). Cadmium contamination of liver and kidney in adult Australian sheep was the leading cause of losses of all nutrients key to Australian public health and energy. There are maximum cadmium levels in mammalian offal set in the Food Standards Australia and New Zealand and in export markets (Australian Government, 2020b). Based on the maximum levels of cadmium allowed in Australia in 2015, kidneys from adult sheep from all Australian states, except Queensland, were downgraded as not fit for human consumption. Livers from adult sheep from three states were also downgraded due to cadmium contamination (Western Australia, South Australia and Victoria), with restricted export markets for the remaining three states (Tasmania, New South Wales and Queensland) (Australian Government, 2015).
In 2020, a new Meat Notice - Establishment sourcing of stock to comply with import country requirements for cadmium levels in offal – was published Australian Government (2020b). This set policy for the management of cadmium levels in liver and kidney from adult sheep and cattle based on sub-regions of states, rather than at the state level (Australian Government, 2020a).Applying the conditions in this new Meat Notice to the 2015 food loss estimation, the percentage of kidneys eligible for harvest from adult sheep would have increased from 4 to 27% and for liver from 45 to 47%. Subsequently, there would have been a 3% increase in dietary folate equivalent availability and a 5% increase in Vitamin A availability.
Soil cadmium is transferred to livestock via ingestion of plants and soil. Cadmium then bioaccumulates in the kidneys and liver. Soils can be contaminated with cadmium through application of rock phosphate fertilizers, sewage sludge and industrial wastes (Ismael et al., 2018; Australian Government, 2022; Mubeen et al., 2023). Australian soils have low levels of natural cadmium and fertilizer application is the most significant contributing source of the cadmium to the Australian sheep meat value chain (Warne et al., 2007; MacLachlan et al., 2016).
In Australia, the level of cadmium in fertilizers is regulated by the jurisdictions and is set at 300 mg cadmium per kilogram of phosphorus. With growing interest in circular bioeconomies, cadmium levels in organic fertilizers and soil amendments, such as biosolids, also needs to be managed to minimize the risk of further increasing soil cadmium in agricultural areas, particularly where rock phosphate fertilizers have been previously applied (Alders et al., 2021; Fertilizer Australia, 2024). This may include regulation of cadmium levels in these products, much as rock phosphate fertilizers are regulated (NSW Government, 2014).
The authors recommend that when the regulated level of cadmium in fertilizer and organic soil amendments is next reviewed, the impact of cadmium on liver and kidney downgrades and nutrient availability is taken into consideration. Gains in reducing food and nutrient loss have been made with the change of the Meat Notice (Australian Government, 2020b); reducing regulated cadmium limits in fertilizers and soil amendments also has the potential to positively influence nutrient availability.
The prevalence of cadmium contaminated kidneys and livers in the Australian sheep meat value chain was determined via calculation, taking into consideration the age and location of the sheep and the Meat Notice on cadmium disposition (Australian Government, 2015). This was due to there being no published data on the prevalence of cadmium contamination of sheep liver and kidneys. Consideration should be given to including cadmium downgrades in the National Sheep Health Monitoring Project to gain a more accurate understand of the scale of the impact of cadmium contamination on nutrient availability from the Australian sheep meat value chain.
Bladder worm was the second highest ranked condition responsible for downgrades of nutrients key to Australian public health from the Australian sheep meat value chain. This condition is caused by the dog tapeworm, Taenia hydatigena. Sheep become infected from eating tapeworm eggs that an infected dog has passed in its faces; dogs become infected by eating infected raw offal or scavenging on infected carcases (Animal Health Australia, 2021). The prevalence of the condition can be significantly reduced through regular de-worming of dogs, prompt disposal of any fallen stock to reduce scavenging, not feeding dogs raw offal and, wild dog and fox control. Mitigations for bladder worm will also be effective for controlling sheep measles and hydatids (Animal Health Australia, 2021; Shephard et al., 2022). The condition is not clinically evident in live sheep or dogs. This means sheep producers will only be aware they have the condition in their flock when feedback from the abattoir is provided. Currently, this occurs in Australia for producers that sell sheep directly to slaughter at one of the 10 Australian abattoirs participating in the National Sheep Health Monitoring Project (Animal Health Australia, 2021). Consideration should be given to reorientating this monitoring project to a surveillance program, including expanding feedback to all producers, regardless of sale method. This is based on the contribution bladder worm infection has on nutrient availability from the Australian sheep meat value chain.
Neither cadmium or bladder worm were included in the report from Shephard et al. (2022) on priority endemic diseases for the Australian sheep and cattle industries. This report ranked conditions on economic impact the conditions had on the industries. Consideration should be given to ranking conditions not only on economic impact, but also the impact the condition has on food and nutrient availability at the society level. This will assist when assessing the Australian sheep meat value chain’s contribution to food security and natural resource management (if the assessment is using nutrients as the functional unit).
Improvements in data availability and quality would increase the accuracy of quantifying food and nutrient losses from the Australian sheep meat value chain. Issues with data quality affecting food loss and waste assessments are well documented (Food and Agricultural Organization, 2011; Xue et al., 2017; Hoehn et al., 2023). The FAO’s Global Livestock Environmental Assessment Model, known as GLEAM, aims “to quantify production and use of natural resources in the livestock sector and to identify environmental impacts of livestock in order to contribute to the assessment of adaptation and mitigation scenarios to move toward a more sustainable livestock sector” (Food and Agricultural Organization, 2021b). GLEAM currently does not include offal in its calculations. This is due to the lack of reported information from any of its member states on offal production globally (Food and Agricultural Organization, 2022). The impact of this on assessing the sustainability of livestock systems is marked, not only from a nutritional perspective as the results of this food loss assessment have shown, but also from a natural resource management perspective.
Wiedemann and Yan (2014) found that by including edible offal in the functional unit when calculating greenhouse gas emissions, the liveweight required on farm for each kilogram of retail product was reduced by 12%. Wingett and Alders (2023) conservatively estimated edible offal accounted for 12% of the total weight of edible components, 10% of the edible protein and 5% of edible energy of an Australian lamb. Not including edible offal when assessing the costs and benefits of livestock systems will over-estimate the relative impact of animals on the natural environment and underestimate the nutrient availability from livestock systems. This is particularly evident when performing nutritional life cycle assessment (McAuliffe et al., 2018; Damerau et al., 2019). Cases of successful reduction of food loss and waste are reported to have had strong government support (Kuiper and Cui, 2021). Developing commercially viable systems to capture offal production data and downgrades (including cause and magnitude) should be a priority for both the meat industries and governments.
Greater transparency in agricultural data sharing would improve the accuracy in this food loss assessment. The inclusion of full carcase condemnations in the Livestock Products, Australia series published by the Australian Bureau of Statistics would assist with this process. This information is captured in the equivalent national statistical series in New Zealand (Statistics New Zealand, 2021). The rate of full condemnations is comparable between the two countries, and both are low, with less than 1/100 adult sheep being condemned and less than 1/1000 lambs being condemned. This shows the high standard of the Australian and New Zealand sheep meat production and could be used as an indicator for animal health and welfare at the national level for the industry. Publication of data on the number of animals, disaggregated by species, age and sex, that are processed at knackeries (establishments that slaughter animals for animal food only) would also be of benefit to understanding the magnitude of product and nutrient losses from Australian livestock systems, as well as gaining a fuller understanding of animal health and welfare.
Further consideration needs to be given to the assumption in the ‘State of Food and Agriculture 2019 – Moving forward on food loss and waste reduction’ report (Food and Agricultural Organization, 2019), Global food loss index accounting and reporting (Food and Agricultural Organization, 2018) and the Australian national food waste baseline (ARCADIS, 2019) that a product that was intended to be food (e.g., edible offal) but is diverted to another supply chain (e.g., monogastric animal feed) and later enters the food chain in another form (e.g., chicken or pork) is a neutral outcome from a food systems perspective. The results of this mass balance analysis show that the downgrade of offal is a significant contributor to the downgrade of nutrients from the Australian sheep meat value chain. Australians eat very little nutrient-dense offal, less than 0.4 g per person per day, compared with 48.4 g of red meat and 48.7 g of poultry meat (Australian Bureau of Statistics, 2022a). However, a serve of chicken breast is not equal nutritionally to a serve of lamb liver. Although chicken breast has similar fat, protein and energy content to lambs’ liver, liver has significantly greater concentrations of micronutrients key to Australian public health, i.e., iron, vitamin A RE, thiamine (B1) and dietary folate equivalents. Additionally, there is an environmental impact from raising chickens (e.g., soybean meal being imported from South America as a feed input for the Australian chicken meat industry (Copley and Wiedemann, 2023)) that would not have occurred if the lamb and sheep offal had entered the food chain directly, rather than through nutrient recycling. Further research is recommended to understand the end points of products in Australian sheep meat value chain and the consequences of this nutrient recycling. This is supported by recommendations in the National Food Waste Baseline Final Assessment Report for further research into diversion of livestock products into the pet food supply chain (ARCADIS, 2019).
Based on the results of this food loss analysis, the Australian sheep meat value chain is very efficient at conserving food products and nutrients at the point of slaughter, except for kidney and liver condemnation due to cadmium contamination and the subsequent loss of dietary folate equivalents and vitamin A RE. However, these results have an overall uncertainty rating of medium-to-high. Greater transparency in agricultural data sharing would reduce this uncertainty. Further research into improved data collection on offal production and updating and expanding offal nutrient composition data will significantly improve the accuracy of this food and nutrient loss analysis. Quantifying pre-consumer waste of offal (e.g., offal fit for human consumption that is diverted to pet food or rendering due to market influences) will be of value in further understanding nutrient flows in the Australian sheep meat value chain and the impacts on food security, nutrition, and the environment. Government support for these actions will improve the likelihood of success and subsequently the sustainability of the Australian sheep meat value chain.
The data analyzed in this study is subject to the following licenses/restrictions: Some of the data anaylzed in this study was obtained from Animal Health Australia and the following restrictions apply – data from the National Sheep Health Monitoring Project is only available to the researchers. Requests to access National Sheep Health Monitoring Project datasets should be directed to: YWhhQGFuaW1hbGhlYWx0aGF1c3RyYWxpYS5jb20uYXU=. Generated datasets are available on request. The generated raw data supporting the conclusions of this article will be made available by the authors, without undue reservation.
KW: Conceptualization, Data curation, Methodology, Writing – original draft. RA: Conceptualization, Writing – review & editing.
The author(s) declare that financial support was received for the research, authorship, and/or publication of this article. The authors would like to acknowledge Bequest Funding from the Faculty of Veterinary Science, University of Sydney and the Post Graduate Research Support Scheme, University of Sydney.
The authors would like to acknowledge the following people, groups, and organizations: Members of Animal Health Australia (Wool Producers Australia, Sheep Producers Australia, government representatives) and Animal Health Australia for access to the national sheep health monitoring project data. A special thanks to Rob Barwell from Animal Health Australia; Meat and Livestock Australia, AUS-MEAT and CSIRO for the secondary data; Jason Ollington and Clive Anderson for advice on sheep meat processing in Australia; Peter Thomson for providing statistical services; Johanna Wong for providing feedback on an earlier version of this manuscript.
KW declares that the research was conducted in the absence of any commercial or financial relationships that could be construed as a potential conflict of interest. RA declares a potential conflict of interest in that she owns a merino sheep farm (which is not her primary source of income), however, her farm does not produce prime lambs.
All claims expressed in this article are solely those of the authors and do not necessarily represent those of their affiliated organizations, or those of the publisher, the editors and the reviewers. Any product that may be evaluated in this article, or claim that may be made by its manufacturer, is not guaranteed or endorsed by the publisher.
The Supplementary material for this article can be found online at: https://www.frontiersin.org/articles/10.3389/fsufs.2024.1304275/full#supplementary-material
ABARES . (2020). Agricultural commodity statistics 2020. Canberra: Australian Bureau of Agricultural and Resource Economics and Sciences cc by 4.0.
Alders, R. G., Chadag, M. V., Debnath, N. C., Howden, M., Meza, F., and Schipp, M. (2021). Planetary boundaries and veterinary services. Veterinary Services in a changing world: climate change and other external factors World Organisation for Animal Health.
Allen, L. H. (2005). Multiple micronutrients in pregnancy and lactation: an overview. Am. J. Clin. Nutr. 81, 1206S–1212S. doi: 10.1093/ajcn/81.5.1206
Animal Health Australia . (2021). National Sheep Health Monitoring Project. Animal Health Australia. Available at: https://www.animalhealthaustralia.com.au/nshmp/ (Accessed March 5, 2021).
ARCADIS . (2019). National food waste baseline: final assessment report. Available at: https://www.environment.gov.au/protection/waste/food-waste.
Australian Bureau of Statistics . (2013a). Australian and New Zealand standard industrial classification (Anzsic). Canberra: Australian Bureau of Statistics.
Australian Bureau of Statistics . (2013b). Australian health survey: updated results, 2011-2012. Australian Bureau of Statistics. Available at: https://www.abs.gov.au/ausstats/abs@.nsf/Lookup/33C64022abb5ecd5ca257B8200179437 (Accessed June 7, 2013).
Australian Bureau of Statistics . (2020a). Livestock products, Australia. Australian Bureau of Statisitics. Available at: https://www.abs.gov.au/statistics/industry/agriculture/livestock-products-australia/latest-release (Accessed November 17, 2020).
Australian Bureau of Statistics . (2020b). Livestock products, Australia [data cube]. Canberra: Australian Government.
Australian Bureau of Statistics . (2022a). Apparent consumption of selected foodstuffs, Australia. March 2022. Australian Bureau of Statistics. Available at: https://www.abs.gov.au/statistics/health/health-conditions-and-risks/apparent-consumption-selected-foodstuffs-australia/latest-release#summary.
Australian Bureau of Statistics . (2022b). Value of agricultural commodities produced, Australia, 2020-21. 26 July 2022. Australian Bureau of Statistics. Available at: https://www.abs.gov.au/methodologies/value-agricultural-commodities-produced-australia-methodology/2018-19.
Australian Bureau of Statistics . (2023). Agricultural commodities, Australia. Australian Bureau of Statistics. Available at: https://www.abs.gov.au/statistics/industry/agriculture/agricultural-commodities-australia/latest-release#methodology (Accessed January 17, 2023).
Australian Government . (2015). Meat notice: Establishment sourcing of stock to comply with importing country requirements for cadmium levels in offals. Canberra: Department of Agriculture.
Australian Government . (2016). Australia New Zealand food standards code – Standard 2.2.1 – Meat and meat products. F2016C00173. Canberra: Australian Government.
Australian Government . (2018). Australia New Zealand Food Standards Code - Standard 1.2.7 – Nutrition, health and related claims. Canberra: Australian Government, Federal Register of Legislation.
Australian Government . (2020a). Meat notice 2020/3 attachment: Appendix 1–3. Canberra: Department of Agriculture.
Australian Government . (2020b). Meat notice 2020/3: establishment sourcing of stock to comply with importing country requirements for cadmium levels in offal. Canberra: Department of Agriculture.
Australian Government . (2022). Cadmium and compounds. Canberra: Department of Climate Change, Energy, the Environment and Water. Available at: https://www.dcceew.gov.au/environment/protection/npi/substances/fact-sheets/cadmium-and-compounds#tabs-4 (Accessed July 13, 2023).
Australian Government . (2024). Australian Government's reporting platform on the Sdg indicators. Can. Underwrit. Available at: https://www.sdgdata.gov.au/goals/responsible-consumption-and-production (Accessed February 19, 2024).
Australian Government and New Zealand Government . (2017). Nrv summary tables. National Health and Medical Research Council, department of health and Aged Care and Health. Australian Government. Available at: https://www.eatforhealth.gov.au/nutrient-reference-values/resources/nrv-summary-tables.
Beal, T., and Ortenzi, F. (2022). Priority micronutrient density in foods. Front. Nutr. 8:785227. doi: 10.3389/fnut.2021.785227
Booth, S., and Smith, A. (2001). Food security and poverty in Australia - challenges for dietitians.
Bowden, M. (2020). Understanding food insecurity in Australia. Southbank, Victoria: Australian Government.
Brunner, P. H., and Rechberger, H. (2017). Handbook of material flow analysis: For environmental, resource, and waste engineers. Boca Raton: Taylor and Francis, Crc Press.
Byran, K., Webb, L., and Green, P. (2016). National Sheep Health Monitoring Project - economic modelling. Available at: https://www.animalhealthaustralia.com.au/nshmp/.
Carter, E., Lane, K., Ryan, E., and Jayaratnam, S. (2023). Incidence of iron deficiency Anaemia during pregnancy in far North Queensland. Aust. J. Rural Health 31, 124–131. doi: 10.1111/ajr.12929
Cattaneo, A., Sánchez, M. V., Torero, M., and Vos, R. (2021). Reducing food loss and waste: five challenges for policy and research. Food Policy 98:101974. doi: 10.1016/j.foodpol.2020.101974
Commonwealth of Australia . (2017). National Food Waste Strategy: halving Australia's food waste by 2030. Australian Government. Available at: https://www.dcceew.gov.au/environment/protection/waste/publications/national-food-waste-strategy.
Copley, M. A., and Wiedemann, S. G. (2023). Environmental impacts of the Australian poultry industry. 1. Chicken meat production. Anim. Prod. Sci. 63, 489–504. doi: 10.1071/an22230
Damerau, K., Waha, K., and Herrero, M. (2019). The impact of nutrient-rich food choices on agricultural water-use efficiency. Nat. Sustain. 2, 233–241. doi: 10.1038/s41893-019-0242-1
De Bruyn, J., Bagnol, B., Chan, H., Grace, D., Mitchell, M., Nunn, M., et al. (2020). The role of animal-source foods in sustainable, ethical, and optimal human diets. Science, Technology, and Innovation for Sustainable Development Goals. Oxford Scholarship Online.
Department of Economic and Social Affairs . (2015). Central product classification (Cpc) version 2.1. New York: Department of Economic and Social Affairs.
Drewnowski, A., and Fulgoni, V. (2008). Nutrient profiling of foods: creating a nutrient-rich food index. Nutr. Rev. 66, 23–39. doi: 10.1111/j.1753-4887.2007.00003.x
Fertilizer Australia . (2024). About Cadmium. Available at: https://fertilizer.org.au/about-fertilizer-australia/our-priorities-and-initiatives/fertiliser-issues/australian-cadmium-minimisation-strategy/about-cadmium (Accessed February 21, 2024).
Food and Agricultural Organization . (2009). Declaration of the world summit on food security. Rome: Food And Agricultural Organization.
Food and Agricultural Organization . (2011). Global food losses and food waste - extent, causes and prevention. Rome: Food And Agricultural Organization.
Food and Agricultural Organization . (2018). Sdg 12.3.1: Global food loss index. Methodological proposal for monitoring target 12.3 the global food loss index design, data collection methods and challenges. Rome: FAO Statistical Dision.
Food and Agricultural Organization . (2019). The state of food and Agriculture 2019. Moving forward on food loss and waste reduction. Rome: FAO.
Food and Agricultural Organization . (2021b). Global livestock environmental assessment model (Gleam). Available at: http://www.fao.org/gleam/en/.
Food and Agricultural Organization . (2021d). New Fbs methodology. Available at: http://www.fao.org/faostat/en/#data/Fbs.
Food and Agricultural Organization . (2022). Faostat - Supply Utilization Accounts, Livestock primary. Available at: http://www.fao.org/faostat/en/#data/Ql/visualize.
Food and Agricultural Organization . (2023a). Faostat. Available at: https://www.fao.org/faostat/en/.
Food and Agricultural Organization . (2023b). FAO stat - crops and livestock products. Available at: https://www.fao.org/faostat/en/#data/Qcl.
Food and Agricultural Organization . (2023c). Sdg indicators data portal. Food and Agricultural Organization. Available at: https://www.fao.org/sustainable-development-goals/data/indicators/1231-global-food-losses/en (Accessed July 7, 2023).
Food and Agricultural Organization . (2023d). Technical platform on the measurement and reduction of food loss and waste. Rome: FAO.
Food Loss and Waste Protocol . (2016). Food loss and waste accounting and reporting standard. Washington, DC: World Resources Institute.
Food Regulation Standing Committee . (2007). Australian standard for the hygienic production and transportation of meat and meat products for human consumption. Csiro Publishing. Available at: http://www.publish.csiro.au.
Food Standards Australia New Zealand . 2014. Ausnut 2011–13 – Australian food composition database. Food Standards Australia New Zealand. (2014). Available at: https://www.foodstandards.gov.au/science/monitoringnutrients/ausnut/Pages/faq.aspx.
Food Standards Australia New Zealand . (2019a). Release 1 - food nutrient database. Available at: https://www.foodstandards.gov.au/science/monitoringnutrients/afcd/Pages/default.aspx.
Food Standards Australia New Zealand . (2019b). Vitamins and minerals added to food. Available at: https://www.foodstandards.gov.au/consumer/nutrition/vitaminadded/Pages/default.aspx (Accessed January 21, 2021).
Gundersen, C., and Ziliak, J. P. (2015). Food insecurity and health outcomes. Health Aff. 34:10. doi: 10.1377/hlthaff.2015.0645
Hernandez-Jover, M., Ramsay, G., Links, I., Nordblom, T., Jackson, B., and Bell, R. (2013). Financial impact of ovine Johne’s disease on the processing sector. North Sydney: Meat and Livestock Australia.
Hoehn, D., Vázquez-Rowe, I., Kahhat, R., Margallo, M., Laso, J., Fernández-Ríos, A., et al. (2023). A critical review on food loss and waste quantification approaches: is there a need to develop alternatives beyond the currently widespread pathways? Resour. Conserv. Recycl 188:106671. doi: 10.1016/j.resconrec.2022.106671
Hutchison, G. I., Nga, H. H., Kuo, Y. L., and Greenfield, H. (1987). Composition of Australian foods. 36. Beef, lamb and veal offal. Food Technol. Aust. 39, 223–227.
IPSOS . (2023). Foodbank hunger report research 2023: national key findings report. Available at: https://reports.foodbank.org.au/wp-content/uploads/2023/10/2023_Foodbank_Hunger_Report_Ipsos-Report.pdf.
Ismael, M. A., Elyamine, A. M., Moussa, M. G., Cai, M., Zhao, X., and Hu, C. (2018). Cadmium in plants: uptake, toxicity, and its interactions with selenium fertilizers. Metallomics 11, 255–277. doi: 10.1039/c8mt00247a
Kirkpatrick, S. I., and Tarasuk, V. (2008). Food insecurity is associated with nutrient inadequacies among Canadian adults and adolescents. J. Nutr. 138:9. doi: 10.1093/jn/138.3.604
Kuiper, M., and Cui, H. D. (2021). Using food loss reduction to reach food security and environmental objectives – a search for promising leverage points. Food Policy 98:13. doi: 10.1016/j.foodpol.2020.101915
Lai, M., Rangan, A., and Grech, A. (2022). Enablers and barriers of harnessing food waste to address food insecurity: a scoping review. Nutr. Rev. 80, 1836–1855. doi: 10.1093/nutrit/nuac012
Lane, J., Jubb, T., Shephard, R., Webb-Ware, J., and Fordyce, G. (2015). Priority list of endemic diseases of the red meat industries. North Sydney, Australia: Meat and Livestock Australia.
Maclachlan, D. J., Budd, K., Connolly, J., Derrick, J., Penrose, L., and Tobin, T. (2016). Arsenic, cadmium, cobalt, copper, lead, mercury, molybdenum, selenium and zinc concentrations in liver, kidney and muscle in Australian sheep. J. Food Compos. Anal. 50, 97–107. doi: 10.1016/j.jfca.2016.05.015
Majchrzak, D., Fabian, E., and Elmadfa, I. (2006). Vitamin a content (retinol and retinyl esters) in livers of different animals. Food Chem. 98, 704–710. doi: 10.1016/j.foodchem.2005.06.035
Mcauliffe, G. A., Takahashi, T., and Lee, M. R. F. (2018). Framework for life cycle assessment of livestock production systems to account for the nutritional quality of final products. Food Energy Secur. 7:e00143. doi: 10.1002/fes3.143
Mubeen, S., Ni, W., He, C., and Yang, Z. (2023). Agricultural strategies to reduce cadmium accumulation in crops for food safety. Agriculture 13:471. doi: 10.3390/agriculture13020471
Murphy, S. P., and Allen, L. H. (2003). Nutritional importance of animal source foods. J. Nutr. 133:4. doi: 10.1093/jn/133.11.3932S
National Health and Medical Research Council (2013). Australian dietary guidelines. Available at: https://www.eatforhealth.gov.au/guidelines.
NSW Government . (2014). Resource recovery order under part 9, clause 93 of the protection of the environment operations (waste) regulation 2014 - the biosolids order 2014. NSW environment protection authority. Available at: https://www.epa.nsw.gov.au/-/media/epa/corporate-site/resources/waste/rro14-biosolids.pdf.
Shephard, R., Webb Ware, J., Blomfield, B., and Niethe, G. (2022). Priority list of endemic diseases for the red meat industry - 2022 update. North Sydney: Meat and Livestock Australia.
Statistics Division of the United Nations Secretariat . (2022). Standard country or area codes for statistical use (M49). New York: United Nations Statistics Division. Available at: https://unstats.un.org/unsd/methodology/m49/.
Statistics New Zealand . (2021). Livestock slaughtering. Available at: http://infoshare.stats.govt.nz/SelectVariables.aspx?pxid=f71607d6-ba7e-4041-b43f-72c07b9d158c.
Torheim, L. E., and Arimond, M. (2013). “Diet quality, micronutrient intakes and economic vulnerability of women” in Diet quality: An evidence-based approach. eds. V. R. Preedy, L. A. Hunter, and V. B. Patel, vol. 1 (New York: Springer)
United Nations . (2015). Transforming our world: The 2030 agenda for sustainable development. Rome, Italy: United Nations.
Warne, M., Rayment, G., Brent, P., Drew, N., Klim, E., Mclaughlin, M., et al. (2007). Final report of the National Cadmium Management Committee (200–2006). Act: Fertilizer Australia.
Wiedemann, S., and Yan, M. (2014). Livestock meat processing: Inventory data and methods for handling co-production for major livestock species and meat products.
Williams, P., Droulez, V., Levy, G., and Stobaus, T. (2007). Composition of Australian red meat 2002–3. Nutrient profile. Food Aust. 59, 331–341.
Wingett, K., and Alders, R. (2023). Distribution of nutrients across the edible components of a modelled typical Australian lamb: A case study. Research Directions: One Health, p. 9.
Wingett, K., Allman-Farinelli, M., and Alders, R. (2018). Food loss and nutrition security: reviewing pre-consumer loss in Australian sheep meat value chains using a planetary health framework. Cab Rev. 13, 1–12. doi: 10.1079/PAVSNNR20181303
World Health Organization . (2015). The global prevalence of anaemia 2011. Switzerland: World Health Organiation.
World Health Organization . (2020). Global anaemia reduction efforts among women of reproductive age: Impact, achievement of targets and the way forward for optimizing efforts. Geneva: World Health Organization.
Keywords: nutrient, food loss, Australia, sheep, lamb, abattoir
Citation: Wingett K and Alders R (2024) Quantifying pre-consumer food and nutrient losses from the Australian lamb and sheep meat value chain: a case study. Front. Sustain. Food Syst. 8:1304275. doi: 10.3389/fsufs.2024.1304275
Edited by:
Ty Beal, Global Alliance for Improved Nutrition, SwitzerlandReviewed by:
Edward Joy, University of London, United KingdomCopyright © 2024 Wingett and Alders. This is an open-access article distributed under the terms of the Creative Commons Attribution License (CC BY). The use, distribution or reproduction in other forums is permitted, provided the original author(s) and the copyright owner(s) are credited and that the original publication in this journal is cited, in accordance with accepted academic practice. No use, distribution or reproduction is permitted which does not comply with these terms.
*Correspondence: Kate Wingett, a3dpbjU5ODBAdW5pLnN5ZG5leS5lZHUuYXU=
Disclaimer: All claims expressed in this article are solely those of the authors and do not necessarily represent those of their affiliated organizations, or those of the publisher, the editors and the reviewers. Any product that may be evaluated in this article or claim that may be made by its manufacturer is not guaranteed or endorsed by the publisher.
Research integrity at Frontiers
Learn more about the work of our research integrity team to safeguard the quality of each article we publish.