- 1College of Economics and Management, Nanjing Agricultural University, Nanjing, China
- 2College of Economics, Guizhou University, Guiyang, Guizhou Province, China
Introduction: Promoting the development of large-scale pig farming is a crucial measure implemented by the Chinese government to regulate the pig market.
Methods: By utilizing panel data from 30 provinces in China spanning from 2003 to 2020 and employing the PVAR model, this study examines the relationships among price random fluctuations, profftability levels, and industrial scale.
Results and discussion: The findings reveal that industrial scale can effectively mitigate price random fluctuations; however, it also leads to a decrease in relative hog prices. Moreover, there exists significant heterogeneity in the impact of scaling on price random fluctuations. Increasing the proportion of farmers engaged in pig farming with a scale ranging from 500 to 9,999 heads reduces random price fluctuations, while increasing the proportion of farmers involved in pig farming with a scale exceeding 10,000 heads has no effect on stabilizing such fluctuations. Additionally, threshold effects are observed for epidemics and environmental regulations. When environmental regulations are less stringent, industrial scale enhances relative prices and stabilizes random fluctuations; nevertheless, once certain thresholds are surpassed, industrial scale diminishes relative prices and eliminates its stabilizing effect on random fluctuations. Similarly, after an epidemic surpasses its threshold level, industry scale fails to stabilize random price fluctuations. These findings provide valuable insights for governments when formulating industrial policies aimed at mitigating agricultural market risks.
1 Introduction
Agriculture contributes significantly to GDP, serves as a vital source of food and industrial raw materials, and is a source of livelihood for the majority of farmers in developing countries. In most developing countries, the agricultural industry has the potential to alleviate poverty at a faster rate compared to other sectors (Nugroho, 2021a). Agriculture contributes significantly to GDP, serves as a vital source of food and industrial raw materials, absorbs a portion of national labor, and is a source of livelihood for the majority of farmers in developing countries. However, due to its inherent fragility, agriculture is susceptible to external shocks that may result in unforeseen consequences such as heightened price volatility and diminished welfare for farmers (Nugroho, 2021b). In these conditions, farmers suffer losses or make only a small profit. Meanwhile, as food prices increase, consumers must spend more of their income to buy it. As an external intervention measure, it is necessary to study the relationship between policy measures and market price risks associated with agricultural commodities.
China’s animal husbandry sector has achieved remarkable progress since the implementation of reform and opening up. From 1980 to 2017, the total meat production in China increased from 12.054 to 8.5811 million tons, with an average annual growth rate of 5.45%. Specifically, pork production witnessed a growth rate of 4.28%. Moreover, during the period from 1978 to 2017, the proportion of animal husbandry’s contribution to the total output value of agriculture rose from 14.98 to 26.38%.1 In terms of pig production, in 1978, China’s hog slaughtering amount was 161.1 million, accounting for approximately one-fourth (25.84%) of global pig production at that time; whereas by 2017 China’s pig output reached around 672 million, accounting for 55.01% of the global hog slaughtering amount.2
The agricultural sector faces diverse uncertainties and risks, notably in pig prices, price risks being a significant concern (Aimin, 2010). Since the early 21st century, pig prices have exhibited frequent and substantial fluctuations, influenced by external shocks like epidemics and disasters (Gale et al., 2012; Wang et al., 2020). In response, the State Council issued the “Notice on the Production and Supply of Pork and other non-staple Foods to Maintain Market Stability.” A series of policies and measures was introduced to regulate the pig market. For instance, in 2007, the Central Committee issued the “Opinions on Promoting the Development of Pig Production and Stabilizing Market Supply.” This document emphasized policies such as encouraging the development of large-scaled pig farming and promoting standardized farming.
These initiatives led to a rapid expansion in China’s pig industry. The proportion of large-scale breeding accounts for 64.5% of the total breeding.3 By September 2021, the top 10 listed companies in China’s pig industry contributed approximately 14%, representing 66.51 million head of the national volume.4 Despite these advancements, challenges of recurring fluctuations and periodic “peaking” and “bottoming” phenomena in pork prices remained severe, particularly following outbreaks like African swine fever (Yang and Wang, 2022). Why does the price of pigs still fluctuate sharply despite the steady increase in scale? Is the relationship between industry scale and market price risk limited by other key factors? Additionally, will an increase in large-scale farming lead to monopoly and impact pig prices?
To explore these issues, this study analyzes the relationship between industrial scale and price risk in China’s hog market using data from 30 provinces spanning 2003 to 2020. Additionally, we examine the impact of industrial scale on market risk under different disease intensities and environmental regulations. The significance of this study lies in refining hog market risk metrics, comprehensively discussing the interaction between industrial scale and hog market risk, and providing theoretical references and empirical evidence for the field. Furthermore, we analyze epidemic risks and environmental regulation intensity while testing the threshold effect of industrial scale on market risk, thereby offering insights for optimizing industrial policy.
The remaining sections of the study are structured as follows: the second section provides a comprehensive literature review and theoretical analysis. The third section outlines the research methodology, data sources, and definition of variables. The third section is followed by discussion on the results. Finally, the concluding section presents key findings and their implications.
2 Literature review
There are abundant researches on the factors affecting market price risk. Existing studies focus the external risk shocks such as livestock and poultry epidemics (Ma et al., 2023), health events (Zhu et al., 2020), and policy risk (Wang Y. J. et al., 2022) on the fluctuation of hog price. Relevant research also based on industry chain (Kuiper and Lansink, 2013), agricultural product market development (Nugroho, 2021a,b). In addition, international relations can also affect the fluctuation of agricultural prices. For example, the economy’s openness in the form of trade liberalization. Creates increased price volatility and a decline in farmers’ welfare in the short term (Jankelova et al., 2017). In the complex market environment, it is difficult for farmers to judge market information in a timely manner, because there are many farmers with low education levels (Dayat et al., 2020). This also means that farmers’ decisions may not be rational, and this is one of the important reasons for the random fluctuations of market prices (Gouel, 2012). Therefore, policy interventions play an important role in agricultural production and markets in developing countries.
There are few literatures on the scale and the market price of hogs. The process of pig scale-up and price fluctuations in developed and developing countries have been compared in some studies, which indicate that large-scale pig farming stabilizes pig production and prices (Hu and Wang, 2013). Shen and Qiao (2019) obtained a similar view by comparing behavioral differences of hog farmers under price fluctuation, and fragmentation and small-scale farming are the key factors behind the large fluctuations in China’s hog prices (Weng, 2013). Expanding farmers’ farming scale can alleviate yield fluctuations (Yang and Wang, 2022), and the accompanying capitalization of farming has a significant stabilizing effect on China’s hog price fluctuations (Wang et al., 2018). However, large-scale farms may react excessively to an African swine fever outbreak by reducing inventories sharply in the short term, which could increase the risk of unpredictable fluctuations in hog market prices (Wang M. L. et al., 2022). From a risk pre-control perspective, Zhu and Zhao (2014) explained why medium-scale hog farming contributes to stable production.
Previous studies have explored the relationship between industry scale and price fluctuations from multiple perspectives, however, there are still some aspects that need further discussion. Firstly, these studies are inadequate in defining price risk, as they usually only focus on price fluctuations, while ignoring changes in profit levels. In fact, relative prices are also a key risk factor in the hog market, directly guiding farmers’ production behaviors. Secondly, these studies have ignored the impact of industry scale on prices during shocks such as epidemics and environmental policy preferences. In recent years, the risk of major epidemics such as African swine fever has increased significantly, while environmental policies are also changing. This situation leads to producers facing unprecedented uncertainty and market risks (Guo, 2017). In actual production, industry scale, disease risk, and environmental policies are inseparable factors. Therefore, the results of previous studies on the impact of industry scale on hog price risk may have some deviations.
3 Theoretical analysis
Market uncertainty refers to the uncertain factors in the market environment of the industry in which the enterprise is located, such as the degree of industry competition, the change of industry demand, etc. (Liu and Liu, 2010). Promoting the proportion of large-scale breeding subjects through policies may affect the level of uncertainty in the hog market. The asset lock-in effect and supply chain stability effect brought by scale production are conducive to reducing market uncertainty. However, the increase of market concentration makes the bargaining power in the hands of a few people and increases market uncertainty. In addition, the change of supply quantity brought by the change of supply structure also increases market uncertainty.
3.1 Increasing the proportion of industrial scale operation and market price risk
Industrial scale reduction of market price fluctuations in hog through multiple means. Firstly, the asset lock-in effect increases the opportunity cost of adjusting production modes for enterprises (Foster and Rosenzweig, 2022). Large-scale investments may result in excessive reliance on specific technologies or production equipment, making it more inclined toward maintaining a stable production mode (Richter, 2013). Secondly, large-scale breeding enterprises can reduce price fluctuations by establishing stable supply chains (Long et al., 2019). By enhancing the flexibility of the supply chain, enterprises can better adapt to market demand fluctuations and slow down the transmission of price changes. Thirdly, cooperative breeding between enterprises and farmers enhances industrial supply stability (Wang et al., 2014). Contract farming achieves relatively stable production by signing long-term supply agreements with farmers. This contractual relationship helps stabilize both production and supply while reducing the impact of market fluctuations. However, industrial scale may negatively impact hog market prices. On one hand, economies of scale enable large-scale farming enterprises to compete through price competition by reducing production costs as output increases (Holmes, 2011). This allows them to sell at lower prices and maintain market share (Wu et al., 2014). Smaller farmers may also be compelled to lower their prices in order to stay competitive. On the other hand, increased market supply due to the expansion of farming scale leads to a surplus of hogs, putting downward pressure on prices (De Roest et al., 2018).
3.2 Threshold effect for epidemic risk and environmental regulation risk
Risk factors may reinforce uncertainty for producers, such as epidemic risk and the direction of environmental regulation. Pig epidemic and environmental regulations are crucial factors impacting pig production, potentially altering the influence of industrial scale on market price risk. The occurrence of pig diseases not only increases pig mortality and culling (Li and Che, 2013), but also leads to economic losses for pig farmers (Li and Wang, 2019). Significant disease outbreaks can change farmers’ production decisions (Zhang and Fan, 2012), thereby affecting both pig supply and prices. Environmental regulations have the potential to modify production costs and investment structures, while economic pressures and production constraints faced by farms may disrupt the stability of pig supply and prices. On one hand, stringent environmental regulations compel farms to adopt more rigorous environmental management measures, requiring increased resource allocation and capital investment; consequently, high environmental costs may drive farmers to reduce their pig supply (Wu et al., 2015). On the other hand, strict environmental regulations also stimulate technological innovation within the pig industry as a means of meeting these requirements (Li et al., 2011). Although short-term technical innovation investments may initially weaken farmers’ expansion capabilities, in the long run they have the potential to enhance farm productivity efficiency which ultimately influences both stable levels of pig supply as well as market prices.
Based on the above analysis, this paper proposes the following three hypotheses:
Hypothesis 1: The increase in the proportion of large-scale breeding entities reduces the random fluctuation of prices, but may also reduce the relative price of hogs.
Hypothesis 2: Higher intensity of environmental regulation and disease risk weaken the impact of industry scale on hog market price.
4 Data sources, model construction, and PVAR model checking
4.1 Data sources and description
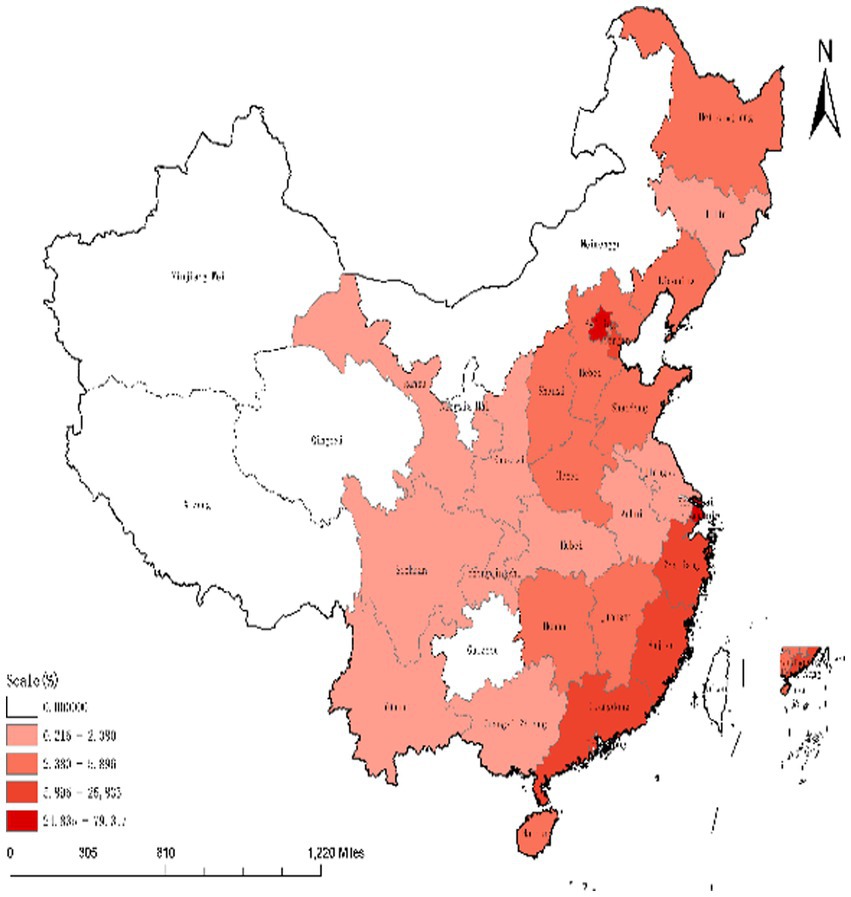
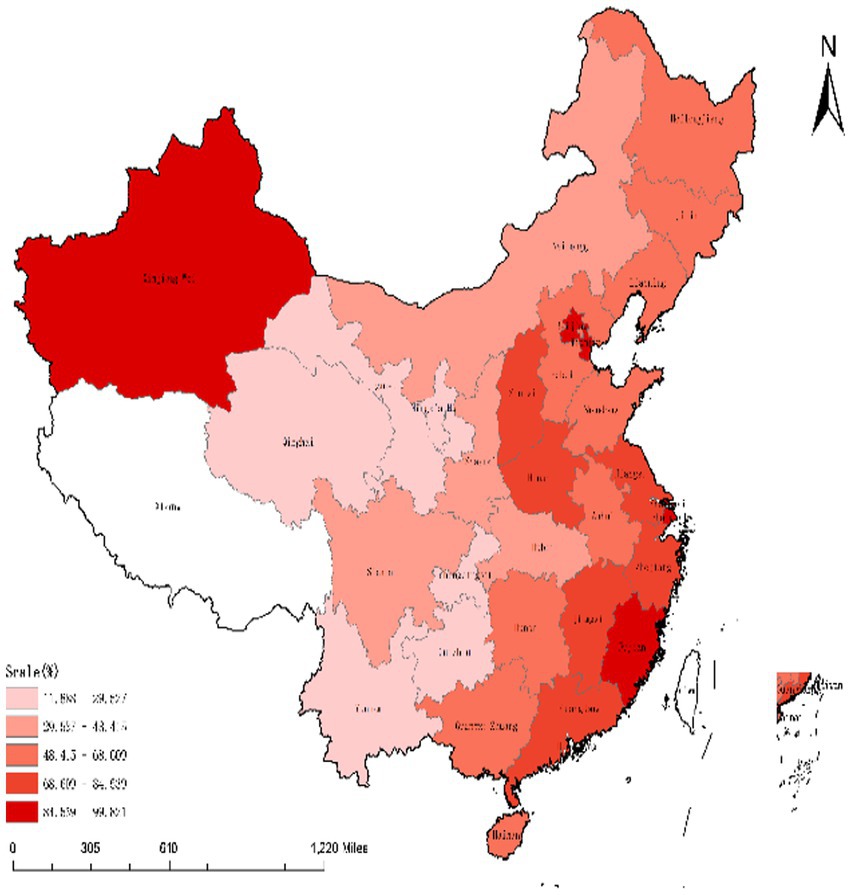
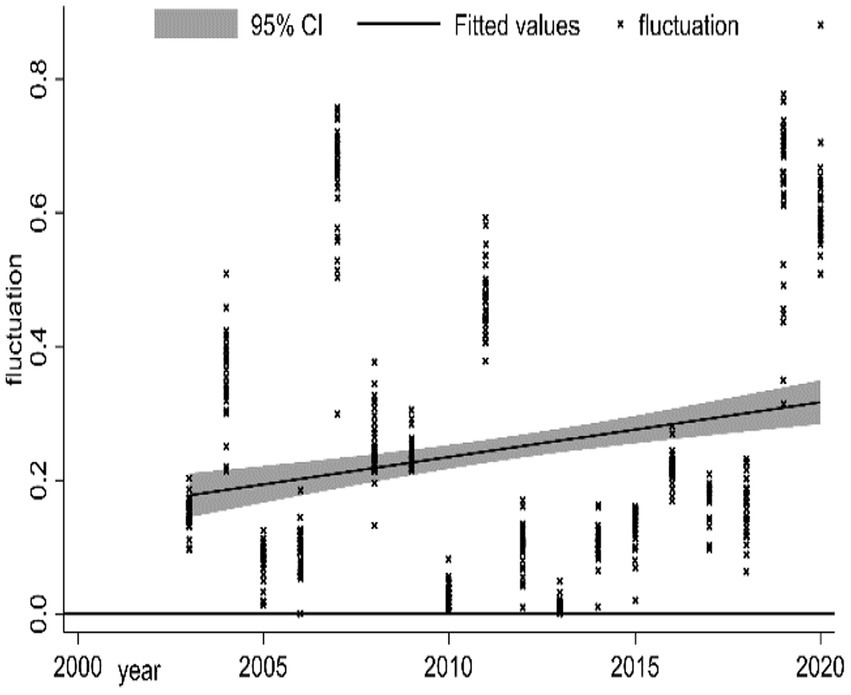
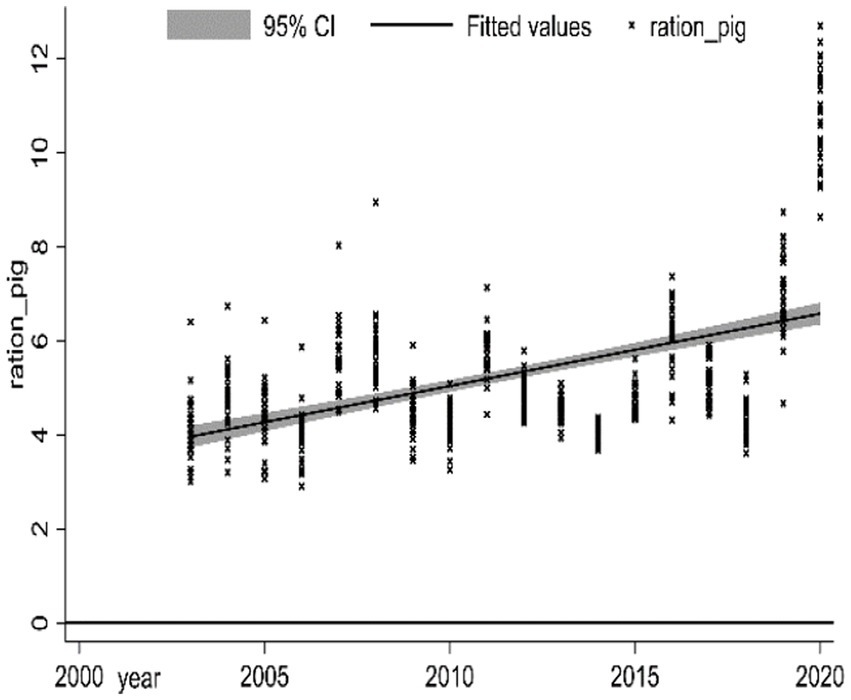
This paper uses 30 provinces5 in China spanning from 2003 to 2020. Data on hog prices and industrial scale are from the “China Animal Husbandry and Veterinary Statistics Yearbook”; Data on hog epidemics are from the “Veterinary Bulletin of the Ministry of Agriculture,” and data on other variables are from the National Bureau of Statistics and the “China Statistical Yearbook.” Among them, variables involving RMB-denominated variables are deflated with the 2003 consumer index. Figures 1, 2 show the industrial scale in each province, with a remarkable increase in the industrial scale of farming in 2020 compared to 2003. Meanwhile, the stochastic fluctuation of hog prices (Figure 3) and the relative price of hogs (Figure 4) oscillated upward, and the upward trend was particularly obvious after 2018. Although the scale of China’s hog industry has been increasing since 2003, the stochastic fluctuation of hog prices has not significantly decreased, and the relative price of hogs has continued to decline.
4.2 Model construction
4.2.1 PVAR model construction
The panel vector autoregressive (PVAR) model was first proposed by Holtz, following the advantages of the vector autoregressive (VAR) model proposed by Sims. The PVAR model examines the interaction among endogenous variables in panel data, studying the vector autoregression model that treats all variables as endogenous and analyzes their relationship with lag terms. Compared to the long time-series requirement of traditional VAR model, PVAR models are characterized by large-cross sections and short time series. Given that the PVAR model can capture the economic differences, it portrays the temporal performance of the samples, thereby forming policy insights. To verify the hypotheses proposed by the theoretical analysis, the PVAR model of the interaction between industrial scale and market price risk is constructed as follows.
In Equation (1), is a two-dimensional column vector, , denotes the provincial area, denotes the year; is the matrix coefficient to be estimated, and stands the order lag term (j = 1, 2,…, m); portrays the degree of industrial scale, and indicates market risk, which encompasses random fluctuations in hog prices and the relative price of hogs. In addition, is the constant term, denotes the regional fixed effect; reflect the specific time effect in each period; and is the time perturbation term.
4.2.2 Expanded model construction
The threshold effect means when a variable reaches a specific value, it leads to a significant change in the role of another variable, and the critical value of the parameter as the cause of this phenomenon is called the threshold value. Considering that the intensity of hog epidemics and environmental regulation may change the impact of industrial scale and market price risk, this paper constructs the following panel threshold regression model:
In Equations (2, 3), denotes the dependent variable, is the independent variable, and are threshold variables, is the threshold value, indicates a series of control variables, and the meanings of other variables are the same as in Equation (1).
4.3 Variables selection
4.3.1 Explained variables
According to the “Six Departments Issued the Preliminary Plan for Preventing Excessive Decline in Hog Prices,”6 the random fluctuation in hog prices and the relative price of hogs were selected to measure the market price risk. (1) The relative random fluctuation in hog prices. First, use the exponential smoothing method to fit the long-term trend of prices, and calculate the real risk of hog market prices, that is, the value of random fluctuation as follows: , where is the actual price, is the trending price, denotes the price of random fluctuation value. Although the value of random price fluctuation can truly reflect the market risk, its comparability is poor due to the problem of “unit of measurement.” In comparison, the absolute value of relative random fluctuation can indicate the market price risk of hogs. At the same time, it is not affected by time and space, so it is more scientific to estimate hogs’ market price (Yi et al., 2012). The specific measurement is as follows: . (2) The relative price of hogs. , where is the market price of hogs and is the feed price for the same period. The higher the indicator means the larger profitability of the hog market, and vice versa, the smaller it is.
4.3.2 Explanatory variable
4.3.2.1 Industrial scale
According to the “National Hog Production Development Plan (2016–2020),” the proportion of farms with more than 500 head of hogs is used to measure the industrial scale. Since the “China Animal Husbandry and Veterinary Medicine Statistical Yearbook” only published the number of farmers of different farming scales after 2010, but not the output of different farming scales.7 In this regard, most studies used the ratio of the number of large-scale farmers to the total number to express industrial scale. However, this ratio cannot accurately reflect the degree of industrial scale, so we use the median value of each group’s output number as the weight, weight each group of farmers, and finally calculates the scale farming ratio:
In Equation 4, indicates the scale of the industry, Represents the number of Group scale farms, Represents the group median value of the number of columns in group .
4.3.3 Threshold variables
4.3.3.1 Environmental regulation
Because of no direct data on environmental regulation in the official statistical database, this paper draws on the research method of Zeng et al. (2021), using the adjustment coefficient to improve regional economic development to measure environmental regulation. The formula is as follows:
In Equation (5), is the gross domestic product of region in year, stands the area of region in year , and means the circumference.
4.3.3.2 Epidemic risk
The epidemic disease index can reflect the intensity of disease outbreaks and mainly involves eight common types of pig diseases, including foot-and-mouth disease, African swine fever, swine vesicular disease, swine fever, porcine reproductive and respiratory syndrome, porcine cysticercosis, porcine pneumonic disease, and porcine dengue. According to Wang et al. (2019), the formula is as follows:
In Equation (6), is the number of pigs killed by the epidemic in region in year, stands the number of pigs culled due to the epidemic of region in year , and is the total number of pigs slaughtered in the area that year.
4.3.4 Control variables
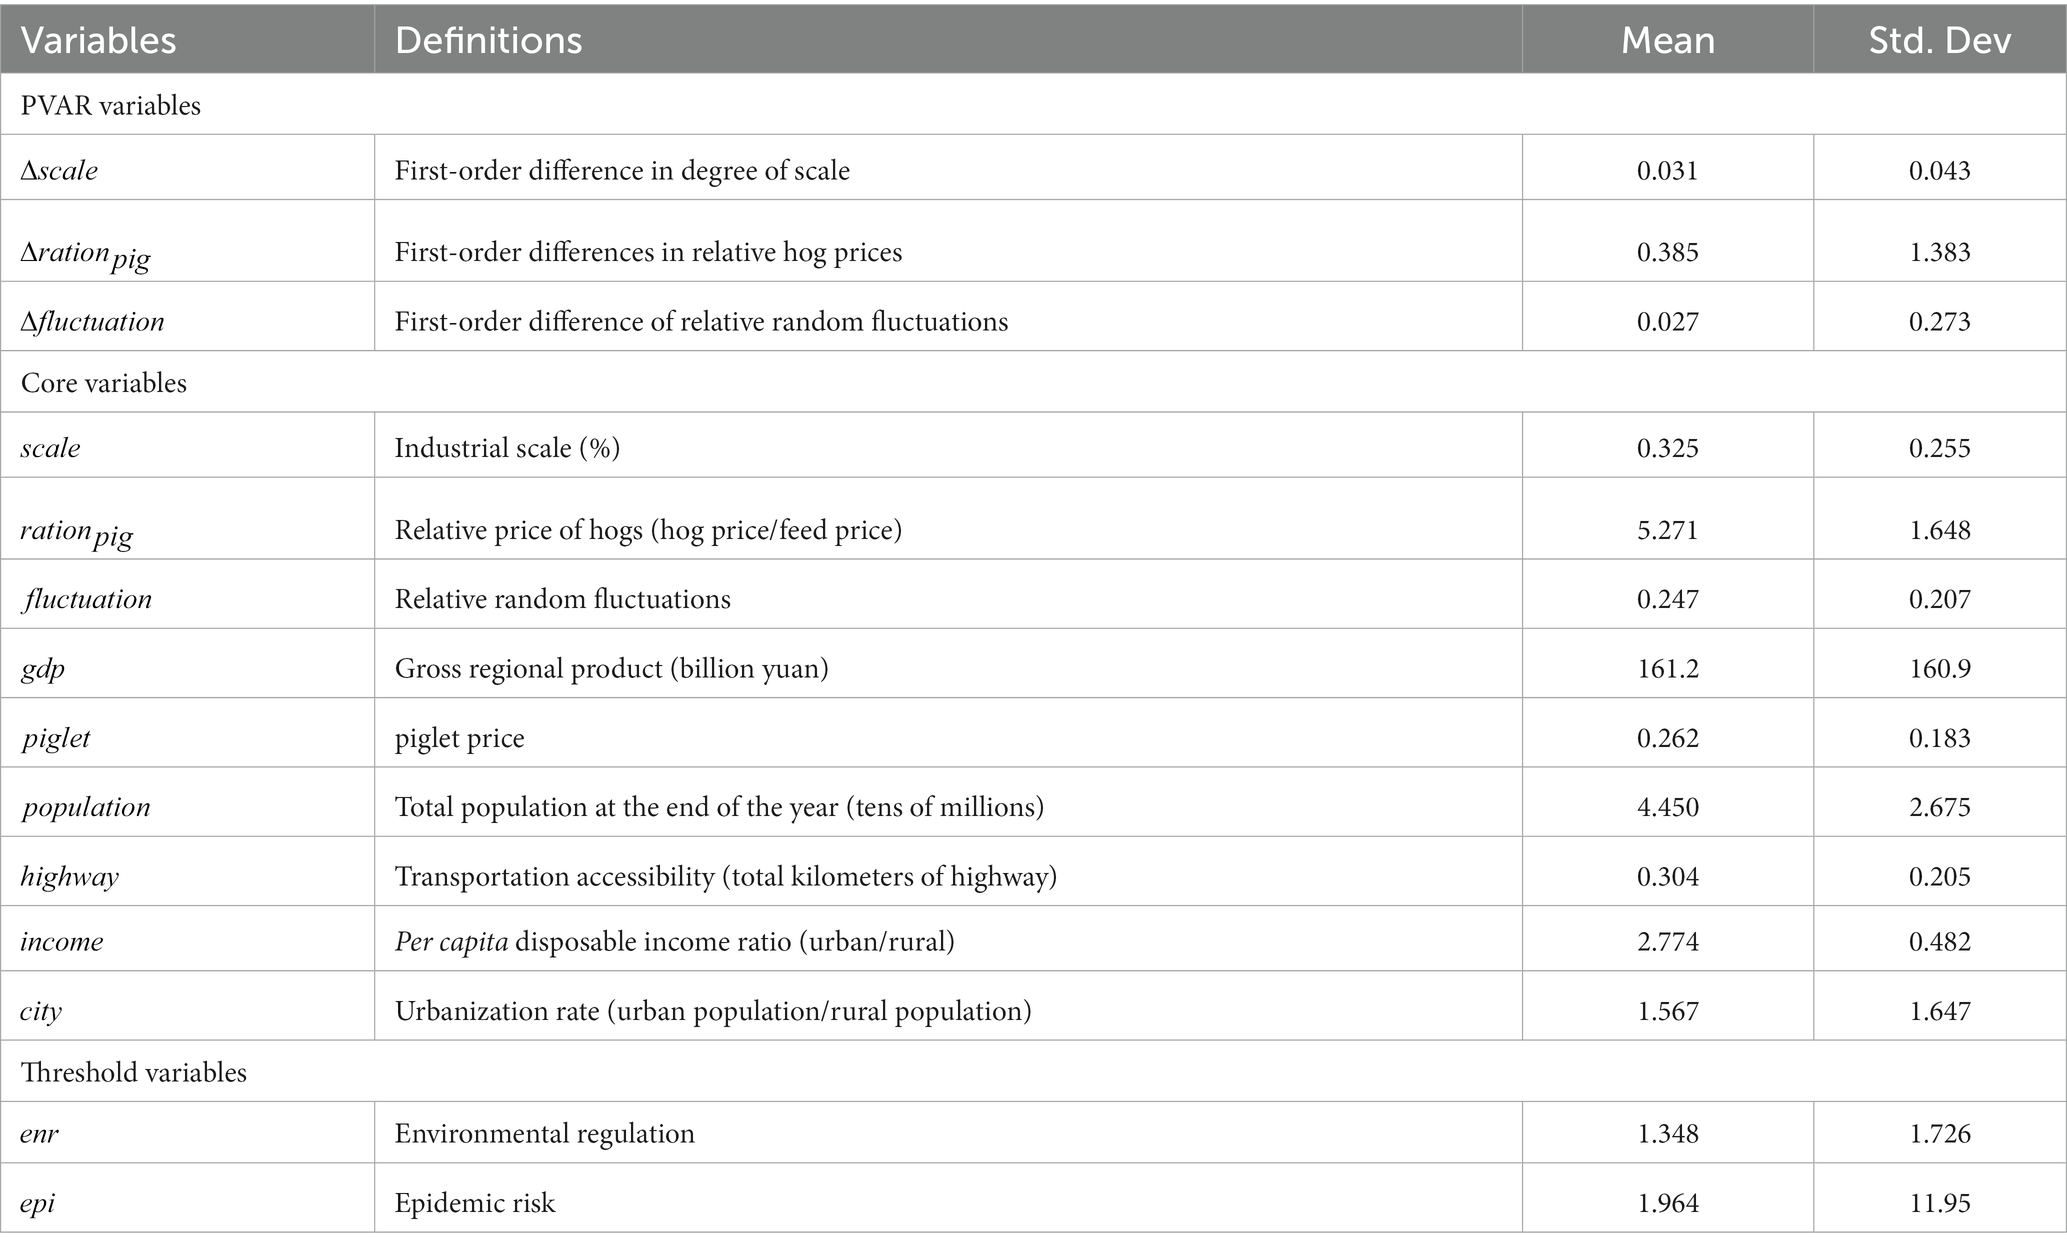
Drawing on previous studies, piglet price, total regional population, per capita disposable income ratio (urban/rural), transportation accessibility and urbanization rate were chosen as control variables in this study. The control variables are displayed in Table 1 because they are easy to calculate. Table 1 shows the descriptive statistics for each variable.
4.4 PVAR model test
4.4.1 The unit root test
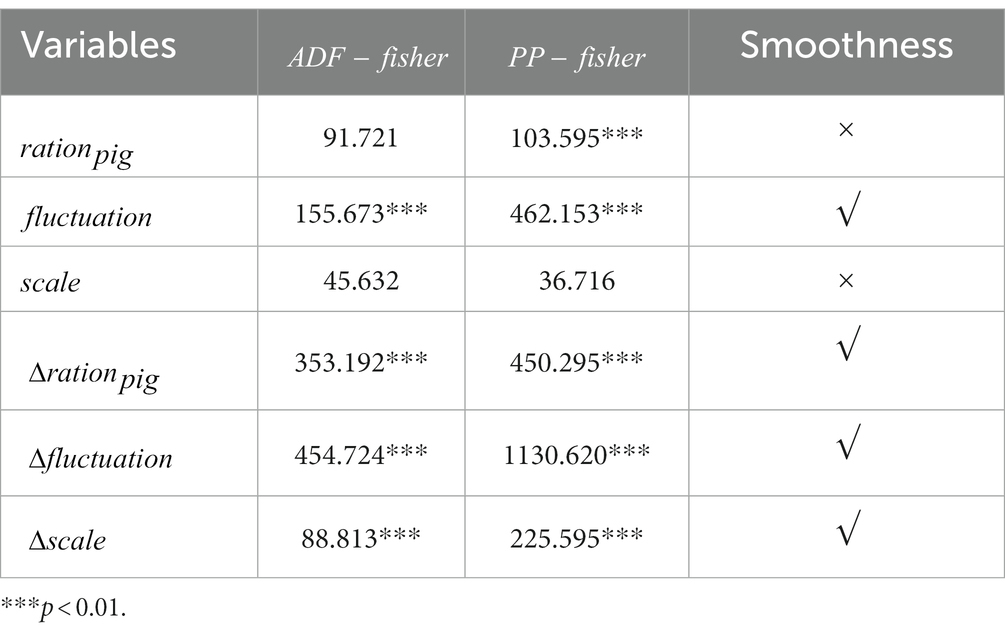
When the panel data are not stable, it will lead to pseudo-regression and undermine the impulse response. So, this paper used and , to conduct smoothness tests, and the results are shown in Table 2. The variables , , and test results indicate that the original hypothesis cannot be rejected at 1% significantly, so they are considered a non-stationary series. The above three variables are subjected to first-order differencing and tested for stability, and it can be noted that all of them significantly passed the unit root tests, which satisfies the conditions for establishing the model with first-order differencing.
4.4.2 Optimal lag order test
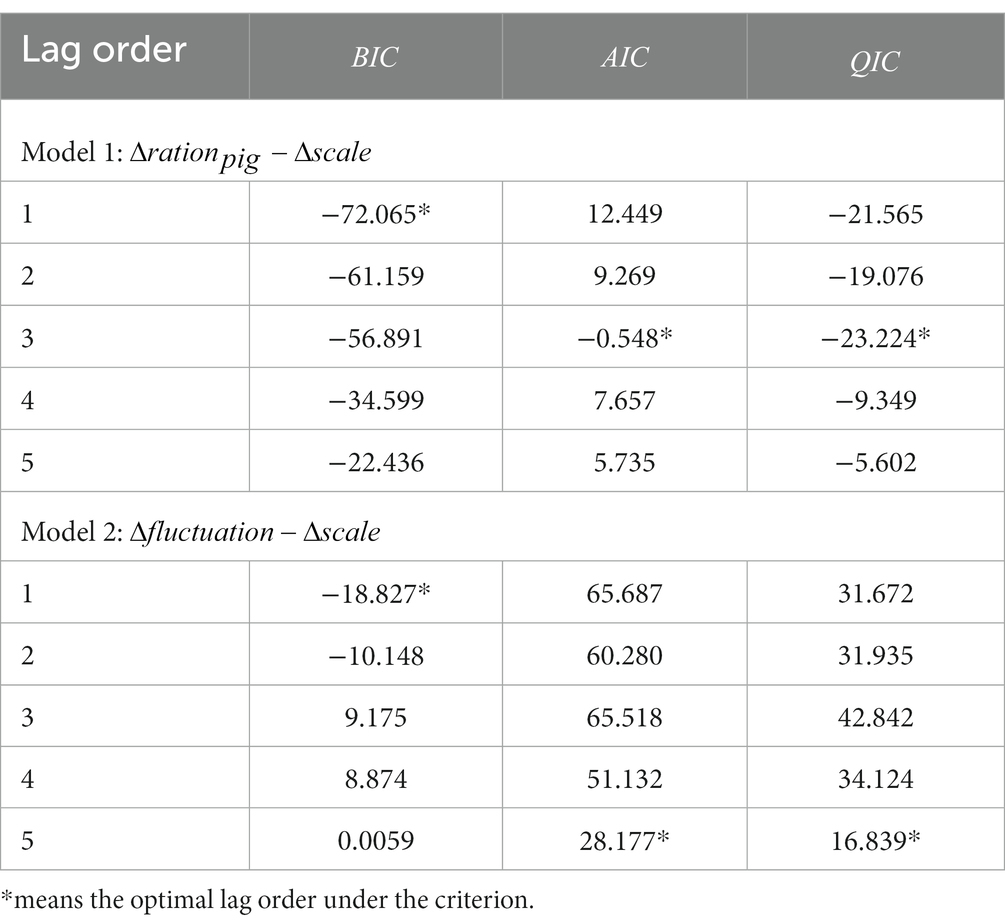
We used the method provided by Abrigo and Love (2016) to determine the optimal lag order of the model, and the results are given in Table 3. For Model 1, the criterion suggests choosing a lagged first-order PVAR model, but and prefer lagged third-order. For Model 2, the criterion suggests a lagged first-order PVAR model, but and favor lagged fifth-order. Considering the limited sample, a higher lag order may lead to low degrees of freedom and model overfitting. Therefore, this study combines the three criteria and selects the second-order PVAR model for analysis.
4.4.3 Cointegration test
The Westerlund and Pedroni methods are used to test the cointegration relationship. Table 4 presents the test results, indicating a long-term cointegration relationship between market risk indicators and industrial scale, which can be analyzed using a PVAR model. Therefore, we can establish a PVAR model for impulse response analysis.
5 Results and discussion
5.1 Estimation of the PVAR model
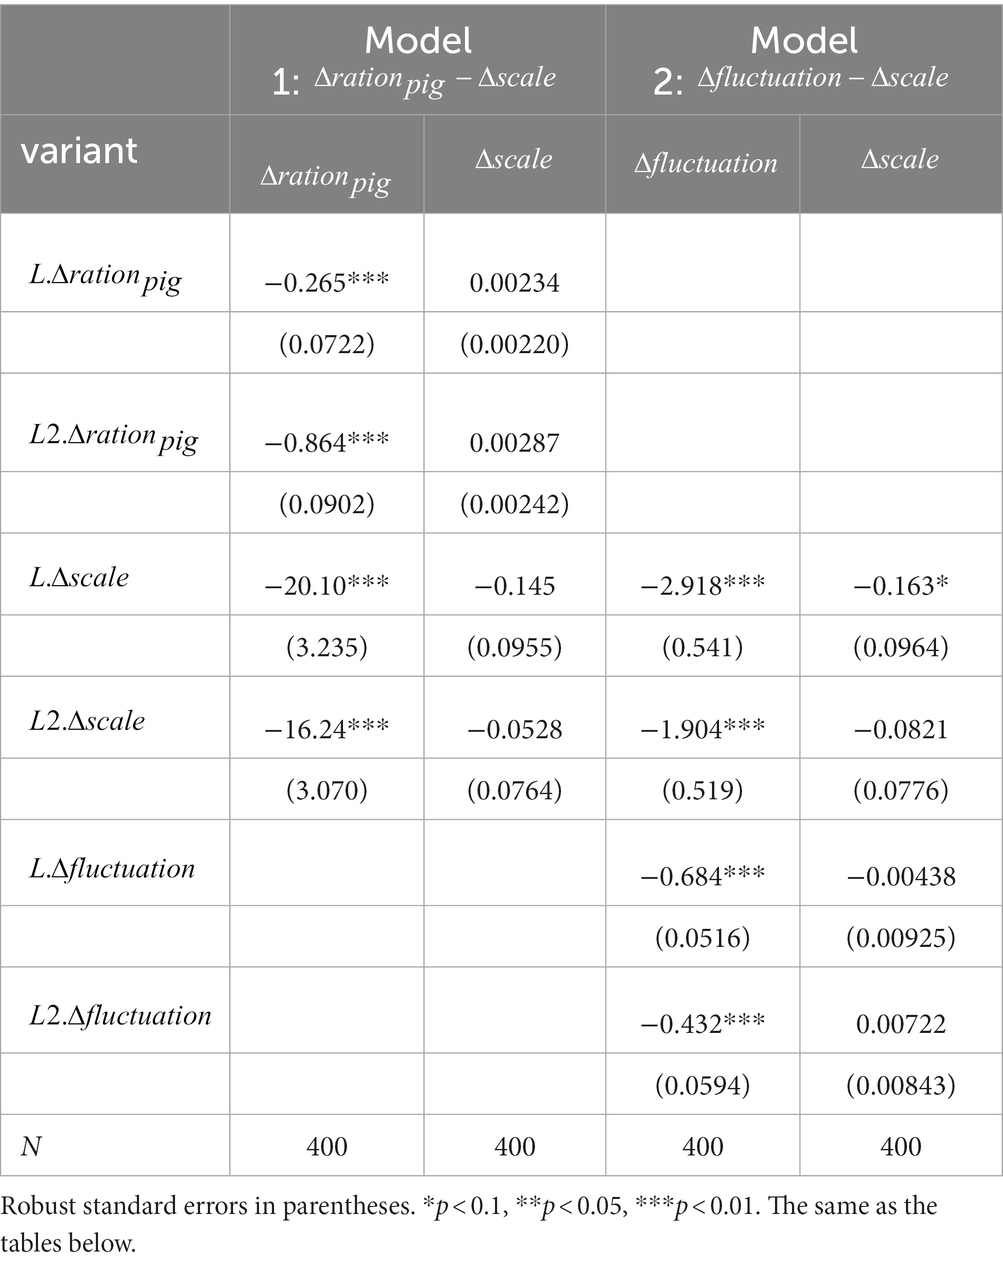
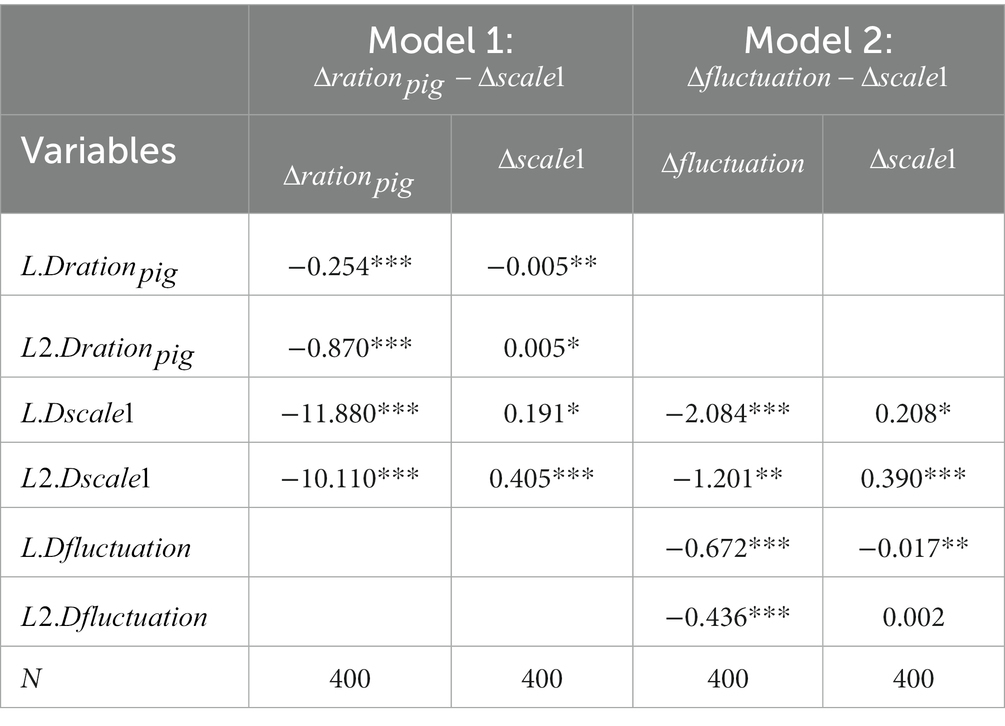
It can be observed from Table 5 that increasing the proportion of large-scale farms in the pig industry reduces price fluctuations and also lowers hog prices. On one hand, scaling up the industry acts as a price stabilizer, supporting Yang et al.’s research findings. This could be attributed to increased fixed asset investment resulting in higher adjustment costs for large-scale farms, making them less likely to change breeding decisions (Yang and Wang, 2022). The improved supply stability reduces price fluctuations caused by supply changes. On the other hand, industrial scale also decreases the relative price of hogs compared to major feed prices. A higher ratio indicates better profitability for hog breeding while a lower ratio may harm farmers’ welfare and increase their vulnerability. To improve this ratio, relevant policies have been introduced by the Chinese government such as “the Work Plan to Improve Government Pork Reserve Adjustment Mechanism and Guarantee Supply and Price of Pork Market.”8 The decline in relative hog prices may result from changes in main suppliers’ characteristics where scale operations reduce overall average costs and enhance industry supply efficiency (Asche et al., 2018). Improved supply efficiency allows China’s pig industry to achieve higher production levels based on existing capacity while recent years have seen a decrease in China’s pork consumption elasticity (Zhang et al., 2018), leading to oversupply issues causing stable low prices.
This also confirms our Hypothesis 1, which suggests that increasing industrial scale breeding may stabilize price fluctuations but could negatively impact overall price levels. Small farmers, who are often limited by education and business capacity (Gneiting and Sonenshine, 2018), may find it challenging to navigate the market. While reduced price fluctuations might alleviate the need for constant production adjustments, a decline in prices could discourage their enthusiasm for agricultural production (Vongvisouk and Dwyer, 2016). However, China has over 200 million small farmers. For instance, in hog breeding alone, there will still be approximately 19.923 million farmers with less than 500 heads of livestock by 2023.9 As a higher-paying sector within agriculture, the breeding industry attracts many farmers involved in animal husbandry. A decrease in profit margins may further drive these farmers away from agriculture and toward non-agricultural sectors, leading to an imbalance between professional labor and industries that hinders agricultural development.
5.2 Impulse response function analysis
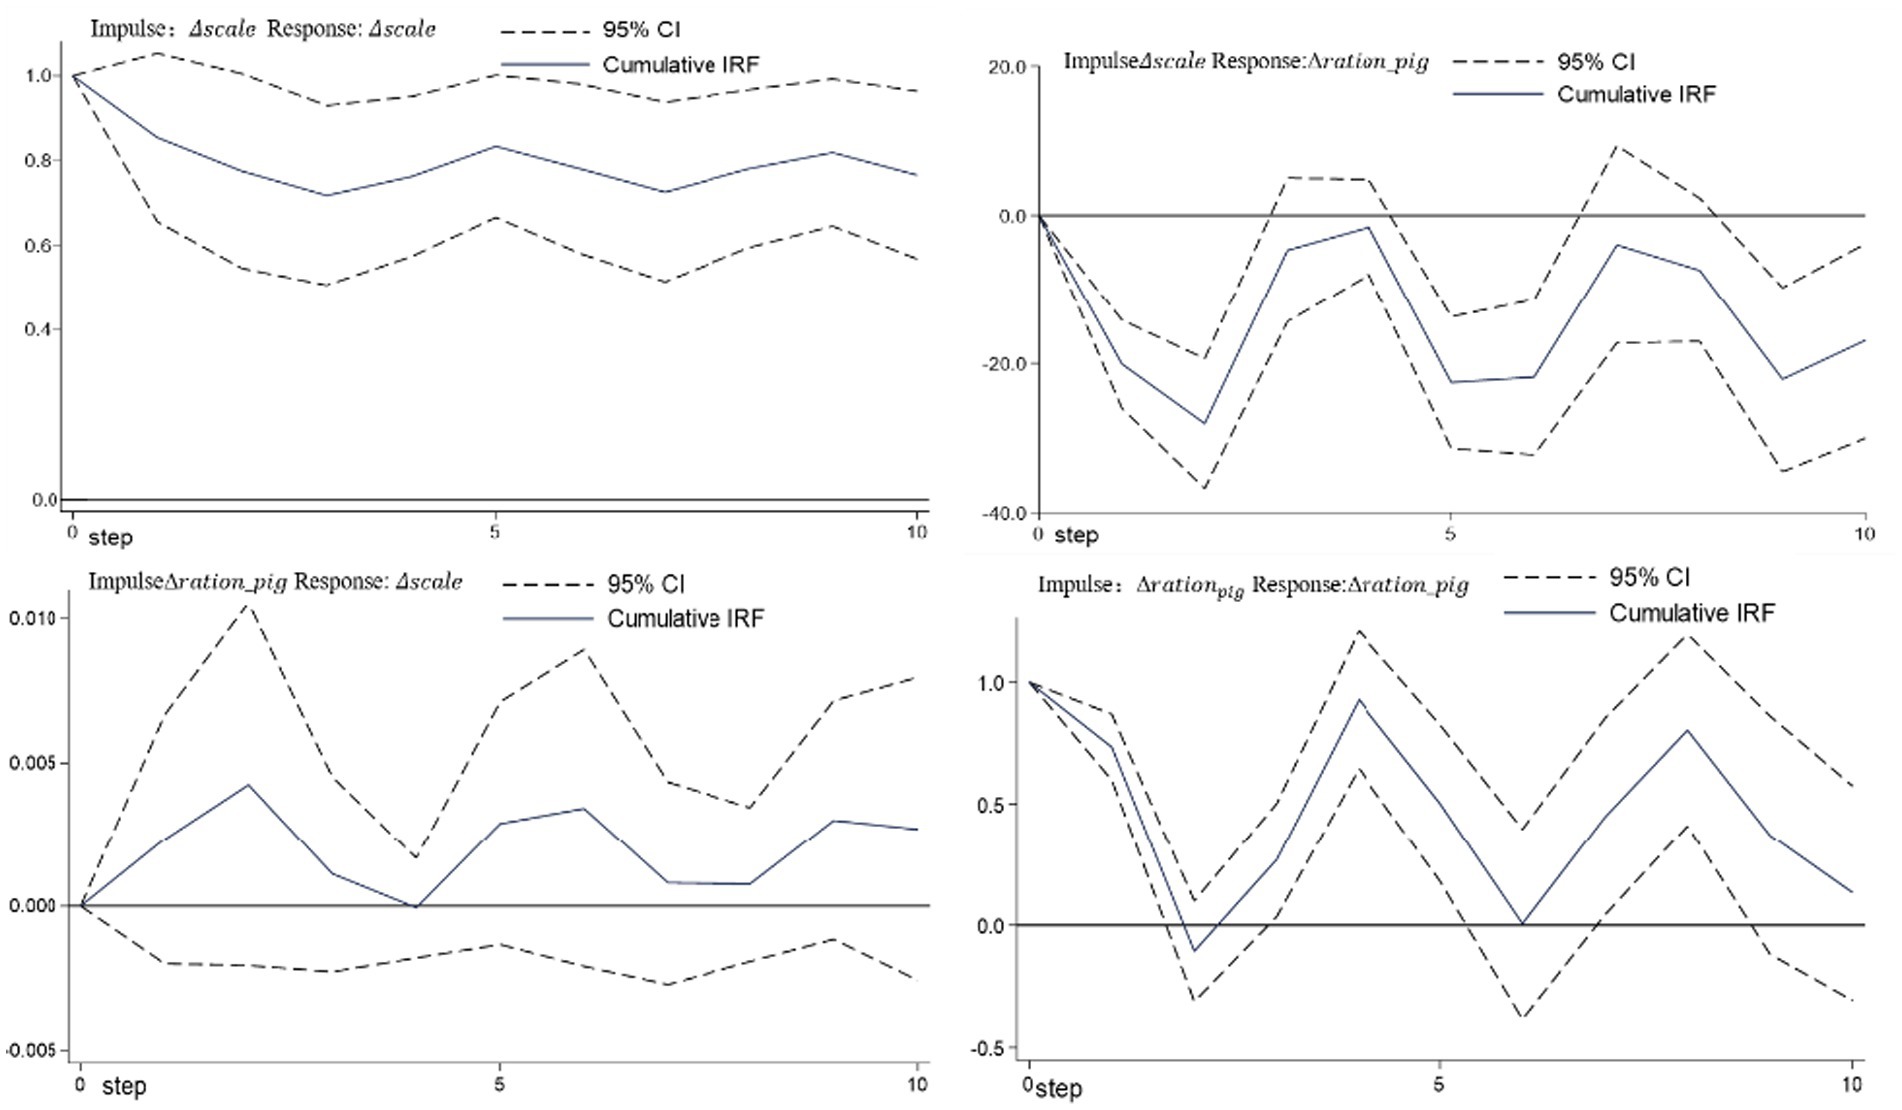
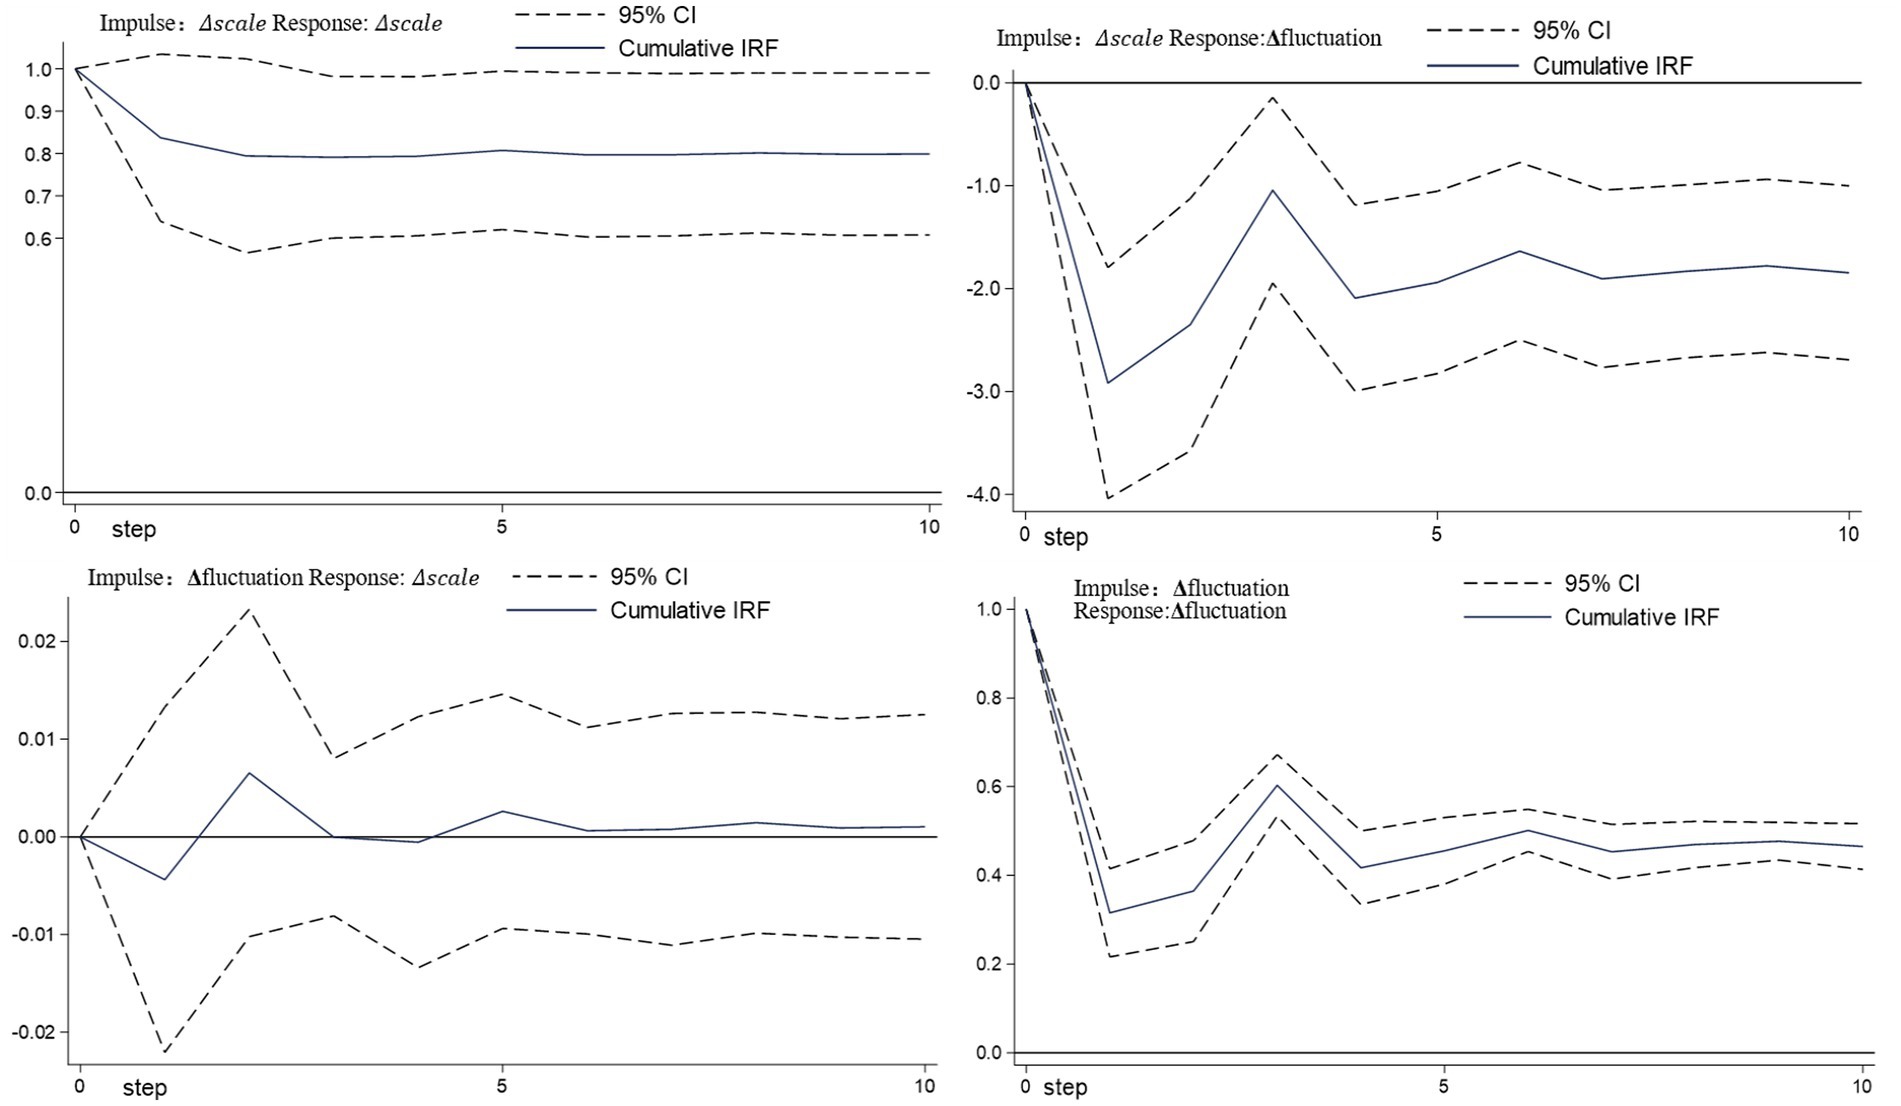
The orthogonal cumulative impulse response function for the panel data analysis of industrial scale and relative price (Model 1) and industrial scale and price random fluctuation (Model 2) is shown in Figures 5, 6. In upper right corner of Figure 5, Δration_pig always shows a negative change with Δscale, indicating that expanding the industrial scale reduces the ratio of hog price to feed price, leading to a decline in profit level. Similarly, in upper right corner of Figure 6, a change in Δfluctuation due to a change in the standard deviation of Δscale can be observed. After being impacted by the standard deviation, it can be seen that the maximum negative value of Δfluctuation starts decaying, suggesting that an increase in scale reduces price random fluctuation and promotes stable operation of hog market prices. Therefore, these findings from the impulse response diagram align with those presented in Table 4, confirming that China’s hog industry scale can mitigate random fluctuations in hog prices and relative prices.
5.3 Robustness test
The hog supply in China is influenced by various factors such as economic development, resource availability, environmental capacity, and market demand. To manage this, the Chinese government has divided the country into hog output areas, main marketing areas, and production and marketing balance areas.10 In the “14th Five-Year Plan National Animal Husbandry and Veterinary Industry Development Plan” by the Ministry of Agriculture and Rural Affairs, it is emphasized that large enterprises should focus on breeding in main marketing areas to ensure self-sufficiency. In main production areas, efforts should be made to expand production capacity and upgrade the industry toward large-scale standardization. The balance of production and marketing areas should aim at increasing production potential while promoting operational scale for basic self-sufficiency.
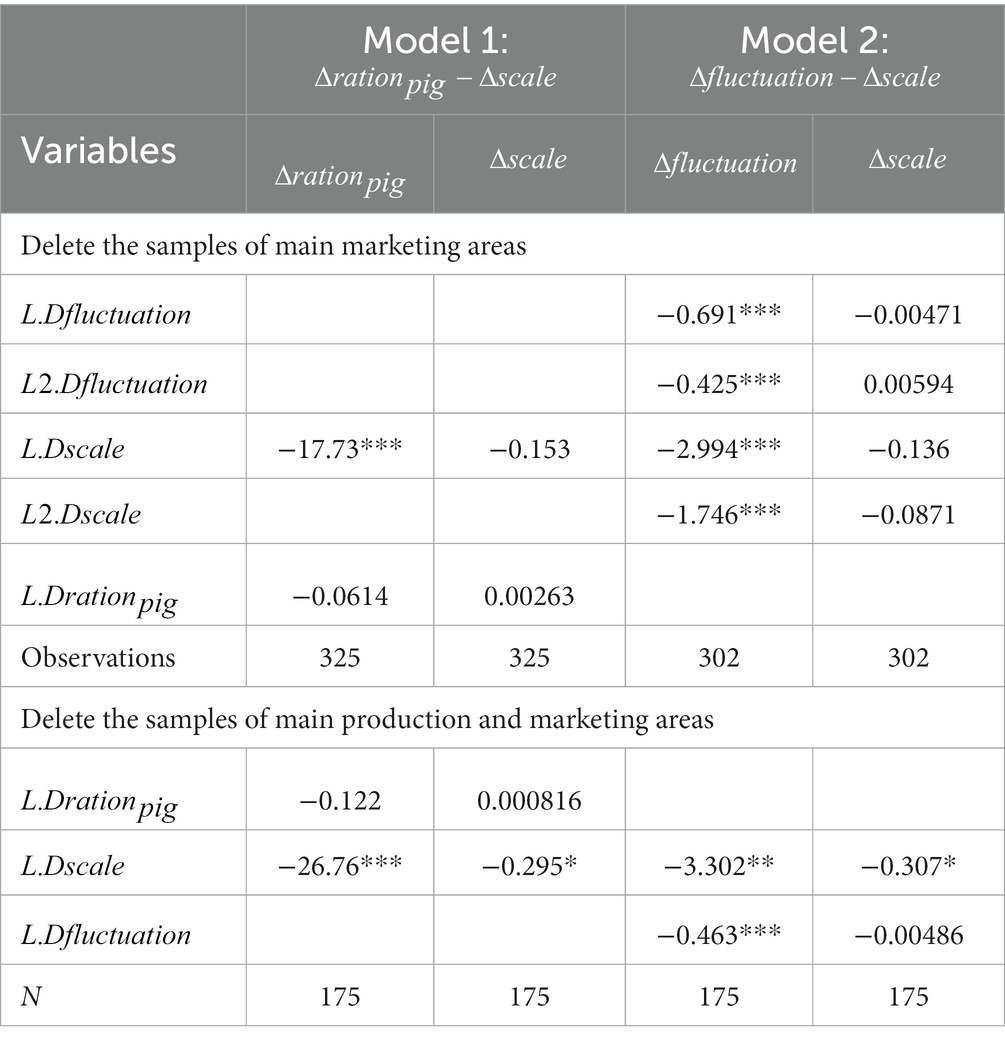
It can be inferred that economically developed regions (e.g., Guangdong, Zhejiang, and Beijing) are the main marketing areas for hogs. The relationship between industry scale and market price in these areas may be influenced by hog supply from other regions. To ensure robustness, the study excluded samples from the main marketing area first and then further eliminated samples from the main production area. As shown in Table 6, the coefficients of industrial scale on relative price and random fluctuations in the hog market remain significantly negative, confirming the consistency of previous findings.
5.4 Heterogeneity analysis
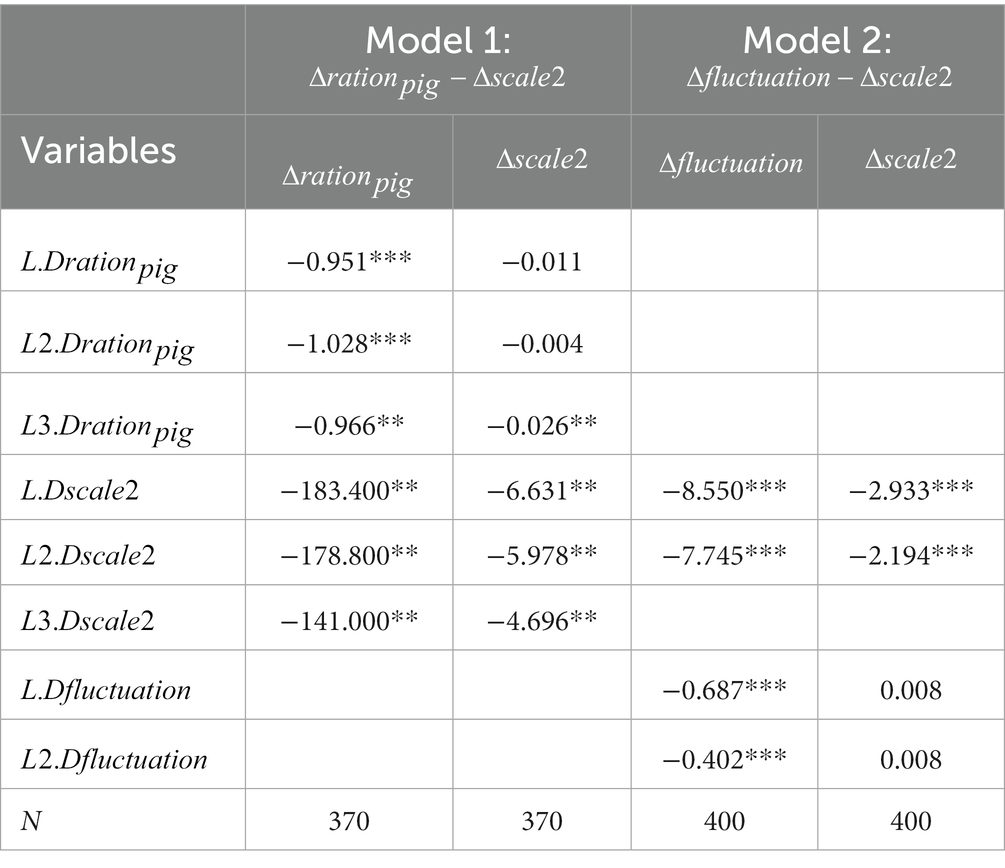
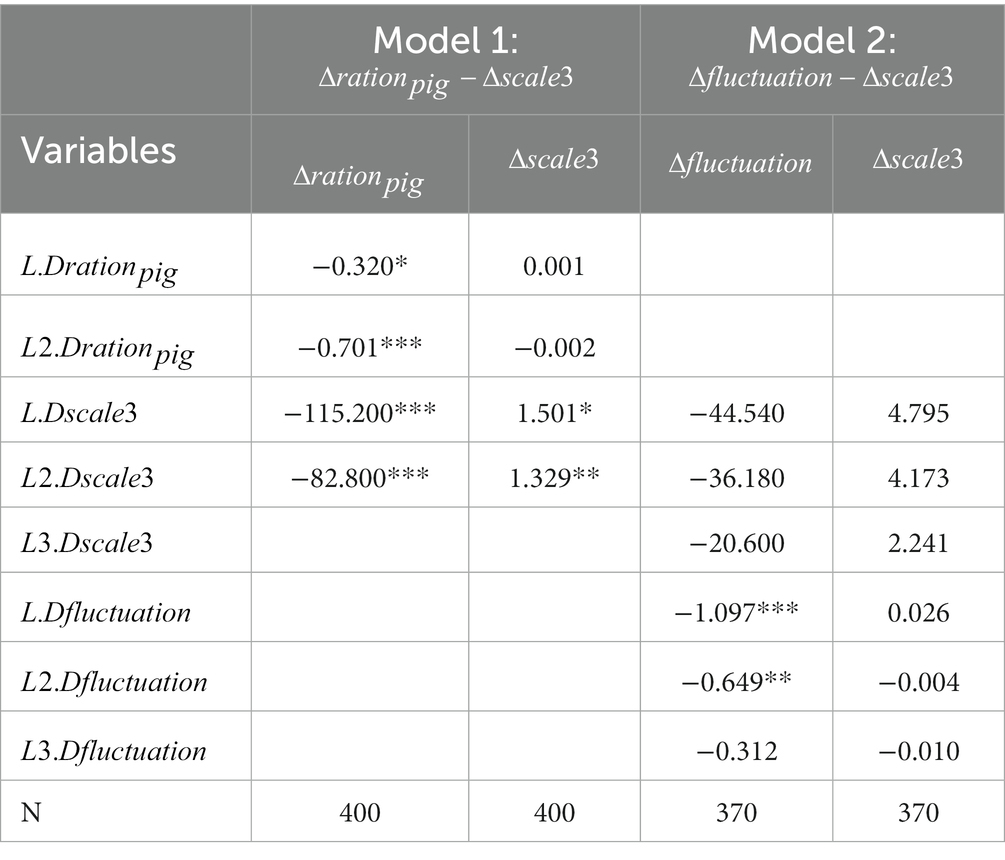
In order to investigate the impact of different operation scales on hog production fluctuation and relative price, this study categorizes operations into small-scale (annual litter size of 500–2,999 head), medium-scale (annual litter size of 3,000–9,999 head), and large-scale (annual litter size of 10,000 head or more). The results for each scale are presented in Tables 7–9, respectively. Firstly, significant differences exist in how different operation scales affect the relative price of the hog market. Medium-scale and large-scale operations have a more pronounced inhibitory effect on market prices compared to small-scale operations. This is due to their higher capital intensity and larger market share, which gives them a stronger influence over the hog market. Secondly, the impact of industrial scale on hog price fluctuations varies across scales. Medium-scale farms have the greatest stabilizing effect on prices, followed by small-scale farms. However, large-scale farms do not significantly contribute to price stabilization. The present finding is in line with previous relevant studies (Wang et al., 2018) and aligns with the observed “U-shaped” curve of technical efficiency in hog production (Yang and Wang, 2022). In brief, insufficient scale operations fail to harness economies of scale due to higher transaction costs, while excessive scale operations struggle to achieve optimal efficiencies owing to the elevated opportunity cost associated with altering production methods. These factors directly impact the stability of subsequent hog inventory and prices.
5.5 The threshold of epidemics and environmental
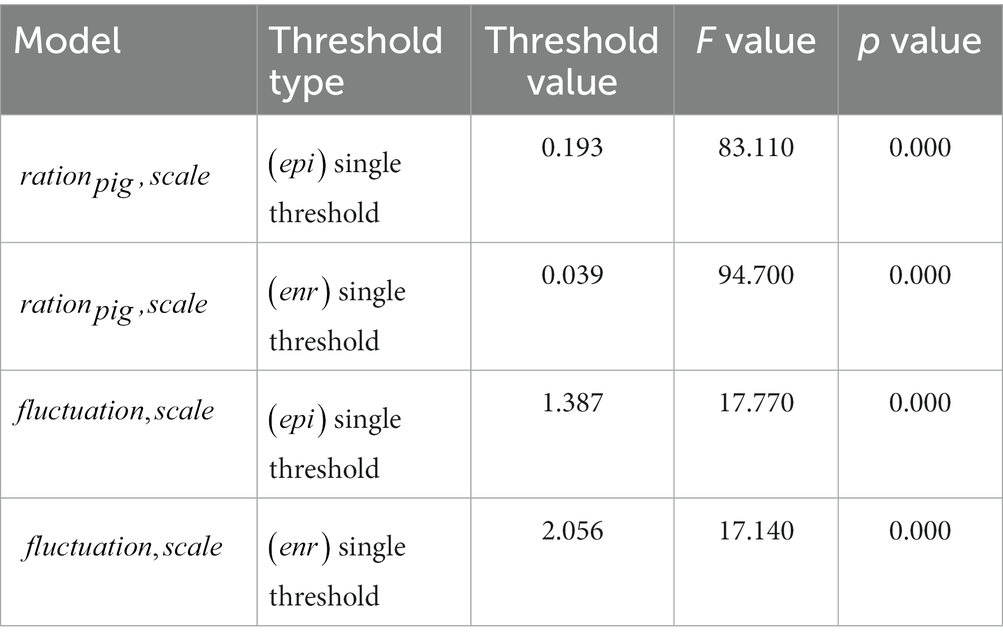
Hog epidemics and environmental regulations, as external factors affecting hog production, may impact the effect of industry scale on hog price fluctuations. The threshold effect analysis in this paper uses a single-threshold model. As shown in Table 10, in the model of industry scale and the relative price of the hog market, the epidemics and environmental regulation thresholds are 0.193 and 0.039, significantly at the 1% level. In the model of industry scaling and random price fluctuations in the hog market, the epidemic and environmental regulation thresholds are 1.387 and 2.056, respectively, and pass the significance test.
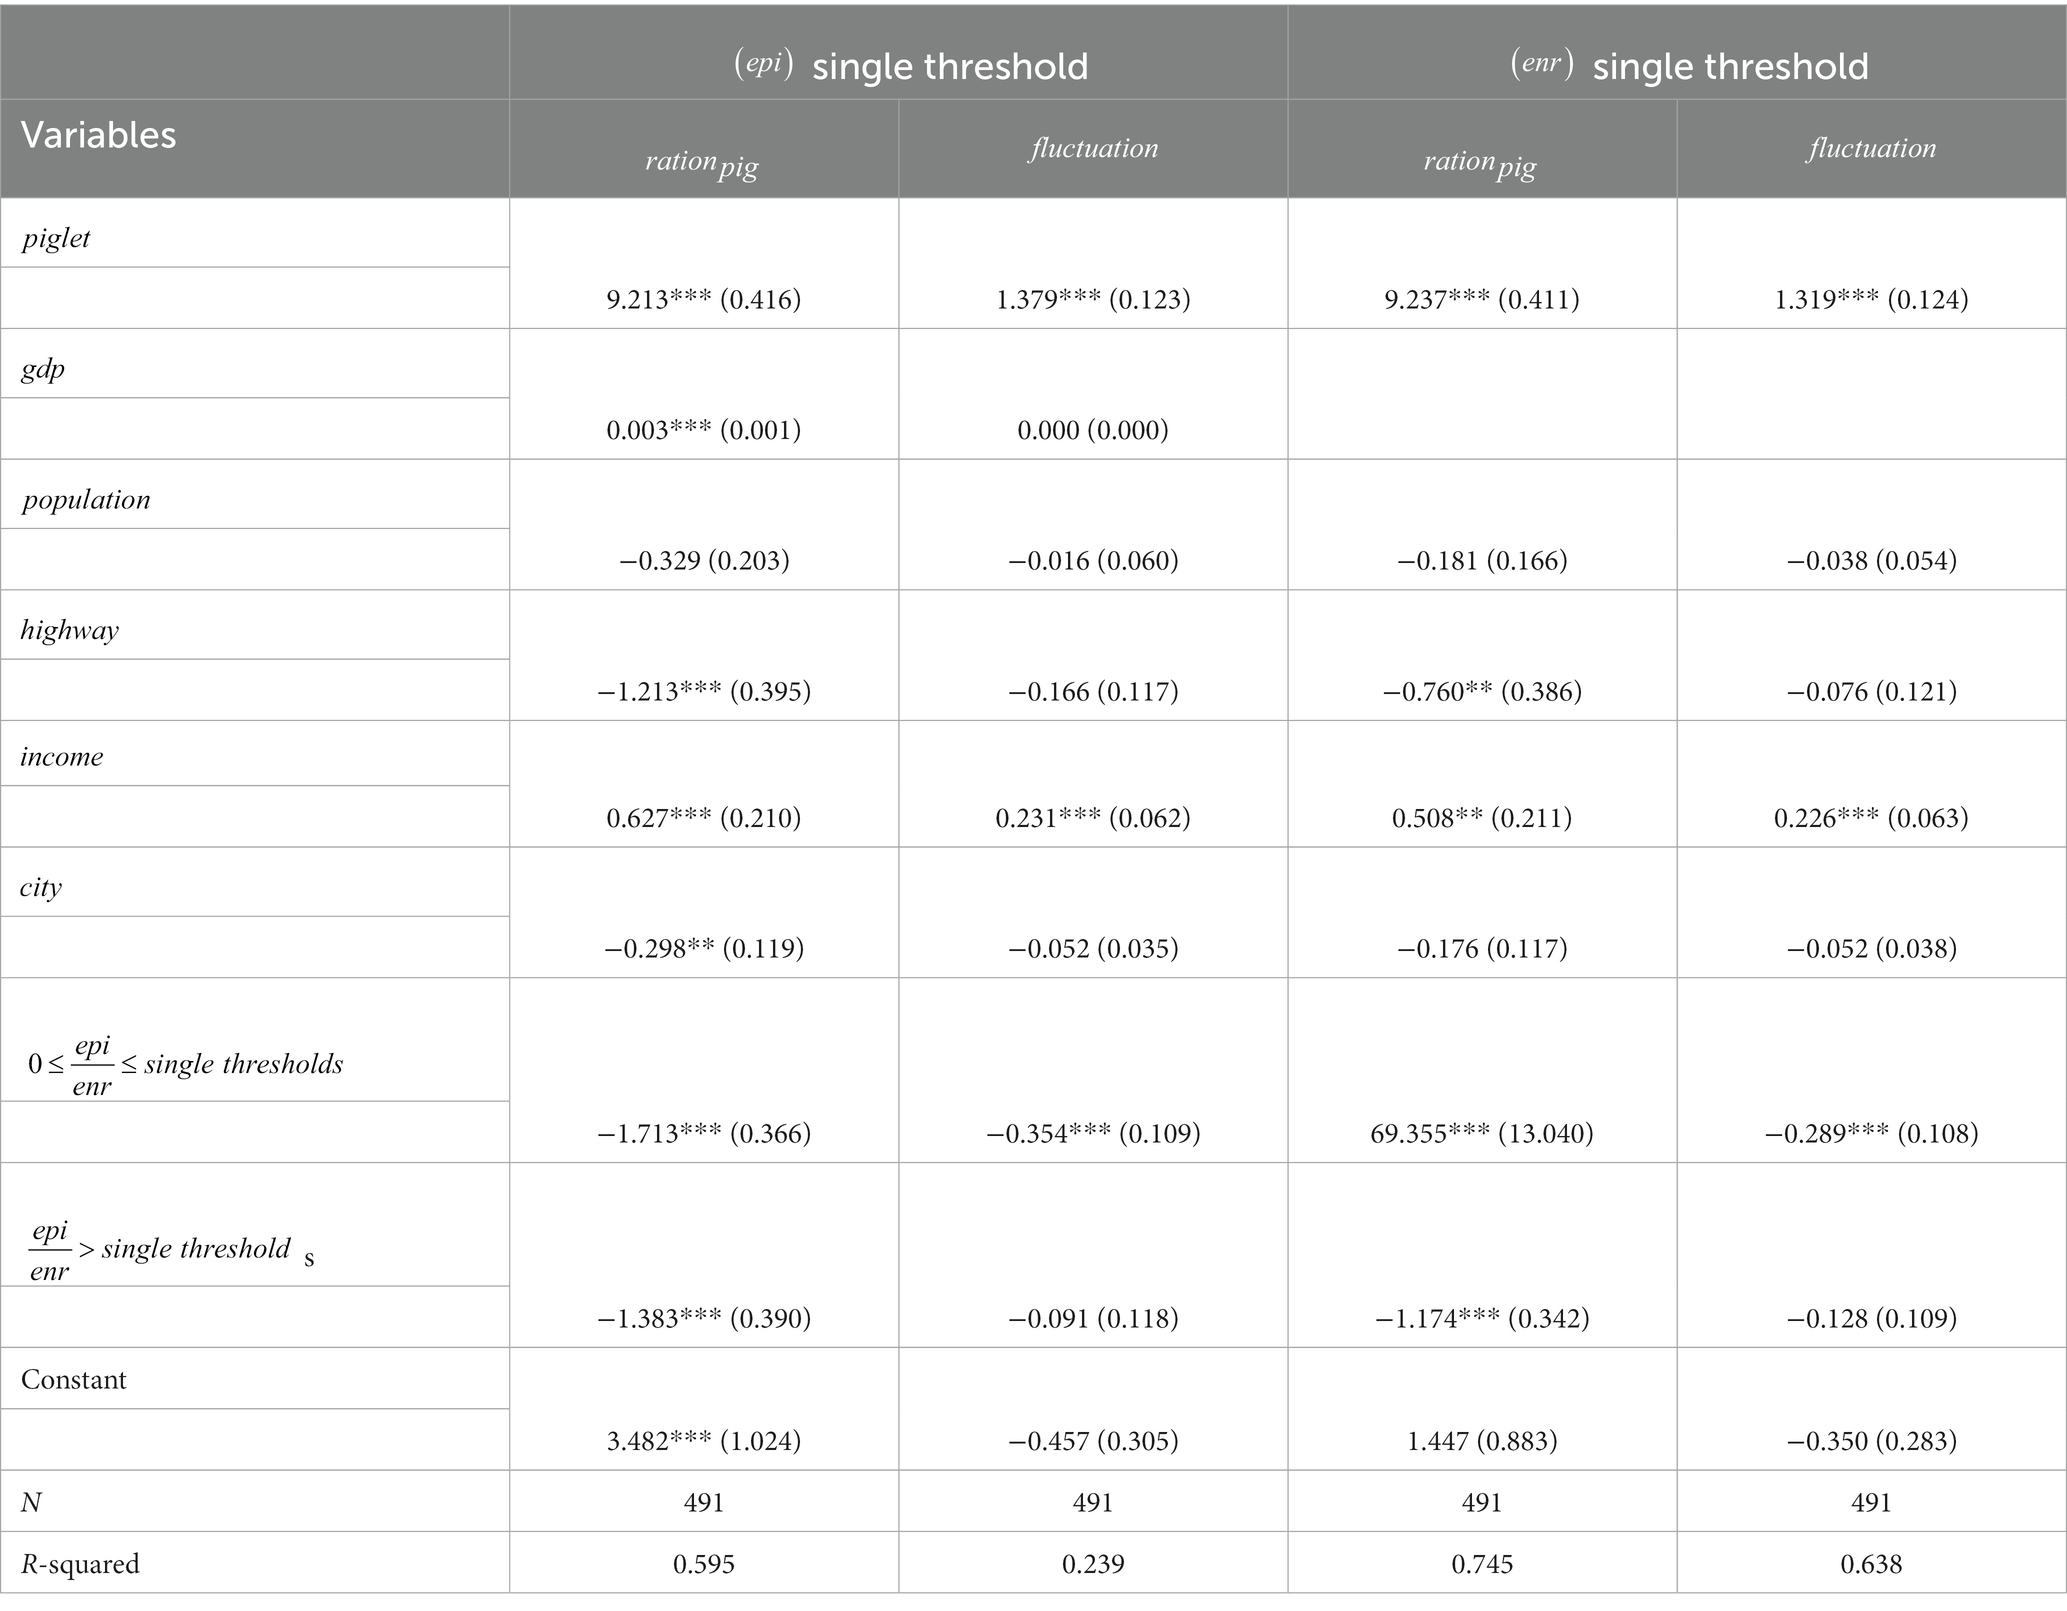
Based on the aforementioned thresholds, this paper incorporates the pig epidemic index and environmental regulation intensity into the single-threshold regression model. The results are presented in Table 11. Regarding the impact of industry scale on the relative price of the hog market (the first column of Table 10), it is observed that this impact remains consistent at the threshold boundaries. Specifically, when the epidemic index is less than 0.193, there is a significant coefficient (−1.713) indicating a negative effect of industry scale on relative price; whereas when the epidemic index exceeds 0.193, there is still a significant coefficient (−1.383) suggesting a negative influence of industry scale on relative price. The third column of Table 10 illustrates the threshold effect of environmental regulation intensity on the relative price of industry size. When the regulation intensity is below 0.039, the coefficient for industrialization on hog prices is significant at 69.35; however, beyond this threshold, the coefficient becomes −1.174 and remains statistically significant at a 1% level.
In terms of industry size and the random fluctuations in hog prices, as indicated in the second column of Table 10, the coefficient for industry size on relative price is −0.354 when the disease index is below 1.387. However, once this threshold is surpassed, the coefficient for industry size on stochastic price volatility diminishes and loses its significance. Moving to Column 4, we observe a threshold effect related to environmental regulation where the coefficient for industry scale on random price volatility exhibits negative significance at a level of 1 percent when the intensity of environmental regulation remains below 2.056. Nevertheless, once this threshold is exceeded, there is no longer any significant relationship between industry size and price volatility.
On one hand, environmental regulation strongly influences the impact of industry size on market prices, supporting Sneeringer and Key’s (2011) research on heterogeneous regulatory policies regarding pig farming size. In fact, China’s pig farming sector exhibits evident scale characteristics in its environmental policies, such as the implementation of the Environmental Protection Tax Law on January 1, 2018. This law explicitly imposes an environmental protection tax on farms with more than 500 pigs in stock, indicating that large-scale farms may be more affected by these regulations. Additionally, it implies that epidemic intensity does not significantly affect industry size due to large-scale farms’ ability to mitigate outbreaks through their financial and technological advantages.
On the other hand, the findings from the threshold regression analysis suggest that hog epidemics and environmental regulations play significant roles in influencing the impact of industry size on market prices. As the severity of epidemics and environmental regulations increases, the ability of industry scale to mitigate random price volatility diminishes or even disappears. Producers not only face price reductions but also bear the burden of price volatility caused by uncertainties such as epidemics and environmental regulations.
6 Conclusion and implications
This paper analyzes the relationship between industrial scale and hog market price risk, using provincial panel data from 2003 to 2020 in China. We find that there is an interactive relationship between the two. First, the industrial scale can reduce the random fluctuation of hog market price, and also the relative hog market price. Second, the effect of scaling on hog market risk has obvious scale heterogeneity. Medium-scale industry can significantly reduce random price fluctuations, and medium-scale and large-scale industrial scale have a larger impact on the relative price. Finally, epidemic risk and environmental regulation also affect the stable operation of the hog industry, but only environmental regulation significantly affects the price stabilization effect of scale. This study contributes in the following aspects: First, it expands the indicators of market price risk, in addition to focusing on random fluctuations, and supplements the research on market profit risk faced by producers. Second, based on the theory of uncertainty, it analyzes the relationship between the increase of the proportion of large-scale farming in the industry and market price risk. Third, it incorporates epidemic risk and environmental regulation risk into the analytical framework, supplementing the literature on policy intervention and uncertainty consequences. Regarding the above research conclusions, the following policy implications are obtained.
One is to reduce the impact of external shocks on the pig industry in favor of sudden disease outbreaks and policy uncertainty. While strengthening veterinary supervision, the Government must increase its investment in disease prevention and control. This can be done, for example, through the provision of a comprehensive veterinary technical training program, and improved availability of veterinary drugs and vaccines to ensure optimal biosecurity standards throughout the farm. Secondly, the active participation of farms in disease prevention and control can be promoted by subsiding the cost of vaccination. The rational formulation of environmental regulation policies is an important factor in the sustainable development of the pig farming industry. The government should formulate policies flexibly according to the pressure of environmental regulation and the impact of industrial development. The government must formulate policies carefully to avoid excessive negative impacts on the scale of the industry. In this regard, it can extend the transition period and provide financial and technical support for the transition to help farms adapt to environmental regulatory requirements.
Secondly, promoting appropriate scale is key to the sustainable development of the pig industry. From the governmental level, differentiated policy support measures, such as the establishment of entry thresholds and financial subsidies for specific scale operations, should be established to support small-scale and medium-scale farms, and to realize large-scale operations gradually. At the same time, to promote fair competition and effective utilization of resources, the government can strengthen the supervision of farms operating on too large a scale. At the market level, optimize the diversified operation of the market and encourage the development of diversified farming business entities, such as small farmers, farmers’ professional cooperatives and large-scale farming enterprises. In addition, information transparency should be strengthened, and a sound information dissemination mechanism for the hog market should be established, such as providing information on farming costs and market prices, to reduce market distortions caused by information asymmetry.
Third, establishing market regulatory mechanisms can ensure healthy operation in the hog market. Firstly, the government can set up a perfect market supervision organization, improve the frequency and accuracy of monitoring market supply and demand, release price information timely, formulate anti-monopoly and anti-unfair competition regulations, and strengthen market supervision and law enforcement. Secondly, the government should improve the information-sharing mechanism and promote information cooperation in the hog industry. Specific practices include establishing an industry information platform and regularly releasing market reports, market data, and policy interpretations to provide farmers and breeding enterprises with accurate market information. In addition, the government can organize industry conferences, exhibitions, and training to provide technical guidance and consulting services, finally boosting the hog industry’s development.
7 Research limitations and future direction
Due to the limitation of industrial scale data, this study did not conduct empirical tests at the city, county and village levels and more detailed time dimensions. The next research direction of this study is to empirically analyze the relationship between industrial policies and market price risks in developing and developed countries from a historical perspective based on the production scale and price data of various countries. In addition, prediction models can be established through simulation methods such as machine learning to analyze the relationship between different organizational models and price cycles.
Data availability statement
The datasets presented in this study can be found in online repositories. The names of the repository/repositories and accession number(s) can be found at: http://www.stats.gov.cn/.
Author contributions
QY: Writing – original draft, Writing – review & editing. SQ: Writing – review & editing. RY: Funding acquisition, Writing – review & editing.
Funding
The author(s) declare financial support was received for the research, authorship, and/or publication of this article. This work was supported by the National Natural Science Foundation project of China (no. 72073068).
Conflict of interest
The authors declare that the research was conducted in the absence of any commercial or financial relationships that could be construed as a potential conflict of interest.
Publisher’s note
All claims expressed in this article are solely those of the authors and do not necessarily represent those of their affiliated organizations, or those of the publisher, the editors and the reviewers. Any product that may be evaluated in this article, or claim that may be made by its manufacturer, is not guaranteed or endorsed by the publisher.
Footnotes
1. ^Data source: Website of National Bureau of Statistics (http://www.stats.gov.cn/).
2. ^Source: Brick Agricultural Database (http://www.agdata.cn/).
3. ^Ministry of Agriculture and Rural Affairs, PRC: http://www.moa.gov.cn/hd/zbft_news/sswsqnyncfzqk/
4. ^China Agricultural Big Data: http://www.agdata.cn.
5. ^Due to data availability, except for Tibet, Taiwan, Hong Kong and Macao, the 30 provinces are Shanghai, Yunnan, Inner Mongolia, Beijing, Jilin, Sichuan, Tianjin, Ningxia, Anhui, Shandong, Shanxi, Guangdong, Guangxi, Xinjiang, Jiangsu, Jiangxi, Hebei, Henan, Zhejiang, Hainan, Hubei, Hunan, Gansu, Fujian, Guizhou, Liaoning, Chongqing, Shaanxi, Qinghai and Heilongjiang.
6. ^Chinese government website: http://www.gov.cn.
7. ^The Chinese Animal Husbandry and Veterinary Yearbook divides pig large-scale breeding into six groups, which are 50 ~ 99 head (S1), 100 ~ 499 head (S2), 500 ~ 2,999 head (S3), 3,000 ~ 9,999 head (S4), 10,000 ~ 49,999 head (S5) and more than 50,000 head (S6).
8. ^Chinese government: https://www.gov.cn/xinwen/2021-06/29/content_5621495.htm.
9. ^Data source: China Animal Husbandry and Veterinary Statistics Yearbook.
10. ^According to the “14th Five-Year Plan” National Animal Husbandry and Veterinary Industry Development Plan, http://www.moa.gov.cn.
References
Abrigo, M., and Love, I. (2016). Estimation of panel vector autoregression in Stata. Stata J. 16, 778–804. doi: 10.1177/1536867X1601600314
Aimin, H. (2010). Uncertainty, risk aversion and risk management in agriculture. Agri. Sci. Proc. 1, 152–156. doi: 10.1016/j.aaspro.2010.09.018
Asche, F., Cojocaru, A. L., and Roth, B. (2018). The development of large scale aquaculture production: a comparison of the supply chains for chicken and salmon. Aquaculture 493, 446–455. doi: 10.1016/j.aquaculture.2016.10.031
Dayat, D., Anwarudin, O., and Makhmudi, M. (2020). Regeneration of farmers through rural youth participation in chili agribusiness. Int. J. Sci. Technol. Res. 9, 1201–1206.
De Roest, K., Ferrari, P., and Knickel, K. (2018). Specialisation and economies of scale or diversification and economies of scope? Assessing different agricultural development pathways. J. Rural. Stud. 59, 222–231. doi: 10.1016/j.jrurstud.2017.04.013
Foster, A. D., and Rosenzweig, M. R. (2022). Are there too many farms in the world? Labor market transaction costs, machine capacities, and optimal farm size. J. Polit. Econ. 130, 636–680. doi: 10.1086/717890
Gale, F., Marti, D., and Hu, D. (2012). China's volatile pork industry. Situation & outlook report rice. A report from the economic research service. Available at: www.ers.usda.gov
Gneiting, U., and Sonenshine, J. (2018). A living income for small-scale farmers: Tackling unequal risks and market power.
Gouel, C. (2012). Agricultural price instability: a survey of competing explanations and remedies. J. Econ. Surv. 26, 129–156. doi: 10.1111/j.1467-6419.2010.00634.x
Guo, G. Q. (2017). Analysis of short-term characteristics of pork price fluctuation based on ARCH model. Econ. Probl. 459, 95–100. doi: 10.16011/j.cnki.jjwt.2017.11.015
Holmes, T. J. (2011). The diffusion of Wal-Mart and economies of density. Econometrica 79, 253–302. doi: 10.3982/ECTA7699
Hu, X. D., and Wang, M. L. (2013). Causes and implications of pig production and price fluctuation in the United States. Issues Agri. Econ. 9, 98–109. doi: 10.13246/j.cnki.iae.2013.09.008
Jankelova, N., Masar, D., and Moricova, S. (2017). Risk factors in the agriculture sector. Agri. Econ. Czech. 63, 247–258. doi: 10.17221/212/2016-AGRICECON
Kuiper, W. E., and Lansink, A. O. (2013). Asymmetric price transmission in food supply chains: impulse response analysis by local projections applied to US broiler and pork prices. Agribusiness 29, 325–343. doi: 10.1002/agr.21338
Li, Y. L., and Che, H. (2013). Performance evaluation of government-mandated immunization in emergent animal outbreaks: based on analysis of 1167 farm household samples. Chin. Rural Econ. 348, 51–59.
Li, G. C., Chen, N. L., and Min, R. (2011). Growth and decomposition of agricultural total factor productivity in China under environmental regulation. China Popul. Resour. Environ. 21, 153–160.
Li, P. C., and Wang, M. L. (2019). How to recover pig production under the double impact of environmental protection and African swine fever epidemic: a survey based on eight provinces. Issues Agri. Econ. 486, 109–118. doi: 10.13246/j.cnki.iae.2020.06.010
Long, R., Yang, J., Chen, H., Li, Q., Fang, W., and Wang, L. (2019). Co-evolutionary simulation study of multiple stakeholders in the take-out waste recycling industry chain. J. Environ. Manag. 231, 701–713. doi: 10.1016/j.jenvman.2018.10.061
Ma, C., Tao, J., Tan, C., Liu, W., and Li, X. (2023). Negative media sentiment about the pig epidemic and pork Price fluctuations: a study on spatial spillover effect and mechanism. Agriculture 13:658. doi: 10.3390/agriculture13030658
Nugroho, A. D. (2021a). Agricultural market information in developing countries: a literature review. Agric. Econ. 67, 468–477. doi: 10.17221/129/2021-AGRICECON
Nugroho, A. D. (2021b). Development strategies of the local auction market of agricultural product in Indonesia. Rev. Agri. Sci. 9, 56–73. doi: 10.7831/ras.9.0_56
Richter, M. (2013). Business model innovation for sustainable energy: German utilities and renewable energy. Energy Policy 62, 1226–1237. doi: 10.1016/j.enpol.2013.05.038
Shen, X. Q., and Qiao, J. (2019). Differences in camera selection behavior of pig farmers of different sizes under price fluctuations: reflections on mitigating large price fluctuations of live pigs. J. Huazhong Agri. Univ. 5, 54–62. doi: 10.13300/j.cnki.hnwkxb.2019.05.007
Sneeringer, S., and Key, N. (2011). Effects of size-based environmental regulations: evidence of regulatory avoidance. Am. J. Agric. Econ. 93, 1189–1211. doi: 10.1093/ajae/aar040
Tian, W. Y. (2019). Study on the influence of feeding risk on pig farmers' moderate scale breeding: based on the investigation of Sichuan pig transfer county. Heilongjiang Anim. Husb. Vet. Sci. 578, 25–29.
Vongvisouk, T., and Dwyer, M. (2016). Falling rubber prices in northern Laos: local responses and policy options. Helvetas: Zürich, Switzerland, 1-59. Falling rubber prices in northern Laos: local responses and policy options | Mekong region land governance repository (mekonglandforum.org).
Wang, M. L., Li, P. C., and Ma, X. P. (2022). Effect of scale selection on high-quality development of animal husbandry and its path optimization: based on the perspective of scale of pig breeding. Chin. Rural Econ. 447, 12–35.
Wang, H. H., Wang, Y., and Delgado, M. S. (2014). The transition to modern agriculture: contract farming in develo** economies. Am. J. Agric. Econ. 96, 1257–1271. doi: 10.1093/ajae/aau036
Wang, G. Y., Wang, X. H., and Li, C. X. (2018). Study on the stabilizing effect of breeding capitalization on pig price fluctuation: an empirical analysis based on China panel data. Chin. Rural Econ. 402, 55–66.
Wang, Y., Wang, J., Wang, X., and Xin, X. (2020). COVID-19, supply chain disruption and China's hog market: a dynamic analysis. Chin. Agri. Econ. Rev.. doi: 10.1108/CAER-04-2020-0053 (Epub ahead of print).
Wang, Y. J., Wei, M. Y., Usman, B., and Chao, Z. (2022). Geopolitical risk, economic policy uncertainty and global oil price volatility —an empirical study based on quantile causality nonparametric test and wavelet coherence. Energ. Strat. Rev. 41:100851. doi: 10.1016/j.esr.2022.100851
Wang, J. H., Yang, C. C., and Tang, J. J. (2019). Loss aversion and handling behavior of sick and dead pigs by farmers: based on a realistic survey of 404 farmers. China Rural Econ. 4, 130–144.
Weng, M. (2013). Analysis of the causes of large fluctuations in pig prices in China: based on the perspective of breeding scale and pig market. Rural Economy 9, 31–33.
Weng, L., Wang, K., Zhu, Z., and Wei, T. (2019). Market risk, price expectation and breeding behavior of breeding sows. J. Agrotech. Econ. 302, 30–43. doi: 10.13246/j.cnki.jae.2020.06.003
Wu, X. B., Qiao, J., and Liu, Z. J. (2014). Vertical cooperation form selection and influencing factors analysis of pig farms (households): based on survey data of pig farms (households) in Beijing. J. Chin. Agri. Univ. 19, 229–235.
Wu, L. H., Xu, G. Y., and Yang, L. (2015). Study on the moderate pig breeding scale under the internalization of environmental pollution control costs. China Popul. Resour. Environ. 25, 113–119.
Yang, S. H., and Wang, K. (2022). Study on stabilizing effect of scale management on fluctuation of pig production in China: a double test based on regulation effect and threshold effect model. Issues Agri Econ. 511, 81–96. doi: 10.13246/j.cnki.iae.2022.07.008
Yi, Z. Z., Gao, Y., Guo, S. Y., and Pang, S. Y. (2012). Risk assessment and empirical analysis of pig market price in China. Issues Agri. Econ. 33, 22–29. doi: 10.13246/j.cnki.iae.2012.04.004
Zeng, F., Li, D. S., and Tan, Y. (2021). The impact of pig industry transfer on agricultural structure adjustment in the context of environmental regulation. China Popul. Resour. Environ. 21, 158–160.
Zhang, Y. Y., and Fan, Y. F. (2012). Study on production recovery behavior of pig farmers under the impact of African swine fever. Agri. Econ. Manag. 73, 66–74.
Zhang, H., Wang, J., and Martin, W. (2018). Factors affecting households' meat purchase and future meat consumption changes in China: a demand system approach. J. Ethnic Foods 5, 24–32. doi: 10.1016/j.jef.2017.12.004
Zhang, Y. Y., Wu, Q., and Sun, S. M. (2019). Influencing factors and spatial effects of pig breeding scale: a study based on 13 provinces with advantages in pig breeding. Chin. Rural Econ. 409, 62–78.
Zhu, Z. Y., Pu, H., and Yang, C. (2020). The impact of COVID-19 on pig industry and countermeasures. Issues Agric. Econ. 3, 24–30. doi: 10.13246/j.cnki.iae.2020.03.004
Keywords: agricultural economy, livestock industry, industrial structure, epidemic, environmental regulations
Citation: Yang Q, Qiao S and Ying R (2024) Agricultural industrial scale, price random fluctuation, and profitability levels: evidence from China’s pig industry. Front. Sustain. Food Syst. 8:1291743. doi: 10.3389/fsufs.2024.1291743
Edited by:
Eleni Zafeiriou, Democritus University of Thrace, GreeceReviewed by:
Agus Dwi Nugroho, Hungarian University of Agricultural and Life Sciences, HungaryHeru Nugroho, Telkom University, Indonesia
Copyright © 2024 Yang, Qiao and Ying. This is an open-access article distributed under the terms of the Creative Commons Attribution License (CC BY). The use, distribution or reproduction in other forums is permitted, provided the original author(s) and the copyright owner(s) are credited and that the original publication in this journal is cited, in accordance with accepted academic practice. No use, distribution or reproduction is permitted which does not comply with these terms.
*Correspondence: Ruiyao Ying, MzIwMTg2NDE3OEBxcS5jb20=
 Qing Yang
 Shiyan Qiao
 Ruiyao Ying