 Aschalew K. Tebeje1,2*
 Wubneh B. Abebe1
 Misbah A. Hussein2
 Demesew A. Mhiret2
 Fasikaw A. Zimale2
 Gizaw Desta3
 Tewodros T. Assefa2
 Seifu A. Tilahun2,4
 Mohammed A. Ahmed5
- 1Lihiket Design and Supervision Corporation, Bahir Dar, Ethiopia
- 2Faculty of Civil and Water Resources Engineering, Bahir Dar Institute of Technology, Bahir Dar University, Bahir Dar, Ethiopia
- 3International Crops Research Institute for the Semi-Arid Tropics (ICRISAT-ET), Addis Ababa, Ethiopia
- 4International Water Management Institute, Accra, Ghana
- 5Department of Geography and Environmental Studies, Addis Ababa University, Addis Ababa, Ethiopia
Several studies have assessed the dynamics of soil quality induced by soil and water conservation (SWC), but many showed disagreement over the efficacy of SWC interventions in the Ethiopian highlands. This study used a before and after soil and water conservation practices (SWCP) comparison approach to evaluate the effect of SWCP on soil quality dynamics. Fifty-four composite and 10 undisturbed soil samples were collected in 2012 (before SWCP) and 2022 (after SWCP). Statistical mean, analysis of variance, and principal component analysis were applied to test the significant differences among treatments. The findings demonstrated that SWCP has significantly improved most of the soil quality indicators such as soil organic matter, total nitrogen, available phosphorous, pH, total porosity, field capacity, and available water, and reduced the value of bulk density and coarse fragments. The interaction effect of landscape position and types of structures provided statistically significant results for soil organic matter, total nitrogen, magnesium, calcium, and base saturation. Soil and stone-faced soil bunds treated at lower landscapes were superior in improving soil quality attributes. The soil quality indexing showed, the overall soil quality improvement as a result of SWCP was about 32.15%. The level of improvement for different SWCPs was 32% for stone faced soil bunds and 33% for soil bunds. The findings revealed that SWCP implementation can improve soil quality. Soil organic matter is a key biological quality component that contributed 25% to the soil quality index and highly impacted soil physicochemical properties. We suggest additional assessment of best and integrated land management practices to ensure further improvement in soil quality, crop productivity, and ecosystem services in the subhumid ecosystems.
1 Introduction
In the last 50 years, about 2 billion hectares of land have been degraded, resulting in the loss of 11.9 to 13.4% of the world’s agricultural supply (Tsymbarovich et al., 2020; Hussain et al., 2021). Land degradation is defined in this context as the loss of land quality and, as a result, land productivity (Rashid et al., 2016). Productivity in Africa has fallen by half, owing mostly to soil erosion and its consequences (Lal, 2015; Bekele et al., 2022). This results in a yield loss ranging from 2 to 40%, depending on local socio-environmental conditions (Eswaran et al., 2019).
As part of other agricultural lands of the world, soil erosion is widespread in the East African highlands, including in the Ethiopian highlands (Girmay et al., 2020). The problem of soil erosion in the Ethiopian highlands was felt some 4,000 years ago with the introduction of agriculture (Wassie, 2020). As studied, this has reduced soil fertility and land productivity (Meseret, 2016). The amount of soil lost in Ethiopia’s highlands varied from 5 to 300 t ha−1 yr.−1 depending on terrain, land use, and agro-ecological zones (Selassie and Amede, 2014; Meseret, 2016; Lemma et al., 2019; Adem et al., 2020). This estimate is equivalent to the loss of more than 3 mm of topsoil per year (Zegeye et al., 2010). On the other hand, it takes about 100 years to form 1 cm of soil (Chalise et al., 2019). As a result, the erosion rate in Ethiopia is higher than soil formation rates.
Laboratory and field experiments have been conducted to assess the effects of erosion on soil quality and productivity (Wang et al., 2020). In soil quality assessment studies, various types of soil quality indicators, also known as soil characteristics, were used. The choice of a relevant attribute was determined by the research purpose and the availability of data. For example, some studies use a combination of soil physicochemical properties (Rinot et al., 2019; Leul et al., 2023), whereas others consider selected variables to address specific soil quality (Alemayehu and Fisseha, 2018; Alewoye Getie et al., 2020). These studies have shown that soil erosion induced soil quality deterioration including nutrient availability, water-holding capacity, and soil response to fertilization (Nachimuthu and Hulugalle, 2016; Kebede et al., 2022).
Moreover, some studies have been conducted to measure soil quality changes as a result of SWC treatments. Amare et al. (2013), Belayneh et al. (2019), Mengistu et al. (2016), Siraw et al. (2020), and Tolesa et al. (2021) discovered a significant improvement in soil organic carbon, total nitrogen, available phosphorous, available potassium, pH, clay content, cation exchange capacity, and soil hydrology in Ethiopian highlands. Mengistu et al. (2016) found that conserved plots had higher magnesium and calcium content than non-conserved plots. All these studies have found that conserved plots improved several soil quality indicators than non-conserved plots.
In contrast, particular research works found an absence of substantial positive improvements in soil quality indicators after SWC treatments. For instance, although the contents of exchangeable potassium and magnesium in the conserved micro-watershed were slightly higher than that in the non-conserved plots, the differences were statistically non-significant (Du et al., 2022). Mengistu et al. (2016) reported a statistically non-significant difference in soil organic carbon content between soils treated with SWC measures and those without in the Bokole watershed, and a non-significant improvement in soil hydrology parameters at the Anjeni watershed after 25 years of conservation work. Similarly, Amare et al. (2013) found non-significant changes in pH, available phosphorous, available potassium, calcium, and magnesium between conserved and un-conserved sites.
Regardless of the disparities in research results, most prior studies made in Ethiopia were based on paired sites, i.e., a comparison of conserved and non-conserved sites due to a lack of historical data on soil qualities before SWCP was made. This method, on the other hand, was incapable of accounting for the intrinsic variability of soil chemical characteristics over a short distance. In general, there is disagreement on the efficacy of SWC interventions implemented in Ethiopia (Dagnew et al., 2015). As Tilahun and Belay (2019) suggested the response of land to SWC measures is the result of a complex interaction of several factors such as agroecology, age of treatments, and placement of structures. The present study hypothesized that soil and water conservation practices in sub-humid tropics will have a significant beneficial impact on soil quality.
Most previous research relied on the short-term effects of SWC using paired site comparison of conserved and unconserved adjacent sites due to a lack of historical data on soil quality indicators (Yu et al., 2018). Soil properties, on the other hand, changed dynamically throughout time and under any conditions. This study is uniquely designed to examine the true and long-term (2012–2022) soil quality improvement in subhumid ecosystems over space and time as a result of the implementation of SWCP in the area. Therefore, the objective of the present study is to (i) assess the dynamics of soil properties caused by SWCP and (ii) evaluate the effects of conservation practices and landscape on soil properties in the sub-humid highlands of Ethiopia.
2 Materials and methods
2.1 Area description
The study was conducted in the Debre Mawi watershed, located in the northwestern Ethiopian highlands (Figure 1). The watershed has an area of 97 ha and is located between 11°21′18″ to 11°22′1” North latitudes and 37°25′3″ to 37°25’l37”East longitudes. The elevation varies between 2,195 to 2,308 meters above the mean sea level. The slope gradient varies from plain (0–5%), gentle (5–8%), moderate (8–15%), steep (15–30%), to extremely steep (>30%) accounting for about 17.46, 22.72, 38.53, 21.18 and 0.14% of the area. The climate is sub-humid, with a mean annual total rainfall of 1,240 mm and a mean annual temperature of about 20°C (Dagnew et al., 2015). The rainfall pattern is mono-modal, largely concentrated between June and September. The major soils are Haplic Vertisols (32.33%), Luvic Nitisols (23.96%), Haplic Luvisols (21.58%), Vertic Cambisols (16.16%), and Haplic Leptsols (5.97%).
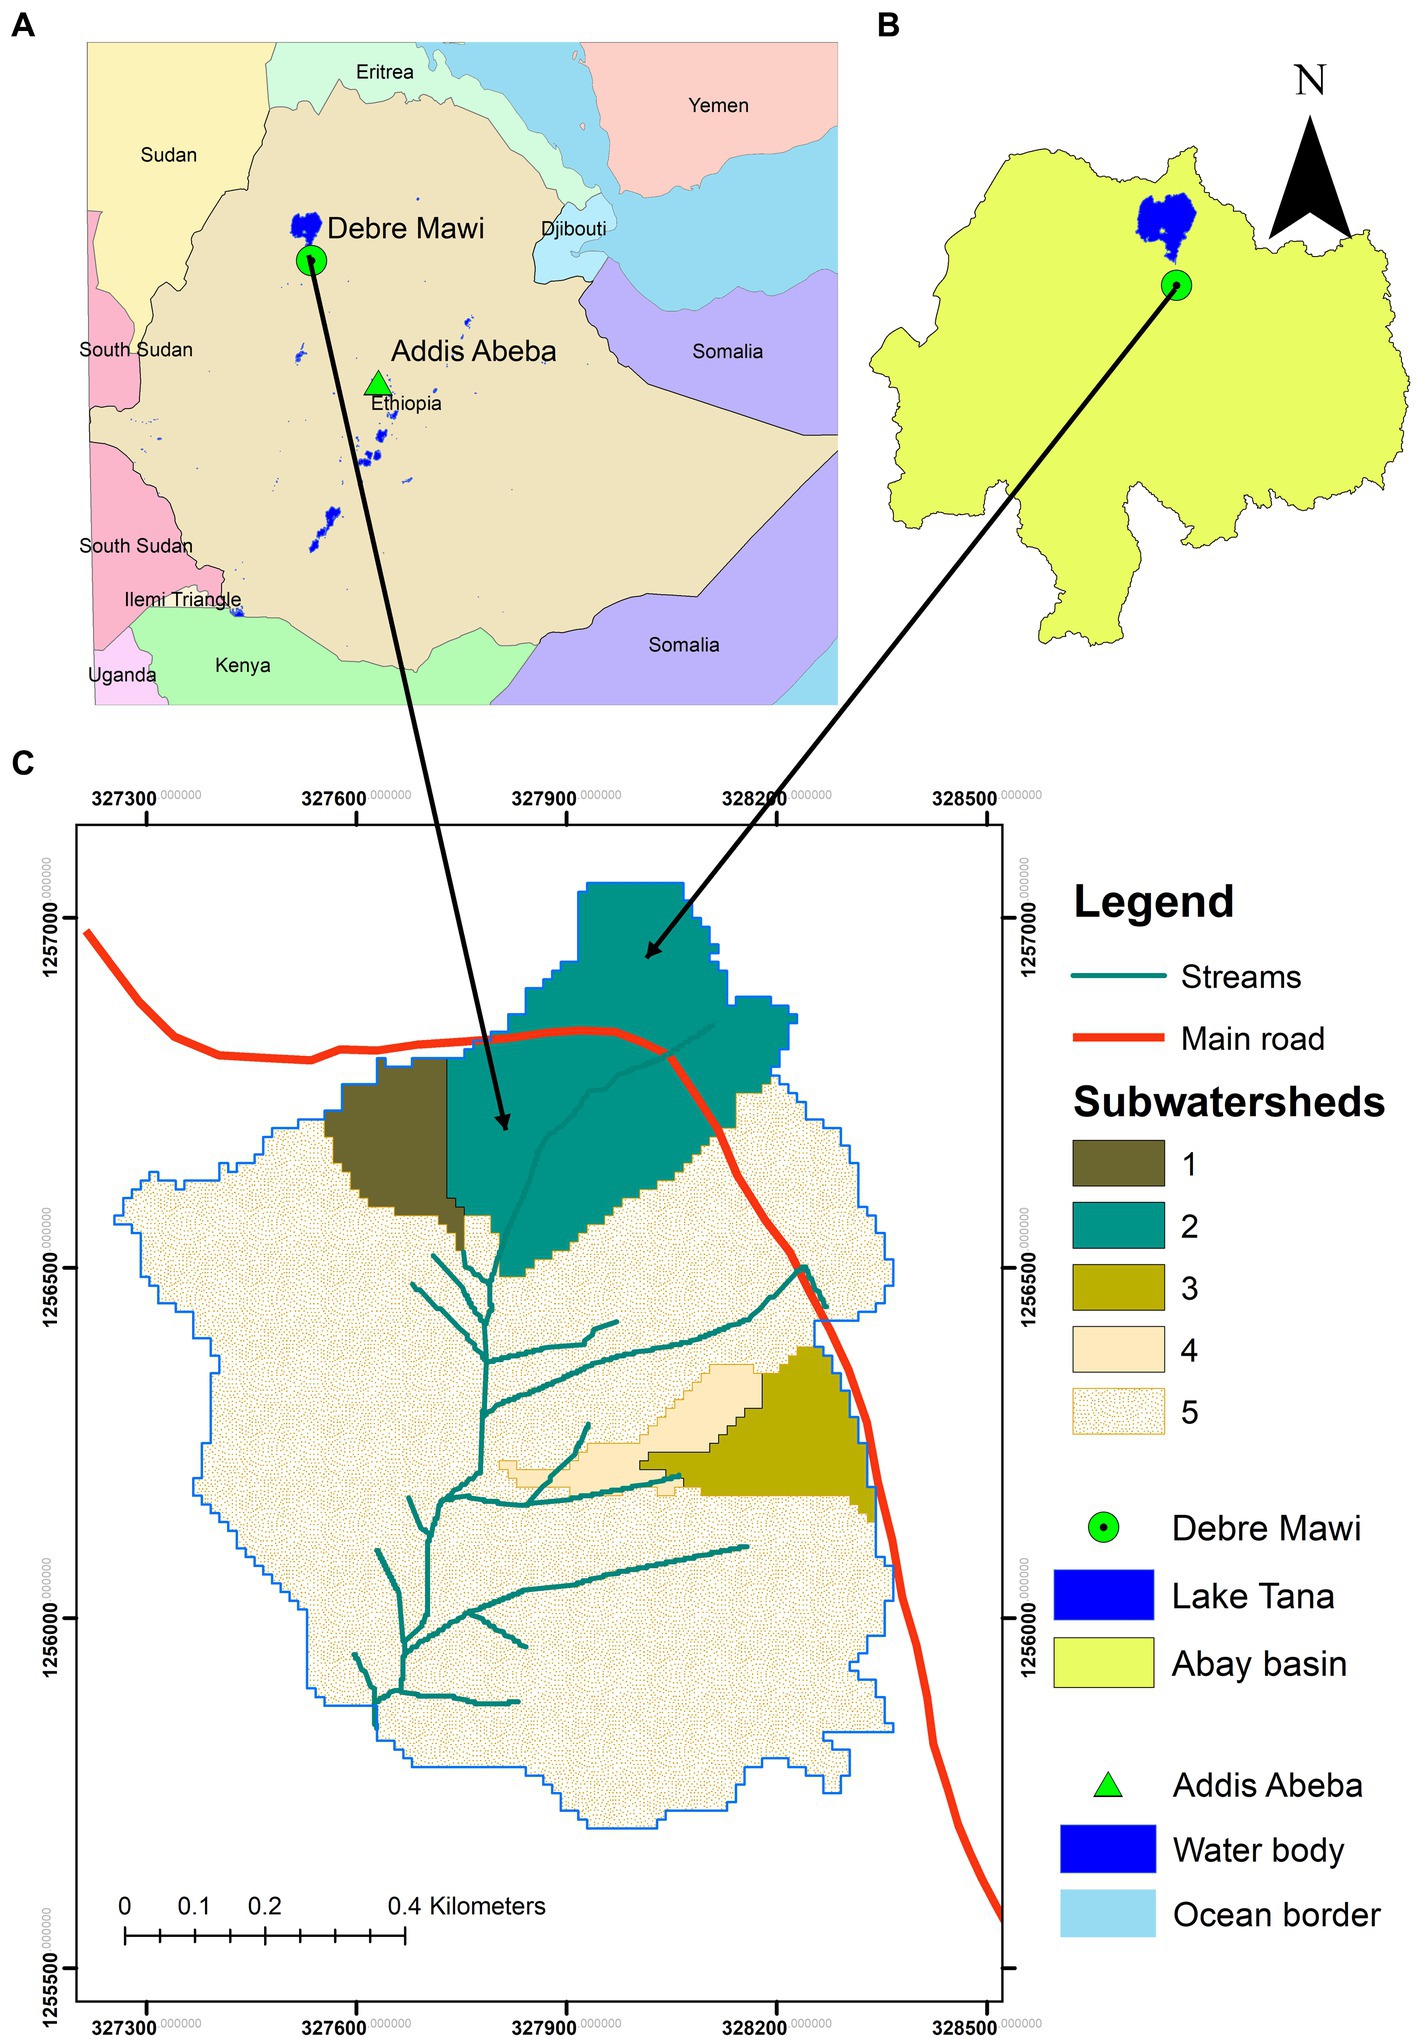
Figure 1. Location map of Debre Mawi over Ethiopia (A), abbay basin and lake tana (B) and watershed features of Debre Mawi (C).
2.2 Soil and water conservation structures inventory
The soil and water conservation structures were extracted from Google Images, verified on the ground, and categorized into three management conditions: non-conserved, soil bund, and stone-faced soil bund areas. The stone-faced soil bunds and soil bunds covered about 51 and 32% of the watershed, respectively, leaving 17% to be non-conserved. The SWCPs were made up of stone and soil with heights ranging from 0.3 to 0.6 meters. The horizontal distance between the bunds was 32 meters. On hilly terrain, the spacing was lowered so that the greatest height change between successive bunds was 1.5 meters (Mhiret et al., 2019).
2.3 Experimental setup and design
The research in general has a factorial experiment with three experimental variables, time (before and after), types of SWC structures (non-conserved, soil bund and stone bund) and landscape units (upper, middle and lower landscape positions) considered as depicted in Table 1. This study employed the before and after intervention comparison technique to compare soil quality before and after the implementation of soil and water conservation. Before the implementation of SWCP, a preliminary soil sampling was conducted in January 2012. Stone-faced soil bunds and soil bunds were the two main SWC structures, which were largely built from 2012 to 2014. Subsequently, soil samples were collected in 2022 at the same location sites as the ones taken before the implementation of SWCP and used to represent soil data after the implementation of SWCP. Samples were also collected in 2022 at non-conserved locations to verify the true changes in soil quality brought by SWCP.
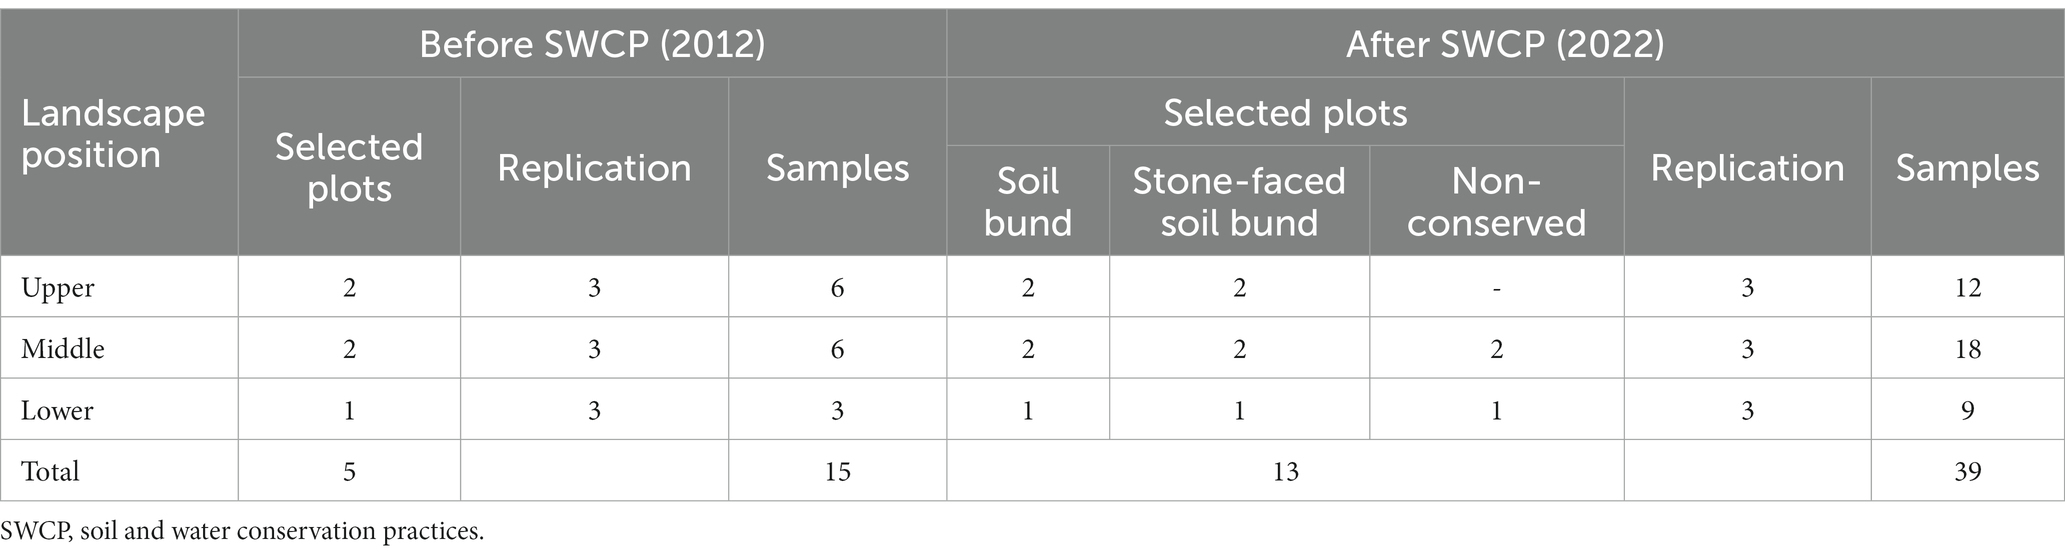
Table 1. Number of selected plots, replications, and disturbed soil samples assigned before and after the implementation of SWCP based on landscape and types of SWCP.
Concomitantly, the study (i) assess changes in soil properties due to SWC treatments and (ii) evaluate the interaction effects of conservation practices and landscape position (Table 1). In 2012, 5 plots were established in the three landscapes for soil sampling before the implementation of SWCP. In 2022, the watershed area was divided into conserved and non-conserved areas, explicitly subdivided into soil bunds, stone-faced soil bunds, and non-conserved plots. The three landscape units intersected with the watershed categorization made in 2022 (stone-faced soil bund, soil bund, and non-conserved areas), yielding 8 combinations after the implementation of SWCP. The 13 representative plots were chosen as given in Table 1.
The primary study interest was to examine the impacts of SWCP on the dynamics of soil qualities after years of implementation. This temporal cluster analysis compares data collected from conserved plots in 2022 as one group to data obtained from non-conserved plots in 2012. The first group includes data from 10 conserved field plots with replications collected in 2022, whereas the second group includes data from 5 selected plots with replications gathered in 2012. This research design did not use data from non-conserved plots gathered in 2022.
Also, a comprehensive analysis was performed to analyze the interaction effect of landscape and conservation practices on soil properties. Landscape and types of conservation practices were experimental variables as indicated in Supplementary Table S1. The data collected before the implementation of SWCP in 2012 were labeled as “non-conserved 2012” for the interaction study. Some data was also collected from non-conserved plots found in the middle and lower landscape, and represented as “non-conserved 2022.” The statistical comparison was made among 11 treatment combinations (Supplementary Table S1).
2.4 Soil sampling
Soil sampling was systematically designed to represent experimental variables before and after the implementation of SWCP, landscape units, and conserved and non-conserved units, with replications. Soil samples from the selected plots (Table 1) were collected by delineating 10 m x 10 m size plots of 0–20 cm depth. Composite and core soil samples were collected using Auger and core sampler. Core samples were taken at the center of each plot using a sharp-edged steel cylinder (core sampler). Before the implementation of SWCP, 5 core samples were collected at 5 sampling plots without replication. Similarly, 5 undisturbed core samples were collected after the implementation of SWCP at the same location as the samples taken before the implementation of SWCP. A total of 10 undisturbed soil samples were collected without replication.
About 5 soil samples were obtained before the implementation of SWCP in 2012, whereas 39 soil samples were collected after the implementation of SWCP in 2022. A total of 54 disturbed soil samples were collected from experimental treatments and replications (Table 1). For non-conserved plots, soil samples were collected at the edge of rectangular plots. For conserved areas, samples were excavated from the upper (0.5 m from the upper bund), middle (midpoint between two successive bunds), and lower (0.5 m from the lower bund) part of two successive bunds.
2.5 Laboratory analysis procedures
Soil samples were analyzed at Lihiket Design and Supervision Corporation Soil Laboratory, Bahir Dar (Ethiopia) where the analysis procedures were similar for soil samples collected both before and after soil and water conservation have been implemented. The samples were air-dried, crushed, and passed through a 2-mm sieve. The soil material that remained on the sieve was considered a percent coarse fragment, expressed by the mass of coarse material divided by the mass of the soil sample multiplied by 100. Soil pH was determined potentiometrically in the supernatant suspension of 1:2.5 soil-to-water suspensions using a pH meter as described by Van Reeuwijk (1986). The electrical conductivity of the saturated paste (ECe) was evaluated on the filtrate of saturated soil paste extract obtained by vacuum suction using an electrical conductivity meter and adjusted to ECe at 25°C. Particle size distribution was determined by the hydrometer method (Bouyoucos, 1962) using sodium hexametaphosphate as dispersing agent, and bulk density was determined from the undisturbed core samples (Hao et al., 2008). Total porosity was determined using the formula indicated in Equation 1:
Available phosphorous content was determined by 0.5 M sodium bicarbonate extraction solution (pH 8.5) by Olsen (1982) method. The Kjeldahl method was used for total nitrogen determination (Bremmer and Mulvaney, 1982). Soil organic carbon was measured by the wet combustion procedure of the Walkley-Black method, and the amount of soil organic matter was calculated by multiplying the percent of organic carbon by a factor of 1.724 (Landon, 2014). The exchangeable bases (Na+, Ca2+, Mg2+, and K+) were extracted by excess ammonium acetate solution (Van Reeuwijk, 1986). Following the extraction, exchangeable Ca and Mg were read using atomic absorption spectrophotometer (AAS), and exchangeable Na and K were read by a flame photometer (Black, 1965). Cation exchange capacity (CEC) was determined by the ammonium acetate method from the distillation of the ammonium-saturated samples (Chapman, 1965). The percentage base saturation was calculated by dividing the sum of the base-forming cations (K+, Mg2+, Ca2+, and Na+) by the CEC of the soil and multiplying by 100 (Landon, 2014).
The pressure plate membrane at 0.33 and 15 bars was used to determine the soil moisture content at field capacity and permanent wilting point, respectively. Available water holding capacity was estimated from the difference between the water content at field capacity and the permanent wilting point.
2.6 Soil quality improvement analysis
Soil quality improvement was examined by calculating the soil quality index as described by Leul et al. (2023). Principal component analysis (PCA) was used as a factor extraction method to group measured soil properties into different principal components and select the minimum dataset (MDS) of soil quality indicators that best represent soil quality function (Leul et al., 2023). In this study, 18 measured and derived soil quality indicators were subjected to correlation and PCA. The PCA helps to reduce the dimension of the dataset without losing any information and select the most important indicators of the soil quality while correlation was useful to understand the relationships among soil properties. In each PC, the indicator with the highest factor loading (greater than or equal to 0.7) absolute value is selected for further scoring. Multivariate correlation was used to reduce the redundancy of the data when more than one factor was retained under one PC (Gelaw et al., 2015; Guteta and Abegaz, 2017). One or more soil quality indicators that best represent soil quality function were nominated in each PCs considering the highest factor loading and bivariate correlation analysis results.
The scores of MDS indicators were determined using a linear function as a function of their performance of soil function using Equation 2 and Equation 3 for “less is better” and “more is better” correspondingly (Tesfahunegn, 2016; Yu et al., 2018).
Accordingly, selected soil quality indicators were combined into a single index, and the soil quality index was calculated using Equation 4 as described by Leul et al. (2023).
2.7 Statistical analysis
A normality test was performed to determine whether the data were normally distributed, using the Shapiro–Wilk normality test (Hanusz and Tarasińska, 2015) with a significance level greater than 0.05. Thus, non-normally distributed parameters were transformed using logarithmic transformation (Sedgwick, 2012).
Descriptive and inferential statistics such as mean, analysis of variance (ANOVA), and multivariate analysis were applied to data from disturbed and undisturbed soil samples. The relevant test statistics were applied to different soil quality indicators, and it was determined whether there was a significant difference before and after the implementation of SWCP, as well as the interaction effect of landscape and types of structures. Due to a lack of replicated data, paired samples T-tests were performed to compare bulk density, soil moisture, and then available water content and total porosity data of correlated samples.
Soil data from disturbed samples were analyzed using one-way ANOVA to test the overall effects of SWCP on soil quality indicators (SQI), before and after the implementation of SWCP. Concomitantly, two-way ANOVA was made to test the interaction effects of landscape and conservation practices on soil physicochemical properties as indicated in Supplementary Table S1. Tukey (HSD) multiple comparisons test was used to distinguish differences among treatment means.
All significant tests were carried out at a significance level of p < 0.05 unless specified. The statistical analysis was manipulated using Statistical Package for Social Scientists (SPSS) V 26.0 (IBM Corporation, United States).
3 Results
3.1 Effects of SWC interventions on soil physical quality
3.1.1 Soil bulk density and total porosity
There was a significant (p < 0.05) difference in soil bulk densities before and after the implementation of SWCP (Table 2). As shown in Supplementary Table S2, the mean bulk density value before the implementation of SWCP (1.44 g cm−3) was greater than after the implementation of SWCP (1.28 g cm−3). The study found that SWCP reduces bulk density by 11% on average, but the magnitude varies by landscape unit (Supplementary Table S2).
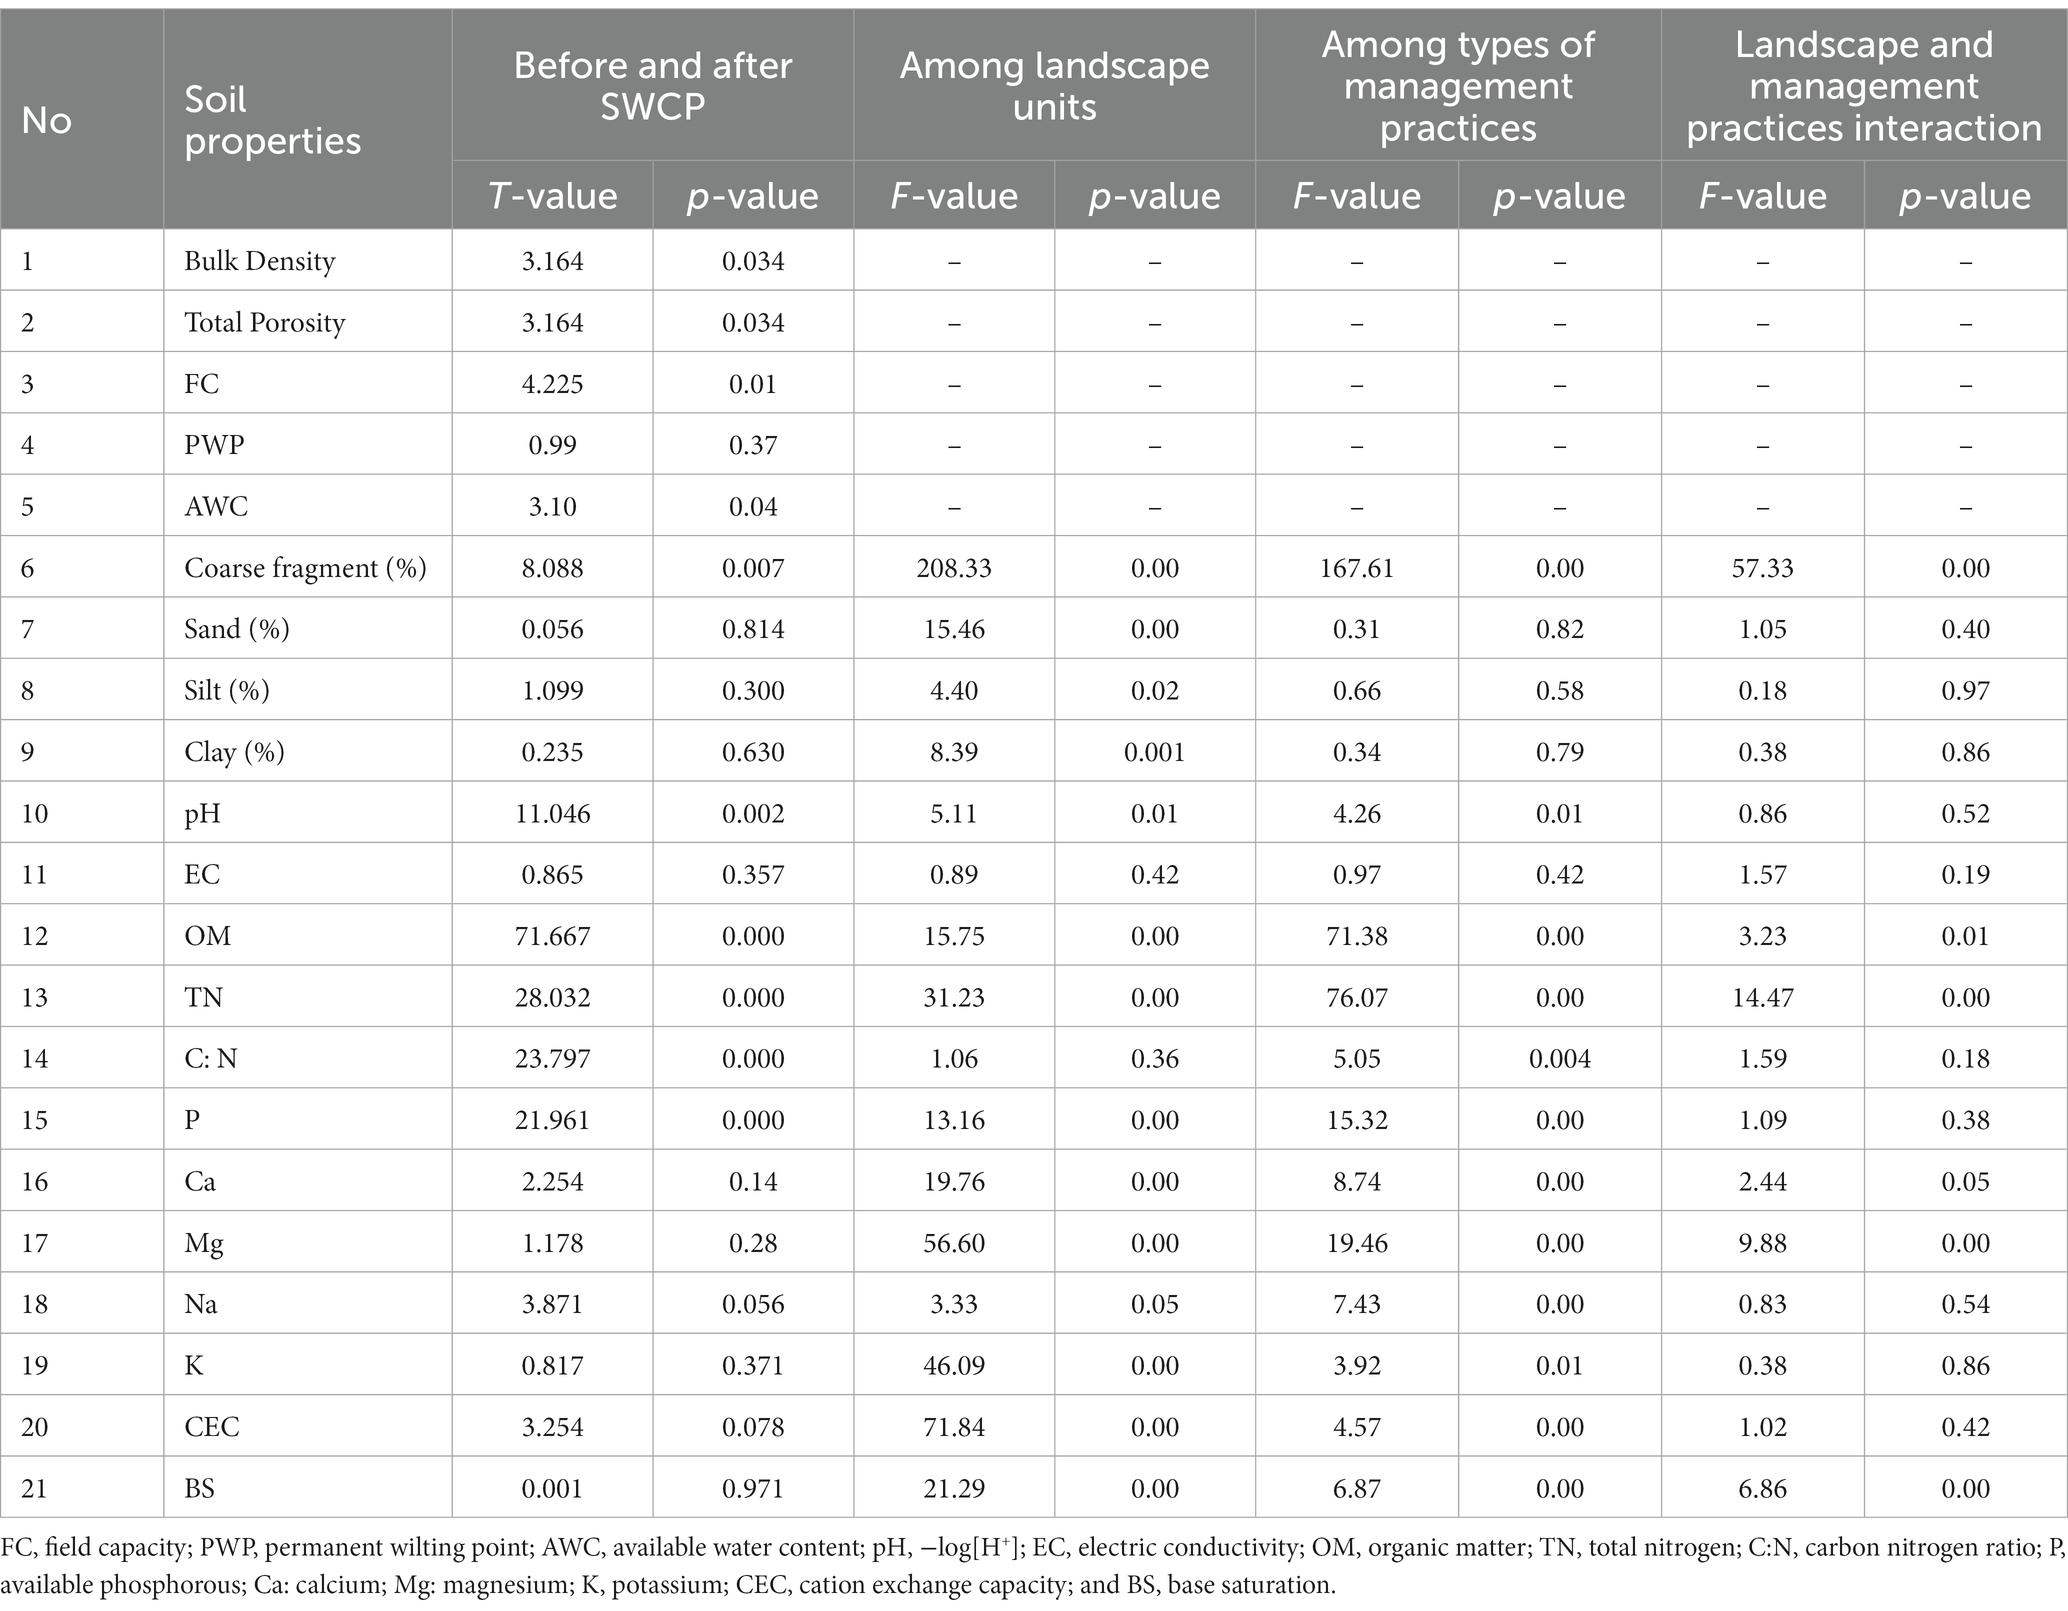
Table 2. Statistical significance level of main effects and their interactions.
Soil total porosity ranged from 42.45 ± 10.38% before the implementation of SWCP and changed to 53.20 ± 0.00% after the implementation of SWCP. The mean total porosity after SWCP implementation was significantly higher (51.7%) than before SWCP implementation (45.7%) and the difference was significant at p < 0.05 (Table 2). The implementation of SWCP resulted in an average 13% improvement in total porosity (Supplementary Table S2; Figure 2).
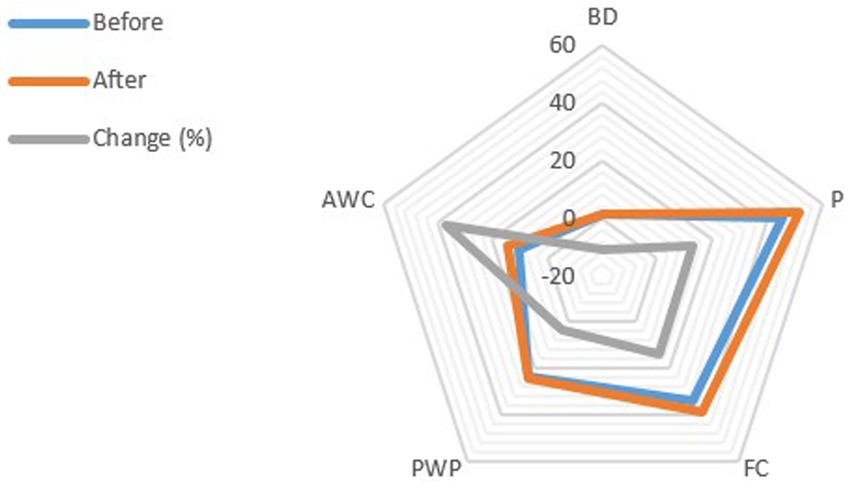
Figure 2. Soil physical and hydrological properties before and after the implementation of SWCP and percent changes due to SWCP (BD-bulk density; P-total porosity, FC-field capacity; PWP-permanent wilting point and AWC-available water content).
3.1.2 Soil moisture content
The moisture contents of soils improved significantly following the implementation of SWCP as indicated in Supplementary Table S3, and the difference was significant for field capacity (FC) (p = 0.01) and available moisture content (p = 0.04; Table 2). In contrast, there was a non-significant difference for permanent wilting point (PWP) (p = 0.37). The volumetric moisture content after the implementation of SWCP (14.14%) was higher than before SWCP implementation (10.31%) (Supplementary Table S3). Similarly, soil FC after the implementation of SWCP (38.27%) was considerably greater than before SWCP implementation (33.59%).
The AWC was significantly higher in treated soils than in untreated soils, but it varied both in space and time (Figure 2). The highest mean AWC recorded after SWCP implementation was 14.14 ± 0.88%, whereas the mean AWC before the SWCP was 10.31 ± 1.17% as presented in Supplementary Table S3.
3.1.3 Coarse fragment
There was a significant (p < 0.01) difference in the proportion of coarse fragments before and after the implementation of SWCP (Table 2). The mean percentage of coarse fragments before the implementation of the SWCP was 6.8% which changed to 4.1% after the implementation of the SWCP.
The interaction of landscape and conservation practices had a significant effect on the percentage of coarse fragments, at p < 0.01. The highest mean coarse fragments, 13.73% were observed in soil samples taken from non-conserved plots in the middle landscape in 2022 (Table 3).
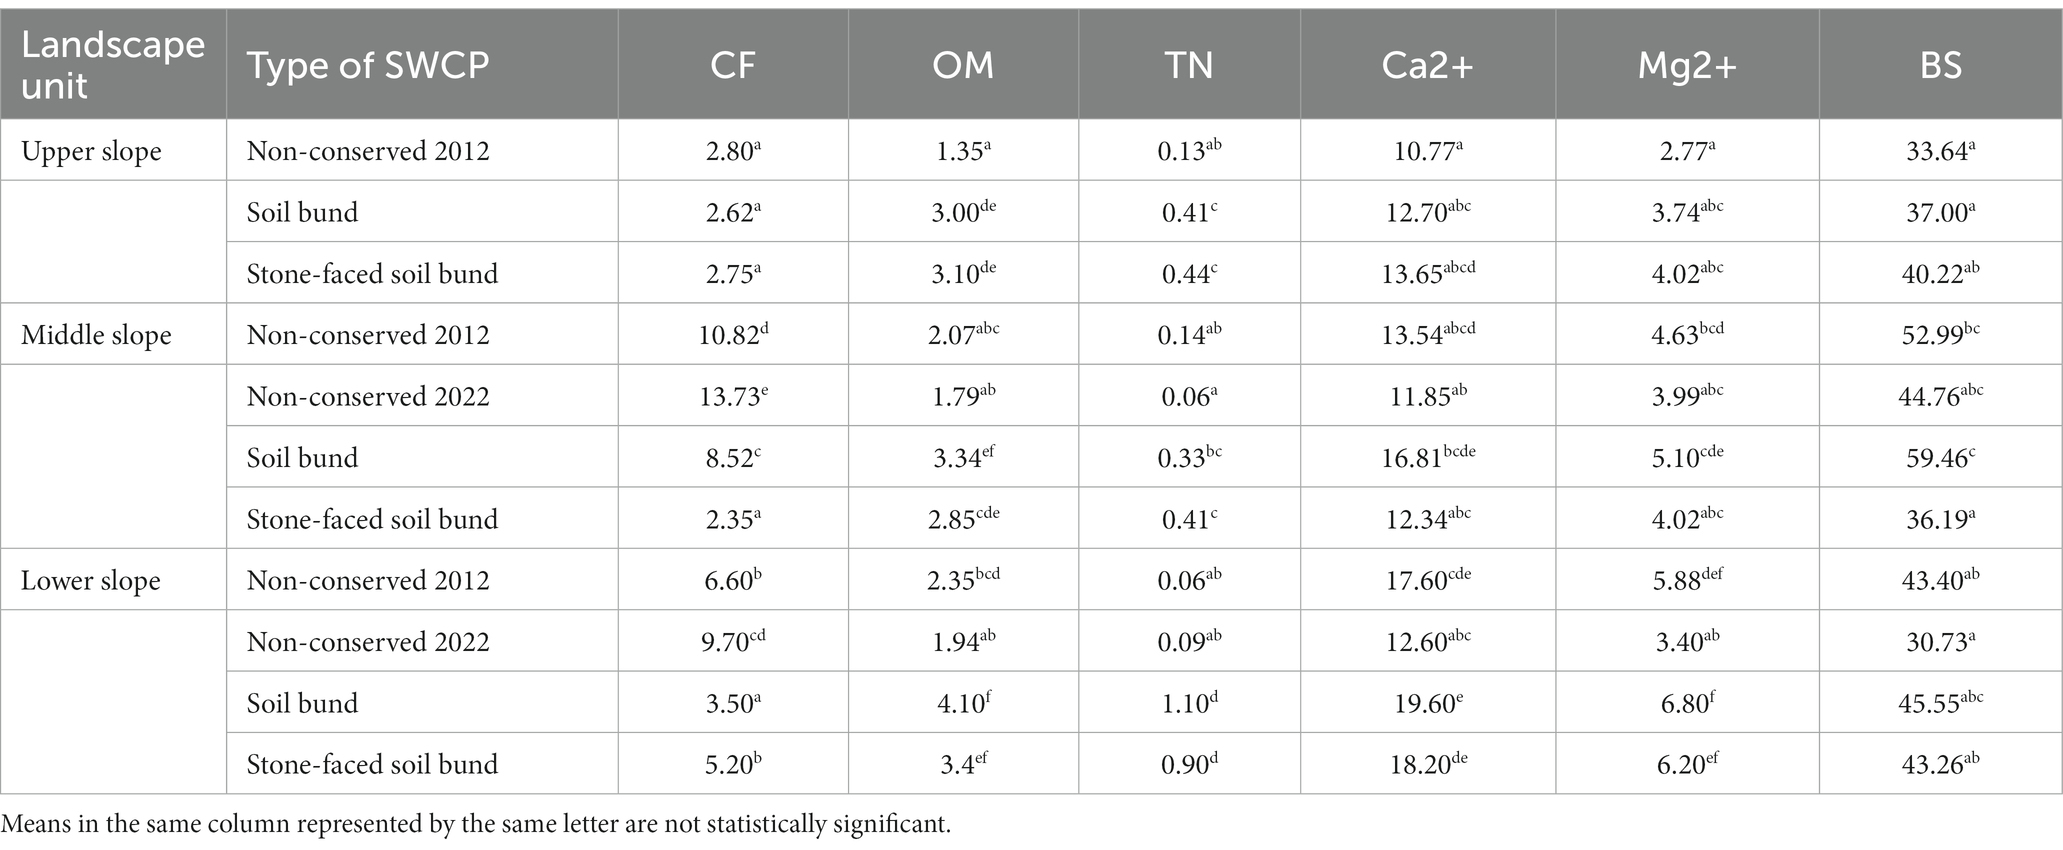
Table 3. Effects of landscape units and types of SWCP on coarse fragments (CF), organic matter (OM), total nitrogen (TN), calcium (Ca2+), magnesium (Mg2+), and base saturation (BS).
3.1.4 Particle size distribution
There was no significant difference in sand, silt, and clay content before and after the implementation of SWCP (Table 2). However, the proportion of sand and clay was slightly reduced while the percentage of silt was slightly higher after the implementation of SWCP as compared to before the implementation of SWCP (Figure 3).
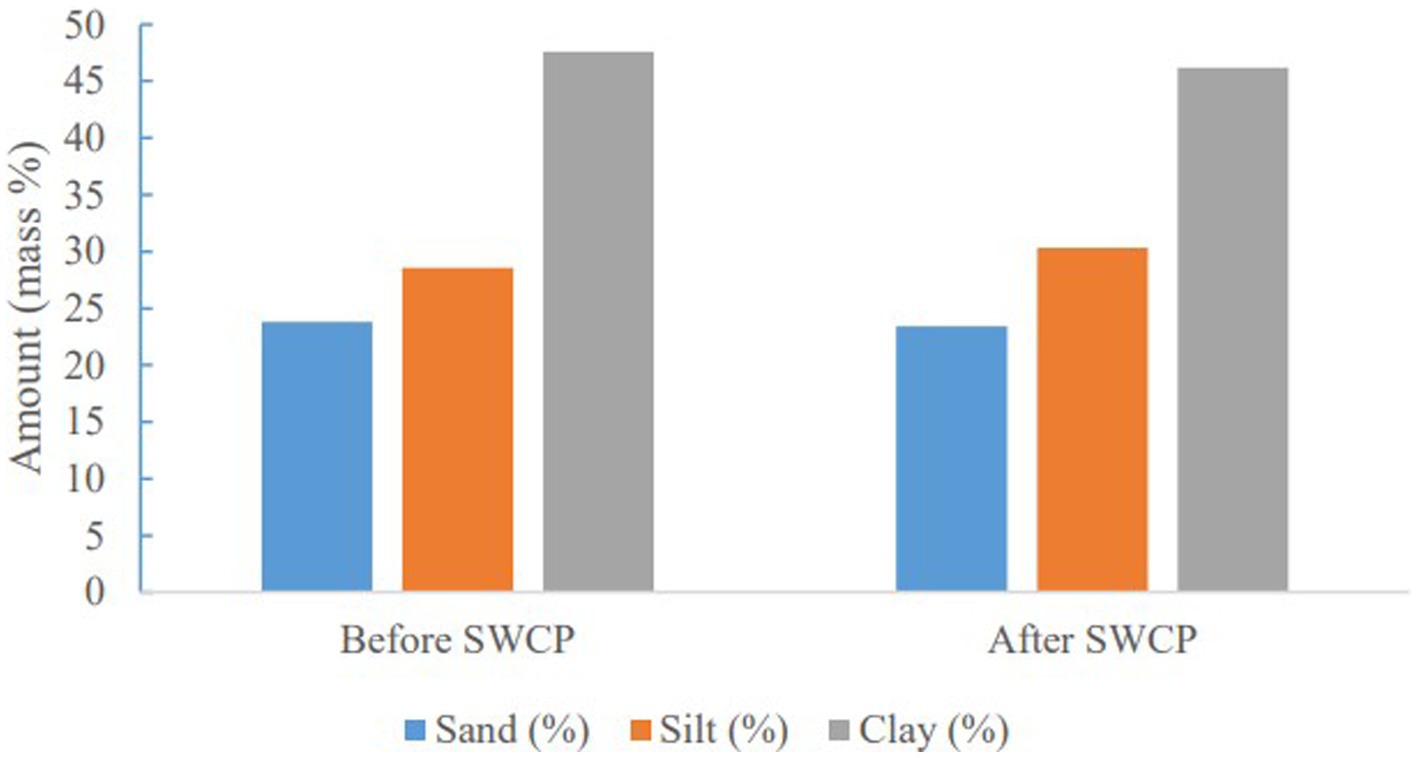
Figure 3. Effects of SWCP on sand, silt, and clay content of soils.
The interaction effect of landscape and conservation practices on sand (p = 0.4), silt (p = 0.97), and clay (p = 0.86) content were statistically non-significant. Similarly, the effect of conservation practices had no significant effect on sand, silt, and clay content (Table 2). Landscape, on the other hand, had a significant effect on sand and clay content at p < 0.01 and silt content at p < 0.05. The lower landscape had the highest clay content (58.19%) as indicated in Supplementary Table S5.
3.2 Effects of SWC interventions on soil biochemical properties
3.2.1 Soil organic matter
The organic matter content of the soil demonstrated a significant variation between before and after the implementation of SWCP at p < 0.01 (Table 2). The mean organic matter content of soils was 1.84% before the implementation of SWCP and increased to 3.21% after the implementation of SWCP.
The landscape and conservation practices interaction had a significant (p = 0.015; Table 2) effect on soil organic matter content. Soil bund (4.10%) and stone-faced soil bund (3.41%), accounted for the highest mean organic matter content (Table 3; Figure 4). When compared to other treatment combinations, the plots without conservation structures accounted for the least amount of organic matter content. Overall, when compared to 2012 measurements, both soil and stone-faced soil bunds increase soil organic matter content across all landscapes, but the magnitude was greater in the lower landscape than in the middle and upper landscape positions (Figure 4).
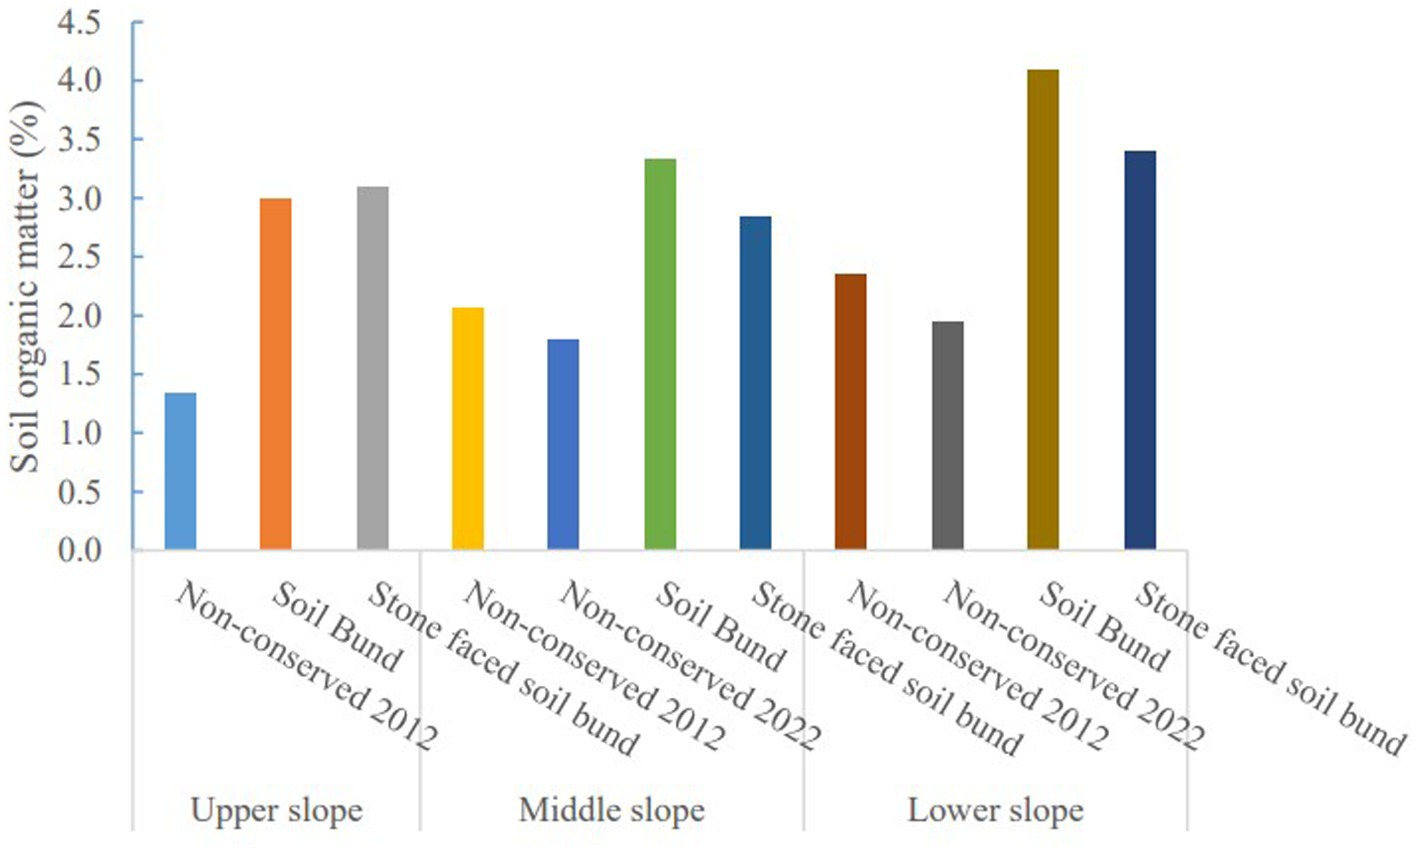
Figure 4. Representation of the effect of landscape and conservation practices on soil organic matter content.
3.2.2 Soil pH and ECe
There was a significant difference in pH value (p < 0.01) before and after the implementation of SWCP but exhibited a non-significant difference in electric conductivity (p = 0.36). The mean pH value was 5.69 before the implementation of SWCP and drastically lowered to 5.25 after the implementation of SWCP.
The interaction effects of landscape and conservation practices did not affect soil pH and ECe. Unlike ECe, soil pH was significantly affected by both the main effects of landscape and conservation practices (Table 2). The mean soil pH value in the lower landscape (5.74) was substantially higher than the upper and middle landscape’s (5.33) as presented in Supplementary Table S5. The mean soil pH value of non-conserved plots sampled in 2012 (5.69) and in 2022 (5.55) was significantly higher when compared with farm plots treated with both stone-faced soil bunds and soil bunds (Supplementary Table S4).
3.2.3 Soil total nitrogen
The analysis of variance performed before and after the implementation of the SWCP revealed a significant variation (p < 0.01) in the total nitrogen content (Table 2). The mean total nitrogen was 0.12% before the implementation of the SWCP and increased to 0.58% following the implementation of the SWCP.
The interaction effect of landscape and conservation practices on the mean total nitrogen content was significant (p ≤ 0.01; Table 2). When compared to other interactions, lower landscape soil bunds (1.10%) and stone-faced soil bunds (0.90%) had the highest mean TN (Table 3). Farm plots without conservation structures (from 0.06–0.14%; Table 3) at three landscape positions accounted for the least nitrogen content. Overall, both soil and stone-faced soil bunds increase nitrogen content, but the magnitude was greater at lower than middle and upper landscapes. The lower landscapes had very low nitrogen content as compared to other landscape units in 2012 but improved faster than the middle and upper landscapes after SWCP treatment.
3.2.4 Available phosphorous
There was a significant (p < 0.01) difference in available phosphorous content (Table 2) between before and after the implementation of SWCP. The mean available phosphorous content was 5.54 ppm before SWCP and significantly increased to 10.19 ppm after the implementation of SWCP.
Available phosphorous was non-significantly affected by the interaction effects of landscape and conservation practices, but significantly affected by the main effects of conservation practices and landscape positions (Table 2). Results from plots with stone-faced soil bunds (10.48 ppm) and soil bunds (9.91 ppm) had a significantly higher mean available phosphorous (Supplementary Tables S4, S5). Furthermore, the mean available phosphorous was significantly higher at the upper landscape (10.54 ppm), followed by the middle (7.17 ppm) and lower landscape (4.81 ppm).
3.2.5 Exchangeable bases
The statistical analysis result showed non-significant differences for calcium (p = 0.14), magnesium (p = 0.28), sodium (p = 0.05), and potassium (p = 0.37) content between before and after the implementation of SWCP. However, as presented in Table 3, unlike potassium and sodium, the interaction effect of landscape and conservation practices was significant for magnesium (p < 0.01) and calcium (p < 0.05) content.
Landscape had a significant effect on potassium content (p < 0.01) and sodium content (p < 0.05; Table 2). The highest mean sodium (0.16 Cmolc kg−1) and potassium (1.04 Cmolc kg−1 soil) content were observed in the lower landscape as indicated in Supplementary Table S5. Moreover, conservation practices have a significant effect on sodium (p ≤ 0.01), and potassium (p ≤ 0.01) content. Plots with soil bunds (0.18 Cmolc kg−1 soil) had the highest sodium content as compared with other treatments (Supplementary Table S4).
3.2.6 Cation exchange capacity and base saturation
There was a non-significant difference in CEC (p = 0.08) and percent BS (p = 0.97) before and after the implementation of SWCP. Similarly, CEC was non-significantly affected by the interaction effects of landscape and conservation practices. But, the interaction effect of landscape and conservation practices on BS was significant (p < 0.01). Soil bunds in the middle (59.46%) and lower landscape (45.55%) showed the highest mean base saturation (Table 3).
Conservation practice, both in space and time has a significant effect on CEC (p ≤ 0.01). The highest significant mean CEC was observed on soil bunds (46.28 Cmolc kg−1) and stone-faced soil bunds (48.17 Cmolc kg−1 soil) treated farm fields (Supplementary Table S4). Similarly, the landscape had a significant effect on CEC (p < 0.05). The highest CEC (58.05 Cmolc kg−1 soil) was observed on the lower landscape (Supplementary Table S5).
3.3 Soil quality indicators
To effectively describe the soil quality dynamics in the research area, about 18 soil parameters were used for principal component analysis. Principal component analysis (PCA) extracted three components that have eigenvalue greater than one and explained 91% of the total variability. PCA1, PCA2, and PCA3 accounted for 41.47, 30.03, and 19.50% of the variability in the same order (Table 4). Major indications under each principal component were attributed to a significant weight loading and variance. As shown in Table 4, PCA1 accounts for 41.47% of the variance in soil quality and is regarded as the best soil quality indicator in this study. In PCA1, the highly loaded variables are organic matter (OM), total nitrogen (TN), and available phosphorous accounted for 0.81, 0.71, and 0.71, respectively. Organic matter has the highest load and hence retained and the correlation of the other variables was checked. The correlation between organic matter with total nitrogen was significant (Supplementary Table S6). Hence, total nitrogen was not retained in PCA1. The correlation between organic matter and available phosphorous was not strong, therefore it was retained in the first PCA. Thus, based on their larger weight loading, soil organic matter, and available phosphorous content were the two most heavily weighted variables under PCA1 and considered soil biological quality components.
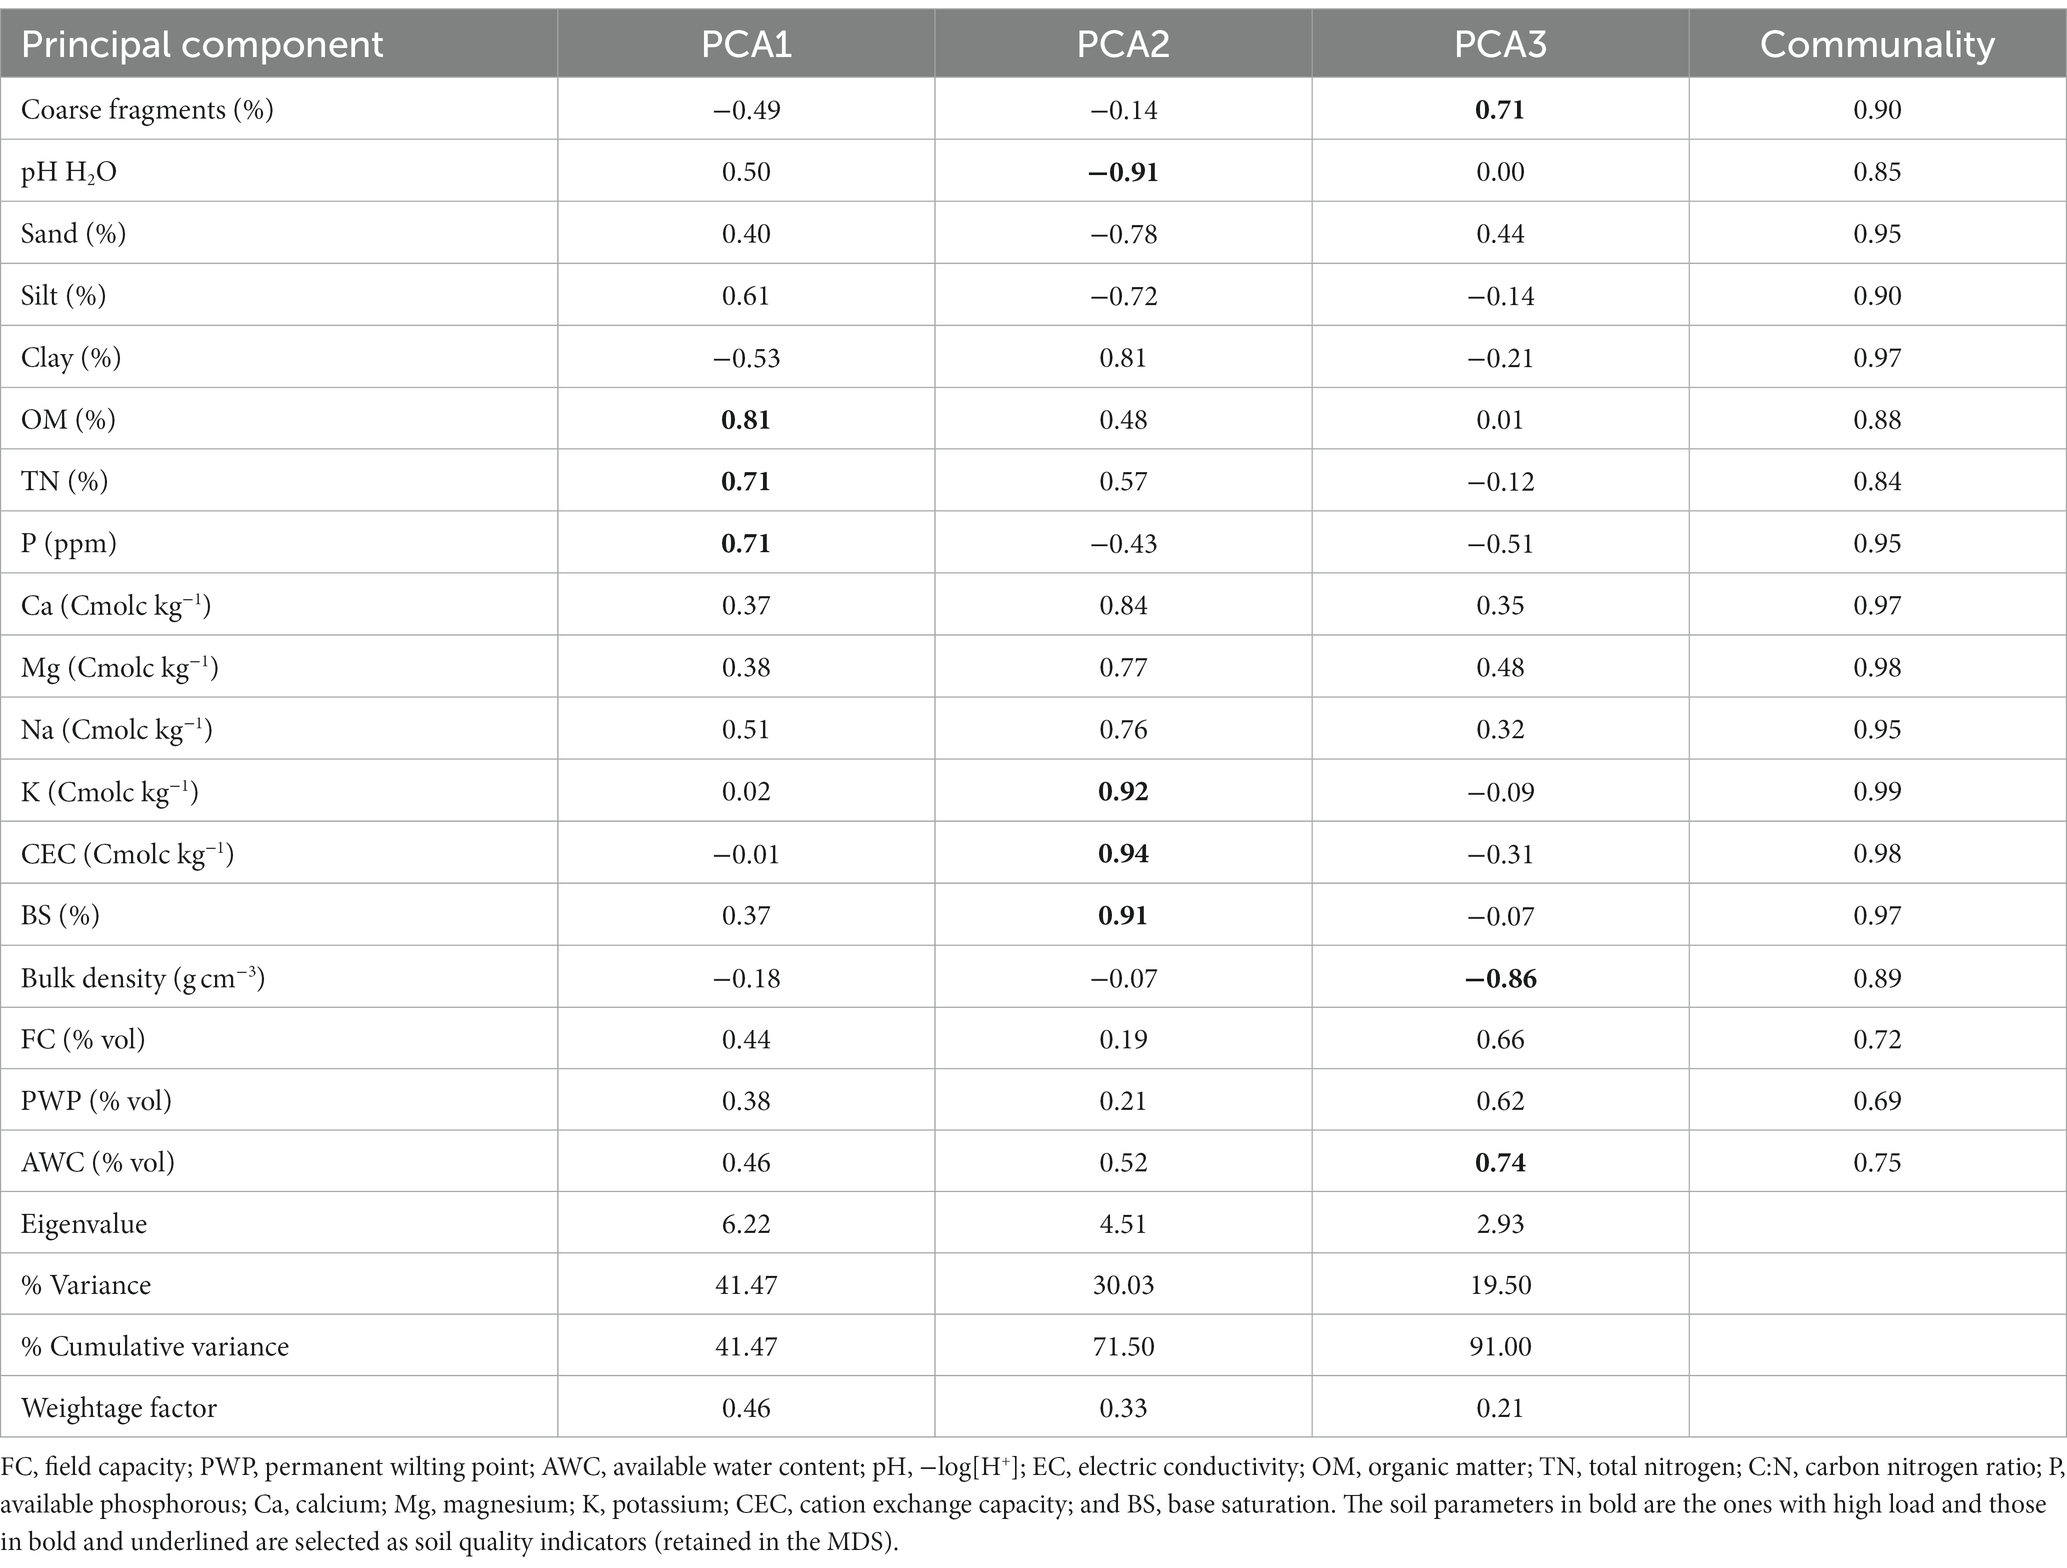
Table 4. Results of PCA for soil attributes from different types of conservation practices and landscape positions based on the minimum data set (MDS) method.
In the second factor (PCA2), the high load variables are cation exchange capacity, exchangeable potassium, soil pH and base saturation with high weighted variables of 0.94, 0.92, 0.91, and 0.91, respectively (Table 4). Due to a significant correlation between cation exchange capacity and exchangeable potassium (Supplementary Table S6), exchangeable potassium was not retained. As a result, the CEC, pH, and BS were kept for the minimum data set (MDS) requirement in PCA2. This PCA2 is renamed as “chemical quality component.”
Soil bulk density, available water holding capacity (AWC), and percent coarse fragment had a high load in the third component that accounted for 19.5% of the variability (Table 4) and found no strong correlation between variables. The minimum data set in PCA3 includes bulk density, available water capacity, and coarse fragment. This component represented the “soil physical quality component”.
3.4 Soil quality improvements in conserved landscape
To further understand the impacts of soil and water conservation on soil quality, a weighted additive soil quality index (SQI) generated from the PCA was developed. According to the PCA and correlation, the contents of soil organic matter, available phosphorous, pH, cation exchange capacity, bulk density, available water holding capacity, and contents of coarse fragments were selected as the primary indicators of the soil quality index, as shown in Table 4.
The difference in SQI between treatments was statistically highly significant (p = 0.00). The difference in treatment means is also statistically significant. However, no significant differences were observed between untreated fields in 2012 and 2022, or between soil bunds and stone-faced soil bunds (Figure 5). Based on the weighted additive soil quality index and the limited data set, the soil quality index in this study varied from 0.53 to 0.74. The mean soil quality index for soil samples obtained in 2012 (before SWCP) was 0.56, but it declined to 0.53 for non-conserved agricultural plots assessed in 2022, suggesting a 5.26% fall in overall soil quality, as indicated in Figure 5, Table 5, and Supplementary Table S7. For conserved plots, stone-faced soil bund has the lowest soil quality index (0.73), while soil bund has a soil quality rating of 0.74 (Table 5). The study area’s soils were originally classified as high soil quality (0.56), but soil bunds and stone-faced soil bunds improved to very high soil quality indexes of 0.74 and 0.73, respectively. Soil and water conservation practices improved soil quality by 32% for stone-faced soil bunds, 33% for soil bunds, and declined by 5.26% for areas without soil and water conservation practices. However, soil quality index was non-significantly affected by landscape units (p = 0.14) and the interaction effects of landscape and conservation practices (p = 0.6).
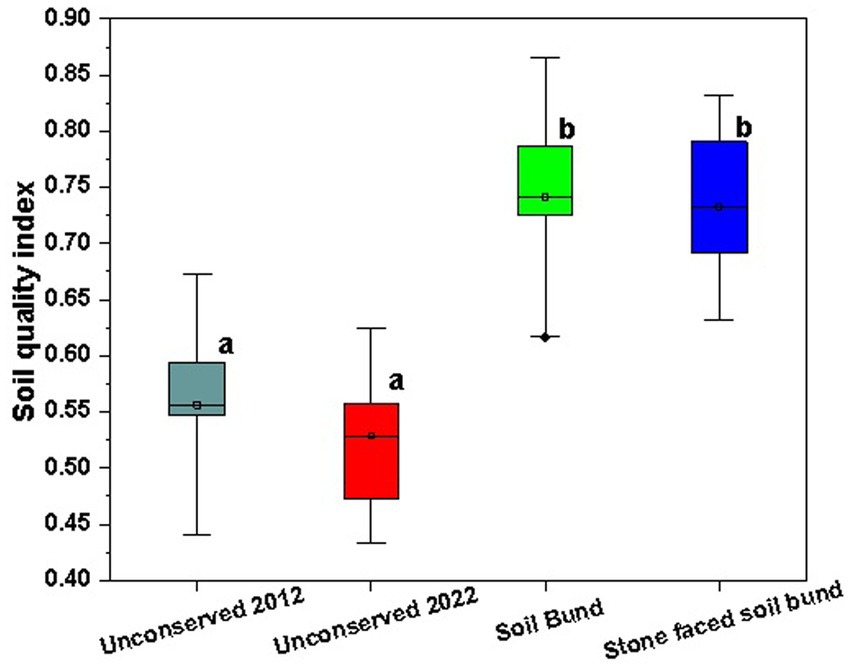
Figure 5. SQI for the different soil and water conservation practices (SWCP), unconserved fields before SWCP (2012) and unconserved fields after SWCP (2022) (means represented by the same letter are not significant at p < 0.05 level).
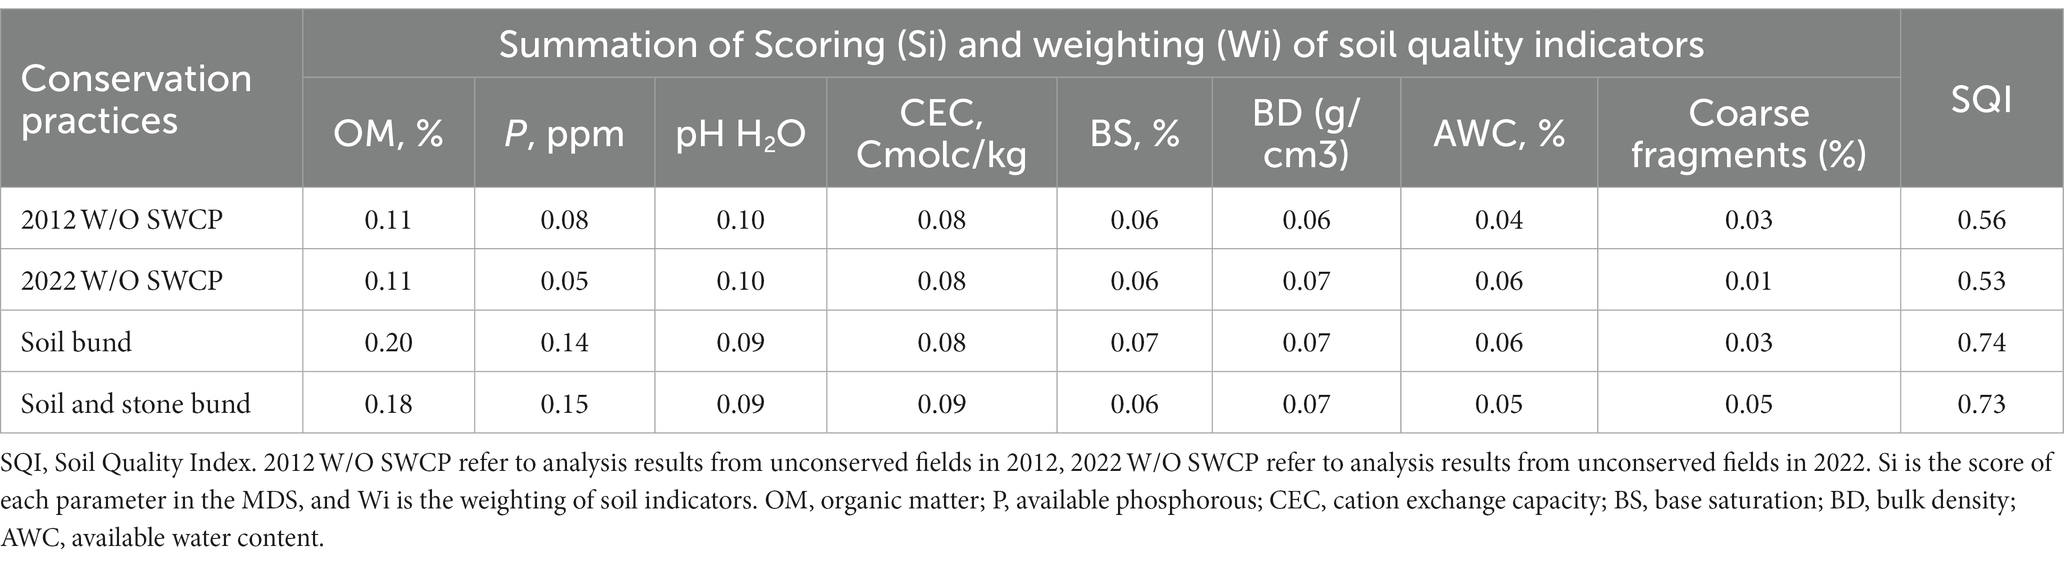
Table 5. Soil quality index computations.
Table 6 and Supplementary Figure S1 show the observed association between soil quality indicators and soil quality index. The soil quality index and available phosphorous (R2 = 0.70) and organic matter (R2 = 0.68) had a significant and positive correlation. There was a modest correlation with percent coarse fragment (R2 = 0.41), bulk density (R2 = 0.3), and cation exchange capacity (R2 = 0.23), as well as extremely low associations with percent base saturation and available water holding capacity (Table 6; Supplementary Figure S1).
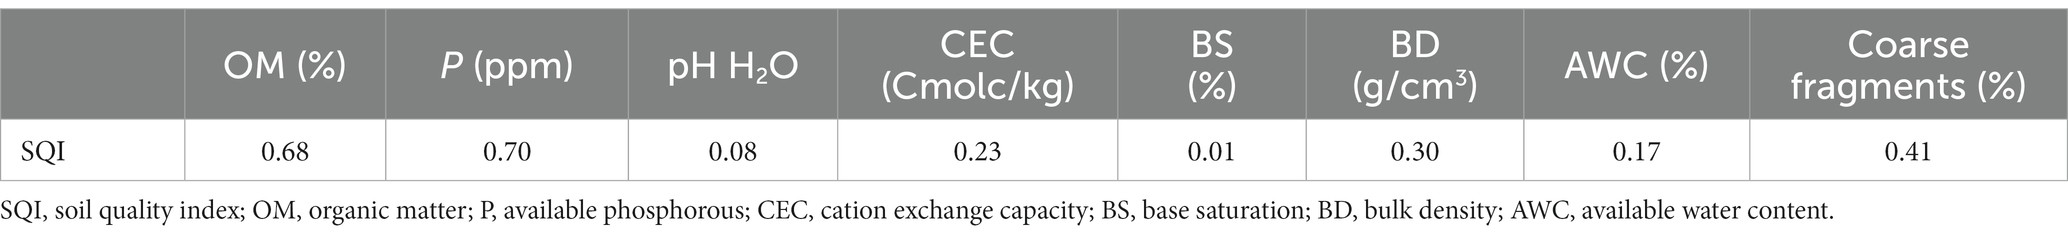
Table 6. Relationships between soil quality index (SQI) and soil quality indicators expressed using R2.
4 Discussion
4.1 Effects of SWC interventions on soil physical quality
Following the implementation of the SWCP, there was a considerable improvement in total porosity (13%), available soil moisture, and FC soil moisture, as well as a decrease in bulk density (10%) and coarse fragments. The lower mean bulk density and higher total porosity implied from higher improvement in soil organic matter after the implementation of SWCP. Siraw et al. (2020) and Taye et al. (2022) revealed parallel findings in conserved watersheds in Ethiopia, which were generally ascribed to reduced slope gradients, slower runoff, and improved sediment and soil organic matter settlement. These innovations have an agreement with the present study described that SWCP accumulates soil organic matter and lower bulk density.
In the present study, SWCP improved FC, and available water holding capacity as a result of organic matter improvement and reduced soil erosion rates due to decreased runoff, enhanced infiltration, and thereof soil moisture content. This is because of the shorter slope length that created a runoff barrier and enhanced soil water-holding capacity, thereby filling soil pores with moisture within the conserved areas. This pattern corresponds to the findings of Tolesa et al. (2021), Tiki et al. (2015), Pramanick et al. (2022), and Siraw et al. (2020). This is owing to the improvement of organic matter and retention of soil particles due to the implementation of SWCP. The observed differences indicated the potential of SWCP to improve key soil biological and hydrological properties.
The percent of coarse fragments decreased significantly after the implementation of SWCP. This means that non-conserved soils are more prone to erosion and contain a higher percentage of coarse fragments than conserved soils. This is because bund reduced the loss of soil particles (Amare et al., 2013; Belayneh et al., 2019) and lowered the percentage of coarse fragments indirectly. When compared to the respective data from non-conserved plots in 2012, there was a substantial increase in coarse fragments on non-conserved plots sampled in 2022. Welemariam et al. (2018), reported comparatively greater percentages of coarse fragments on non-conserved grazing pastures, while terraces had significantly lower percentages of coarse fragments in Ethiopia highlands.
Significant changes in soil texture were not anticipated within the study time frame because the process of soil formation takes several years to alter soil texture. The modest change in the percent sand, silt, and clay in this study could be attributed to the process of particle removal from one portion of the watershed and deposition in another location within the study area. This is consistent with the findings of Tolesa et al. (2021) and Siraw et al. (2020), who found no significant differences in sand, silt, and clay content following the implementation of SWCP, due to the short duration of the watershed practice, which was 8 years, which cannot make a significant difference in weathering of materials. Demelash and Stahr (2010), on the other hand, found a substantial difference in soil texture after 10 years of conservation. The disparities in percent sand, silt, and clay in the upper, middle, and lower slopes were attributable to clay migration downward at any condition including conserved fields. Because of the increased deposition of enormous masses of clay down the slope, the clay content of the soil increases from the upper to the lower landscape. This conclusion is similar to the findings of Hishe et al. (2017) and Tamene et al. (2017), who found substantial changes in soil particles with landscape position. This means that SWCPs are ineffective at retaining clay materials in high rainfall sub-humid ecosystems when fine clay materials are prone to moving with the removal of surplus water.
4.2 Effects of SWC interventions on soil biochemical properties
A 75% increase in soil organic matter content could be attributed to increased root and above-ground biomass and deposition and retention of organic matter due to the implementation of SWCP. This difference was caused by increased deposition and biomass cover as a result of SWCP implementation. Several researchers reported similar findings (Hishe et al., 2017; Alewoye Getie et al., 2020; Guadie et al., 2020; Laik et al., 2021). Furthermore, increased soil organic matter content has a positive impact on soil quality indicators such as water holding capacity, total porosity, bulk density, pH, and total nitrogen which improves water availability, aeration, rooting condition, and fertility quality components in conserved plots.
The considerable decrease in soil pH could be caused by an increase in soil organic matter, increased infiltration, and leaching of soluble ions in subhumid areas following the implementation of SWCP. The leaching of cations from upper and middle landscapes and deposition in the lower landscapes could be a major reason for the differentiation of soil pH across landscapes. This result is consistent with the findings of Erkossa et al. (2018) and Pham et al. (2018). In all the cases, SWCP significantly lowerd soil pH value. This implies, soil pH slightly decreased with time without the implementation of SWCP mainly due to continuous leaching of basic cations and pH significantly decreases with the implementation of SWCP mainly due to improvement in soil organic matter content. Similar results were reported by Belayneh et al. (2019) and Demelash and Stahr (2010) in the highlands of Ethiopia.
The effect of SWCP on total nitrogen was significant and this coincides with Yifru and Miheretu (2022), Yaekob et al. (2022), Tolesa et al. (2021), Siraw et al. (2020), Mengistu et al. (2016), Dagnew et al. (2015), and Demelash and Stahr (2010) reported higher nitrogen content in terraced landscapes. Without SWCP, nitrogen content declined by 57% on the middle landscape and increased by 50% on the lower landscape. This discrepancy was attributed to nitrogen removal from upper and middle landscapes and its deposition to lower landscapes and the retention capacity of bunds. Studies confirmed the existence of the highest total nitrogen in lower landscapes and conserved farm fields (Assefa et al., 2020).
The increase in phosphorous content was mainly due to the overtime accumulation of phosphorous fertilizer application and less soil erosion and less removal of available and applied phosphorous because of SWCP. Similar implications have been reported by Tanto-Doko (2022). Overall, there was a slight decrease in mean available phosphorous from non-conserved farm plots sampled in 2022 as compared to 2012 due to continuous soil erosion. However, there was a significant increase in mean available phosphorous content due to SWCP as compared to non-conserved plots sampled in both 2012 and 2022. Phosphorous was higher in upper than lower lopes. This assessment result was attributed to the high rates of application of phosphorous fertilizers at the upper landscape dominated by Nitisols and Luvisols along with being less liable to leaching, unlike other nutrient elements. The lower landscape is dominated by Vertisols, which are clayey and have a high organic matter content, and where the soil phosphorous content is prone to fixation problems due to a clayey organic matter complex.
Exchangeable bases (Ca2+, Mg2+, K+, and Na+) are weathering derived. Therefore, no significant changes are envisaged within the years of SWCP implementation. However, there were significant differences in the interaction effect of landscape and management practices on Ca and Mg. In each instance, the maximum calcium and magnesium content was observed in soil bunds constructed at the lower landscape, where exchangeable bases are soluble with runoff water and liable to drain downslope and excellently retained by soil bunds of lower landscapes. On the other hand, the main effects of landscape and management practices on Na and K content are significant due to the effect of conservation structures on the erosion processes, which affect the distribution of basic cations over upper, middle, and lower landscapes. This could also be related to their removal from the upper slopes and depositions in the lower slopes. The findings of Noorbakhsh et al. (2008) also reported significant differences in available K among landscapes which increased downslope. The significantly higher K and Na were observed on plots with soil and stone-faced soil bunds and this result is consistent with the reports of Amare et al. (2013) and Taye et al. (2022), which clarified the accumulation of soluble bases in conserved fields.
Lower and middle landscapes received bases from upper landscapes and conserved the existing ones due to SWCP, hence a high percent is expected. However, the larger CEC at lower landscapes may result in a low percent base saturation. Nonetheless, due to SWCP, which lowers cation removal and favors cation deposition in the upper landscape, the percent base saturation stays high in the lower landscape but slightly lower than in the middle landscape. This conclusion was related to increased clay and organic matter content at lower landscape positions. Cation exchange capacity varies with clay content, type, and soil organic matter. Vertisols in lower landscapes typically have high CEC values due to smectitic clay mineralogy and increased clay content. However, Nitisols with kaolinitic mineralogy in the upper landscape tend to have low CEC.
4.3 Soil quality improvement
Soil and water management-induced soil dynamics were assessed using the soil quality index. The assessment was based on 8 selected soil quality indicators which were systematically regrouped into biological, chemical, and physical soil quality components. The highest contribution for the SQI was found for soil biological properties (organic matter content and available phosphorous) weighted about 46%, followed by chemical properties (soil pH, cation exchange capacity, and percent base saturation) weighted 33%, and physical properties (bulk density, available water holding capacity) which have 21% contribution. In this study, organic matter content contributed 25% of the soil quality index. Soil biology is an excellent indication of soil quality and health since soil organic matter content impacts nutrient reserve, soil structure, infiltration rate, water retention capacity, and numerous soil ecological functions (Ngangom et al., 2020; Cai et al., 2022; Hassan et al., 2022). In tropical ecosystems, soil fertility is also an important quality component that impacts soil productivity as well as controlling soil biological, chemical, and physical features (Schiefer et al., 2015; Erkossa et al., 2018). Furthermore, soil pH influences nutrient availability and toxicity, which influences soil health and crop yield (Khelil et al., 2020; Kebede et al., 2022). Soil moisture impacts crop production in any ecosystem (Uwizeyimana et al., 2018; Wen et al., 2021). Bulk density is a basic quality indicator that affects soil strength and stability (Koudahe et al., 2022). As a result, the three soil quality components explain soil quality dynamics in the study area and, most likely, in other sub-humid tropical ecosystems.
The overall soil quality improvement due to the implementation of SWCP was 32% for stone-faced soil bunds and 33% for soil bunds mainly from the complimentary effects of three soil quality components. However, soil quality decreased by 5.26% from 2012 to 2022 on farm plots without the implementation of soil and water conservation structures. This conclusion implies landscape-conservation practices were the best implementation strategy in sub-humid highland ecosystems to improve soil quality. This suggests that non-conserved soils are more prone to soil quality deterioration. This is why soil and stone-faced soil bunds reduce the deterioration of certain soil quality indicators (Amare et al., 2013; Belayneh et al., 2019).
The effect of SWCP on soil quality indicators shows considerable results in reversing soil quality degradation and improving soil biology, fertility, and hydrology. This can help to enhance land rehabilitation and increase land productivity. In addition to land rehabilitation, soil quality improvement at the landscape scale could enhance hydrological services, carbon sequestration, and crop productivity. However, there are wide variations among research reports, which may be related to differences in the level of efficiency of SWC measures due to differences in age and type of SWCP, quality of construction, scale of maintenance, and agroecology. The majority of soil quality indicators yielded meaningful findings in this investigation.
5 Conclusion
The study looked into the effects of SWCP on soil physicochemical properties and soil quality in a sub-humid ecosystem. SWC practices have been critical in reversing land degradation and limiting additional harm to land resources. According to the study results, soil and water conservation measures demonstrated a statistically significant difference in most soil quality indicators when compared to conventional farmlands. Organic matter, available phosphorous, cation exchange capacity, soil pH, percent base saturation, bulk density, available water holding capacity and percent coarse fragments could be most relevant indicators of changes in soil quality induced by soil and water conservation practices. The soil quality indexing showed that SWCPs improved soil quality by 32.15% overall. The level of improvement was 32% for stone bunds and 33% for soil bunds, in contrast to a 5.26% decrease in soil quality on farm fields without soil and water conservation practices from 2012 to 2022. As a result, the null hypothesis is invalid, and the study accepts the alternative once demonstrating that the highlighted soil and water conservation practices significantly improve soil physicochemical properties, soil quality, and crop productivity in Ethiopia’s subhumid environments. However, in terms of the present food insecurity and sustainability problem, overall improvement in soil quality remains lower. This might be attributed to inadequate farm management and maintenance, as well as a failure to prioritize the integration of various forms of SWC and agronomic practices capable of sustaining long-term advantages in soil quality, land productivity and ecosystem services. This implies that SCWP, which was limited to soil and stone-faced soil bunds like the majority of Ethiopian community watersheds, significantly affected the rate of improvement and shown the potential to improve even more than this value. Thus, in the future, integration of additional SWCP (agronomic and biological practices) would be the most likely alternative option for full-fledged soil quality enhancement.
We propose an additional soil quality study on best and integrated land management and its improvements in soil quality attributes, crop productivity and ecosystem services in the highlands of Ethiopia.
Data availability statement
The raw data supporting the conclusions of this article will be made available by the authors, without undue reservation.
Author contributions
AT: Conceptualization, Data curation, Formal analysis, Investigation, Methodology, Software, Writing – original draft. WA: Methodology, Writing – review & editing. MH: Writing – review & editing, Formal analysis, Software. DM: Writing – review & editing, Conceptualization, Investigation. FZ: Formal analysis, Writing – review & editing, Supervision. GD: Data curation, Formal analysis, Methodology, Supervision, Writing – review & editing. TA: Formal analysis, Methodology, Supervision, Writing – review & editing. ST: Writing – review & editing. MA: Conceptualization, Investigation, Writing – review & editing, Supervision.
Funding
The author(s) declare financial support was received for the research, authorship, and/or publication of this article. International Crops Research Institute for Semi-Arid Tropics provides financial support for publication of this article.
Acknowledgments
We are thankful to Ghent University for the support during a short research stay. The sustainable water management under pressure in Ethiopia project was providing a short research stay at Kiel University, Germany.
Conflict of interest
AT and WA were employed by Lihiket Design and Supervision Corporation.
The remaining authors declare that the research was conducted in the absence of any commercial or financial relationships that could be construed as a potential conflict of interest.
The author(s) declared that they were an editorial board member of Frontiers, at the time of submission. This had no impact on the peer review process and the final decision.
Publisher’s note
All claims expressed in this article are solely those of the authors and do not necessarily represent those of their affiliated organizations, or those of the publisher, the editors and the reviewers. Any product that may be evaluated in this article, or claim that may be made by its manufacturer, is not guaranteed or endorsed by the publisher.
Supplementary material
The Supplementary material for this article can be found online at: https://www.frontiersin.org/articles/10.3389/fsufs.2024.1270265/full#supplementary-material
References
Adem, A. A., Mekuria, W., Belay, Y., Tilahun, S. A., and Steenhuis, T. S. (2020). Exclosures improve degraded landscapes in the sub-humid Ethiopian highlands: the Ferenj Wuha watershed. J. Environ. Manag. 270:110802. doi: 10.1016/j.jenvman.2020.110802
Alemayehu, T., and Fisseha, G. (2018). Effects of soil and water conservation practices on selected soil physico-chemical properties in Debre-Yakob Micro-watershed, Northwest Ethiopia. Ethiop. J. Sci. Technol. 11, 29–38. doi: 10.4314/ejst.v11i1.3
Alewoye Getie, M., Legesse, S. A., Mekonnen, M., and Aschalew, A. (2020). Soil properties and crop productivity strategies as a potential climate variability adaptation options in Adefwuha watershed, Ethiopia. Earth Syst. Environ. 4, 359–368. doi: 10.1007/s41748-020-00156-8
Amare, T., Terefe, A., Selassie, Y. G., Yitaferu, B., Wolfgramm, B., and Hurni, H. (2013). Soil properties and crop yields along the terraces and toposequece of Anjeni watershed, central highlands of Ethiopia. J. Agric. Sci. 5:134. doi: 10.5539/jas.v5n2p134
Assefa, F., Elias, E., Soromessa, T., and Ayele, G. T. (2020). Effect of changes in land-use management practices on soil physicochemical properties in Kabe watershed, Ethiopia. Air Soil Water Res. 13:93958. doi: 10.1177/1178622120939587
Bekele, D. A., Gella, G. W., and Ejigu, M. A. (2022). Erosion risk assessment: a contribution for conservation priority area identification in the sub-basin of Lake Tana, North-Western Ethiopia. Int. Soil Water Conserv. Res. 10, 46–61. doi: 10.1016/j.iswcr.2021.04.010
Belayneh, M., Yirgu, T., and Tsegaye, D. (2019). Effects of soil and water conservation practices on soil physicochemical properties in Gumara watershed, upper Blue Nile Basin, Ethiopia. Ecol. Process. 8, 1–14. doi: 10.1186/s13717-019-0188-2
Bouyoucos, G. J. (1962). Hydrometer method improved for making particle size analyses of soils 1. Agron. J. 54, 464–465. doi: 10.2134/agronj1962.00021962005400050028x
Bremmer, J., and Mulvaney, R. (1982). Nitrogen Total method of soil analysis. American Society of Agronomy, Madison, pp. 575–624.
Cai, A., Tang, S., Waqas, M. A., Wang, B., Tian, D., Zhang, Y., et al. (2022). Magnitude, direction, and drivers of rhizosphere effect on soil nitrogen and phosphorus in global agroecosystem. Int. Soil Water Conserv. Res. 11, 482–493. doi: 10.1016/j.iswcr.2022.07.004
Chalise, D., Kumar, L., and Kristiansen, P. (2019). Land degradation by soil erosion in Nepal: a review. Soil Syst. 3:12. doi: 10.3390/soilsystems3010012
Chapman, H. (1965). Cation-exchange capacity. Methods of soil analysis: part 2. Chem. Microbiol. Properties 9, 891–901.
Dagnew, D. C., Guzman, C. D., Zegeye, A. D., Tibebu, T. Y., Getaneh, M., Abate, S., et al. (2015). Impact of conservation practices on runoff and soil loss in the sub-humid Ethiopian highlands: the Debre Mawi watershed. J. Hydrol. Hydromechanics 63, 210–219. doi: 10.1515/johh-2015-0021
Demelash, M., and Stahr, K. (2010). Assessment of integrated soil and water conservation measures on key soil properties in south Gonder, North-Western highlands of Ethiopia. J. Soil Sci. Environ. Manag. 1, 164–176.
Du, X., Jian, J., Du, C., and Stewart, R. D. (2022). Conservation management decreases surface runoff and soil erosion. Int. Soil Water Conserv. Res. 10, 188–196. doi: 10.1016/j.iswcr.2021.08.001
Erkossa, T., Williams, T. O., and Laekemariam, F. (2018). Integrated soil, water and agronomic management effects on crop productivity and selected soil properties in Western Ethiopia. Int. Soil Water Conserv. Res. 6, 305–316. doi: 10.1016/j.iswcr.2018.06.001
Eswaran, H., Lal, R., and Reich, P. (2019). “Land degradation: an overview” in Response to land degradation. ed. H. Eswaran (New Delhi: Oxford Press), 20–35.
Gelaw, A. M., Singh, B. R., and Lal, R. (2015). Soil quality indices for evaluating smallholder agricultural land uses in northern Ethiopia. Sustainability 7, 2322–2337. doi: 10.3390/su7032322
Girmay, G., Moges, A., and Muluneh, A. (2020). Estimation of soil loss rate using the USLE model for Agewmariayam watershed, Northern Ethiopia. Agric. Food Secur. 9, 1–12. doi: 10.1186/s40066-020-00262-w
Guadie, M., Molla, E., Mekonnen, M., and Cerdà, A. (2020). Effects of soil bund and stone-faced soil bund on soil physicochemical properties and crop yield under rain-fed conditions of Northwest Ethiopia. Land 9:13. doi: 10.3390/land9010013
Guteta, D., and Abegaz, A. (2017). Dynamics of selected soil properties under four land uses in Arsamma watershed, southwestern Ethiopian highlands. Phys. Geogr. 38, 83–102. doi: 10.1080/02723646.2016.1251734
Hanusz, Z., and Tarasińska, J. (2015). Normalization of the Kolmogorov–Smirnov and Shapiro–Wilk tests of normality. Biom. Lett. 52, 85–93. doi: 10.1515/bile-2015-0008
Hao, X., Ball, B., Culley, J., Carter, M., and Parkin, G. (2008). Soil density and porosity. Soil Sampl. Methods Anal. 2, 179–196.
Hassan, W., Li, Y., Saba, T., Jabbi, F., Wang, B., Cai, A., et al. (2022). Improved and sustainable agroecosystem, food security and environmental resilience through zero tillage with emphasis on soils of temperate and subtropical climate regions: a review. Int. Soil Water Conserv. Res. 10, 530–545. doi: 10.1016/j.iswcr.2022.01.005
Hishe, S., Lyimo, J., and Bewket, W. (2017). Soil and water conservation effects on soil properties in the middle Silluh Valley, northern Ethiopia. Int. Soil Water Conserv. Res. 5, 231–240. doi: 10.1016/j.iswcr.2017.06.005
Hussain, M. I., Abideen, Z., and Qureshi, A. S. (2021). Soil degradation, resilience, restoration and sustainable use. Sustain. Agric. Rev. 52, 335–365. doi: 10.1007/978-3-030-73245-5_10
Kebede, B., Tsunekawa, A., Haregeweyn, N., Tsubo, M., Mulualem, T., Mamedov, A. I., et al. (2022). Effect of polyacrylamide integrated with other soil amendments on runoff and soil loss: case study from Northwest Ethiopia. Int. Soil Water Conserv. Res. 10, 487–496. doi: 10.1016/j.iswcr.2021.12.001
Khelil, M. N., Aissa, N. B., Moussa, M., Bousnina, H., Benzarti, S., and Jedidi, N. (2020). International soil and water conservation research (ISWCR), No. 252245.
Koudahe, K., Allen, S. C., and Djaman, K. (2022). Critical review of the impact of cover crops on soil properties. Int. Soil Water Conserv. Res. 10, 343–354. doi: 10.1016/j.iswcr.2022.03.003
Laik, R., Singh, S. K., Pramanick, B., Kumari, V., Nath, D., Dessoky, E. S., et al. (2021). Improved method of boron fertilization in rice (Oryza sativa L.)–mustard (Brassica juncea L.) cropping system in upland calcareous soils. Sustainability 13:5037. doi: 10.3390/su13095037
Lal, R. (2015). Restoring soil quality to mitigate soil degradation. Sustainability 7, 5875–5895. doi: 10.3390/su7055875
Landon, J. R. (2014). Booker tropical soil manual: A handbook for soil survey and agricultural land evaluation in the tropics and subtropics. Abingdon: Routledge.
Lemma, H., Frankl, A., Van Griensven, A., Poesen, J., Adgo, E., and Nyssen, J. (2019). Identifying erosion hotspots in Lake Tana Basin from a multi-site SWAT validation: opportunity for land managers. In: 2019 International Soil and Water Assessment Tool conference (SWAT), pp. 19.
Leul, Y., Assen, M., Damene, S., and Legass, A. (2023). Effects of land use types on soil quality dynamics in a tropical sub-humid ecosystem, western Ethiopia. Ecol. Indic. 147:110024. doi: 10.1016/j.ecolind.2023.110024
Li, F.-M., Song, Q.-H., Jjemba, P. K., and Shi, Y.-C. (2004). Dynamics of soil microbial biomass C and soil fertility in cropland mulched with plastic film in a semiarid agro-ecosystem. Soil Biol. Biochem. 36, 1893–1902. doi: 10.1016/j.soilbio.2004.04.040
Mengistu, D., Bewket, W., and Lal, R. (2016). Conservation effects on soil quality and climate change adaptability of Ethiopian watersheds. Land Degrad. Dev. 27, 1603–1621. doi: 10.1002/ldr.2376
Meseret, D. (2016). Land degradation in Amhara region of Ethiopia: review on extent, impacts and rehabilitation practices. J. Environ. Earth Sci. 6, 120–130.
Mhiret, D. A., Dagnew, D. C., Alemie, T. C., Guzman, C. D., Tilahun, S. A., Zaitchik, B. F., et al. (2019). Impact of soil conservation and eucalyptus on hydrology and soil loss in the Ethiopian highlands. Water 11:2299. doi: 10.3390/w11112299
Nachimuthu, G., and Hulugalle, N. (2016). On-farm gains and losses of soil organic carbon in terrestrial hydrological pathways: a review of empirical research. Int. Soil Water Conserv. Res. 4, 245–259. doi: 10.1016/j.iswcr.2016.10.001
Ngangom, B., Das, A., Lal, R., Idapuganti, R. G., Layek, J., Basavaraj, S., et al. (2020). Double mulching improves soil properties and productivity of maize-based cropping system in eastern Indian Himalayas. Int. Soil Water Conserv. Res. 8, 308–320. doi: 10.1016/j.iswcr.2020.07.001
Noorbakhsh, S., Schoenau, J., Si, B., Zeleke, T., and Qian, P. (2008). Soil properties, yield, and landscape relationships in south-Central Saskatchewan Canada. J. Plant Nutr. 31, 539–556. doi: 10.1080/01904160801895076
Olsen, S. (1982). “Phosphorus” in Chemical and microbiological properties. eds. A. L. Page, R. H. Miller, and D. R. Keeney (Madison, WI: American Society for Agronomy), 416–418.
Pham, T. G., Nguyen, H. T., and Kappas, M. (2018). Assessment of soil quality indicators under different agricultural land uses and topographic aspects in Central Vietnam. Int. Soil Water Conserv. Res. 6, 280–288. doi: 10.1016/j.iswcr.2018.08.001
Pramanick, B., Kumar, M., Naik, B. M., Kumar, M., Singh, S. K., Maitra, S., et al. (2022). Long-term conservation tillage and precision nutrient management in maize–wheat cropping system: effect on soil properties, crop production, and economics. Agronomy 12:2766. doi: 10.3390/agronomy12112766
Rashid, M. I., Mujawar, L. H., Shahzad, T., Almeelbi, T., Ismail, I. M., and Oves, M. (2016). Bacteria and fungi can contribute to nutrients bioavailability and aggregate formation in degraded soils. Microbiol. Res. 183, 26–41. doi: 10.1016/j.micres.2015.11.007
Rinot, O., Levy, G. J., Steinberger, Y., Svoray, T., and Eshel, G. (2019). Soil health assessment: a critical review of current methodologies and a proposed new approach. Sci. Total Environ. 648, 1484–1491. doi: 10.1016/j.scitotenv.2018.08.259
Schiefer, J., Lair, G. J., and Blum, W. E. (2015). Indicators for the definition of land quality as a basis for the sustainable intensification of agricultural production. Int. Soil Water Conserv. Res. 3, 42–49. doi: 10.1016/j.iswcr.2015.03.003
Selassie, Y. G., and Amede, T. (2014). “Investing in land and water management practices in the Ethiopian highlands: short-or long-term benefits?” in Challenges and opportunities for agricultural intensification of the humid Highland Systems of sub-Saharan Africa. eds. B. Vanlauwe, P. Van Asten, and G. Blomme (Berlin: Springer), 105–114.
Siraw, Z., Bewket, W., and Adnew Degefu, M. (2020). Assessment of livelihood benefits of community-based watershed development in northwestern highlands of Ethiopia. Int. J. River Basin Manag. 18, 395–405. doi: 10.1080/15715124.2018.1505733
Tamene, L., Adimassu, Z., Aynekulu, E., and Yaekob, T. (2017). Estimating landscape susceptibility to soil erosion using a GIS-based approach in northern Ethiopia. Int. Soil Water Conserv. Res. 5, 221–230. doi: 10.1016/j.iswcr.2017.05.002
Tanto-Doko, T. (2022). Effects of intgrated soil and water conservation on selected soil physico-chemical properties of lonke watershed, Sodo Zuria Woreda, southern Ethiopia. Ukr. J. Ecol. 12, 44–60.
Taye, S., Megersa, T., and Yadeta, H. (2022). The role of soil bunds construction in improving soil fertility in Jarso District, Western Ethiopia.
Tesfahunegn, G. B. (2016). Soil quality indicators response to land use and soil management systems in northern Ethiopia's catchment. Land Degrad. Dev. 27, 438–448. doi: 10.1002/ldr.2245
Tiki, L., Tadesse, M., and Yimer, F. (2015). Effects of integrating different soil and water conservation measures into hillside area closure on selected soil properties in Hawassa Zuria District, Ethiopia. J. Soil Sci. Environ. Manage. 6, 268–274.
Tilahun, A., and Belay, F. (2019). Conservation and production impacts of soil and water conservation practices under different socio-economic and biophysical setting: a review. J. Degrad. Min. Lands Manage. 6, 1653–1666. doi: 10.15243/jdmlm.2019.062.1653
Tolesa, A., Mammo, S., and Bohnett, E. (2021). Effects of soil and water conservation structures on selected soil physicochemical properties: the case of ejersa lafo district, central highlands of Ethiopia. Appl. Environ. Soil Sci. 2021, 1–11. doi: 10.1155/2021/9910237
Tsymbarovich, P., Kust, G., Kumani, M., Golosov, V., and Andreeva, O. (2020). Soil erosion: an important indicator for the assessment of land degradation neutrality in Russia. Int. Soil Water Conserv. Res. 8, 418–429. doi: 10.1016/j.iswcr.2020.06.002
Uwizeyimana, D., Mureithi, S. M., Karuku, G., and Kironchi, G. (2018). Effect of water conservation measures on soil moisture and maize yield under drought prone agro-ecological zones in Rwanda. Int. Soil Water Conserv. Res. 6, 214–221. doi: 10.1016/j.iswcr.2018.03.002
Van Reeuwijk, L. P. (1986). Procedures for soil analysis. ISRIC. Technical Paper No. 9. The Netherlands
Wang, Y., Dong, Y., Su, Z., Mudd, S. M., Zheng, Q., Hu, G., et al. (2020). Spatial distribution of water and wind erosion and their influence on the soil quality at the agropastoral ecotone of North China. Int. Soil Water Conserv. Res. 8, 253–265. doi: 10.1016/j.iswcr.2020.05.001
Wassie, S. B. (2020). Natural resource degradation tendencies in Ethiopia: a review. Environ. Syst. Res. 9, 1–29. doi: 10.1186/s40068-020-00194-1
Welemariam, M., Kebede, F., Bedadi, B., and Birhane, E. (2018). Exclosures backed up with community-based soil and water conservation practices increased soil organic carbon stock and microbial biomass carbon distribution, in the northern highlands of Ethiopia. Chem. Biol. Technol. Agric. 5, 1–11. doi: 10.1186/s40538-018-0124-1
Wen, H., Ni, S., Wang, J., and Cai, C. (2021). Changes of soil quality induced by different vegetation restoration in the collapsing gully erosion areas of southern China. Int. Soil Water Conserv. Res. 9, 195–206. doi: 10.1016/j.iswcr.2020.09.006
Yaekob, T., Tamene, L., Gebrehiwot, S. G., Demissie, S. S., Adimassu, Z., Woldearegay, K., et al. (2022). Assessing the impacts of different land uses and soil and water conservation interventions on runoff and sediment yield at different scales in the central highlands of Ethiopia. Renew. Agric. Food Syst. 37, S73–S87. doi: 10.1017/S1742170520000010
Yifru, G. S., and Miheretu, B. A. (2022). Farmers’ adoption of soil and water conservation practices: the case of lege-lafto watershed, Dessie zuria district, south wollo, Ethiopia. PLoS One 17:e0265071. doi: 10.1371/journal.pone.0265071
Yu, P., Liu, S., Zhang, L., Li, Q., and Zhou, D. (2018). Selecting the minimum data set and quantitative soil quality indexing of alkaline soils under different land uses in northeastern China. Sci. Total Environ. 616-617, 564–571. doi: 10.1016/j.scitotenv.2017.10.301
Keywords: landscape, soil erosion, soil quality, sub-humid, watershed management
Citation: Tebeje AK, Abebe WB, Hussein MA, Mhiret DA, Zimale FA, Desta G, Assefa TT, Tilahun SA and Ahmed MA (2024) Dynamics of soil quality in a conserved landscape in the highland sub humid ecosystem, Northwestern Ethiopia. Front. Sustain. Food Syst. 8:1270265. doi: 10.3389/fsufs.2024.1270265
Edited by:
Abebe Shiferaw Dakka, International Fertilizer Development Center, United StatesReviewed by:
Biswajit Pramanick, Dr. Rajendra Prasad Central Agricultural University, IndiaShaiesh Morajkar, Parvatibai Chowgule College Arts And Science, India
Copyright © 2024 Tebeje, Abebe, Hussein, Mhiret, Zimale, Desta, Assefa, Tilahun and Ahmed. This is an open-access article distributed under the terms of the Creative Commons Attribution License (CC BY). The use, distribution or reproduction in other forums is permitted, provided the original author(s) and the copyright owner(s) are credited and that the original publication in this journal is cited, in accordance with accepted academic practice. No use, distribution or reproduction is permitted which does not comply with these terms.
*Correspondence: Aschalew K. Tebeje, a2Fzc2llYXNjaGFsZXdAZ21haWwuY29t