 Qiao Chen
 Yan Mao1
*
Yan Mao1
* Jianquan Cheng
95% of researchers rate our articles as excellent or good
Learn more about the work of our research integrity team to safeguard the quality of each article we publish.
Find out more
ORIGINAL RESEARCH article
Front. Sustain. Food Syst. , 07 November 2023
Sec. Agricultural and Food Economics
Volume 7 - 2023 | https://doi.org/10.3389/fsufs.2023.1286567
Introduction: To investigate the spatiotemporal evolution of agricultural carbon emissions and carbon absorption, analyse the spatiotemporal variations in the carbon balance, delineate carbon-offsetting regions, and formulate low-carbon development strategies tailored to various major functional zones, this study aims to promote coordinated regional ecological and environmental governance.
Methods: This study takes a perspective based on major functional zones, focuses on 17 cities in Hubei Province, studies the spatiotemporal variations in agricultural carbon budgets and carbon offsets in each city from the perspective of functional zoning and proposes a spatial optimization scheme for reducing carbon emissions.
Results and discussion: The results show that both agricultural carbon emissions and carbon absorption in Hubei Province gradually increased, although the agricultural carbon budgets varied significantly among cities. Arable lands were the main agricultural carbon sinks in Hubei Province. Overall, carbon emissions exhibited declining core–periphery zonation, with Xiangyang, Jingzhou, and Huanggang serving as the centre (high emissions) and the cities of Shennongjia, Enshi, and Yichang serving as the periphery (low emissions). Carbon absorption displayed a U-shaped distribution, with high values in the east, south, and west and low values in the centre and north. The cities of Yichang, Jingmen, and Huanggang were the peak carbon sink areas. In recent years, the coordination between the agricultural carbon emissions and carbon budgets in Hubei Province has gradually improved, and agricultural carbon absorption and emissions have become increasingly balanced. Seven carbon-positive, five carbon-neutral, and five carbon-negative areas were identified in the province. Based on these findings, differentiated carbon emission reduction strategies were proposed to promote coordinated and low-carbon agriculture.
As rapid economic development continues, the ongoing increase in energy consumption and carbon emissions is exacerbating ecological and environmental issues. This intensification of the conflict between human development and nature conservation is becoming increasingly evident. The global average temperature continues to rise, and there is a “very high” likelihood of human activities contributing significantly to global warming. The primary factor behind this phenomenon is the emission of greenhouse gases by humans. Hence, reducing greenhouse gas emissions, particularly , has gradually become one of the major challenges facing humanity.
Agriculture is the second largest source of greenhouse gas emissions and a significant source of carbon emissions (Chen et al., 2022b). In 2020, China’s total agricultural carbon emissions were approximately 2 billion tons, accounting for 17% of total greenhouse gas emissions, and emissions are growing at an average annual rate of 5% (Statistics, N.B.O, 2021). Reducing agricultural carbon emissions holds great significance for China to fulfil its emission reduction commitments, enhance its capacity to adapt to climate change and achieve the “dual-carbon” goal. Hubei Province not only is the “granary of China” and shoulders the important task of food security in China but also has high agricultural carbon emission intensity in China. With the rapid development of the agricultural industry, environmental pollution represented by carbon emissions has become a major obstacle to the healthy development of the economy (Li et al., 2019). The serious imbalance of the carbon budget of terrestrial ecosystems caused by human agricultural production has become an important issue affecting regional sustainable development.
The delineation of major functional zones serves as a crucial instrument in national spatial governance. Grounded in the theory of regional functional differentiation, it comprehensively considers the differences in regional development functions, balancing the natural ecological systems and socioeconomic systems. Consequently, the national territory is categorized into four distinct spatial types: optimized development zones, key development zones, restricted development zones, and prohibited development zones (Teng et al., 2021). The major functional zone strategy encompasses the dual objectives of economic development and ecological preservation. It delineates the roles and functions of regions within the national spatial division, providing clarity regarding their specific responsibilities in the context of territorial spatial planning (Page et al., 2020). It represents a novel approach to regional economic development and environmental protection, serving as a significant innovation in establishing a harmonious pattern of national territorial spatial development that aligns with the population, the economy, and resource-environment factors. It plays a crucial role in building a harmonious regional system of human-environment relationships (Fan, 2015). Undertaking carbon balance assessments of land use within functional zones and establishing optimized carbon-offsetting regions in the face of climate change and energy conservation requirements hold significant practical importance. This approach aids in formulating low-carbon strategies tailored to different functional zones, provides guidance on allocating offset quotas, and promotes coordinated regional development.
Hubei Province, located in the Jianghan Plain, is abundant in resources and known for its rich agricultural production. It is one of China’s major grain-producing regions and is often referred to as the “Land of Fish and Rice” and the “Province of a Thousand Lakes.” Hubei Province is a major agricultural province in China, and it is one of the 13 major grain-producing provinces in China. In 2020, the total agricultural output value of Hubei Province reached 349.3 billion RMB, maintaining an annual growth rate for 10 consecutive years.
So, what are the characteristics of the spatial and temporal evolution of the agricultural carbon budgets in Hubei Province? How can carbon equity be achieved between regions? How can a coordinated carbon reduction scheme of interregional science be developed? These problems have become significant issues requiring urgent solutions.
Scholars have conducted extensive studies on carbon budgets and carbon compensation for agriculture, including three aspects.
Firstly, studies on the influencing factors and actions of agricultural carbon emissions. Using multi-factor analysis, the logarithmic mean Divisia index (LMDI) model (Zhang et al., 2018), the stochastic impacts by regression on population, affluence, and technology (STIRPAT) model (Ji and Chen, 2017; Rehman et al., 2022), the Laspeyres index method and other methods (Mishina and Muromachi, 2012; Chen et al., 2021), scholars have found that the industrial structure, the energy structure and efficiency, population size, the economic level, investment in social fixed industries, and technological progress are important factors in increasing land carbon emissions. Cheng et al. (2011) constructed an accounting list of six emission factors, including chemical fertilizers, pesticides, agricultural plastic film, ploughing, irrigation, and diesel, which provided a reference for the carbon effect accounting of the planting industry.1 Tian et al. (2021) constructed an accounting system consisting of emission factors such as fertilizers and pesticides and measured the carbon emissions of the planting industry. Xia et al. (2022) measured agricultural carbon emission intensity, analysed its spatiotemporal differences and predicted its evolutionary trend by using the Theil index and R/S analysis. Guo et al. (2014), Shang and Yang (2019), and Dai et al. (2020), Wu et al. (2020) studied the carbon emissions of the agricultural planting industry at the national and regional levels. In addition, considering factors such as fertilizers, pesticides and agricultural plastic film, Tian et al. (2014) paid attention to methane in paddy fields and carbon sequestration in crops and measured the net carbon benefits of China’s planting industry. In general, scholars have conducted extensive discussions about the factors and processes of agricultural carbon emissions based on multiple dimensions and fields.
Secondly, studies on the measurement and characteristics of agricultural carbon emissions, carbon budgets, and carbon compensation. Concerning agricultural carbon emissions, through the IPCC greenhouse gas inventory method and relevant carbon emission coefficients, scholars have calculated the carbon emissions in different regions and discussed the spatiotemporal differences in carbon emissions generated by different land uses. Gossling (2009) first introduced the “carbon offset” and “carbon offset destination” concepts in tourism research in 2009. He defined “carbon offsets” as the neutralization of a destination’s total carbon dioxide emissions. Since then, scholars have conducted in-depth research on the measurement of carbon offsets in different industries. Wu et al. (2021) systematically expounded the connotation of carbon offsets, regional carbon offsets and the basic framework of the carbon trading system. Case studies on forest carbon compensation (Yang et al., 2019), carbon sequestration fishery carbon compensation, tourism carbon compensation (Rico et al., 2019; Zhang and Zhang, 2020), carbon sequestration value evaluation (Herrero et al., 2022; Khanal et al., 2022; Zamparini et al., 2022), regional carbon ecological compensation (Yang S. et al., 2022), and other fields have been carried out. They provide a useful reference for the construction of carbon compensation theory and methods (Ke et al., 2022). Research on carbon offsets has gradually developed from the early situation statement to a solution path, focusing on measuring the tourism carbon footprint and formulating governance policies and other initiatives.
Concerning agricultural carbon emission budgets and carbon compensation analysis, scholars have used the standard ellipse method (Yang and Li, 2022), the SBM model (Zhang et al., 2017), life cycle assessment (Gan et al., 2022), the centre of gravity model (Wang et al., 2022), GISs, and other methods to measure carbon emissions and absorption, and they have conducted research on their spatial distribution characteristics (Guo et al., 2022; Yang Z. et al., 2022). Some scholars have found that China’s total carbon emissions are on the rise. However, the carbon source consumed per unit of agricultural output value, namely, agricultural carbon emission intensity, shows a decreasing trend. In addition, some scholars have discussed the spatial and temporal evolution of forest carbon compensation (Aljenaid et al., 2022), fishery carbon compensation, arable land carbon compensation (Mäntymaa et al., 2018), the carbon sink value (Lin and Ge, 2019), and carbon ecological compensation (Chen et al., 2022a) in various countries. Carbon emissions show significant heterogeneity among regions and homogeneity within regions.
Thirdly, studies on the simulation and prediction of carbon budgets and compensation scenarios and spatial optimization. At present, there are many studies on measuring the carbon reduction potential and regional differences. However, there are few studies related to agricultural carbon offset simulation, prediction, and land use spatial optimization based on the carbon emission effect. Marchi et al. established a framework for regional carbon cycle simulation and conducted an empirical study in Siena Province, Italy (Marchi et al., 2012). Christen et al. simulated and analysed the carbon balance of the Sunset community in Vancouver (Schandl et al., 2020). In addition, some scholars have also simulated and predicted the urban carbon cycle and carbon balance (Churkina, 2008), carbon budget accounting (Lin et al., 2017), and the carbon compensation of vegetation (Mello et al., 2021) and proposed countermeasures and suggestions. This accumulated literature enriches the content of regional carbon cycle research and provides important ideas and methods for agricultural carbon balance analysis and spatial optimization.
The results of existing research have enriched the content of land use carbon emission research. However, there are a few gaps and limitations: (1) many studies focus on measuring urban carbon emissions. From the perspective of agricultural production, there are few studies on the spatial and temporal variations in agricultural carbon budgets. (2) The analysis of the carbon budget is mostly based on cross-sectional data, while research on spatial functional partitioning and the optimization of the carbon budget is scarce. Compared with existing research, this study is mainly expanded in the following ways: (1) Calculate agricultural carbon emissions from a microcosmic level. Carbon emissions of each city in Hubei Province are calculated from the two dimensions of agricultural planting and agricultural breeding, and the research results are more scientific and reliable. (2) The theory of comparative advantage was introduced into carbon compensation zoning, and functional zoning was carried out based on total carbon emission, carbon emission economic contribution coefficient, carbon emission ecological carrying coefficient and land development and utilization degree. It can effectively avoid the limitation of functional zoning only relying on carbon absorption or carbon emission. (3) Spatial optimization scheme of agricultural carbon compensation was proposed from the perspective of urban functional area planning. The Coupling coordination model is used to calculate the coupling degree of agricultural carbon emission and carbon absorption in various cities, and further use SOM-K-means clustering model to divide the functional zoning of agricultural carbon emission in various cities in Hubei Province, so as to guide the agricultural development planning of each city. The results are of more practical significance.
Thus, this research takes Hubei Province, the first pilot for the low-carbon economy, as the research case to explore the spatiotemporal evolution, functional zoning, and optimization of agricultural carbon budgets in 17 cities in the province from 2000 to 2020. This study will provide a useful reference for the sustainable development of agriculture and the construction of low-carbon cities.
This paper is organized as follows: Section 2, titled ‘Data and Methods,’ provides an overview of the study area and data sources and describes the coupling coordination model and the application of the self-organizing map (SOM) methods. In Section 3, ‘Empirical Results,’ we present and interpret the findings of our analysis. Section 4, ‘Discussion,’ conducts an in-depth analysis of the empirical results and their relevance to the underlying theory. Finally, in Section 5, ‘Conclusions,’ we draw conclusions based on the results and provide suggestions for future research.
Hubei Province (see Figure 1) contains 17 cities, including Wuhan, Huangshi, Xiangyang, Jingzhou, Yichang, Shiyan, Xiaogan, Jingmen, Ezhou, Huanggang, Xianning, Suizhou, Xiantao, Qianjiang, Tianmen, the Shennongjia Forestry District, and Enshi (in the Enshi Tujia and Miao Autonomous Prefecture). To develop a low-carbon industrial system and consumption model in China, the National Development and Reform Commission is conducting pilot projects in low-carbon provinces and cities nationwide. With Hubei Province serving as one of the first five pilot regions, it bears much responsibility in the exploration of low-carbon green development with Chinese characteristics, collaborative environmental governance, and high-quality development.
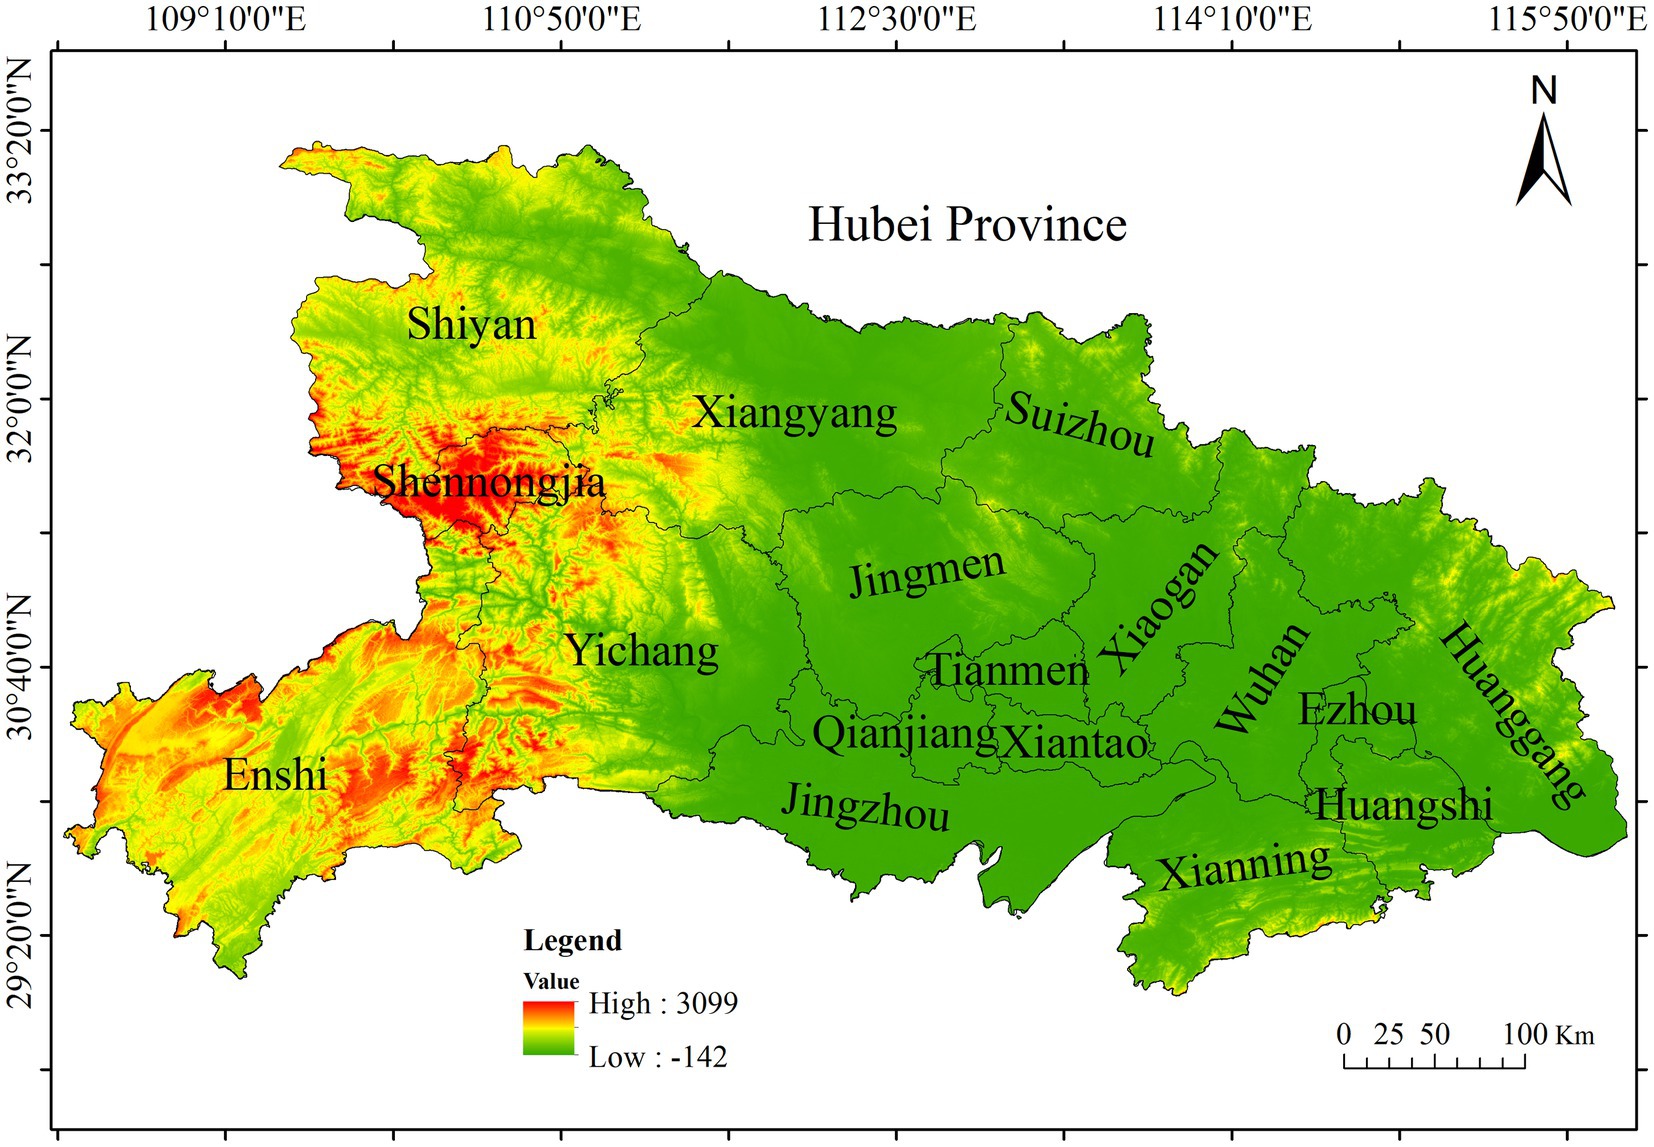
Figure 1. Study area (Hubei Province and its constituent cities).
The data used included the land use, gross domestic product (GDP), population size, energy consumption, and agricultural production activities of 17 cities in Hubei Province. The primary source of land use data was Globeland302 at a spatial resolution of 30 m over five time nodes (2000, 2005, 2010, 2015, and 2020). The types of land cover were reclassified to obtain six categories: arable land, forestland, grassland, construction land, water, and unused land. Digital elevation model data were sourced from the geospatial ASTERGDEMS3 dataset. The elevation of Hubei Province was extracted from ArcGIS v. 10.4 (ESRI, USA), while socioeconomic and energy data were derived from the China Energy Statistical Yearbook, the Hubei Statistical Yearbook, and China City Statistical Yearbooks from 2000 to 2020. Data on agricultural production were collected from the China Rural Statistical Yearbook, the Hubei Rural Statistical Yearbook, and EPS China Data.4
In this study, both carbon emissions and carbon absorption refer to carbon dioxide ( ). Livestock respiratory carbon emissions were calculated using the equations of Churkina et al. (2010):
where is the amount of carbon in the animal, is the animal size, is the average weight of the animal body, is the proportion of dry matter in the animal (0.3), and represents the proportion of carbon in dry matter (0.5; Zhao et al., 2016). The carbon stock in animal bodies was calculated as in Equation (1), and the average weight of the most abundant domesticated animals is shown in Table 1.

Table 1. Average body weight of domesticated animals and people.
In addition, livestock farming, especially ruminant farming, is another important source of carbon dioxide production, including methane ( ) from intestinal fermentation and nitrous oxide ( ) from faecal emissions. The carbon emission coefficients of various animals are shown in Table 2.
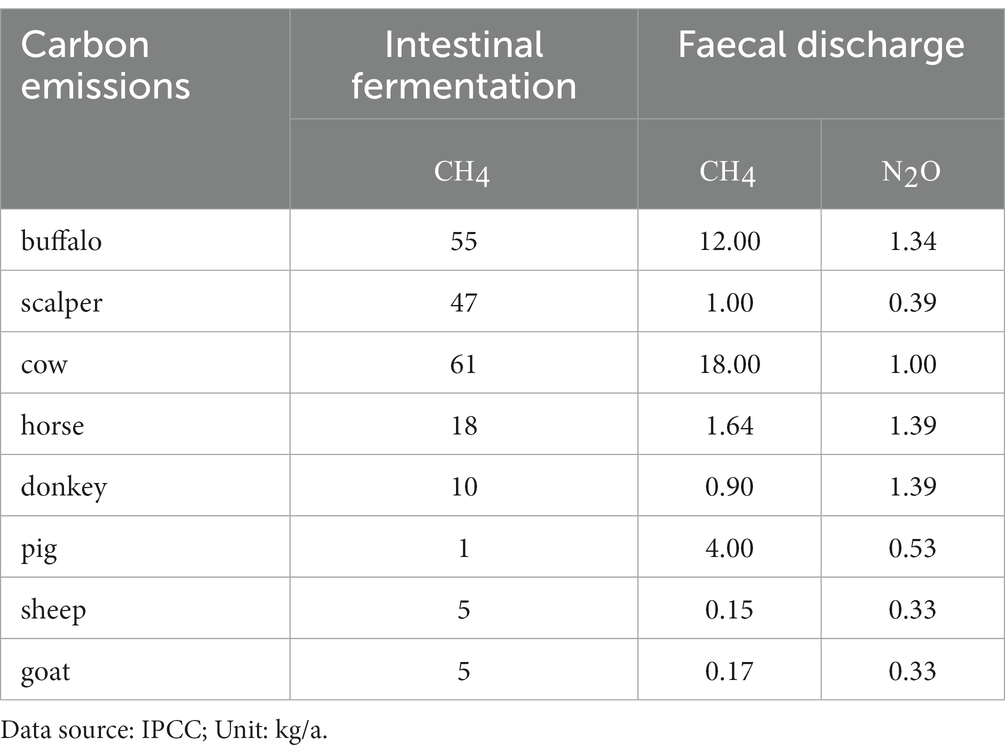
Table 2. Carbon emission coefficients of major livestock.
Cultivated lands are sources of carbon due to farming activities, mainly owing to the application of fertilizers and pesticides, irrigation, the use of agricultural machinery, and agricultural plastic film consumption. Carbon emissions from arable lands ( ) were calculated as follows:
where is the carbon emissions from arable lands; refer to the amounts of fertilizer and pesticide, the crop cultivation area, total agricultural machine power, the irrigated area, and the amount of agricultural plastic film, respectively; and , N, O, Q, R, and U are conversion coefficients. The values of M and N sourced from the Oak Ridge National Laboratory (ORNL), are 0.8956 kg/kg and 4.9341 kg/kg, respectively, while those of O, Q, and R are 16.47 kg/hm2, 0.18 kg/kW, and 266.48 kg/hm2, respectively. The value of U (5.18 kg/hm2) was sourced from the Institute of Resource, Ecosystem and Environment of Agriculture of Nanjing Agricultural University.
Finally, the total carbon emissions from agriculture in Hubei Province ( ) were calculated as follows:
Agricultural carbon absorption mainly comes from agricultural cultivation. The carbon uptake of agricultural cultivation was calculated based on the study of Zhao et al. (2016), as shown in Equation (4):
where is the photosynthetic carbon uptake during crop reproduction, is the carbon uptake per unit of organic matter (dry matter) via the photosynthesis of crop type i, is the carbon absorption rate of the crop type i, is the water content of crop type i, is the economic yield of crop type i, and is the economic coefficient of crop type i (see Figure 2). The carbon uptake was calculated for rice, wheat, maize, beans, potato, hemp, sugar beet, roasted tobacco, sorghum, and grain (see Appendix Table 1). The economic coefficients and rates of carbon uptake of crops that are commonly used in academic studies were generally derived from Warrick (1988) and Li (2002), while the average water contents were derived from Wu et al. (2021).
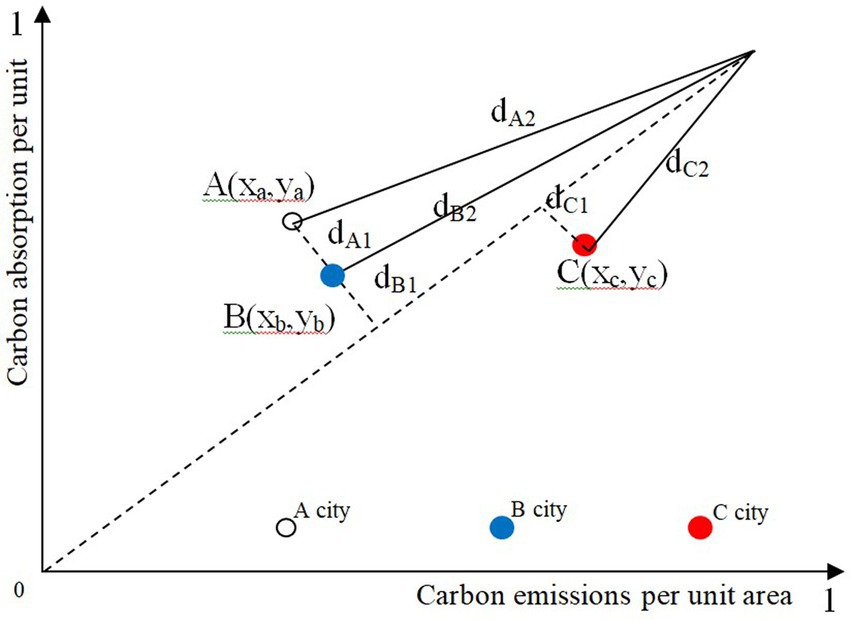
Figure 2. Coupled carbon emission–absorption coordination model.
In this research, the two-dimensional coupling coordination model was used to explore the coordination relationship between agricultural carbon emissions and absorption across various cities in Hubei Province. The model takes carbon emissions and absorption per unit area as the horizontal and vertical coordinates, respectively (see Figure 2). When the degree of coupling between carbon sources and sinks is higher, the coordinates are closer to the 1:1 line.
In Figure 2, a comparison of city and city yields a degree of coupling of , such that the carbon sources and sinks in city are more strongly coupled. Additionally, the distance between the coordinate and limit points was introduced in this model to allow for further differentiation. When the diagonal distance of city is equal to that of city but , the degree of coupling between agricultural carbon emission and absorption is higher in city C. Thus, the sum of the distances between carbon emissions and absorption per unit area (in coordinate points) and the diagonal and limit points can be defined as the coupled coordination distance ( , which was calculated as follows:
where and are the horizontal and vertical coordinates of agricultural carbon emission–absorption coordinates (i.e., the normalized carbon emission and absorption values per unit area, respectively) and is the coupled coordination distance of city The smaller the distance of is, the higher the degree of coupling coordination between agricultural carbon emissions and carbon absorption. The coupling coordination distance reflects the coupling coordination degree of agricultural carbon emissions and carbon absorption. The smaller the distance of is, the higher the degree of coupling coordination between agricultural carbon emissions and carbon absorption. In contrast, the greater the distance of is, the lower the coupling coordination degree.
The difference between agricultural carbon emissions and carbon absorption ( was used to measure the carbon offset ( (Wu et al., 2021). If the carbon uptake in a region is greater than carbon emissions ( ), then the ecosystem is absorbing both regional emissions and emissions from nearby areas; in this case, the absorbing region should receive carbon offsets. Conversely, if , carbon offsets should be paid. However, if only net carbon emissions are considered and the issue of the economic differences between regions is ignored, it may lead to economic overpayment (Zhang et al., 2022). To make the carbon offset results more realistic, an agricultural carbon emissions threshold was set for each city ( based on Equation (6):
where is the economic contribution coefficient of agricultural carbon emissions, is the average value of agricultural carbon emissions in Hubei Province from 2000 to 2020, and are the GDPs of city and Hubei Province, respectively, and and are the agricultural carbon emissions of city and the entire province, respectively. In addition to the obvious differences between net agricultural carbon emissions, differences exist in the intensity of agricultural carbon emissions among different provinces (Yuan et al., 2021), for which agricultural carbon emissions were further revised as follows:
where is the corrected agricultural carbon emissions of city , the intensity of agricultural carbon emissions for city in 2000 and 2020 are and , respectively, and are the total agricultural carbon emissions intensities of Hubei Province in 2000 and 2020, respectively, and is the average intensity of agricultural carbon emissions in Hubei Province in 2020. The agricultural carbon offset baseline values after these adjustments were as follows:
where is the modified baseline agricultural carbon offset value. The advantage of this adjustment is that the carbon offset value is more realistic. If , then a municipality should receive carbon offsets (i.e., because it is absorbing more than its regional share of carbon emissions), and if , then it should pay carbon offsets.
The self-organizing map (SOM) neural network, pioneered in 1981 by Professor Kohonen, a leading expert in neural networks at the University of Helsinki, is grounded in the biological nervous system’s “lateral inhibition” phenomenon. The self-organizing map (SOM) net is a neural network that can self-organize to solve unsupervised classification problems. The K-means algorithm is a dynamic clustering method, and it is also referred to as an incremental clustering approach. The primary goal of the algorithm is to segment data into k clusters using a suitable classification method determined by the input parameter k. The SOM-K-means clustering model integrates the self-organizing, adaptive, and fault-tolerant properties of the SOM and with the efficiency, interpretability, and fast convergence of the K-means algorithm to perform a two-stage clustering of data samples. In the first stage, the SOM is employed to initially cluster the data samples, determining the number of clusters and their respective centroids. In the second stage, the clustering results from the first stage are used as input, and the K-means clustering algorithm is applied to produce the final clustering outcome (Zhou et al., 2010). The SOM-K-means clustering model was selected to classify the types of carbon offset zones in various cities in Hubei Province based on carbon offset zoning indices. This model integrates the advantages of the self-organization, adaptability, and fault tolerance of the SOM and the high efficiency, interpretability, and convergence speed of K-means models. Stata v. 17 (StataCorp, USA) was used to perform cluster analyses with the SOM–K-means algorithm on four indices, i.e., total agricultural carbon emissions, the economic contribution coefficient of agricultural carbon emissions, the ecological carrying capacity coefficient of agricultural carbon emissions, and spatial organization, to classify types of municipal-level agricultural carbon offset areas.
The scale of carbon emissions from 17 cities in Hubei Province between 2000 and 2020 was analysed based on the results of agricultural carbon emission accounting. It was found that the total agricultural carbon absorption in the study period increased from 199 Mt. in 2000 to 250 Mt. in 2020, showing an initial rapid growth and subsequent slow decline between 2015 and 2020. Total agricultural carbon emissions increased from 665 Mt. in 2000 to 1,002 Mt. in 2020, showing an overall gradual increase (see Figure 3). While Hubei Province has a relatively favourable ecological baseline, with a large agricultural carbon absorption capacity, the apparent decline in agricultural carbon absorption from 2015 to 2020 also reflects rapid economic development and accelerated urban sprawl, resulting in a reduction in agricultural carbon sink areas.
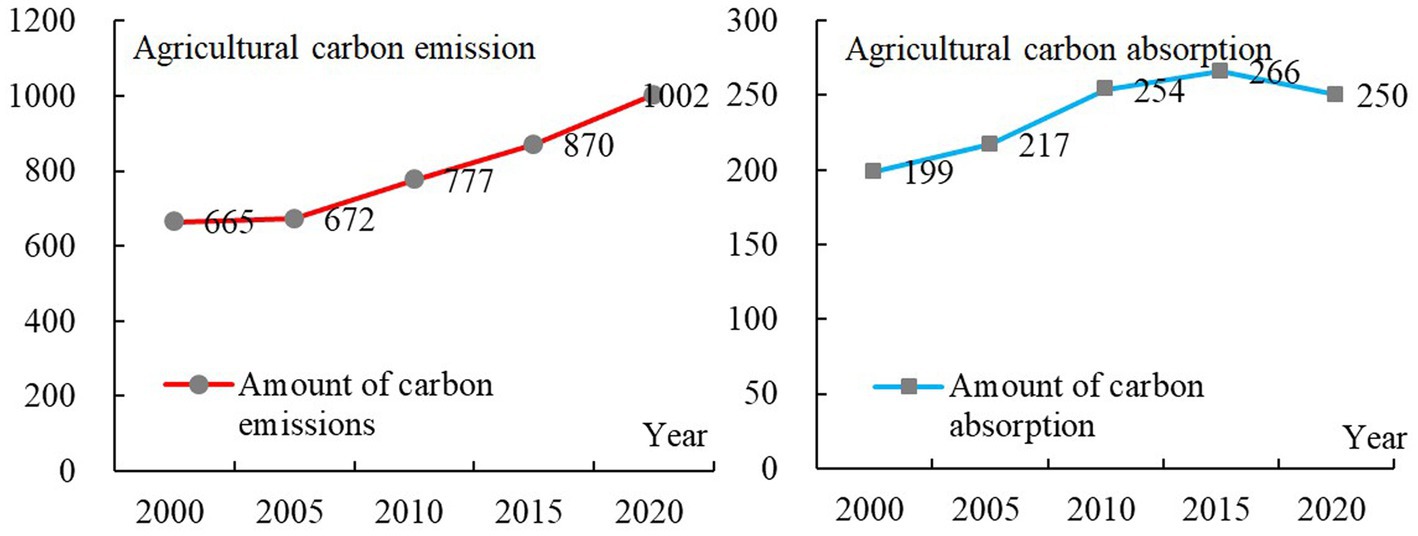
Figure 3. Changes in total agricultural carbon emissions and absorption in Hubei Province (2000–2020).
Each of the 17 municipalities was classified into one of five types based on its actual carbon absorption and the methods employed by Xiao et al. (2016). These classes were high, moderately high, moderate, moderately low, and low (carbon emissions/absorption; Wei and Chen, 2021). ArcGIS v. 10.4 (ESRI, USA) was used to map the spatial distribution of carbon sinks and sources (Figures 4, 5).
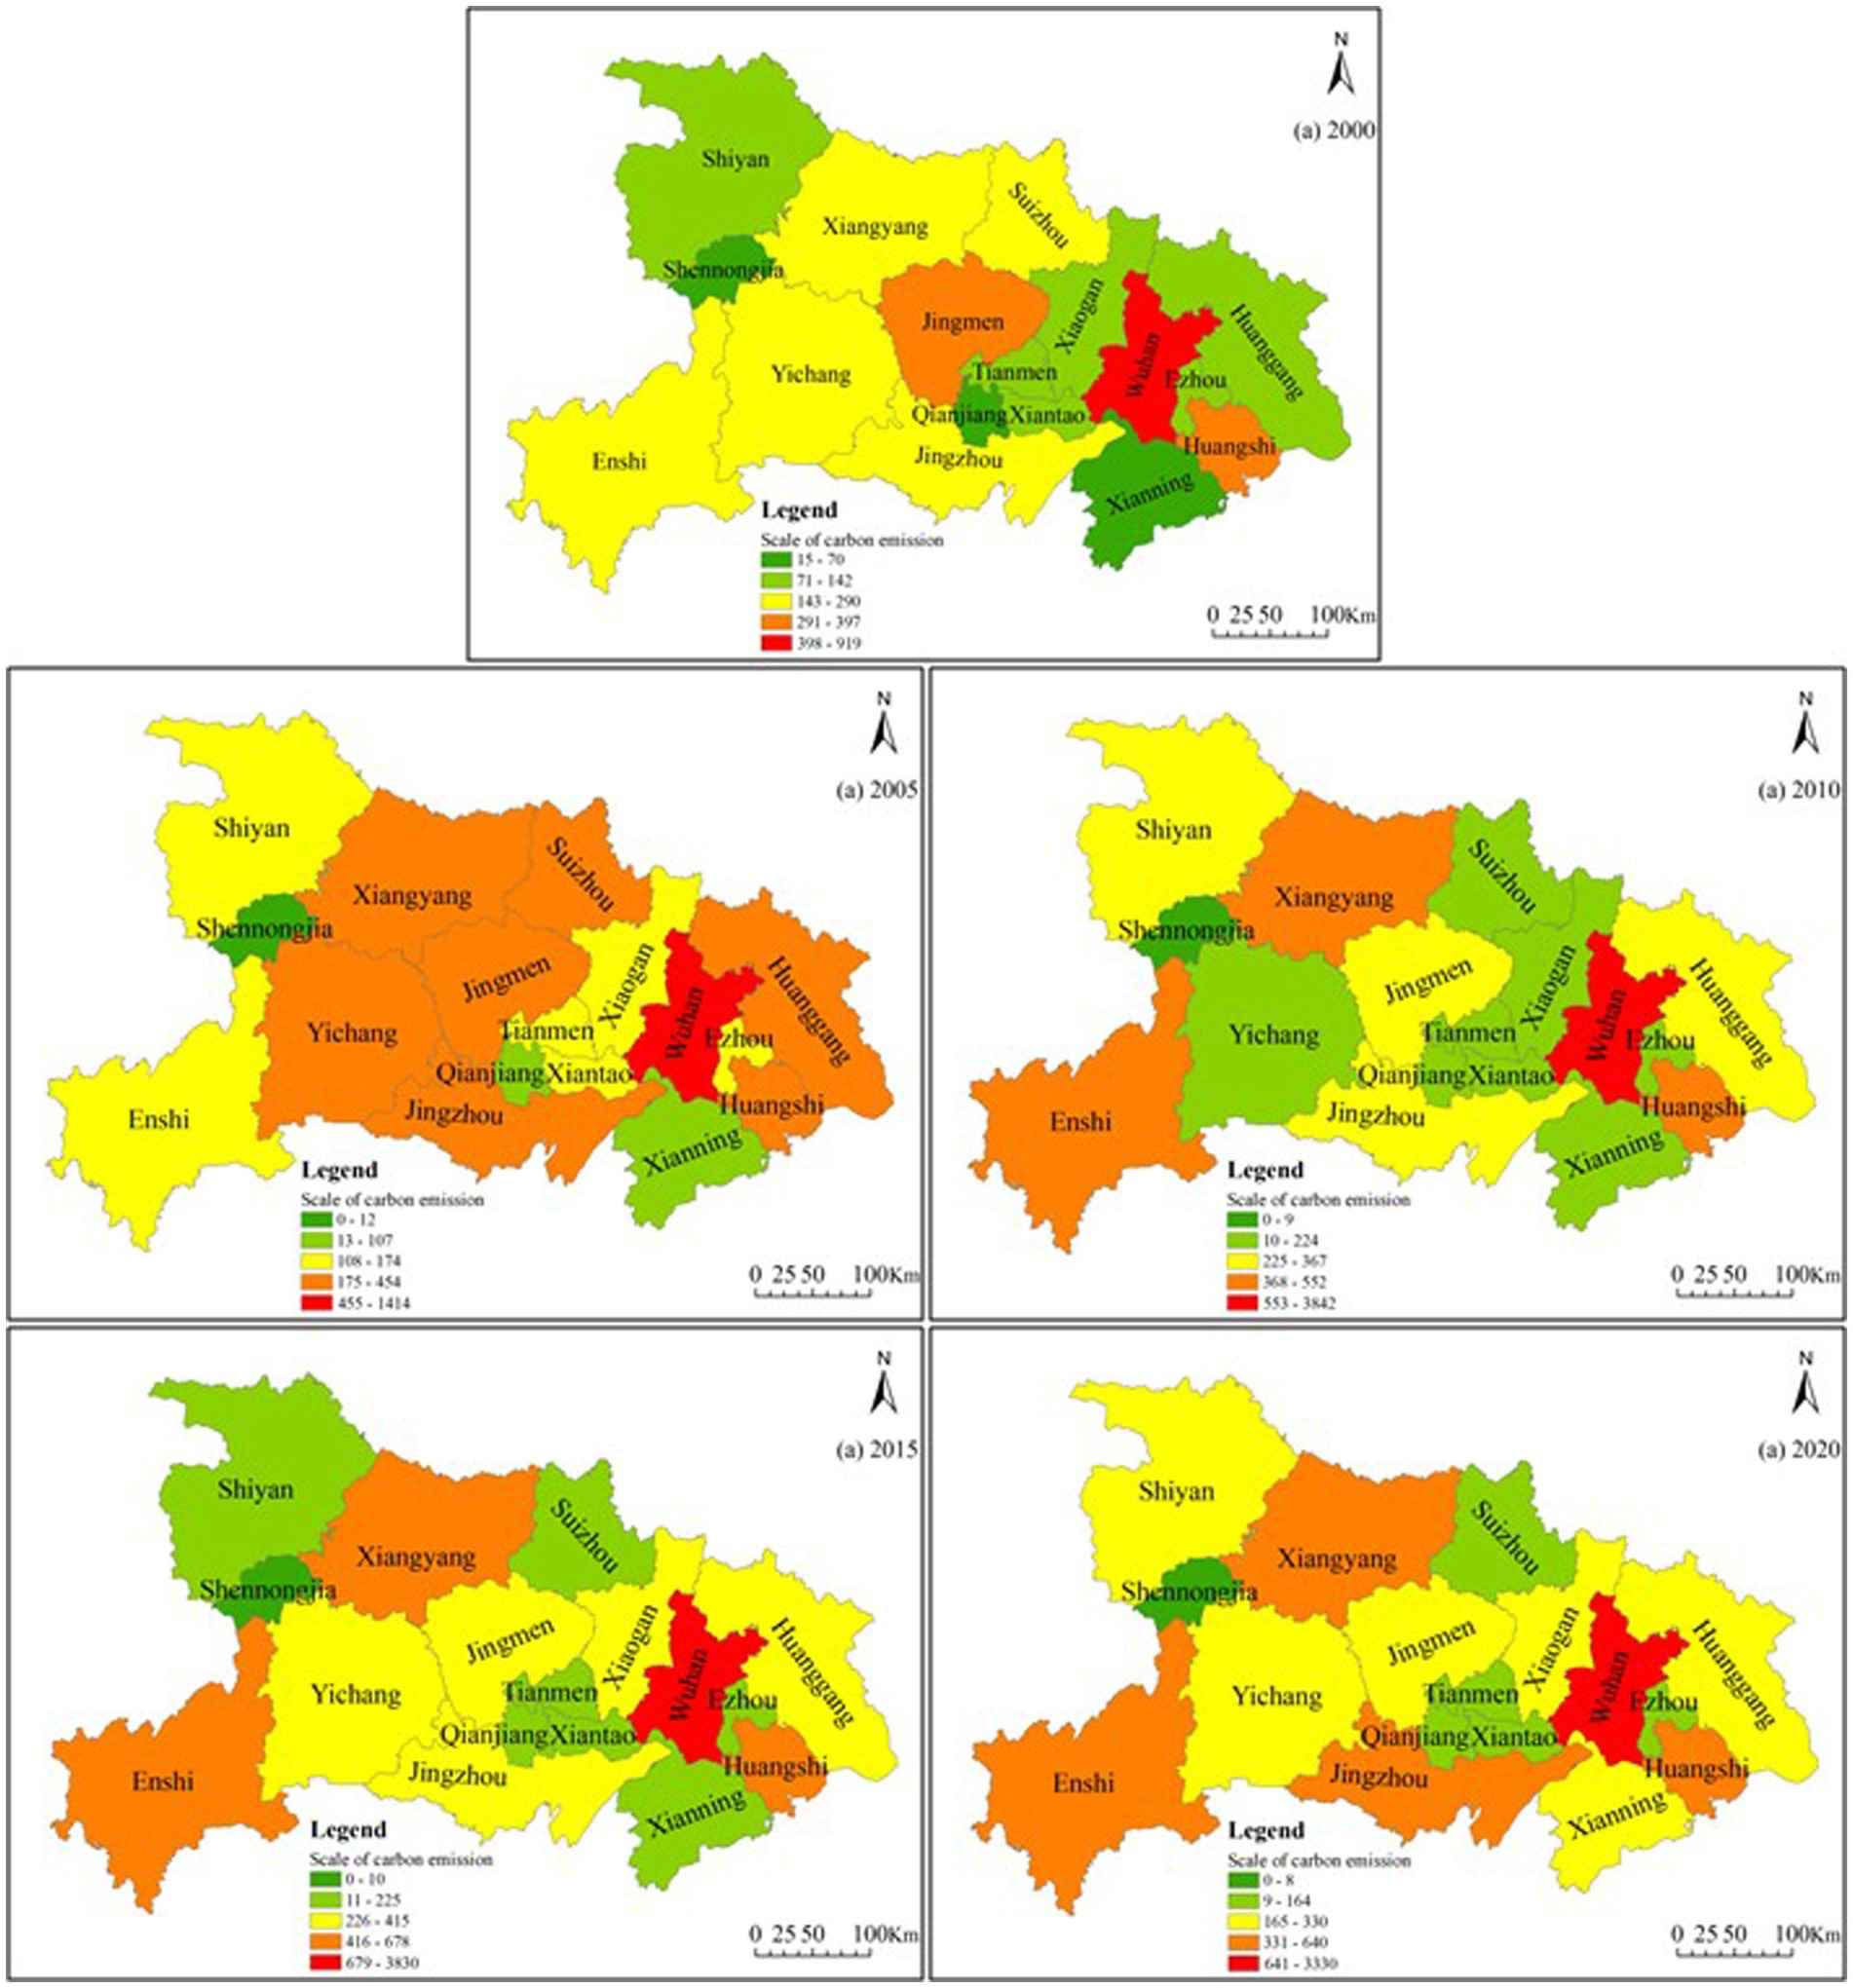
Figure 4. Spatial distribution of agricultural carbon emissions in Hubei Province (2000–2020).
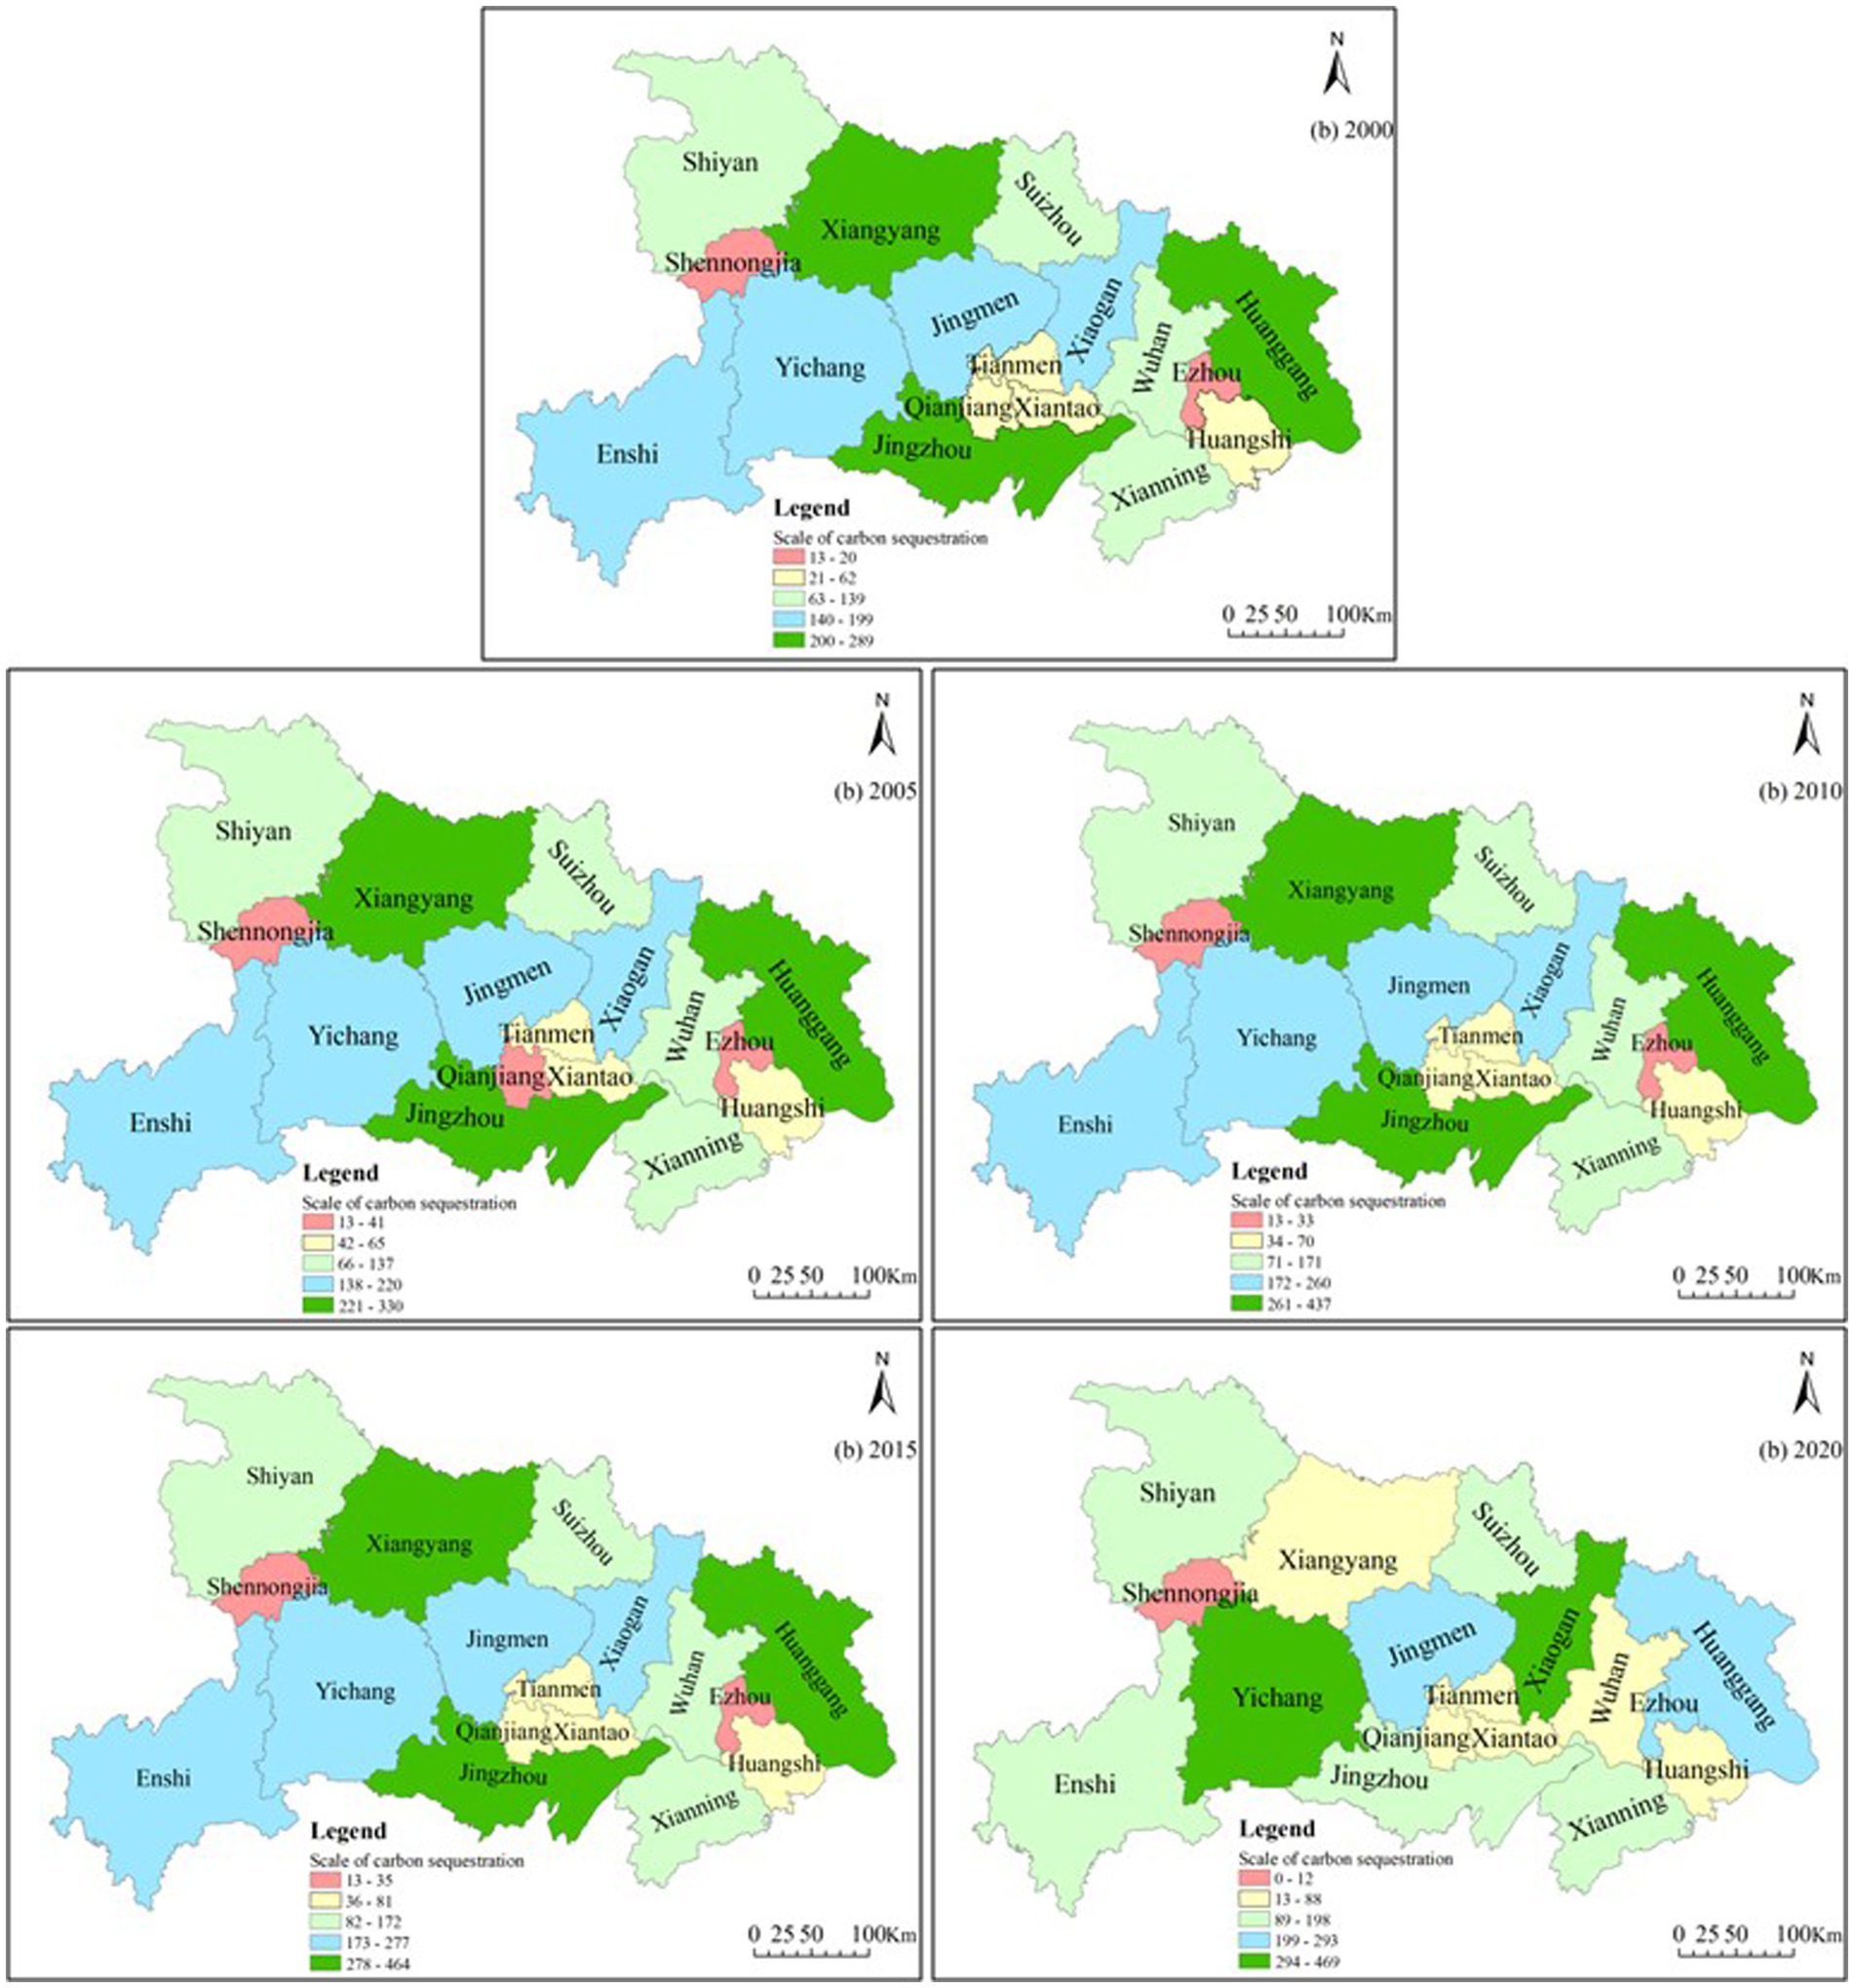
Figure 5. Spatial distribution of agricultural carbon absorption in Hubei Province (2000–2020).
The total carbon emissions in Hubei Province exhibited core–periphery zonation, with Xiangyang, Jingzhou, and Huanggang serving as the centre of high emissions and the cities of Yichang, Jingmen, Suizhou, and Xianning forming the periphery, with moderately high emissions (Figure 3). Areas with high and moderately high emissions were mainly concentrated in these six cities, which accounted for 66.2% of Hubei’s carbon emissions in 2020. The moderate-emission areas were mainly distributed along the periphery of high-emission areas, which accounted for 25.4% of the total carbon emissions in the province. The areas of high emissions accounted for 44% of all carbon emissions. The distribution of moderately low- and low-emission areas did not change much during the study period and mainly included Shennongjia, Shiyan, and Qianjiang. These areas maintain excellent ecological environments and ecosystem functioning, with high carbon absorption, thus making them important areas for ecological security in Hubei Province.
The overall trends in carbon absorption reveal that Yichang, Xiaogan, and Huanggang were high-absorption centres, accounting for 35.7% of all carbon absorption in Hubei Province. Meanwhile, the moderately high-absorption areas of Enshi, Yichang, Jingmen, and Xiangyang served as corridors and accounted for 43.2% of all carbon absorption.
In Hubei Province, high values of carbon absorption were observed in the south, and low values were recorded in the north, with stark differences in their distributions, forming a spatial structure in which high-absorption areas were centred on Xiangyang, Jingmen, and Huanggang and then expanded to the surrounding areas. The northern and central carbon sinks were relatively small, and their absorption capacity gradually decreased from west to east. Carbon absorption in Hubei Province exhibited a U-shaped pattern, with large carbon sinks in the eastern, southern, and western parts and small carbon sinks in the middle and northern regions. The reasons for this pattern are the mainly agricultural industrial structure of western Hubei Province, coupled with a mountainous terrain, limited transportation, an underdeveloped economy, and relatively slow urbanization. The high-absorption areas are vital for ensuring the ecological security of Hubei Province, as they provide valuable ecosystem functions and serve as carbon sinks.
The development of carbon absorption in Hubei Province has generally lagged behind that of carbon emissions, as shown in Figure 6. However, after nearly 20 years of development, most cities have gradually moved towards carbon neutrality, as their carbon absorption capacities have improved. This phenomenon is largely due to Hubei Province continually promoting adjustments in the industrial and energy structures, vigorously developing renewable energy, accelerating the planning and construction of large-scale wind power and photovoltaic projects, and strengthening the awareness and implementation of ecological and environmental protection policies. As a result, the carbon absorption and emissions of all cities in Hubei have become increasingly balanced.
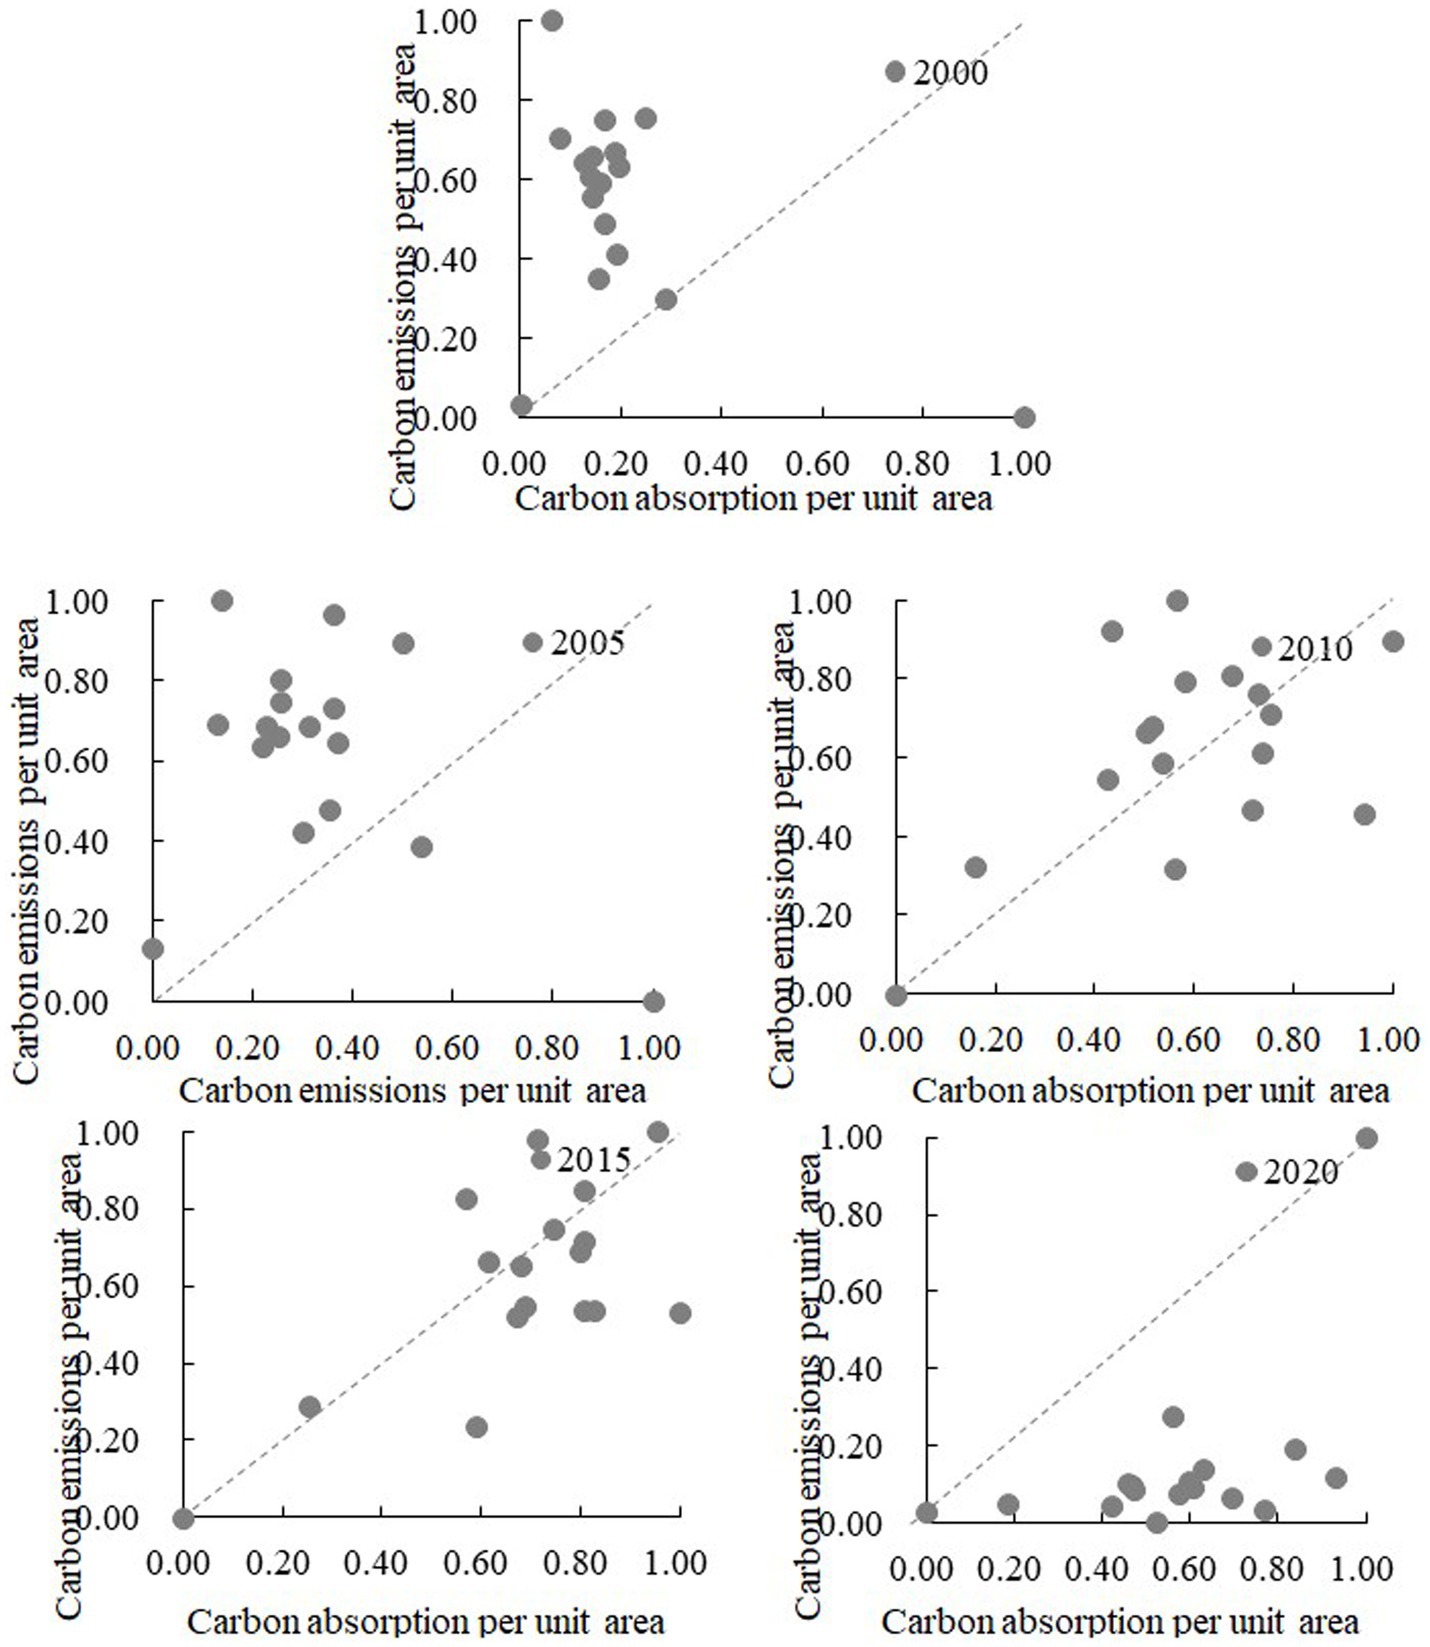
Figure 6. Scatter chart of carbon emissions and absorption per unit area of each city (2000–2020). The dashed line (L) marks the 1:1 line for the source–sink balance. Carbon emissions and sequestration per unit area have been standardized.
The agricultural coupling coordination degrees ( , Equation 7) were calculated for 17 cities in Hubei Province from 2000 to 2020, and it was found that the distance of Ezhou was the smallest (0.602), followed by those of Xiantao (0.731), Suizhou (0.861), Jingzhou (0.918), Xiangan (0.929), Yichang (0.938), and Tianmen (1.001; see Table 3). All of these cities were close to the 1:1 line, indicating that carbon emissions and absorption are strongly coupled. Meanwhile, Wuhan, Huangshi, Enshi, and Shennongjia exhibited lower degrees of coupling. Pressure on the ecological environment requires immediate attention, and strict adherence to energy conservation, emission reduction, and economic development strategies is needed. On the whole, the coupling coordination degree of agriculture in Hubei Province increased from 21.897 in 2000 to 10.840 in 2015 and then gradually decreased to 21.613 in 2020. That is, the coupling coordination degree first increased and then decreased.
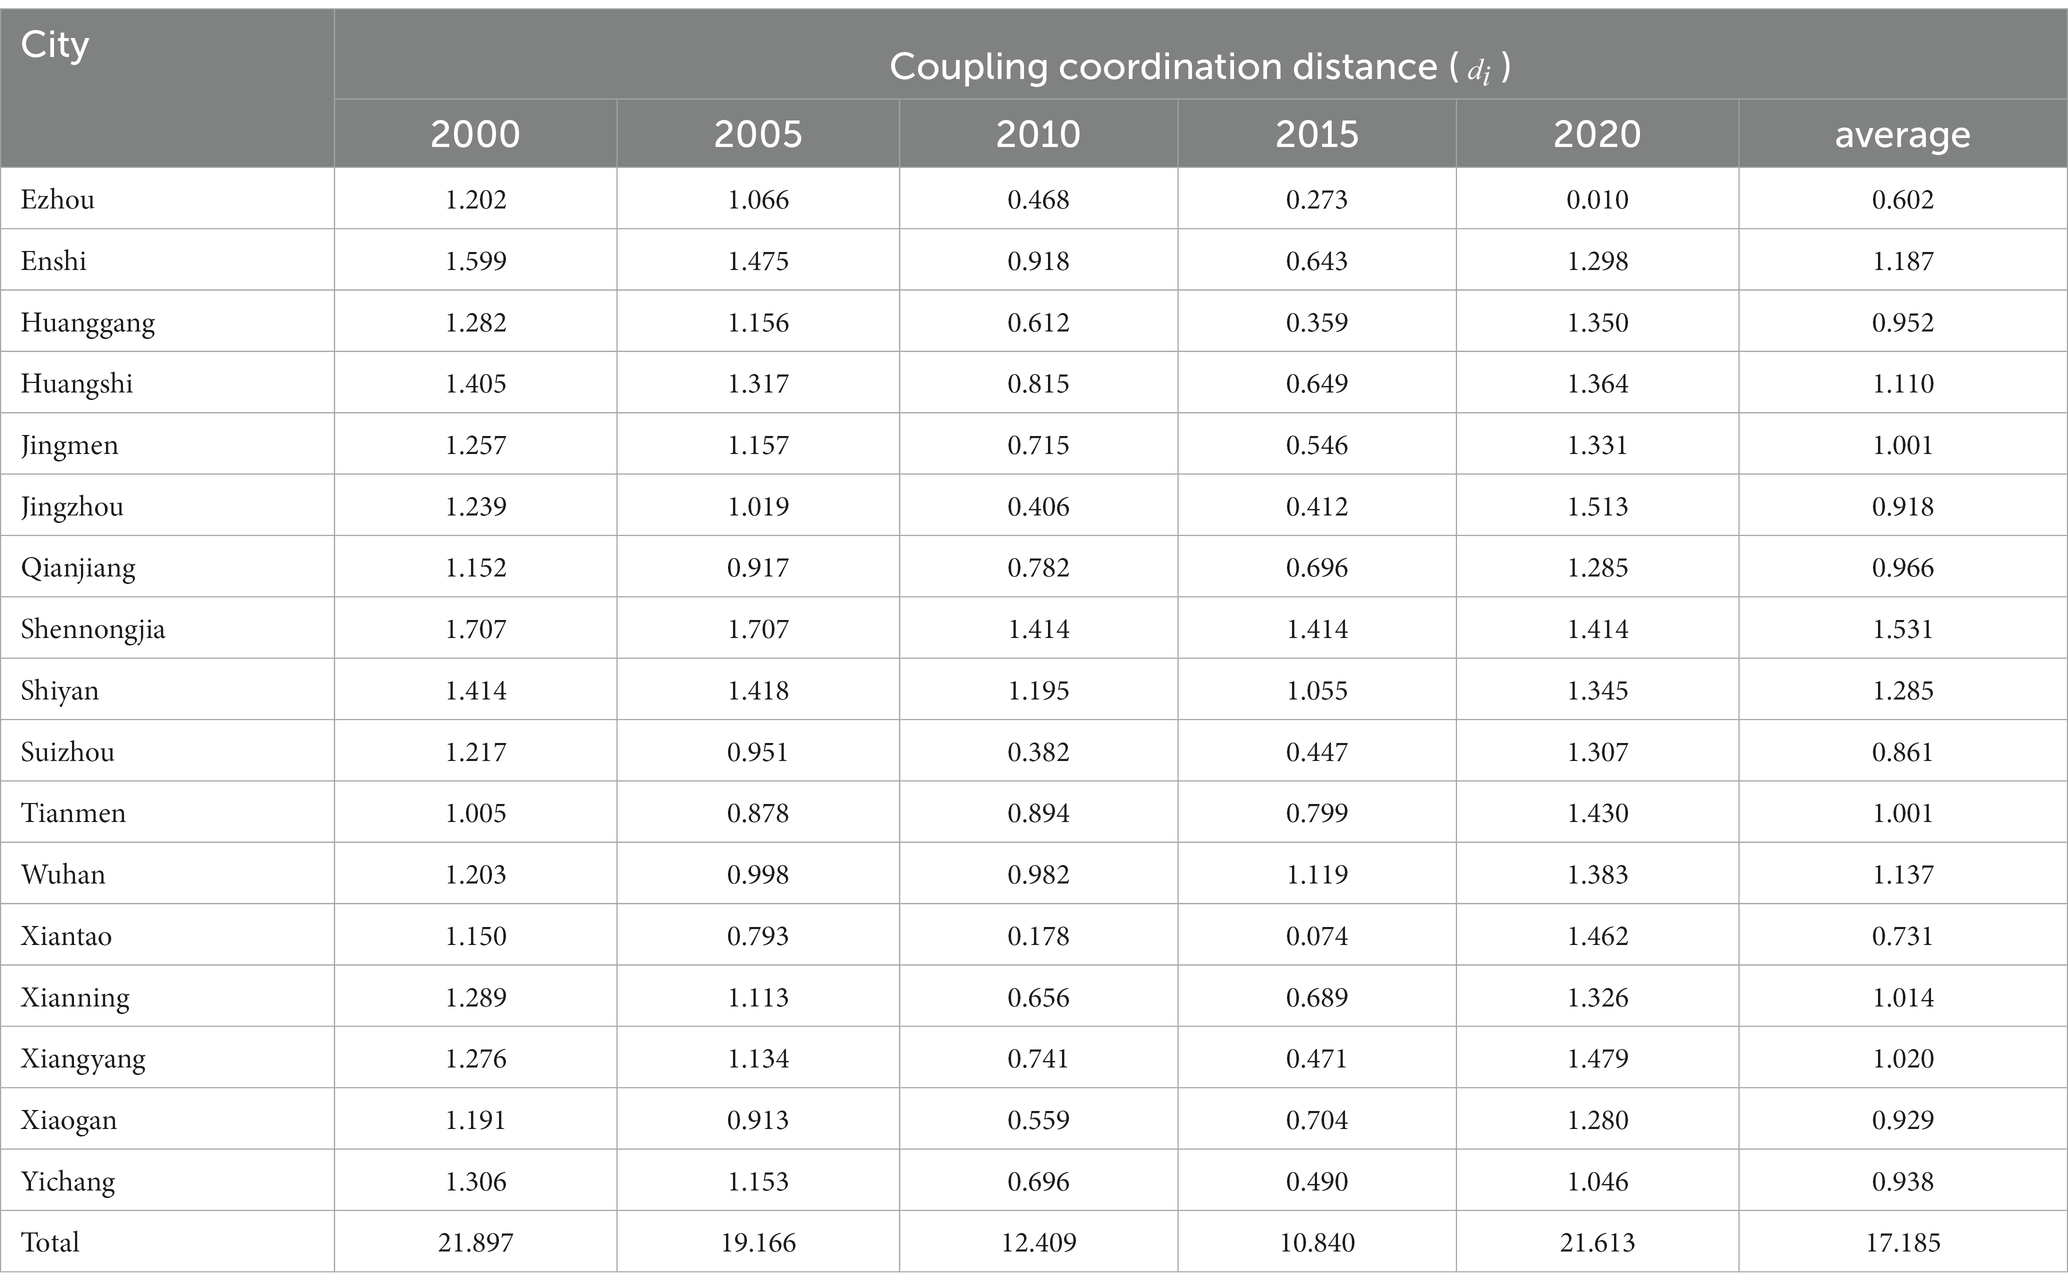
Table 3. Coupling coordination degree of carbon emissions and carbon absorption in Hubei Province.
Comparative advantage theory was introduced into carbon offset zoning based on four indices of agricultural attributes—total carbon emissions, the economic contribution coefficient of carbon emissions, the ecological carrying capacity coefficient of carbon emissions, and the degree of land development and utilization. The comparative advantage index of each attribute was measured with the comparative advantage index and the SOM-K-means cluster model developed using Stata v.17 (StataCorp, USA). The types of agricultural carbon offset areas were then categorized by combining agricultural carbon offset zoning and the values of the comparative advantage index of each attribute (see Table 4).
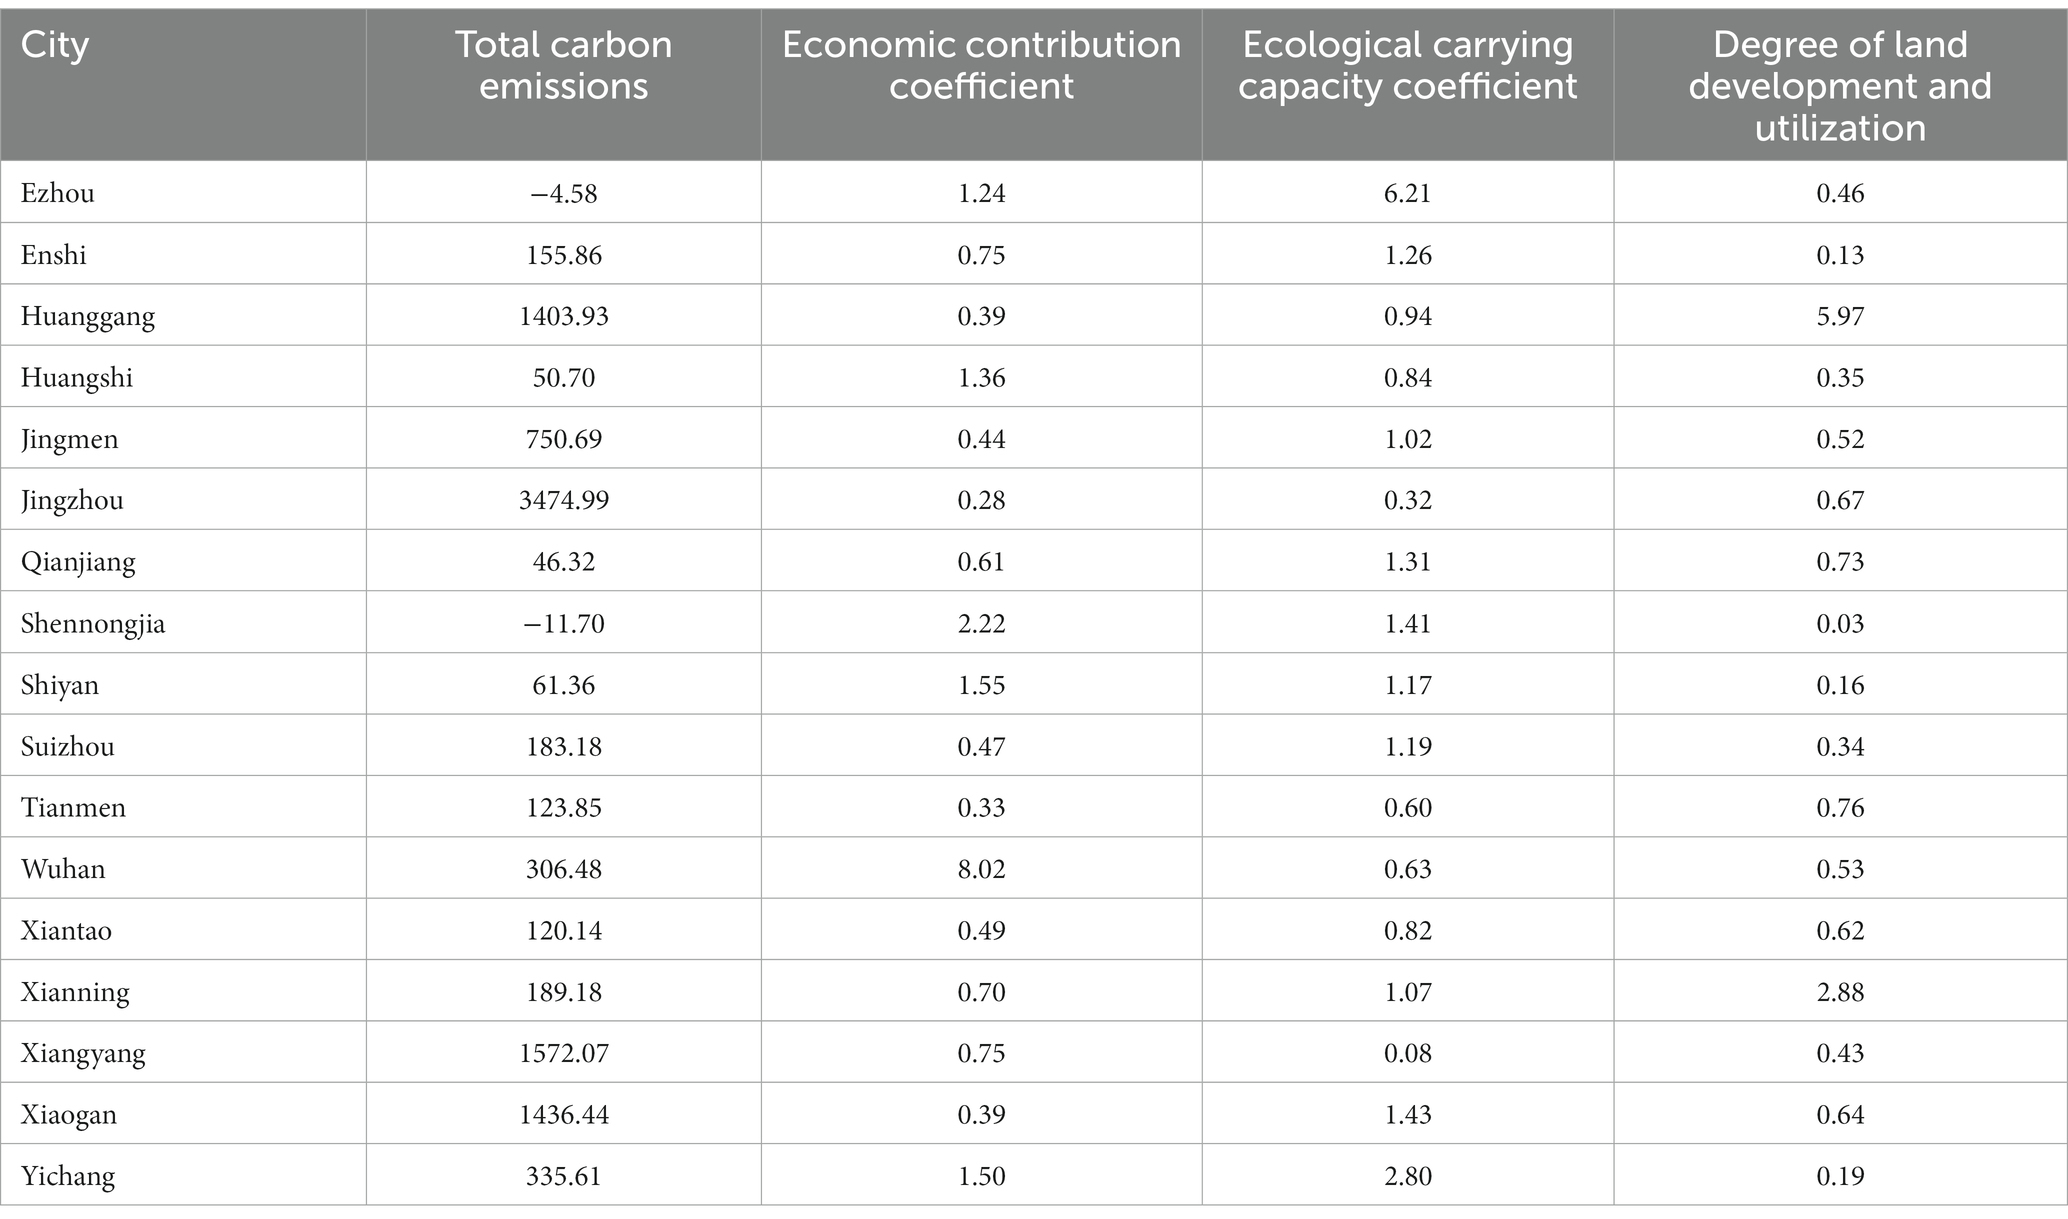
Table 4. Comparative advantage index of the land carbon budget attributes of cities in Hubei Province.
The SOM-K-means clustering model was used to cluster the comparative advantage indices of the four attributes (see Appendix Figure 1), and the 17 cities in Hubei Province were divided into one of three types of areas—seven payment areas, five balanced areas, and five compensated areas (see Table 5).

Table 5. Functional zoning of carbon offsets for cities in Hubei Province.
Cities in which carbon compensation (payment) was needed were mainly found in east-central Hubei and included Xiangyang, Jingzhou, Tianmen, Wuhan, Xiantao, Huangshi, and Huanggang. These cities are marked by a high level of agricultural development, agricultural GDP (nearly 52.5% of provincial GDP), and carbon emissions (as much as 22.4% of provincial carbon emissions). The economic contribution and ecological carrying capacities of agricultural carbon emissions in these cities were severely mismatched. For this reason, cities in payment areas should implement stricter carbon emission standards and environmental standards for agricultural permits, total agricultural carbon emissions should be strictly controlled, the carbon emissions trading system should be improved, and clean, low-carbon, safe, and efficient energy systems should be built to mitigate resource conflicts. Second, Xiangyang, Jingzhou, Jingmen and other nationally important and traditionally grain-growing areas should transform their models of agricultural development. Third, the construction of ecological cities should be comprehensively promoted, including improvements to urban forest gardens, public green areas, artificial wetlands, and green channels. Finally, the economic contribution and ecological carrying capacities of carbon emissions should be enhanced.
Cities with balanced carbon budgets were mainly located in the immediate vicinity of Wuhan and other payment zones, where city functions are expanding and there is industrial transfer. Such cities included Xianning, Shiyan, Suizhou, Qianjiang, and Xiaogan. The balanced areas accounted for up to 1.88% of the provincial cultivated land area and had a lower share of agricultural GDP (15.0%) and a carbon emission share of 24.9%. Additionally, the economic contributions of carbon emissions and the ecological functioning of carbon sinks were better aligned. Therefore, cities in balanced areas should focus on optimizing the spatial structures of their agricultural land usage, moderately controlling urban sprawl, exploring the potential of various types of agricultural lands, and improving the efficiency of cultivated land and energy utilization, as well as the efficiency of economic output. Most of the municipalities in the balanced areas are important high-quality agricultural production bases, with favourable conditions and a foundation for agricultural development. Their development can be optimized by improving the efficiency of land production and by actively promoting the regional distribution of agricultural products and the development of ecological (sustainable and/or regenerative) agriculture. Finally, the over-occupation of agricultural lands and other lands by urban construction should be controlled, and the construction of urban forests, green park areas, and landscaped rivers should be expanded to enhance agricultural carbon absorption.
Cities within the compensated areas were mainly located in eastern Hubei and included Enshi, Shennongjia, and Yichang, which jointly accounted for 1.6% of the provincial cultivated land area. These cities displayed a low degree of spatial development, with an average value of 8.6%, as well as lagging economic development. Shennongjia and Enshi, among other municipalities, are important water conservation and ecological tourism areas in Hubei Province. To optimize the balance between economic and ecological functioning in Hubei Province, cities within the compensated areas should emphasize the rational planning of agricultural production lands, impose strict controls on regional urbanization and large-scale industrialization, and vigorously develop a green low-carbon economy. Additionally, these cities should promote the growth of forests and the cultivation of fruits and herbal medicine, steadily increase their forest coverage, and enhance the ecological carrying capacity of carbon emissions. Efforts should be increased to protect various types of nature reserves, scenic spots, and forest parks, with emphasis on water conservation, soil and water maintenance, afforestation, and greening projects. New tourism services should also be developed to increase ecotourism, nature education, and eco-friendly leisure and vacation activities.
This paper aims to examine the characteristics of the spatiotemporal differences in the carbon balance in Hubei Province, focusing on major functional zones. Furthermore, it presents a specialized spatial optimization scheme for carbon compensation with a low-carbon focus. This research is in line with global strategic objectives related to energy conservation. It holds substantial significance for advancing collaborative environmental governance both within China and on a global scale, nurturing synergistic innovation, and guiding sustainable development. Based on the findings of this study, the subsequent sections will explore the insights that it provides regarding carbon emissions.
First, during the initial phases of agricultural carbon impact research, studies frequently concentrated solely on the assessment of six emission factors: fertilizers, pesticides, plastic film, diesel, ploughing, and irrigation (Arenas-Calle et al., 2019; Meier et al., 2020). This approach had a relatively narrow focus and limited inventory coverage. Conversely, some research primarily emphasized the carbon sequestration effects of agriculture, with less consideration given to its carbon source effects. As research has advanced, specific scholars have enhanced traditional inventories by establishing connections between agricultural carbon emissions and carbon absorption effects (Hu et al., 2023), thereby conducting in-depth analyses of the net carbon impact (Demenois et al., 2020). Their findings revealed that agriculture in China acts as a carbon sink rather than as a carbon source. In contrast to previous studies, this paper endeavours to broaden the accounting inventory to encompass both agricultural cultivation and livestock farming. Additionally, it concurrently takes into account the carbon absorption effects of crops, facilitating the estimation of both agricultural carbon emissions and carbon absorption (Lu and Yang, 2023). In practice, agriculture is anticipated to be a carbon source due to its engagement in high-carbon agricultural inputs, the release of soil carbon, methane emissions from paddy fields, and various other sources of emissions. While crops absorb and sequester significantly during their growth cycle, their long-term influence on carbon cycling is relatively modest (Zhao et al., 2015). This modest effect is because the carbon that crops capture can be subsequently released into the atmosphere through processes such as consumption as food or industrial raw materials, the burning of crop residues, or decomposition when reintroduced into fields. Previous conclusions that classified “agriculture in China as a carbon sink” were grounded in a singular focus on the one-year carbon absorption of crops and did not account for subsequent carbon release activities, such as the management of crop residues. Disregarding these factors will significantly undermine the accuracy of the calculations. Thus, continuous enhancements to agricultural carbon accounting inventories and the precision of emission coefficients are imperative to objectively depict the genuine carbon effects.
Second, carbon offsetting is fundamentally an ecological compensation mechanism centred on “carbon,” with the goal of promoting equitable development and fostering collaborative efforts to reduce carbon emissions across regions. However, in practice, the fairness and collaborative aspects of carbon emission reduction between regions are influenced by a multitude of factors. These factors encompass per capita carbon emissions, various levels and stages of economic development, industrial structures, and degrees of poverty (Zhao et al., 2018). Considering the accessibility of data, this paper exclusively focuses on factors such as scale, efficiency, and spatial considerations to formulate a theoretical framework for carbon offsetting (Koondhar et al., 2021b). In the future, it will be crucial to comprehensively take into account the natural and socioeconomic conditions within regions. Moreover, continuous efforts should be made to enhance and refine the theoretical framework for regional carbon offsetting.
Third, as an exploratory study, this paper has exclusively delineated regions based on carbon offset types. In the future, it is crucial to integrate regional resource endowments, carbon emission intensity, economic development, industrial conditions, and carbon pricing. Such integration is necessary to establish baseline carbon offset values, calculate carbon offset values, and advance the coordinated development of regions with a focus on low-carbon strategies. As a vital mechanism utilizing market forces to optimize the allocation of carbon emission rights and achieve cost-effective carbon reduction and high-quality economic development, carbon emissions trading urgently requires regional carbon offsetting to be integrated into corporate carbon trading markets (Balsalobre-Lorente et al., 2019). Such integration should also encompass the creation of a robust cross-regional carbon offset system and a carbon emission quota regime. Additionally, exploring diverse pathways to meet energy conservation and emission reduction objectives is pivotal for achieving regional equity development and fostering collaborative efforts in carbon reduction. Furthermore, it is noteworthy that current carbon balance and carbon offset research predominantly concentrates on the carbon emissions stemming from end-consumption within regions, with inadequate attention directed towards the implicit carbon balance and offsetting among regions. In the future, there will be an urgent need to enhance research efforts related to implicit carbon balance and offsetting, along with the delineation of regions classified by offset types.
Finally, the variations in the regional carbon balance and carbon offsetting exhibit a high degree of sensitivity to changes in spatial scales. The evolving patterns and mechanisms of the carbon balance and carbon offsetting at various spatial scales are not consistent (Koondhar et al., 2021a). Generally, as the spatial scale of the carbon balance and carbon offsetting expands and the natural and socioeconomic conditions within regions become more intricate, research outcomes related to the carbon balance and carbon offsetting may become increasingly distorted (Yasmeen et al., 2022), hindering the development of specific and effective carbon-offsetting strategies. Hence, there is significant practical value in conducting research on the carbon balance and cross-sectoral carbon offsetting at a finer, more micro-scale level. Looking ahead, it is imperative to conduct research at finer scales and to intensify the examination of the carbon balance and carbon offsetting at the level of townships or villages as spatial units.
Agriculture is the second most important source of greenhouse gas emissions, and the total amount of and growth in agricultural greenhouse gas emissions cannot be underestimated. Conducting agricultural carbon budget assessments and building a regional horizontal carbon compensation model for promoting coordinated regional low-carbon development hold great practical significance. In this study, 17 prefecture-level cities in Hubei Province were used to explore the spatiotemporal variations in agricultural carbon emissions and carbon absorption based on land use, energy consumption, and offset zoning. The main conclusions were as follows:
1. Both agricultural carbon emissions and absorption in Hubei Province increased year by year, with obvious differences observed in the agricultural carbon balances among cities. Arable lands were the main agricultural carbon sinks in Hubei Province.
2. Total agricultural carbon emissions showed a core–periphery structure, with Xiangyang, Jingzhou, and Huanggang serving as the centre of high emissions and Yichang, Jingmen, Suizhou, and Xianning serving as the periphery, with moderately high emissions that gradually decreased with increasing distance from the centre. These six cities accounted for 66.2% of all carbon emissions in the province. The moderate-emission cities collectively accounted for 25.4% of all provincial carbon emissions. The distribution of moderately low- and low-emission cities did not change much over time and mainly included Shennongjia, Enshi, and Yichang.
3. The distribution of agricultural carbon absorption in Hubei Province exhibited a U-shaped pattern, wherein high absorption was observed in the south and little absorption was seen in the north. Absorption differed markedly among cities. Yichang, Xiaogan, and Huanggang formed a central high-absorption area that expanded to the surrounding areas. The capacities of carbon sinks were lower in the northern and central cities and declined from west to east, while high levels of absorption were observed in the east, south, and west.
4. From the perspective of coupled agricultural carbon emissions and absorption, it was observed that the development of carbon absorption lagged behind that of carbon emissions in each city. However, as shown by the scatter points for each city gradually approaching the 1:1 line (carbon neutrality), Hubei Province has continually promoted the adjustment of the agricultural industrial and energy structures, such that the carbon absorption and emissions of each city are becoming more balanced and gradually approaching the goal of carbon neutrality.
5. Payment, compensated, and balanced areas were delineated for carbon offset zoning in Hubei Province. The payment areas included Xiangyang, Jingzhou, Tianmen, Wuhan, Xiantao, Huangshi, and Huanggang; the balanced areas included Xianning, Shiyan, Suizhou, Qianjiang, and Xiaogan; and the compensated areas included Enshi, Shennongjia, Yichang, Jingmen, and Ezhou. For each of these areas, differentiated measures were proposed to spatially optimize carbon compensation in the province.
Agricultural carbon emissions are closely related to the ecological environment. Exploring the spatial evolution and functional zoning of agricultural carbon emissions can provide a reference for the rational development of agricultural carbon emission reduction measures. Based on the research conclusions, the following suggestions are made:
First, it is necessary to pay attention to key emission sources and implement agricultural carbon reduction sources and increase sinks through classification. In particular, enhancing the efficiency of chemical inputs such as fertilizers and pesticides while promoting the adoption of precision farming techniques and the use of organic fertilizers and biopesticides is essential to mitigate the carbon emissions associated with agricultural inputs (Guan et al., 2023). It is important to advocate the adoption of conservation tillage practices, actively optimize crop species and the crop layout, and achieve carbon sequestration in farmlands. The government should provide incentives and subsidies for the research, production, and adoption of low-carbon cultivation technologies, thereby increasing the carbon sequestration income for relevant stakeholders. It is also important to explore establishing a scientifically sound agricultural carbon offset mechanism, equitably collecting carbon emission taxes (Dumortier and Elobeid, 2021), and allocating a specified proportion as carbon sink subsidies for transfer payments to low-carbon production entities. Second, the protection of farmland, forests, and grasslands should be enhanced to increase carbon sink reserves. Provinces with lower carbon sequestration capacities can engage in afforestation and reforestation activities to enhance forest cover while rigorously implementing a quota-based logging system for sustainable forest management. Simultaneously, there should be a reinforced focus on the conservation and management of grassland ecosystems while establishing a robust mechanism for farmland protection. It is advisable to explore the development of unused and idle lands, facilitating their transition into land-use categories such as forests, grasslands, and farmlands. Optimizing the land use structure involves controlling the overall quantity of land allocated for construction purposes and implementing sensible planning for construction land. This approach aims to enhance land use efficiency and achieve a more sustainable and intensive form of land utilization, promoting land conservation and efficiency. Third, there are disparities in the agricultural carbon emission efficiencies within different cities, highlighting the importance of focusing on inter-regional collaborative emission reduction initiatives. The carbon emissions in various cities exhibit complex spatiotemporal variations. Therefore, it is essential to focus on regions with advanced agricultural carbon emission efficiencies and to design cross-regional mechanisms for exchanging low-carbon agricultural technologies and experiences. This approach aims to narrow the gap in agricultural carbon emission efficiencies among different cities.
This paper had some limitations. Owing to data limitations, only agricultural carbon budgets were studied at the municipal level. In the future, it will be necessary to conduct similar research at a finer scale, thereby strengthening the understanding of agricultural carbon budgets and offsets at the township or village scale. Agriculture refers to five forms of industry, including planting, forestry, animal husbandry, fishery and sideline businesses. This study takes only the planting industry and animal husbandry as the main research objects and does not study fishery and forestry. Therefore, we will further expand the research objects in the future.
Publicly available datasets were analyzed in this study. This data can be found here: www.gscloud.cn.
QC: Data curation, Formal Analysis, Methodology, Visualization, Writing – original draft. YM: Methodology, Software, Visualization, Writing – review & editing. JC: Conceptualization, Methodology, Visualization, Writing – review & editing.
The author(s) declare financial support was received for the research, authorship, and/or publication of this article. This study was supported by the National Natural Science Foundation of China (grant nos. 42161037), Hubei University of Economics Research Project (PYYB201907), Scientific research Project of Hubei Education Department (grant no. B2021171 and 21Q204), and Humanities and Social Science Project of Guangxi Universities (2021QGRW059).
We sincerely thank the editor and referees, whose remarks have been very constructive and inspiring in preparing the final version of the paper.
The authors declare that the research was conducted in the absence of any commercial or financial relationships that could be construed as a potential conflict of interest.
All claims expressed in this article are solely those of the authors and do not necessarily represent those of their affiliated organizations, or those of the publisher, the editors and the reviewers. Any product that may be evaluated in this article, or claim that may be made by its manufacturer, is not guaranteed or endorsed by the publisher.
The Supplementary material for this article can be found online at: https://www.frontiersin.org/articles/10.3389/fsufs.2023.1286567/full#supplementary-material
Appendix Figure 1 | SOMK-means clustering partitioning of land use in Hubei Province.
1. ^The planting industry is a major part of agriculture. It usually refers to the sector of agriculture in which crops are cultivated for plant products.
2. ^Website: http://www.globallandcover.com/
3. ^Website: www.gscloud.cn
4. ^Website: www.epschinadata.com
Aljenaid, S., Abido, M., Redha, G. K., AlKhuzaei, M., Marsan, Y., Khamis, A. Q., et al. (2022). Assessing the spatiotemporal changes, associated carbon stock, and potential emissions of mangroves in Bahrain using gis and remote sensing data. Reg. Stud. Mar. Sci. 52:102282. doi: 10.1016/j.rsma.2022.102282
Arenas-Calle, L. N., Whitfield, S., and Challinor, A. J. (2019). A climate smartness index (csi) based on greenhouse gas intensity and water productivity: application to irrigated rice. Front. Sustain. Food Syst. 3:105. doi: 10.3389/fsufs.2019.00105
Balsalobre-Lorente, D., Driha, O. M., Bekun, F. V., and Osundina, O. A. (2019). Do agricultural activities induce carbon emissions? The brics experience. Environ. Sci. Pollut. Res. Int. 26, 25218–25234. doi: 10.1007/s11356-019-05737-3
Chen, Y., Chen, X., Zheng, P., Tan, K., Liu, S., Chen, S., et al. (2022a). Value compensation of net carbon sequestration alleviates the trend of abandoned farmland: a quantification of paddy field system in China based on perspectives of grain security and carbon neutrality. Ecol. Indic. 138:108815. doi: 10.1016/j.ecolind.2022.108815
Chen, J., Gao, M., Li, D., Li, L., Song, M., and Xie, Q. (2021). Changes in pm2.5 emissions in China: an extended chain and nested refined laspeyres index decomposition analysis. J. Clean. Prod. 294:126248. doi: 10.1016/j.jclepro.2021.126248
Chen, Y., Wang, S., and Lu, S. (2022b). The impact of agricultural trade on agricultural carbon emissions: the threshold effect of digital rural development. J. Huazhong Agric. Univ., 41, 45–57. doi: 10.13300/j.cnki.hnwkxb.2022.06.005
Cheng, K., Pan, G., Smith, P., Luo, T., Li, L., Zheng, J., et al. (2011). Carbon footprint of china’s crop production—an estimation using an gro-statistics data over 1993–2007. Agriculture, Ecosystems & Environment 142, 231–237. doi: doi: 10.1016/j.agee.2011.05.012
Churkina, G. (2008). Modeling the carbon cycle of urban systems. Ecol. Model. 216, 107–113. doi: 10.1016/j.ecolmodel.2008.03.006
Churkina, G., Brown, D. G., and Keoleian, G. (2010). Carbon stored in human settlements: the conterminous United States. Glob. Chang. Biol. 16, 135–143. doi: 10.1111/j.1365-2486.2009.02002.x
Dai, X., and Yang, Y. (2020). Carbon emission measurement, driving effect and space-time characteristics of china’s provincial planting industry from 2007 to 2016. Journal of Sichuan Agricultural University 38, 241–250. doi: 10.16036/j.issn.1000-2650.2020.02.017
Demenois, J., Torquebiau, E., Arnoult, M. H., Eglin, T., and Médoc, J. (2020). Barriers and strategies to boost soil carbon sequestration in agriculture. Front. Sustain. Food Syst. 4:37. doi: 10.3389/fsufs.2020.00037
Dumortier, J., and Elobeid, A. (2021). Effects of a carbon tax in the United States on agricultural markets and carbon emissions from land-use change. Land Use Policy 103:105320. doi: 10.1016/j.landusepol.2021.105320
Fan, J. (2015). China main function zoning plan. Acta Geograph. Sin. 70, 186–201. doi: 10.11821/dlxb201502002
Gan, J., Chen, M., Semple, K., Liu, X., Dai, C., and Tu, Q. (2022). Life cycle assessment of bamboo products: review and harmonization. Sci. Total Environ. 849:157937. doi: 10.1016/j.scitotenv.2022.157937
Gossling, S. (2009). Carbon neutral destinations: a conceptual analysis. J Sustain Tour. 17, 17–37. doi: 10.1080/09669580802276018
Guo, Z., Zhang, X., Zheng, Y., and Rao, R. (2014). Exploring the impacts of a carbon tax on the chinese economy using a cge model with a detailed disaggregation of energy sectors. Energy Econ 45, 455–462. doi: 10.1016/j.eneco.2014.08.016
Guan, N., Liu, L., Dong, K., Xie, M., and Du, Y. (2023). Agricultural mechanization, large-scale operation and agricultural carbon emissions. Cogent. Food Agric. 9:2238430. doi: 10.1080/23311932.2023.2238430
Guo, X., He, J., Lan, M., Hang, Y., and Yan, W. (2022). Modeling carbon emission estimation for hinterland-based container intermodal network. J. Clean. Prod. 378:134593. doi: 10.1016/j.jclepro.2022.134593
Herrero, C. C., Laso, J., Cristóbal, J., Fullana-i-Palmer, P., Albertí, J., Fullana, M., et al. (2022). Tourism under a life cycle thinking approach: a review of perspectives and new challenges for the tourism sector in the last decades. Sci. Total Environ. 845:157261. doi: 10.1016/j.scitotenv.2022.157261
Hu, Y., Zhang, K., Hu, N., and Wu, L. (2023). Summary of research on carbon emission measurement in chinese agriculture. Chin. J. Eco-Agric., 30, 1–14.
Ji, X., and Chen, B. (2017). Assessing the energy-saving effect of urbanization in China based on stochastic impacts by regression on population, affluence and technology (stirpat) model. J. Clean. Prod. 163, S306–S314. doi: 10.1016/j.jclepro.2015.12.002
Ke, Y., Xia, L., Huang, Y., Li, S., Zhang, Y., Liang, S., et al. (2022). The carbon emissions related to the land-use changes from 2000 to 2015 in Shenzhen, China: implication for exploring low-carbon development in megacities. J. Environ. Manag. 319:115660. doi: 10.1016/j.jenvman.2022.115660
Khanal, A., Rahman, M. M., Khanam, R., and Velayutham, E. (2022). Does tourism contribute towards zero-carbon in Australia? Evidence from ardl modelling approach. Energy Strateg. Rev. 43:100907. doi: 10.1016/j.esr.2022.100907
Koondhar, M. A., Aziz, N., Tan, Z., Yang, S., Raza Abbasi, K., and Kong, R. (2021a). Green growth of cereal food production under the constraints of agricultural carbon emissions: a new insights from ardl and vecm models. Sustain. Energy Technol. Assess. 47:101452. doi: 10.1016/j.seta.2021.101452
Koondhar, M. A., Tan, Z., Alam, G. M., Khan, Z. A., Wang, L., and Kong, R. (2021b). Bioenergy consumption, carbon emissions, and agricultural bioeconomic growth: a systematic approach to carbon neutrality in China. J. Environ. Manag. 296:113242. doi: 10.1016/j.jenvman.2021.113242
Li, L., Dong, J., Xu, L., and Zhang, J. (2019). Spatial variation of land use carbon budget and carbon compensation zoning in functional areas: a case study of Wuhan city circle. J. Nat. Resour. 34, 1003–1015. doi: 10.31497/zrzyxb.20190508
Li, L., Quinlivan, P. A., and Knappe, D. R. U. (2002). Effects of activated carbon surface chemistry and pore structure on the adsorption of organic contaminants from aqueous solution. Carbon N Y 40, 2085–2100. doi: 10.1016/S0008-6223(02)00069-6
Lin, B., and Ge, J. (2019). Valued forest carbon sinks: how much emissions abatement costs could be reduced in China. J. Clean. Prod. 224, 455–464. doi: 10.1016/j.jclepro.2019.03.221
Lin, T., Lin, F., Wu, P., Hämmerle, M., Höfle, B., Bechtold, S., et al. (2017). Multiscale analysis and reduction measures of urban carbon dioxide budget based on building energy consumption. Energ. Build. 153, 356–367. doi: 10.1016/j.enbuild.2017.07.084
Lu, Q., and Yang, C. (2023). Research on the trends and driving factors of carbon emissions from grain planting in China. Eco. Prob., 44, 114–121. doi: 10.16011/j.cnki.jjwt.2023.01.006
Mäntymaa, E., Juutinen, A., Tyrväinen, L., Karhu, J., and Kurttila, M. (2018). Participation and compensation claims in voluntary forest landscape conservation: the case of the ruka-kuusamo tourism area, Finland. J. For. Econ. 33, 14–24. doi: 10.1016/j.jfe.2018.09.003
Marchi, M., Jørgensen, S. E., Pulselli, F. M., Marchettini, N., and Bastianoni, S. (2012). Modelling the carbon cycle of Siena province (tuscany, Central Italy). Ecol. Model. 225, 40–60. doi: 10.1016/j.ecolmodel.2011.11.007
Meier, E. A., Thorburn, P. J., Bell, L. W., Harrison, M. T., and Biggs, J. S. (2020). Greenhouse gas emissions from cropping and grazed pastures are similar: a simulation analysis in Australia. Front. Sustain. Food Syst. 3:121. doi: 10.3389/fsufs.2019.00121
Mello, K. D., Fendrich, A. N., Borges-Matos, C., Brites, A. D., Tavares, P. A., Da Rocha, G. C., et al. (2021). Integrating ecological equivalence for native vegetation compensation: a methodological approach. Land Use Policy 108:105568. doi: 10.1016/j.landusepol.2021.105568
Mishina, Y., and Muromachi, Y. (2012). Revisiting decomposition analysis for carbon dioxide emissions from car travel: introduction of modified laspeyres index method. Transp. Res. Rec. 2270, 171–179. doi: 10.3141/2270-20
Page, K. L., Dang, Y. P., and Dalal, R. C. (2020). The ability of conservation agriculture to conserve soil organic carbon and the subsequent impact on soil physical, chemical, and biological properties and yield. Front. Sustain. Food Syst. 4:31. doi: 10.3389/fsufs.2020.00031
Rehman, A., Ma, H., Ozturk, I., and Ulucak, R. (2022). Sustainable development and pollution: the effects of co2 emission on population growth, food production, economic development, and energy consumption in Pakistan. Environ. Sci. Pollut. Res. Int. 29, 17319–17330. doi: 10.1007/s11356-021-16998-2
Rico, A., Martínez-Blanco, J., Montlleó, M., Rodríguez, G., Tavares, N., Arias, A., et al. (2019). Carbon footprint of tourism in Barcelona. Tour. Manag. 70, 491–504. doi: 10.1016/j.tourman.2018.09.012
Schandl, H., Marcos-Martinez, R., Baynes, T., Yu, Z., Miatto, A., and Tanikawa, H. (2020). A spatiotemporal urban metabolism model for the Canberra suburb of braddon in Australia. J. Clean. Prod. 265, 121770–1217793. doi: 10.1016/j.jclepro.2020.121770
Shang, J., and Yang, B. (2019). Calculation of carbon source and carbon sink of planting industry and dynamic analysis of influencing factors of net carbon sink: Shandong example. Reform, 123–134.
Teng, X., Zhao, Q., Zhang, P., Liu, L., Dong, Y., Hu, H., et al. (2021). Implementing marine functional zoning in China. Mar. Policy 132:103484. doi: 10.1016/j.marpol.2019.02.055
Tian, T., Zhong, J., Yang, M., Feng, W., Zhang, C., Zhang, W., et al. (2021). Interfacial linkage and carbon encapsulation enable full solution-printed perovskite photovoltaics with prolonged lifespan. Angewandte Chemie International Edition 60, 23735–23742. doi: 10.1002/anie.202108495
Tian, Y., Zhang, J., and Luo, X. (2014). A regional comparison study on the coordination of net carbon benefits and economic benefits of china\u0027s planting industry. Econ Geogr 34, 142–148. doi: 10.15957/j.cnki.jjdl.2014.03.024
Wang, J., You, K., Qi, L., and Ren, H. (2022). Gravity center change of carbon emissions in chinese residential building sector: differences between urban and rural area. Energy Rep. 8, 10644–10656. doi: 10.1016/j.egyr.2022.08.208
Warrick, R. A. (1988). Carbon dioxide, climatic change and agriculture. The Geographical Journal 154, 221–233. doi: 10.2307/633848
Wu, Y., Wang, P., Liu, X., Chen, J., and Song, M. (2020). Analysis of regional carbon allocation and carbon trading based on net primary productivity in china. China Econ Rev 60, 101401. doi: 10.1016/j.chieco.2019.101401
Wei, Y., and Chen, S. (2021). Spatial correlation of land use carbon emissions and carbon balance zoning in Fujian province. J. Ecol. 41, 5814–5824. doi: 10.5846/stxb202006301705
Wu, G., Chen, Y., and Sun, X. (2021). Analysis on regional difference, dynamic evolution and convergence of carbon compensation rate of china's planting industry. Chin. J. Eco-Agric. 29, 1774–1785. doi: 10.13930/j.cnki.cjea.210225
Xia, S., and Yang, Y. (2022). Temporal and spatial differentiation of carbon budget and carbon compensation zoning of beijing tianjin hebei urban agglomeration based on main functional areas. J Geog 77, 679–696. doi: 10.11821/dlxb202203013
Xiao, G., Du, D., Li, H., and Dai, Q. (2016). Spatial and temporal evolution of urban innovation differences in urban agglomerations in the middle reaches of the yangtze river. Resour. Environ. Yangtze River Valley 25, 199–207. doi: 10.11870/cjlyzyyhj201602004
Yang, S., Fu, W., Hu, S., and Ran, P. (2022). Watershed carbon compensation based on land use change: evidence from the yangtze river economic belt. Habitat. Int. 126:102613. doi: 10.1016/j.habitatint.2022.102613
Yang, Z., Gao, W., Han, Q., Qi, L., Cui, Y., and Chen, Y. (2022). Digitalization and carbon emissions: how does digital city construction affect china's carbon emission reduction? Sustain. Cities Soc. 87:104201. doi: 10.1016/j.scs.2022.104201
Yang, Y., and Li, H. (2022). Monitoring spatiotemporal characteristics of land-use carbon emissions and their driving mechanisms in the yellow river delta: a grid-scale analysis. Environ. Res. 214:114151. doi: 10.1016/j.envres.2022.114151
Yang, G., Shang, P., He, L., Zhang, Y., Wang, Y., Zhang, F., et al. (2019). Interregional carbon compensation cost forecast and priority index calculation based on the theoretical carbon deficit: China as a case. Sci. Total Environ. 654, 786–800. doi: 10.1016/j.scitotenv.2018.11.134
Yasmeen, R., Tao, R., Shah, W. U. H., Padda, I. U. H., and Tang, C. (2022). The nexuses between carbon emissions, agriculture production efficiency, research and development, and government effectiveness: evidence from major agriculture-producing countries. Environ. Sci. Pollut. Res. Int. 29, 52133–52146. doi: 10.1007/s11356-022-19431-4
Yuan, Z., Ye, C., and Li, H. (2021). Analysis of carbon emission effect in Nanchang city based on land use change. J. Nat. Sci. Hunan Normal Univ. 44, 30–39.
Zamparini, L., Domènech, A., Miravet, D., and Gutiérrez, A. (2022). Green mobility at home, green mobility at tourism destinations: a cross-country study of transport modal choices of educated young adults. J. Transp. Geogr. 103:103412. doi: 10.1016/j.jtrangeo.2022.103412
Zhang, J., Chen, H., Liu, D., Shi, Q., and Geng, T. (2022). Study on spatio-temporal differentiation and influencing factors of land use carbon emissions based on county scale. J. Northwest Univ. 52, 21–31. doi: 10.16152/j.cnki.xdxbzr.2022-01-003
Zhang, S., Su, X., Singh, V. P., Ayantobo, O. O., and Xie, J. (2018). Logarithmic mean divisia index (lmdi) decomposition analysis of changes in agricultural water use: a case study of the middle reaches of the Heihe river basin, China. Agric. Water Manag. 208, 422–430. doi: 10.1016/j.agwat.2018.06.041
Zhang, J., Zeng, W., Wang, J., Yang, F., and Jiang, H. (2017). Regional low-carbon economy efficiency in China: analysis based on the super-sbm model with co2 emissions. J. Clean. Prod. 163, 202–211. doi: 10.1016/j.jclepro.2015.06.111
Zhang, J., and Zhang, Y. (2020). Chinese tourism economic change under carbon tax scenarios. Curr. Issue Tour. 23, 836–851. doi: 10.1080/13683500.2018.1551339
Zhao, R., Liu, Y., and Li, Y. (2015). Review of regional carbon compensation research: mechanisms, models, and policy suggestions. Areal Res. Dev. 34, 116–120. doi: 10.3969/j.issn.1003-2363.2015.05.022
Zhao, R., Liu, Y., Marin, Y., Hou, L., Zhan, P. Z., and Ding, M. (2016). Spatial horizontal carbon offsets at county level in Henan province based on carbon budget accounting. J. Nat. Resour. 31, 1675–1687. doi: 10.11849/zrzyxb.20151291
Zhao, R., Liu, Y., Tian, M., Ding, M., Cao, L., Zhang, Z., et al. (2018). Impacts of water and land resources exploitation on agricultural carbon emissions: the water-land-energy-carbon nexus. Land Use Policy 72, 480–492. doi: 10.1016/j.landusepol.2017.12.029
Keywords: temporal, spatial, carbon emissions, functional zoning, agricultural
Citation: Chen Q, Mao Y and Cheng J (2023) Temporal and spatial evolution of agricultural carbon emissions and their impact on functional zoning: evidence from Hubei Province. Front. Sustain. Food Syst. 7:1286567. doi: 10.3389/fsufs.2023.1286567
Edited by:
Jianxu Liu, Shandong University of Finance and Economics, ChinaReviewed by:
Ji Ma, Yunnan Academy of Social Sciences, ChinaCopyright © 2023 Chen, Mao and Cheng. This is an open-access article distributed under the terms of the Creative Commons Attribution License (CC BY). The use, distribution or reproduction in other forums is permitted, provided the original author(s) and the copyright owner(s) are credited and that the original publication in this journal is cited, in accordance with accepted academic practice. No use, distribution or reproduction is permitted which does not comply with these terms.
*Correspondence: Yan Mao, eWFubWFvQGhidWUuZWR1LmNu
Disclaimer: All claims expressed in this article are solely those of the authors and do not necessarily represent those of their affiliated organizations, or those of the publisher, the editors and the reviewers. Any product that may be evaluated in this article or claim that may be made by its manufacturer is not guaranteed or endorsed by the publisher.
Research integrity at Frontiers
Learn more about the work of our research integrity team to safeguard the quality of each article we publish.