 Longqi Sun
 Zhengyong Yang1*
 Zhiyi Zhang
- 1College of Economics and Management, Shanghai Ocean University, Shanghai, China
- 2Yellow Sea Fisheries Research Institute, Chinese Academy of Fishery Sciences, Qingdao, China
- 3Faculty of Professional Finance and Accountancy, Shanghai Business School, Shanghai, China
Green development efficiency (GDE) is an important criterion for measuring the level of green development. GDE considers not only economic development efficiency but also environmental costs. In China, marine fish culture, as one of the pillar industries of mariculture, promotes green development and industrial transformation and upgradation. Based on data from the field surveys of marine fish farmers (2017–2019) and the China Fishery Statistical Yearbook (2018–2020), this study establishes an evaluation index system and uses the super-slack-based measure model (Super-SBM) to evaluate the GDE of marine fish culture. The results show that the average GDE of marine fish culture in China was 0.9529, which was in an inefficient state. As for culture species, golden pompano (Trachinotus ovatus) and cobia (Rachycentron canadum) were the two species farmed in an efficient state, with a GDE of 1.2107 and 1.0659, respectively. Regarding culture modes, green modes (offshore cage aquaculture, industrial recirculating aquaculture, and engineering pond aquaculture) were in an efficient state, with a GDE of 1.2310, 1.0827, and 1.0401, respectively. Traditional modes (industrial flow-through aquaculture, ordinary cage aquaculture, and ordinary pond aquaculture) were in an inefficient state, with their GDE being 0.9884, 0.8746, and 0.8248, respectively. Green modes have higher GDE than traditional modes. In contrast, the production and culture areas of green modes were less than those of traditional modes because the profits of the same species in green modes were lower than those in traditional modes. The results of this study present an objective assessment of the GDE of marine fish culture in China and provide valuable insights for analyzing the mechanisms to improve the GDE of marine fish culture.
1 Introduction
Marine fish stocks are an important part of the world's food system, but overfishing is increasing, and there is a widespread concern that fish stocks are decreasing throughout most of the world (Hilborn et al., 2020). Aquaculture, which is predicted to reach 106 million tons by 2030 (FAO, 2022), is expected to play a key role in filling the gap between supply and the rapidly expanding global demand for fish (FAO, 2018; Lubchenco et al., 2020). However, the development of this industry is limited by a wide range of environmental concerns (Naylor et al., 2000, 2005; Hall et al., 2011) resulting from the ecological impacts of aquaculture inputs and resources (Waite et al., 2014; Ahmed and Thompson, 2019). It is necessary to ensure the sustainability of aquaculture, which can improve its ecological efficiency, environmental acceptability, profitability, and social benefits (Sun et al., 2020).
According to the China Fishery Statistical Yearbook (2019), aquaculture has rapidly developed since China's reform and opening-up in the late 1970s, and its production in China reached 49.91 million tons in 2018 (Bureau of Fisheries of Ministry of Agriculture and Rural Affairs of China, National Fisheries Technical Extension Center of Ministry of Agriculture and Rural Affairs of China, 2019), accounting for 57.93% of global aquaculture production (FAO, 2020). Years of exploration have shown that green development is the key to responsible and prosperous aquaculture in China (Zou and Huang, 2015). Based on the circular economy, low-carbon economy, and ecological economy, green development strives to break through constraints related to the resource environment (Guo et al., 2020). Green development is consistent with the concept of sustainable development, and this synergy is very important for providing policy guidance to achieve sustainable development (Zhou et al., 2020).
With the understanding of the multi-functions of aquaculture (food supply and ecological and cultural service functions) (Tang, 2016), the concept of “carbon sink fisheries” (Tang and Liu, 2016) and the sustainable goals of “efficiency, quality, ecology, health and safety” in aquaculture have been proposed (Tang, 2017b). Subsequently, the green development of aquaculture (Tang, 2017a) has been suggested in China. Green development of aquaculture is a whole-process green-development mode drawn by green consumption, supported by green technological innovation, and driven by institutional reform in aquaculture. Its goal is to meet the sustainable development of human beings, aquaculture economic activities, and natural environmental systems. The characteristics of green development include environment-friendly production in the culturing process, efficient resource allocation along the industrial chain, sustainable income for aquaculture farmers, and satisfaction of aquatic produce consumers (Yang et al., 2021).
In 2019, green development was formally promoted by the government both in marine fish culture and other subindustries of aquaculture in China. This practice may bring forth continual transformation and upgradation of marine fish culture and ensure the supply of high-quality protein (Bureau of Fisheries of Ministry of Agriculture and Rural Affairs of China, National Fisheries Technical Extension Center of Ministry of Agriculture and Rural Affairs of China, 2019).
To promote the green development of marine fish culture, its efficiency needs to be taken into consideration. Green development efficiency (GDE) is an economic production system that maintains economic growth by improving resource utilization and producing less environmental pollution (Tao et al., 2016; Yang et al., 2019; Yu et al., 2022). Improving GDE is the critical point to achieving green development of economic growth, resource reduction, and environmental impact minimization (Qiu et al., 2020). However, marine fish culture production can be increased either by adopting improved technology or by increasing production efficiency through the adoption of better management and culture systems (Islam et al., 2016). Previous studies have shown that improving production efficiency is more effective than introducing new technologies if producers are not efficient (Belbase and Grabowski, 1985; Dey et al., 2000). From the existing perspective, research on GDE has mainly focused on green growth efficiency (OECD, 2009; World Bank, 2010; Kim et al., 2014; Ahmad and Wu, 2022), sustainability (UNDP, 1990; Prescott-Allen, 1995; Beijing Normal University., 2010; Sustainable Development Strategy Research Group and Chinese Academy of Sciences (CAS), 2011; UNEP, 2014; Schulte and Knuts, 2022), and ecological economic efficiency (Schaltegger and Sturm, 1990; WBCSD, 2000; UNESCAP, 2009; Shen et al., 2020; Zhu et al., 2022). The GDE of mariculture, marine economy, and agriculture evaluations have also gained some achievements for achieving the sustainable development goals, and stochastic frontier analysis (SFA) and data envelopment analysis (DEA) were mainly adopted in these studies (Wang and Ji, 2017; Cui et al., 2020; Ye et al., 2021; Wu et al., 2022). Although the above studies provided many illuminating results, the research on the GDE of marine fish culture is still very limited. Previous studies concerning marine fish culture focused on economic efficiency and technical efficiency (Sharma et al., 1999; Nielsen, 2011; Rahman et al., 2011; Iliyasu et al., 2014; Long et al., 2020; Twumasi et al., 2022) but lacked consideration of the impact of marine fish culture on the environment.
Therefore, to reveal the GDE of marine fish culture in China and to explore the mechanism of promoting the GDE of marine fish culture in China, this study considers the environmental impacts of marine fish culture as undesirable outputs and establishes an evaluation index system for the GDE of marine fish culture in China, which includes inputs, desirable outputs, and undesirable outputs. Based on the system, the GDE of marine fish culture in China and the GDE of marine fish culture modes and species are estimated. This study provides a reference for promoting the green transformation of marine fish culture.
2 Data and methods
2.1 Super-SBM model
Among the GDE-related methods, DEA is mainly applied to measure the relative performance of organizational units (Charnes et al., 1978). Tone (2001) subsequently provided the slack-based measure (SBM) model, which can reflect the actual situation of production factors and measure the efficiency of decision-making units (DMUs). Based on the SBM model, Tone (2002) proposed the Super-SBM for more accurate efficiency evaluation and to further rank efficiency. The Super-SBM model can measure the efficiencies of DMUs with complex input and output indicators. It is more convenient to distinguish the difference in efficiency values than the SBM model (Meng and Qu, 2022). In previous studies, the Super-SBM model was widely used in industry, agriculture, energy, and other fields (Gökgöz and Erkul, 2019; Cui et al., 2020; Li and Ouyang, 2020; Khan et al., 2021; Wu et al., 2022). Therefore, in our study, we used the Super-SBM model to measure the GDE of marine fish culture.
Considering the different culture modes of various marine fish culture species in China, this study determined the DMUs based on the various culture modes of marine fish culture species in China from the Annual Report 2018–2020 of China Agriculture Research System for Marine Fish Culture Industry (National Marine Fish Industry Technology Research Development Center, 2018-2020), including 24 DMUs, as shown in Table 1.
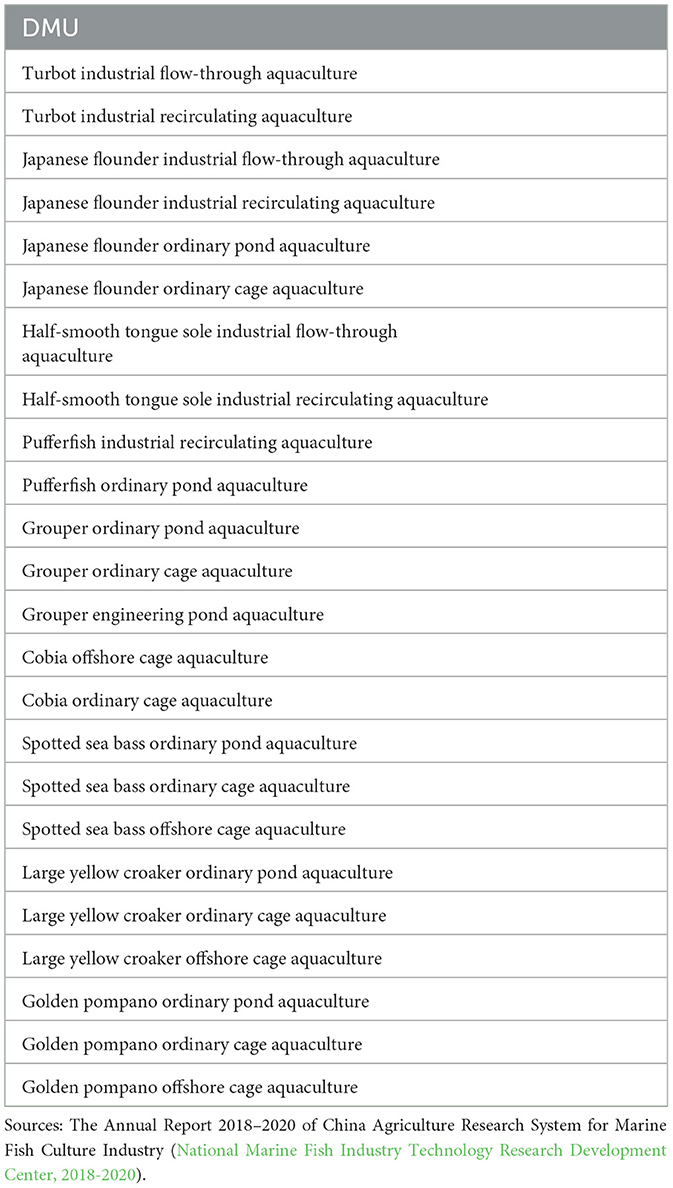
Table 1. List of different culture modes of various marine fish culture species in China.
If the presence of n DMUs is assumed, then each DMU has three factors: inputs, desirable outputs, and undesirable outputs. Every unit uses M inputs x to produce S1 desirable outputs yg and S2 undesirable outputs yb, which are represented by three vectors: x ∈ Rm, yg ∈ RS1, and yb ∈ RS2, and R stands for a set of real numbers. The input matrix is represesnted as X = [x1, x2, …, xn] ∈ RN×M, the desirable output matrix as Yg = [, , … ] ∈ RN×S1, and the undesirable output matrix as Yb= [, , …, ] ∈ RN×S2. We consider the following expression for describing a certain DMU (x0, , ):
where λ ≥ 0, s− ≥ 0, sg ≥ 0, and sb ≥ 0. λ is a weight vector in Rn. The vectors s−, sg, and sb indicate the slack in inputs, desirable outputs, and undesirable outputs, respectively. Using slacks, the SBM model is as follows:
In Equation (4), M, S1, and S2 denote the number of input indicators, desirable output indicators, and undesirable output indicators, respectively; x denotes the inputs, yg denotes the desirable outputs, yb denotes the undesirable outputs, denotes the input slack variable, denotes the desirable output slack variable, and denotes the undesirable output slack variable. ρ indicates the efficiency value of the DMU, which varies from 0 to 1. Only if ρ equals 1 and s−, sg, and sb are all equal to 0 will the DMU be on the frontier of production, which indicates that the DMU is effective and there is no redundancy or deficiency of the input. If ρ is <1, the DMU is inefficient and there is a loss of efficiency.
In some cases, some DMUs are simultaneously efficient when evaluating efficiency. To establish a reasonable efficiency evaluation method, we apply the super-SBM model with undesirable outputs based on the previous studies (Andersen and Petersen, 1993; Tone, 2004; Li et al., 2013; Zhang et al., 2019; Zhao et al., 2020; Khan et al., 2021; Wu et al., 2022). This model is described as follows:
where ρ* stands for the super-efficiency value of the DMU. The range of ρ* can be >1. All other variables in Equation (5) have the same connotation as those in Equations (1) to (4).
2.2 Study areas
Marine fish culture in China has established its aquaculture and contributed to its optimization in China (Lei, 2009). It is mainly distributed in coastal areas, including Liaoning, Hebei, Tianjin, Shandong, Jiangsu, Zhejiang, Fujian, Guangdong, Guangxi, and Hainan. In this study, marine fish culture in Hong Kong, Macao, and Taiwan have not been included due to a lack of data. The main culture species are turbot (Scophthalmus maximus), Japanese flounder (Paralichthys olivaceus), half-smooth tongue sole (Cynoglossus semilaevis), pufferfish (Tetraodontidae), large yellow croaker (Larimichthys crocea), grouper (Epinephelus spp.), spotted sea bass (Lateolabrax japonicus), cobia (Rachycentron canadum), and golden pompano (Trachinotus ovatus) (Lei, 2005; Gui et al., 2018). The culture modes mainly include industrial flow-through aquaculture, industrial recirculating aquaculture, ordinary cage aquaculture, offshore cage aquaculture, ordinary pond aquaculture, and engineering pond aquaculture. Based on data from the China Fishery Statistical Yearbook, the production of marine fish culture in China increased rapidly from 0.45 million tons in 2003 to 1.61 million tons in 2019. In China, the annual growth rate of marine fish culture was 8.22%, which is higher than that of aquaculture (2.94%) from 2003 to 2019 (Bureau of Fisheries of Ministry of Agriculture and Rural Affairs of China, National Fisheries Technical Extension Center of Ministry of Agriculture and Rural Affairs of China, 2004-2020).
2.3 Evaluation index system
An effective evaluation of the GDE of marine fish culture relies on input–output indicators. Table 2 shows the evaluation index system for the GDE of marine fish culture.
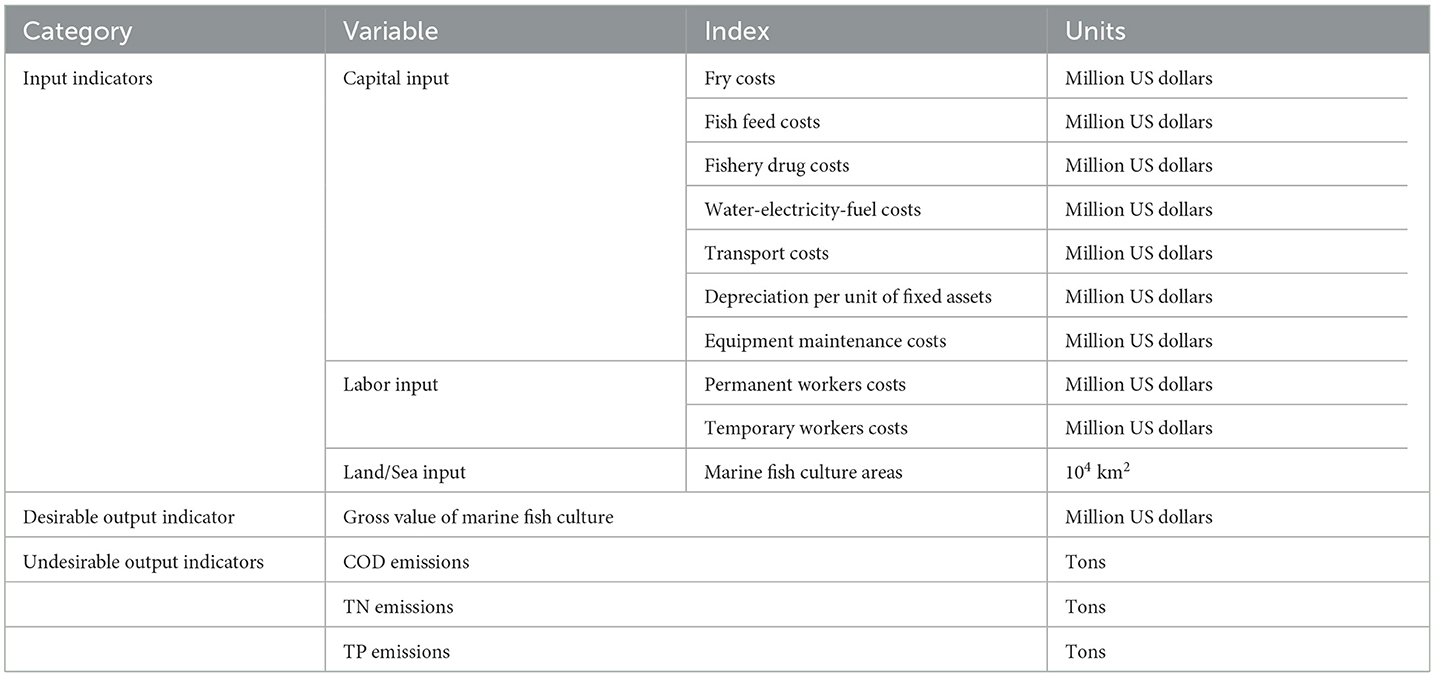
Table 2. Evaluation index system for the GDE of marine fish culture in China.
In terms of input indicators, capital, labor, and land/sea are the most basic factors of production according to economics (Yu et al., 2020). The capital input is based on the main costs of marine fish culture in China (National Marine Fish Industry Technology Research and Development Center, 2019), including fry costs, fish feed costs, fishery drug costs, water-electricity-fuel costs, transport costs, depreciation per unit of fixed assets, and equipment maintenance costs. The land/sea input is represented by marine fish culture areas (Islam et al., 2016; See et al., 2021) and has cost advantages related to input utilization (Iliyasu and Mohamed, 2015). The labor input represents the total expenses for family and hired labor used in marine fish culture (Sharma et al., 1999). Combined with the actual situation of marine fish culture in China (National Marine Fish Industry Technology Research and Development Center, 2019), the costs of workers (including permanent and temporary workers) are selected as the labor factors. These variables can reflect the major inputs in marine fish culture in China.
The desirable output indicator mainly refers to the economic benefits of marine fish culture, which are represented by the gross value of marine fish culture (Sharma et al., 1999). Chemical oxygen demand (COD) emissions, total nitrogen (TN) emissions, and total phosphorus (TP) emissions as specific indicators can reflect the degree of environmental pollution caused by marine fish culture (Wang and Ji, 2017). Therefore, COD emissions, TN emissions, and TP emissions are selected as the undesirable outputs in this study.
2.4 Sources of data
This study covers most marine fish culture areas in China. All original data were obtained from field surveys of marine fish farmers (2017–2019) and the China Fishery Statistical Yearbook (Bureau of Fisheries of Ministry of Agriculture and Rural Affairs of China, National Fisheries Technical Extension Center of Ministry of Agriculture and Rural Affairs of China, 2018-2020). From 2017 to 2019, field research on marine fish farmers by questionnaires was continuously carried out in coastal areas, including Liaoning, Hebei, Tianjin, Shandong, Jiangsu, Zhejiang, Fujian, Guangdong, Guangxi, and Hainan. The summary of the major provinces and species of marine fish culture field surveys is shown in Table 3. Finally, 372 valid survey datasets were obtained, and the number of questionnaire responses is shown in Table 4. In addition, data published in the China Fishery Statistical Yearbook (Bureau of Fisheries of Ministry of Agriculture and Rural Affairs of China, National Fisheries Technical Extension Center of Ministry of Agriculture and Rural Affairs of China, 2018-2020) were also used in this research.
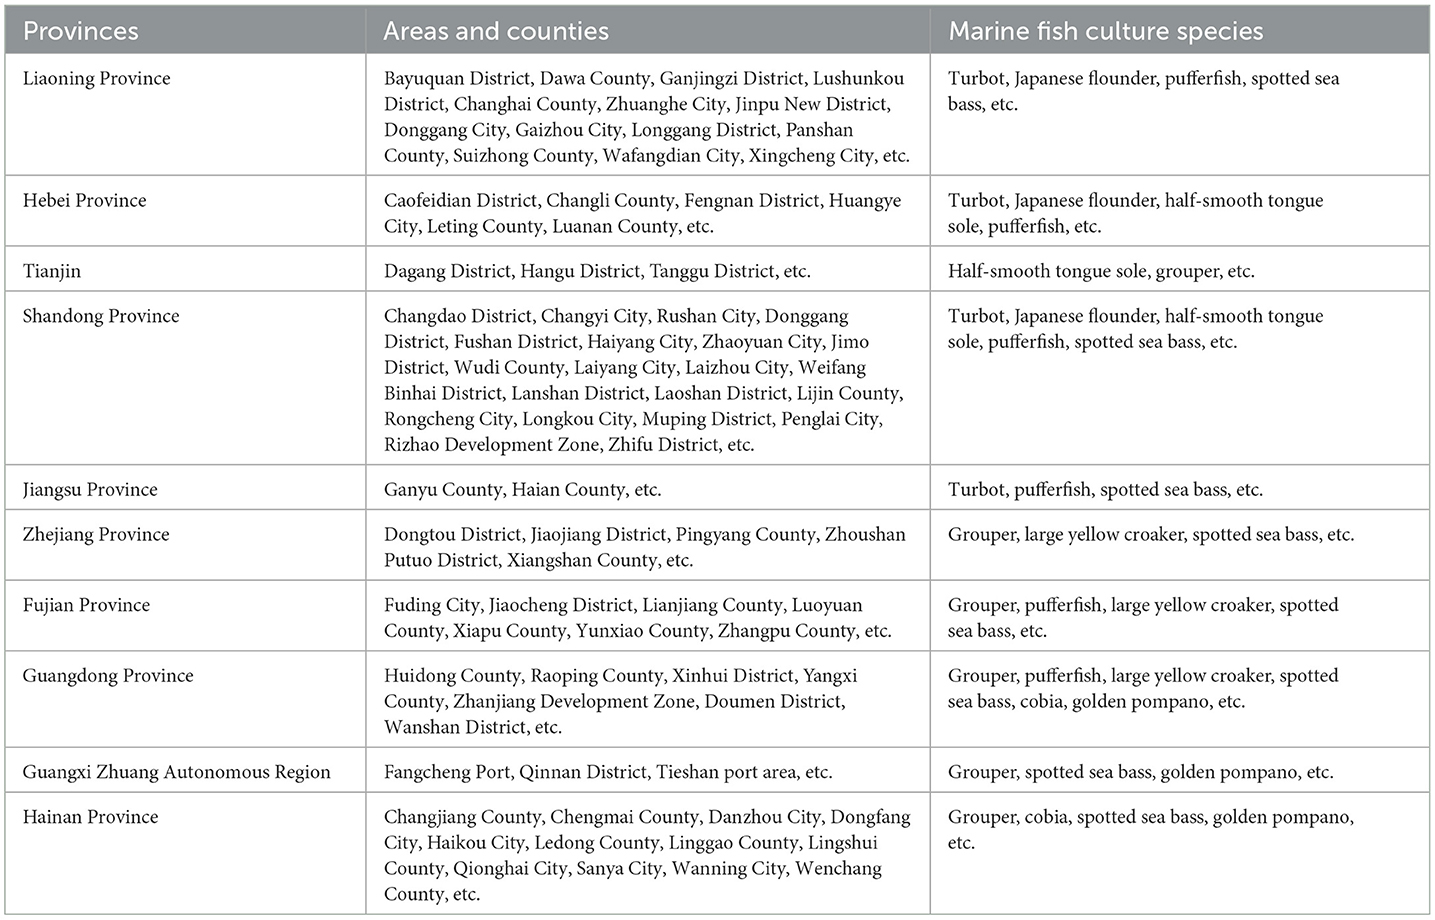
Table 3. Summary of the major provinces and species of marine fish culture field surveys from 2017 to 2019 in China.
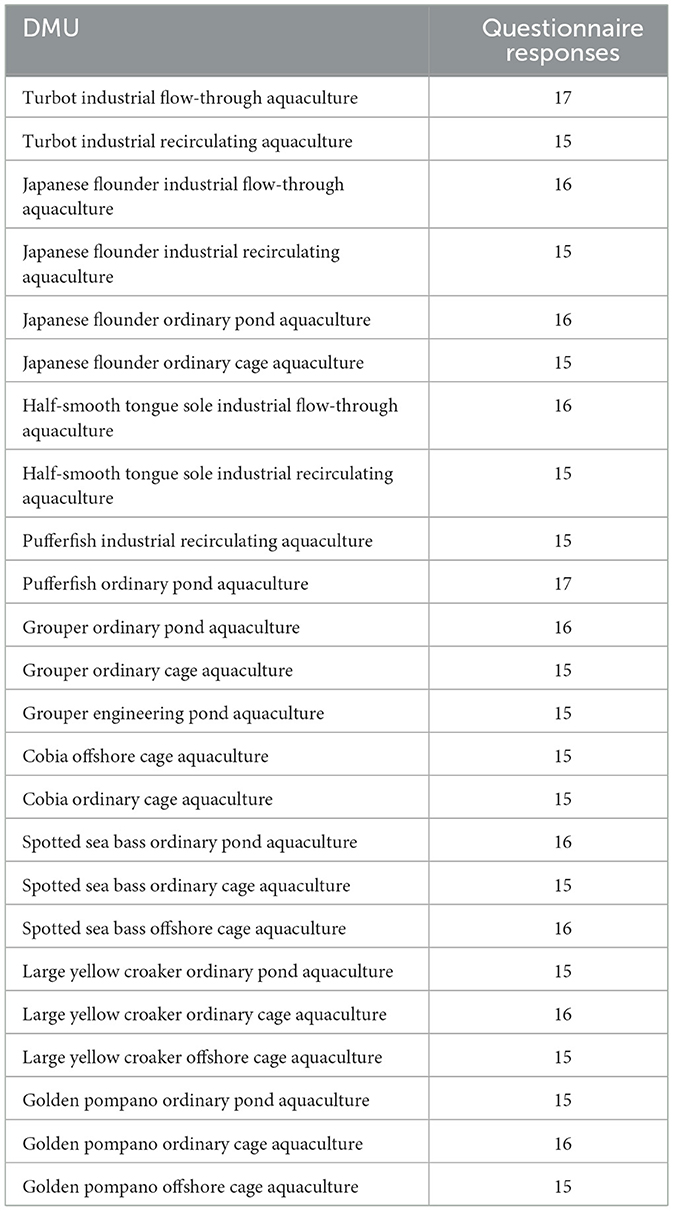
Table 4. Quantity of questionnaire responses from marine fish culture field surveys in China.
For the input indicators, data of capital input (including fry costs, fish feed costs, fishery drug costs, water-electricity-fuel costs, transport costs, depreciation per unit of fixed assets, and equipment maintenance costs) and data of labor input (including permanent workers and temporary workers) were derived from the field research, and these data were cost per unit of production in US dollars/kg. Data on the production of marine fish culture species (turbot, Japanese flounder, half-smooth tongue sole, pufferfish, large yellow croaker, grouper, spotted sea bass, cobia, and golden pompano) were collected from the China Fishery Statistical Yearbook (units:kg) (Bureau of Fisheries of Ministry of Agriculture and Rural Affairs of China, National Fisheries Technical Extension Center of Ministry of Agriculture and Rural Affairs of China, 2018-2020). Then, the cost per unit of production and the production were multiplied to get data of labor input and capital input, in million US dollars. Data on marine fish culture areas were derived from field surveys of marine fish farmers (2017–2019), and these data were produced per unit of areas in kg/104 km2. Then, production per unit of areas and the production of marine fish culture species, which were collected from the China Fishery Statistical Yearbook (units: kg) (Bureau of Fisheries of Ministry of Agriculture and Rural Affairs of China, National Fisheries Technical Extension Center of Ministry of Agriculture and Rural Affairs of China, 2018-2020), were multiplied to obtain the data of marine fish culture areas in 104 km2.
The desirable output data (the gross value of marine fish culture) were derived from the market price of marine fish culture species according to the “Annual Report of China Agriculture Research System for Marine Fish Culture Industry” (National Marine Fish Industry Technology Research Development Center, 2018-2020), and its unit is US dollars/kg. Then, the market price of marine fish culture species and the production of marine fish culture species, which were collected from the China Fishery Statistical Yearbook (units: kg) (Bureau of Fisheries of Ministry of Agriculture and Rural Affairs of China, National Fisheries Technical Extension Center of Ministry of Agriculture and Rural Affairs of China, 2018-2020), were multiplied to get data of the gross value of marine fish culture, in million US dollars.
The undesirable output data (COD emissions, TN emissions, and TP emissions) were not available directly. The pollution production coefficient of marine fish culture species was obtained from the First National Census of Pollution Sources in China—Aquaculture Pollution Sources Production and Discharge Coefficient Manual (Aquaculture Pollution Sources Production Discharge Coefficient Measurement Project Team of National Census of Pollution Sources, 2010). Then, the coefficient was multiplied by the DMUs' production to obtain the undesirable output data (COD emissions, TN emissions, and TP emissions).
The description of variables for the GDE of marine fish culture in China is shown in Table 5.
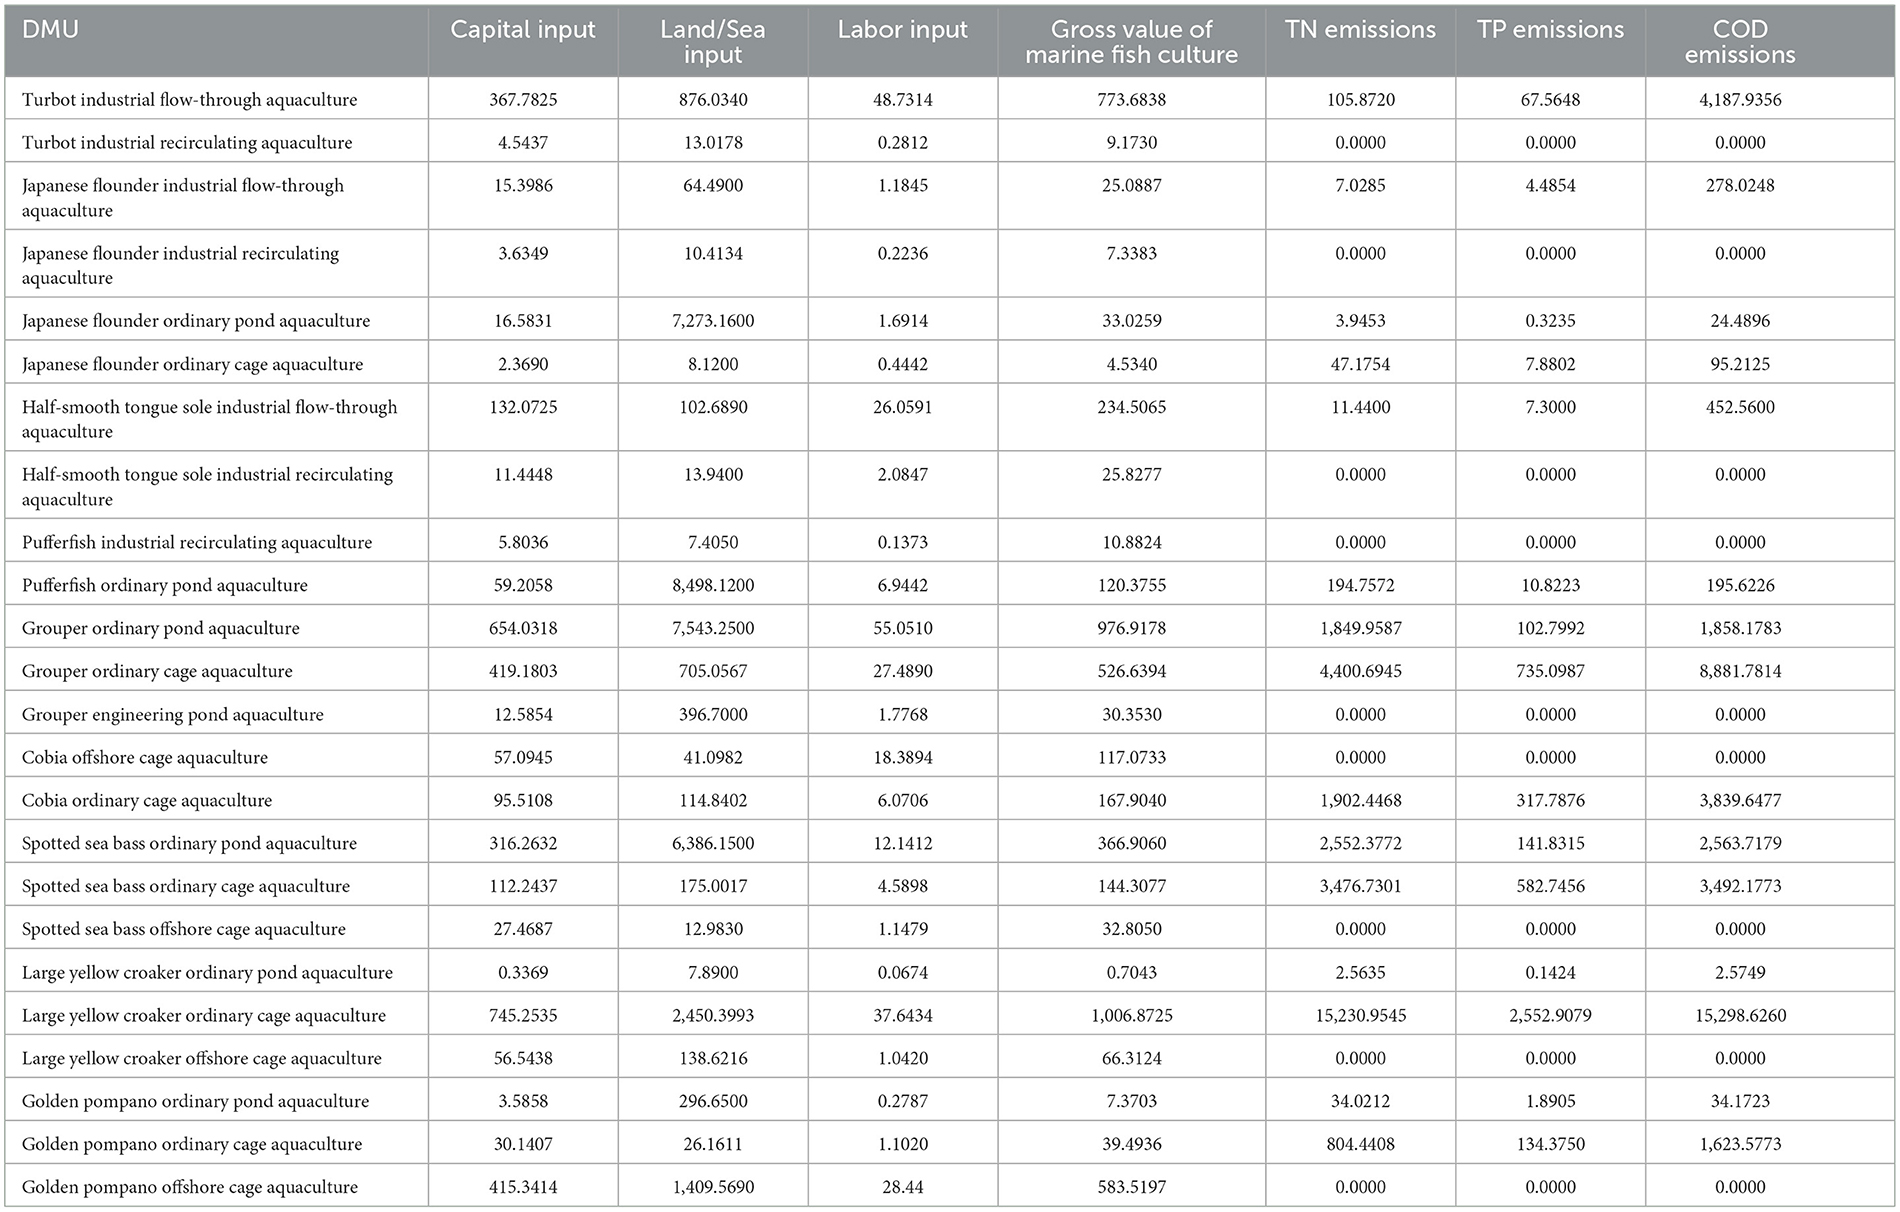
Table 5. Description of variables for the GDE of marine fish culture in China.
3 Results and discussion
3.1 Estimation results of the GDE of marine fish culture in China
This study integrated the selected inputs, desirable outputs, and undesirable outputs into GDE by using MaxDEA software. GDE ≥ 1 is regarded as an efficient state, and GDE <1 is regarded as an inefficient state (Tone, 2004). The GDE of marine fish culture in China was 0.9529, which was in an inefficient state. Compared with mariculture (GDE = 0.7140) (Wang and Ji, 2017) and agriculture (GDE = 0.6650) (Wu et al., 2022) in China, the GDE of marine fish culture was higher. This better performance of marine fish culture may result from its smaller scale and less complex environment than those of mariculture and agriculture.
Considering the GDE of marine fish culture in China, the highest GDE was pufferfish industrial recirculating aquaculture (GDE = 1.2913) and the lowest GDE was Japanese flounder ordinary pond aquaculture (GDE = 0.3710). Among all 24 DMUs, 37.50% exhibited an efficient state, including pufferfish industrial recirculating aquaculture, golden pompano offshore cage aquaculture, cobia offshore cage aquaculture, large yellow croaker offshore cage aquaculture, spotted sea bass offshore cage aquaculture, grouper engineering pond aquaculture, half-smooth tongue sole industrial recirculating aquaculture, turbot industrial recirculating aquaculture, and Japanese flounder industrial recirculating aquaculture.
Furthermore, turbot industrial flow-through aquaculture, cobia ordinary cage aquaculture, large yellow croaker ordinary cage aquaculture, half-smooth tongue sole industrial flow-through aquaculture, spotted sea bass ordinary pond aquaculture, pufferfish ordinary pond aquaculture, and Japanese flounder industrial flow-through aquaculture showed GDE values between 0.8000 and 0.9000. Golden pompano ordinary cage aquaculture, large yellow croaker ordinary pond aquaculture, grouper ordinary pond aquaculture, grouper ordinary cage aquaculture, and spotted sea bass ordinary cage aquaculture showed GDE values between 0.6000 and 0.8000. Japanese flounder ordinary cage aquaculture, golden pompano ordinary pond aquaculture, and Japanese flounder ordinary pond aquaculture showed GDE values below 0.6000. These DMUs were in an inefficient state.
Figure 1 shows the ranking of the GDE of marine fish culture in China.
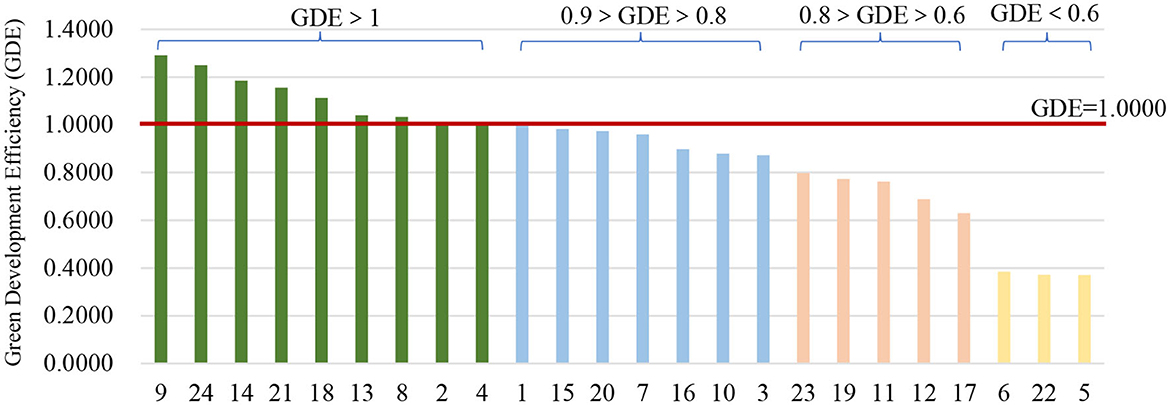
Figure 1. Ranking of the GDE of marine fish culture in China. 1. Turbot industrial flow-through aquaculture; 2. Turbot industrial recirculating aquaculture; 3. Japanese flounder industrial flow-through aquaculture; 4. Japanese flounder industrial recirculating aquaculture; 5. Japanese flounder ordinary pond aquaculture; 6. Japanese flounder ordinary cage aquaculture; 7. Half-smooth tongue sole industrial flow-through aquaculture; 8. Half-smooth tongue sole industrial recirculating aquaculture; 9. Pufferfish industrial recirculating aquaculture; 10. Pufferfishes ordinary pond aquaculture; 11. Grouper ordinary pond aquaculture; 12. Grouper ordinary cage aquaculture; 13. Grouper engineering pond aquaculture; 14. Cobia offshore cage aquaculture; 15. Cobia ordinary cage aquaculture; 16. Spotted sea bass ordinary pond aquaculture; 17. Spotted sea bass ordinary cage aquaculture; 18. Spotted sea bass offshore cage aquaculture; 19. Large yellow croaker ordinary pond aquaculture; 20. Large yellow croaker ordinary cage aquaculture; 21. Large yellow croaker offshore cage aquaculture; 22. Golden pompano ordinary pond aquaculture; 23. Golden pompano ordinary cage aquaculture; 24. Golden pompano offshore cage aquaculture.
Among the culture modes, offshore cage aquaculture, industrial recirculating aquaculture, and engineering pond aquaculture were in an efficient state. Others (industrial flow-through aquaculture, ordinary cage aquaculture, and ordinary pond aquaculture) were in an inefficient state. Offshore cage aquaculture had the highest GDE (GDE = 1.2310), followed by industrial recirculating aquaculture (GDE = 1.0827), engineering pond aquaculture (GDE = 1.0401), industrial flow-through aquaculture (GDE = 0.9884), and ordinary cage aquaculture (GDE = 0.8746). Ordinary pond aquaculture had the lowest GDE (GDE = 0.8248) (Figure 2).
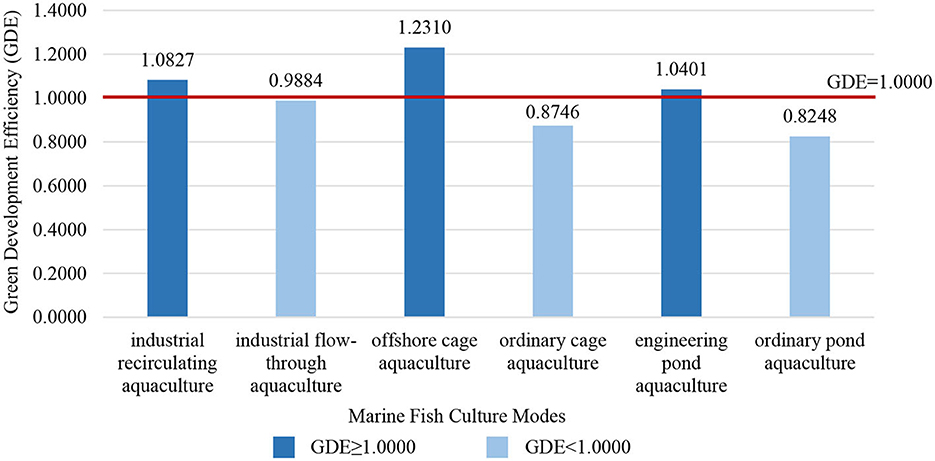
Figure 2. Ranking of the GDE of marine fish culture modes in China.
Among the culture species, the cultures of golden pompano and cobia were in an efficient state, while the others were in an inefficient state. The culture of golden pompano had the highest GDE (GDE = 1.2107), followed by that of cobia (GDE = 1.0659), turbot (GDE = 0.9954), large yellow croaker (GDE = 0.9847), half-smooth tongue sole (GDE = 0.9675), pufferfish (GDE = 0.9142), spotted sea bass (GDE = 0.8370), and grouper (GDE = 0.7371). The culture of Japanese flounder had the lowest GDE (GDE = 0.5455) (Figure 3).
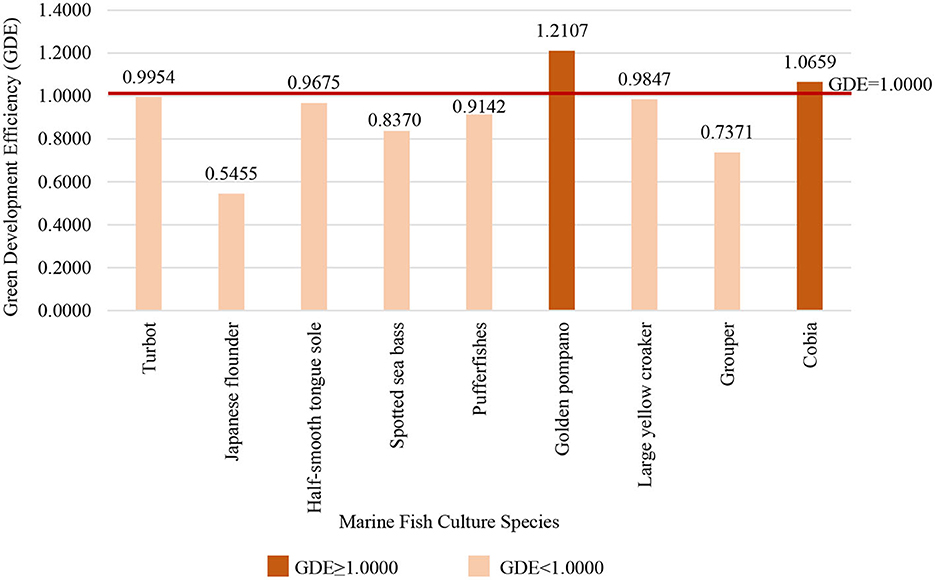
Figure 3. Ranking of the GDE of marine fish culture species in China.
3.2 Comparative analysis of production and the GDE of marine fish culture in China
For marine fish culture modes, industrial recirculating aquaculture, offshore cage aquaculture, and engineering pond aquaculture as intensive and environmentally friendly aquaculture modes (Hall et al., 2018) were in an efficient state. Industrial flow-through aquaculture, ordinary cage aquaculture, and ordinary pond aquaculture were in an inefficient state. Compared with traditional modes (industrial flow-through aquaculture, ordinary cage aquaculture, and ordinary pond aquaculture), green modes (offshore cage aquaculture, industrial recirculating aquaculture, and engineering pond aquaculture) improved resource utilization and reduced environmental pollution (undesirable outputs) by technologies and facilities, resulting in improving the GDE of marine fish culture. Based on data from the China Fishery Statistical Yearbook (Bureau of Fisheries of Ministry of Agriculture and Rural Affairs of China, National Fisheries Technical Extension Center of Ministry of Agriculture and Rural Affairs of China, 2018-2020), the average production of marine fish culture was 153,331 tons. Ordinary cage aquaculture (accounting for 38.40% of the total production of marine fish culture), ordinary pond aquaculture (accounting for 26.88% of the total production of marine fish culture), and offshore cage aquaculture (accounting for 21.29% of the total production of marine fish culture) were the dominant aquaculture modes in marine fish culture in China, with their cumulative percentage accounting for 80.09% of the total production of marine fish culture. Industrial recirculating aquaculture and engineering pond aquaculture accounted for 0.37 and 0.30% of the total production of marine fish culture, respectively (Figure 4). Furthermore, industrial recirculating aquaculture and engineering pond aquaculture had higher GDE and lower production (<average production). Offshore cage aquaculture had higher GDE and higher production (>average production). Ordinary pond aquaculture and ordinary cage aquaculture had lower GDE and higher production (>average production). Industrial flow-through aquaculture had lower GDE and lower production (<average production) (Figure 5). Although offshore cage aquaculture was most productive, ordinary pond aquaculture and ordinary cage aquaculture were still the dominant aquaculture modes in marine fish culture in China, which influenced the GDE of marine fish culture in China. Since offshore cage aquaculture, industrial recirculating aquaculture, and engineering pond aquaculture can guarantee aquaculture economic activities, optimize environmental conditions, and reduce interactions with harmful organisms (Gui et al., 2018; Sievers et al., 2021), it is necessary to increase the production of these green modes (with higher GDE) to promote the green development of marine fish culture in China.
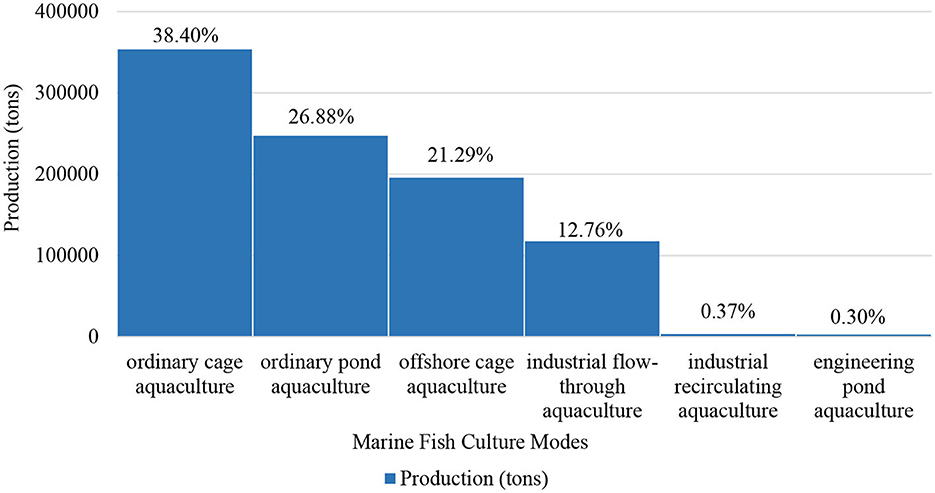
Figure 4. The production and the percentages of marine fish culture modes in China.
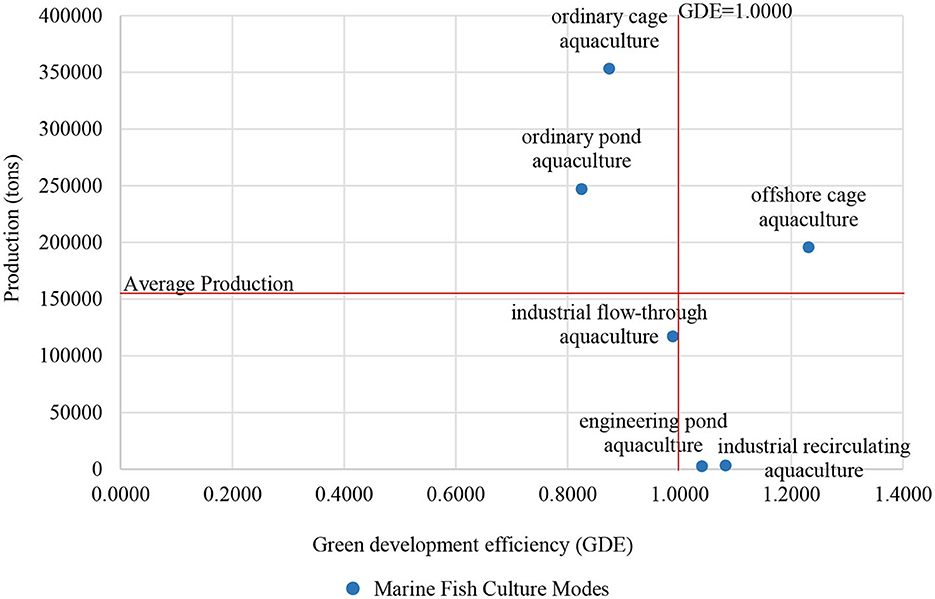
Figure 5. Relationship between the production and the GDE of marine fish culture modes in China.
Among marine fish culture species, large yellow croaker, grouper, spotted sea bass, and golden pompano were the main culture species in China, and their cumulative percentage accounted for 80.10% of the total production of marine fish culture (Bureau of Fisheries of Ministry of Agriculture and Rural Affairs of China, National Fisheries Technical Extension Center of Ministry of Agriculture and Rural Affairs of China, 2018-2020) (Figure 6). Based on the results, the GDE of the culture of large yellow croaker, grouper, and spotted sea bass were 0.9847, 0.7371, and 0.8370, respectively. The dominance of these three species, which account for 62.32% of the total production of marine fish culture, is one of the important factors resulting in the inefficiency of marine fish culture. Although golden pompano and cobia were farmed in an efficient state, their percentage in the total production of marine fish culture is smaller than those farmed in an inefficient state. A comparison between the production and the GDE of marine fish culture species in China is illustrated in Figure 7.
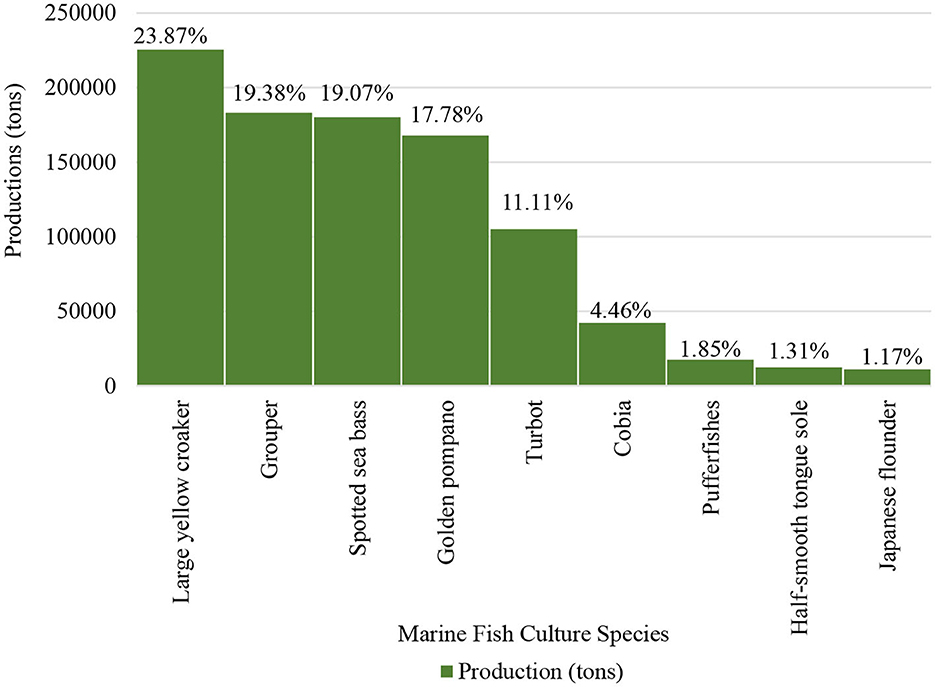
Figure 6. The production and the percentages of marine fish culture species in China.
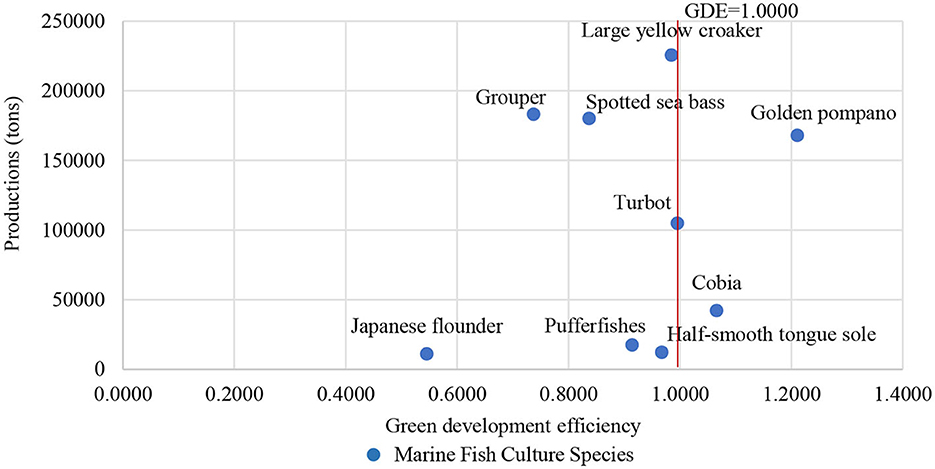
Figure 7. Relationship between the production and the GDE of marine fish culture species in China.
Moreover, considering the various modes of marine fish culture species, the GDE values of marine fish culture species showed significant differences. The reasons for these results are shown in Figures 8, 9.
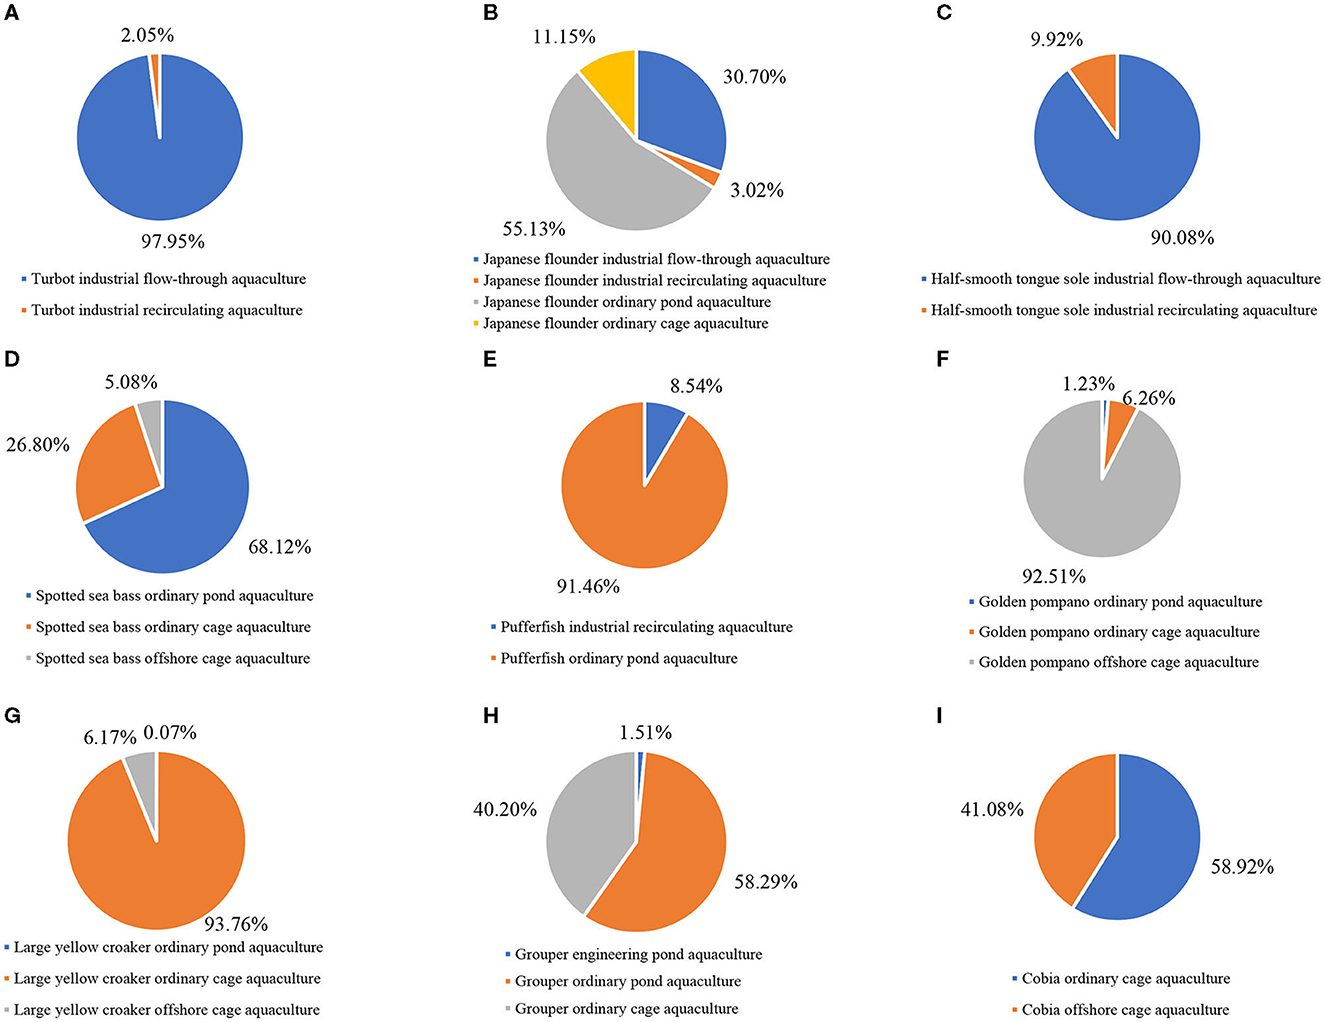
Figure 8. Production proportions of different culture modes of various marine fish culture species in China. (A) Turbot. (B) Japanese flounder. (C) Half-smooth tongue. (D) Spotted sea bass. (E) Pufferfish. (F) Golden pomano. (G) Large yellow croaker. (H) Grouper. (I) Cobia.
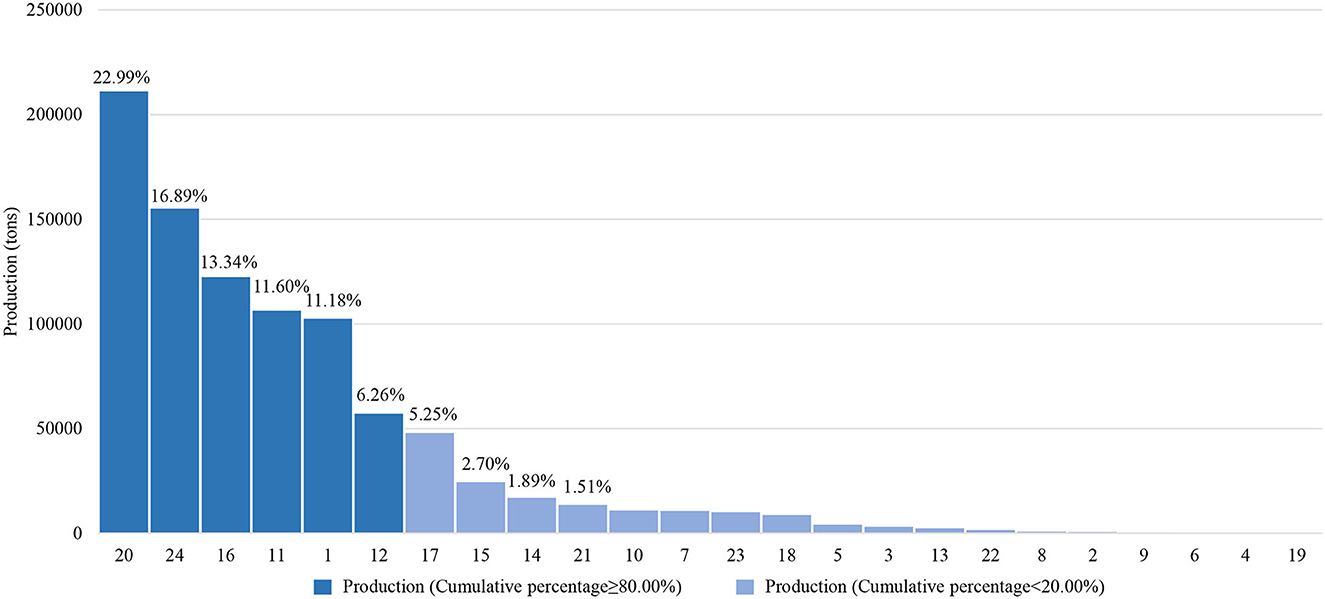
Figure 9. Relationship between the production and the GDE of different culture modes of various marine fish culture species in China. 1. Turbot industrial flow-through aquaculture; 2. Turbot industrial recirculating aquaculture; 3. Japanese flounder industrial flow-through aquaculture; 4. Japanese flounder industrial recirculating aquaculture; 5. Japanese flounder ordinary pond aquaculture; 6. Japanese flounder ordinary cage aquaculture; 7. Half-smooth tongue sole industrial flow-through aquaculture; 8. Half-smooth tongue sole industrial recirculating aquaculture; 9. Pufferfish industrial recirculating aquaculture; 10. Pufferfish ordinary pond aquaculture; 11. Grouper ordinary pond aquaculture; 12. Grouper ordinary cage aquaculture; 13. Grouper engineering pond aquaculture; 14. Cobia offshore cage aquaculture; 15. Cobia ordinary cage aquaculture; 16. Spotted sea bass ordinary pond aquaculture; 17. Spotted sea bass ordinary cage aquaculture; 18. Spotted sea bass offshore cage aquaculture; 19. Large yellow croaker ordinary pond aquaculture; 20. Large yellow croaker ordinary cage aquaculture; 21. Large yellow croaker offshore cage aquaculture; 22. Golden pompano ordinary pond aquaculture; 23. Golden pompano ordinary cage aquaculture; 24. Golden pompano offshore cage aquaculture.
As the dominant species, the large yellow croaker was mainly cultured through ordinary cage aquaculture. Its ordinary cage aquaculture accounted for 22.99% of the total production of marine fish culture. Meanwhile, the GDE of its ordinary cage aquaculture was only 0.9736, which influenced the GDE of the large yellow croaker culture and marine fish culture.
As another dominant species, grouper was mainly cultured through ordinary pond aquaculture and ordinary cage aquaculture. Its ordinary pond aquaculture accounted for 11.60% of the total production of marine fish culture and 58.29% of grouper production. Its ordinary cage aquaculture accounted for 40.20% of grouper production. The GDE of its ordinary pond aquaculture and ordinary cage aquaculture were only 0.7626 and 0.6888, respectively. This large occupation in production and low GDE, to some extent, resulted in the inefficiency of grouper culture and marine fish culture.
Spotted sea bass was mainly cultured through ordinary pond aquaculture. Its ordinary pond aquaculture accounted for 13.34% of the total production of marine fish culture, and 68.12% of its total production of ordinary pond aquaculture. Its ordinary cage aquaculture accounted for 26.80% of its ordinary cage aquaculture production. It can be observed that its ordinary pond aquaculture and its ordinary cage aquaculture were in an inefficient state, with a GDE of 0.8980 and 0.6297, respectively. This performance influenced the GDE of spotted sea bass culture and marine fish culture.
Turbot and half-smooth tongue sole were mainly cultured through industrial flow-through aquaculture (97.95% of turbot production and 90.08% of half-smooth tongue sole production). Pufferfish were mainly cultured through ordinary pond aquaculture (91.46% of pufferfish production). Turbot industrial flow-through aquaculture (GDE = 0.9953), half-smooth tongue sole industrial flow-through aquaculture (GDE = 0.9603), and pufferfish ordinary pond aquaculture (GDE = 0.8790) were in an inefficient state, which influenced the GDE of turbot, half-smooth tongue sole, and pufferfish.
Japanese flounder was mainly cultured through ordinary pond aquaculture. Its ordinary pond aquaculture accounted for 55.13% of its ordinary pond aquaculture total production. Japanese flounder industrial flow-through aquaculture accounted for 30.70% of its total production. Both Japanese flounder ordinary pond aquaculture and industrial flow-through aquaculture, with GDE of 0.8980 and 0.9884, were running in an inefficient state, which influenced the GDE of Japanese flounder culture.
Golden pompano and cobia were the two species farmed in an efficient state. Golden pompano was mainly produced through offshore cage aquaculture, which accounted for 16.89% of the total production of marine fish culture. Cobia was mainly cultured through ordinary cage aquaculture and offshore cage aquaculture, which contributed 2.70 and 1.89% to the total production of marine fish culture, respectively. Even though cobia culture was running in an efficient state, its offshore cage aquaculture showed space for improvement.
3.3 Comparative analysis of culture areas and the GDE of marine fish culture in China
China has large-scale marine fish culture, and as a result, marine fish culture has high production (Szuwalski et al., 2020). However, based on data from the China Fishery Statistical Yearbook (Bureau of Fisheries of Ministry of Agriculture and Rural Affairs of China, National Fisheries Technical Extension Center of Ministry of Agriculture and Rural Affairs of China, 2018-2020), the scale of marine fish culture in China was dominated by ordinary pond aquaculture (accounting for 82.05% of the total areas of marine fish culture). The green modes with higher GDE (industrial recirculating aquaculture, offshore cage aquaculture, and engineering pond aquaculture) were just developed to a small scale (cumulative percentage accounting for 5.59% of the total areas of marine fish culture) (Figures 10, 11). Even though these green modes had a higher unit production (Gui et al., 2018), with their small scale in China, their production was still lower than that of those traditional modes, such as ordinary pond aquaculture and ordinary cage aquaculture.
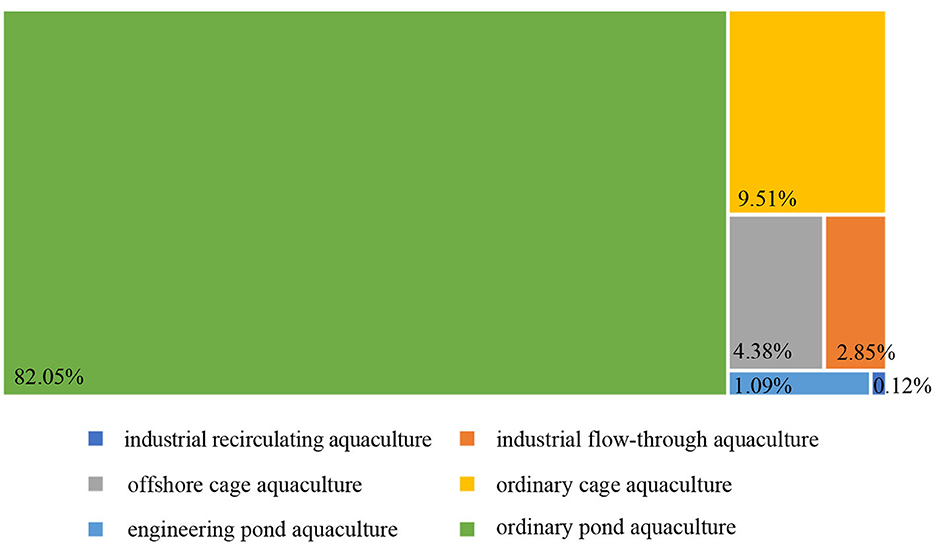
Figure 10. The culture areas proportion of marine fish culture modes in China.
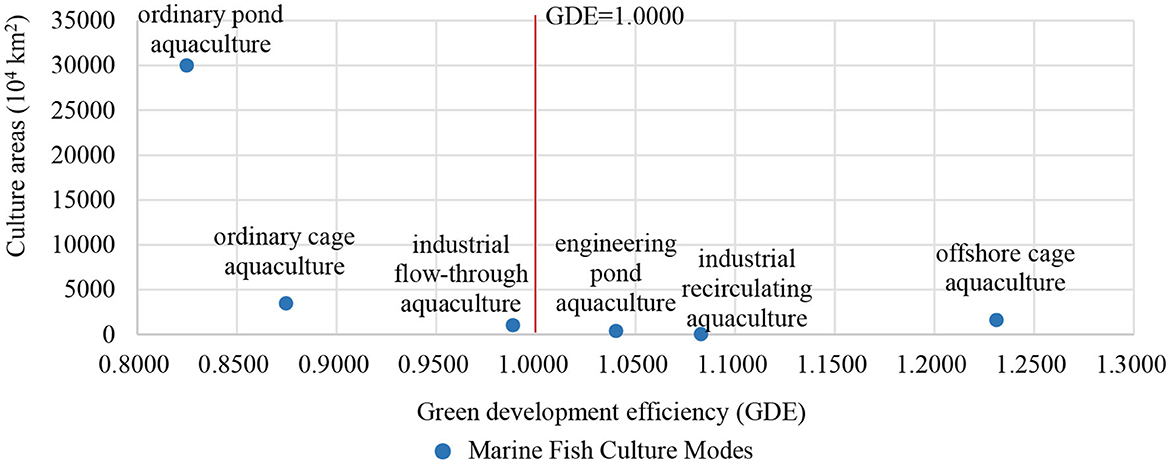
Figure 11. Relationship between culture areas and the GDE of marine fish culture modes in China.
As for the scale of marine fish culture species, grouper and pufferfish cultures had the largest proportions among all marine fish culture species, accounting for 23.41 and 23.17% of the total areas of marine fish culture, respectively. The scales of Japanese flounder and spotted sea bass cultures accounted for 19.85 and 17.76% of the total areas of marine fish culture, respectively. The cumulative percentage of the above species exceeded 84.19% of the total areas of marine fish culture, and their GDE values revealed an inefficient state. As efficient species (GDE > 1), the scale of golden pompano and cobia accounted for only 5.54% of the total areas of marine fish culture (Figure 12). As intensive, efficient, and environmentally friendly aquaculture modes, industrial recirculating aquaculture, offshore cage aquaculture, and engineering pond aquaculture (Hall et al., 2018) have been extended to the coastal areas of China in recent years. However, the scale of these green modes in China is still small, and marine fish farmers lack enthusiasm for green modes.
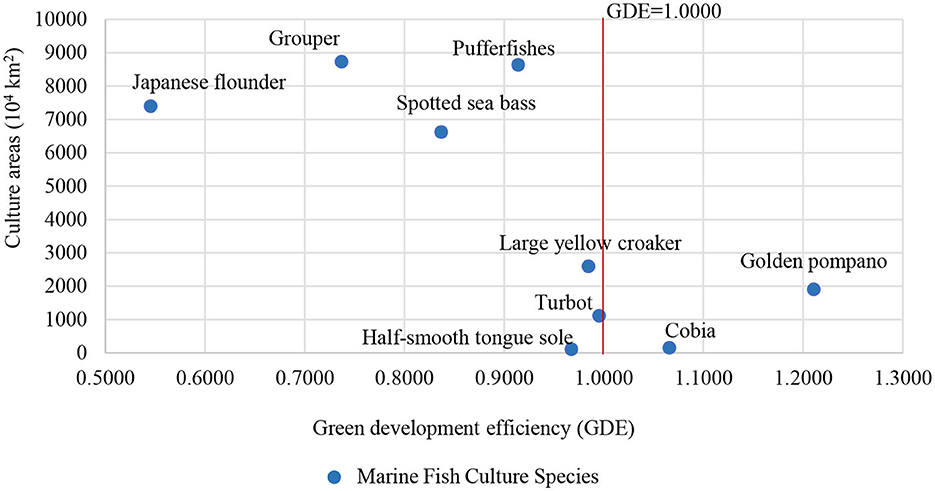
Figure 12. Relationship between culture areas and the GDE of marine fish culture species in China.
3.4 The effect of costs and profits on the GDE of marine fish culture in China
Since marine fish farmers are profit-driven (Bateman and Balmford, 2018), this study conducted statistical accounting on the marine fish culture costs in China. The results are shown in Figure 13. There were significant differences in the costs of marine fish culture modes. The costs of high GDE marine fish culture modes were generally higher than those of low GDE marine fish culture modes. The costs of industrial aquaculture (industrial recirculating aquaculture and industrial flow-through aquaculture) were higher than those of ordinary cage aquaculture and ordinary pond aquaculture. The costs of offshore cage aquaculture were higher than those of ordinary cage aquaculture. There was no price difference in marine fish among various culture modes (Yang et al., 2014). The profits of the same species in green modes were lower than those in traditional modes, affecting marine fish farmers' preference for aquaculture modes. Therefore, it is necessary to establish the price coordination mechanisms of produce to make prices stable at an efficient level.

Figure 13. The costs and profits of different culture modes of various marine fish culture species in China. 1. Turbot industrial aquaculture; 2. Japanese flounder industrial aquaculture; 3. Japanese flounder ordinary pond aquaculture; 4. Japanese flounder ordinary cage aquaculture; 5. Half-smooth tongue sole industrial recirculating aquaculture; 6. Half-smooth tongue sole industrial flow-through aquaculture; 7. Pufferfish industrial aquaculture; 8. Pufferfish ordinary pond aquaculture; 9. Spotted sea bass ordinary pond aquaculture; 10. Spotted sea bass ordinary cage aquaculture; 11. Spotted sea bass offshore cage aquaculture; 12. Cobia ordinary cage aquaculture; 13. Cobia offshore cage aquaculture; 14. Grouper ordinary pond aquaculture; 15. Grouper industrial aquaculture; 16. Golden pompano ordinary cage aquaculture; 17. Golden pompano offshore cage aquaculture; 18. Large yellow croaker ordinary cage aquaculture.
4 Conclusion and recommendations
4.1 Conclusion
The GDE of marine fish culture in China, as well as the GDE of marine fish culture modes and species, were estimated in this study. The results showed that the average GDE of marine fish culture in China was 0.9529. Pufferfish industrial recirculating aquaculture had the highest GDE (GDE = 1.2913), and Japanese flounder ordinary pond aquaculture had the lowest GDE (GDE = 0.3710). Among culture modes, offshore cage aquaculture (GDE = 1.2310), industrial recirculating aquaculture (GDE = 1.0827), and engineering pond aquaculture (GDE = 1.0401) were in an efficient state. Industrial flow-through aquaculture (GDE = 0.9884), ordinary cage aquaculture (GDE = 0.8746), and ordinary pond aquaculture (GDE = 0.8248) were in an inefficient state. For culture species, the culture of golden pompano (GDE = 1.2107) and cobia (GDE = 1.0659) were in an efficient state, and the culture of turbot (GDE = 0.9954), large yellow croaker (GDE = 0.9847), half-smooth tongue sole (GDE = 0.9675), pufferfish (GDE = 0.9142), spotted sea bass (GDE = 0.8370), grouper (GDE = 0.7371), and Japanese flounder (GDE = 0.5455) were in an inefficient state.
The average GDE of 0.9529 means that China's marine fish culture is running in an inefficient state, and extensions and applications of green modes that can improve the GDE of China's marine fish culture are still needed. Because the different culture modes influenced the GDE of marine fish culture to improve the GDE of marine fish culture in China, it is necessary to enlarge the scale and increase the production of green modes (industrial recirculating aquaculture, offshore cage aquaculture, and engineering pond aquaculture). In the current times, the scale of green modes, which are encouraged by the government, is smaller than that of traditional modes, and the production of green modes is less than that of traditional modes (ordinary pond aquaculture and ordinary cage aquaculture). Specifically, more attention should be paid to the green modes of the culture of turbot, large yellow croaker, half-smooth tongue sole, pufferfish, spotted sea bass, grouper, and Japanese flounder.
4.2 Recommendations
To realize the goal of green development of marine fish culture in China by improving the GDE of this industry, it is necessary to increase the profits of green modes since the costs of green modes were higher than those of traditional modes, resulting in significant differences in profits. To this end, financial support, aquaculture insurance systems, technological training for marine fish farmers, and produce price coordination mechanisms are recommended. Financial support for green modes can be used to increase marine fish farmers' benefits, thereby encouraging their initiative to apply them. Aquaculture insurance systems for marine fish farmers are needed to reduce the risks, since they are difficult to obtain insurance from companies (Yang et al., 2015). Technological training for marine fish farmers can help them to improve their skills and update culture modes. This training can be done by strengthening the association among research institutes, universities, and marine fish farmers. Moreover, stable produce price coordination mechanisms, which may improve the benefits of green modes and thereby improve the GDE of marine fish culture in China, are required.
Data availability statement
The original contributions presented in the study are included in the article/supplementary material, further inquiries can be directed to the corresponding author.
Author contributions
LS: Conceptualization, Data curation, Formal analysis, Funding acquisition, Investigation, Methodology, Software, Writing – original draft, Writing – review & editing. ZY: Conceptualization, Funding acquisition, Investigation, Writing – review & editing. QW: Data curation, Formal analysis, Investigation, Writing – review & editing. LP: Data curation, Investigation, Methodology, Writing – review & editing. ZZ: Data curation, Investigation, Writing – review & editing. DL: Data curation, Investigation, Writing – review & editing. SL: Data curation, Investigation, Writing – review & editing.
Funding
The author(s) declare financial support was received for the research, authorship, and/or publication of this article. This work was supported by the National Natural Science Foundation of China (42207552), the China Agriculture Research System (CARS-47-G29), and the Central Public-Interest Scientific Institution Basal Research Fund, and the CAFS (No. 2020TD27).
Acknowledgments
The authors thank the stations of the China Agriculture Research System for the Marine Fish Culture Industry for their support in the data collection process.
Conflict of interest
The authors declare that the research was conducted in the absence of any commercial or financial relationships that could be construed as a potential conflict of interest.
Publisher's note
All claims expressed in this article are solely those of the authors and do not necessarily represent those of their affiliated organizations, or those of the publisher, the editors and the reviewers. Any product that may be evaluated in this article, or claim that may be made by its manufacturer, is not guaranteed or endorsed by the publisher.
References
Ahmad, M., and Wu, Y. Y. (2022). Combined role of green productivity growth, economic globalization, and eco-innovation in achieving ecological sustainability for OECD economies. J. Environ. Manage. 302, 113980. doi: 10.1016/j.jenvman.2021.113980
Ahmed, N., and Thompson, S. (2019). The blue dimensions of aquaculture: a global synthesis. Sci. Total Environ. 652, 851–861. doi: 10.1016/j.scitotenv.2018.10.163
Andersen, P., and Petersen, N. C. (1993). A procedure for ranking efficient units in data envelopment analysis. Manage. Sci. 39, 1261–1264. doi: 10.1287/mnsc.39.10.1261
Aquaculture Pollution Sources Production and Discharge Coefficient Measurement Project Team of National Census of Pollution Sources (2010). The First National Census of Pollution Sources in China - Aquaculture Pollution Sources Production and Discharge Coefficient Manual. Beijing: Beijing Normal University Press.
Bateman, I. J., and Balmford, B. (2018). Public funding for public goods: a post-Brexit perspective on principles for agricultural policy. Land Use Policy 79, 293–300. doi: 10.1016/j.landusepol.2018.08.022
Beijing Normal University. (2010). China Green Development Index Annual Report 2010 - Interprovincial Comparison. Beijing: Beijing Normal University Press.
Belbase, K., and Grabowski, R. (1985). Technical efficiency in Nepalese agriculture. J. Dev. Areas 19, 515–525.
Bureau of Fisheries of Ministry of Agriculture and Rural Affairs of China National Fisheries Technical Extension Center of Ministry of Agriculture and Rural Affairs of China. (2004-2020). 2004-2020 China Fishery Statistical Yearbook. Beijing: China Agriculture Press.
Bureau of Fisheries of Ministry of Agriculture and Rural Affairs of China National Fisheries Technical Extension Center of Ministry of Agriculture and Rural Affairs of China. (2018-2020). 2018-2020 China Fishery Statistical Yearbook. Beijing: China Agriculture Press.
Bureau of Fisheries of Ministry of Agriculture and Rural Affairs of China National Fisheries Technical Extension Center of Ministry of Agriculture and Rural Affairs of China. (2019). 2019 China Fishery Statistical Yearbook. Beijing: China Agriculture Press.
Charnes, A., Cooper, W. W., and Rhodes, E. (1978). Measuring the efficiency of decision making units. Eur. J. Operat. Res. 2, 429–444. doi: 10.1016/0377-2217(78)90138-8
Cui, Y., Liu, W. X., Khan, S. U., Cai, Y., Zhu, J., Deng, Y., et al. (2020). Regional differential decomposition and convergence of rural green development efficiency: evidence from China. Environ. Sci. Pollut. Res. 27, 22364–22379. doi: 10.1007/s11356-020-08805-1
Dey, M. M., Paraguas, F. J., Bimbao, G. B., and Regaspi, P. B. (2000). Technical efficiency of tilapia grow out pond operations in Philippines. Aquac. Econ. Manage. 4, 33–47. doi: 10.1080/13657300009380259
FAO (2018). The State of World Fisheries and Aquaculture 2018. Rome, Italy: FAO Fisheries and Aquaculture Department.
FAO (2020). The State of World Fisheries and Aquaculture 2020. - Sustainability in Action. Rome, Italy: FAO Fisheries and Aquaculture Department.
FAO (2022). The State of World Fisheries and Aquaculture 2022. - Towards Blue Transformation. Rome, Italy: FAO Fisheries and Aquaculture Department.
Gökgöz, F., and Erkul, E. (2019). Investigating the energy efficiencies of European countries with super efficiency model and super SBM approaches. Energy Effic. 12, 601–618. doi: 10.1007/s12053-018-9652-6
Gui, J. F., Tang, Q. S., Li, Z. J., Liu, J. S., and De Silva, S. S. (2018). Aquaculture in China: Success Stories and Modern Trends. New York, NY: John Wiley and Sons. doi: 10.1002/9781119120759
Guo, Y., Tong, L., and Mei, L. (2020). The effect of industrial agglomeration on green development efficiency in Northeast China since the revitalization. J. Clean. Product. 258, 120584. doi: 10.1016/j.jclepro.2020.120584
Hall, S., Campbell, M., Geddie, A., Thomas, M., Paul, D., Wilcox, D., et al. (2018). “Engineering challenges in marine aquaculture,” in 2018 ASABE Annual International Meeting. doi: 10.13031/aim.201800934
Hall, S. J., Delaporte, A., Phillips, M. J., Beveridge, M., and O'Keefe, M. (2011). Blue Frontiers: Managing the Environmental Costs of Aquaculture. Penang: The WorldFish Center.
Hilborn, R., Amoroso, R. O., Anderson, C. M., Baum, J. K., Branch, T. A., Costello, C., et al. (2020). Effective fisheries management instrumental in improving fish stock status. Proc. Natl. Acad. Sci. USA. 117, 2218–2224. doi: 10.1073/pnas.1909726116
Iliyasu, A., and Mohamed, Z. A. (2015). Technical efficiency of tank culture systems in peninsular Malaysia: an application of data envelopment analysis. Aquac. Econ. Manage. 19, 372–386. doi: 10.1080/13657305.2015.1082118
Iliyasu, A., Mohamed, Z. A., Ismail, M. M., and Abdullah, A. M. (2014). A meta-analysis of technical efficiency in aquaculture. J. Appl. Aquac. 26, 329–339. doi: 10.1080/10454438.2014.959829
Islam, G. M. N., Tai, S. Y., and Kusairi, M. N. (2016). A stochastic frontier analysis of technical efficiency of fish cage culture in Peninsular Malaysia. Springer Plus 5, 1127. doi: 10.1186/s40064-016-2775-3
Khan, S. U., Cui, Y., Khan, A. A., Ali, M. A. S., Khan, A., Xia, X., et al. (2021). Tracking sustainable development efficiency with human-environmental system relationship: an application of DPSIR and super efficiency SBM model. Sci. Total Environ. 783, 146959. doi: 10.1016/j.scitotenv.2021.146959
Kim, S. E., Kim, H., and Chae, Y. (2014). A new approach to measuring green growth: application to the OECD and Korea. Futures 63:37–48. doi: 10.1016/j.futures.2014.08.002
Lei, J. L. (2009). Annual Report 2009 of National Technology System for Flatfish Culture Industry. Qingdao: China Ocean University Press.
Li, H., Fang, K. N., Yang, W., Wang, D., and Hong, X. X. (2013). Regional environmental efficiency evaluation in China: analysis based on the super-SBM model with undesirable outputs. Mathem. Comput. Model. 58, 1018–1031. doi: 10.1016/j.mcm.2012.09.007
Li, W., and Ouyang, X. (2020). Investigating the development efficiency of the green economy in China's equipment manufacturing industry. Environ. Sci. Pollut. Res. 27, 24070–24080. doi: 10.1007/s11356-020-08811-3
Long, L. K., Thap, L. V., and Hoai, N. T. (2020). An application of data envelopment analysis with the double bootstrapping technique to analyze cost and technical efficiency in aquaculture: do credit constraints matter? Aquaculture 525, 735290. doi: 10.1016/j.aquaculture.2020.735290
Lubchenco, J., Haugan, P., and Pangestu, M. E. (2020). Five priorities for a sustainable ocean economy. Nature 588, 30–32. doi: 10.1038/d41586-020-03303-3
Meng, M., and Qu, D. L. (2022). Understanding the green energy efficiencies of provinces in China: a super-SBM and GML analysis. Energy 239, 121912. doi: 10.1016/j.energy.2021.121912
National Marine Fish Industry Technology Research and Development Center (2018-2020). Annual Report 2018-2020 of China Agriculture Research System for Marine Fish Culture Industry. Qingdao: China Ocean University Press.
National Marine Fish Industry Technology Research and Development Center (2019). Annual Report 2019 of China Agriculture Research System for Marine Fish Culture Industry. Qingdao: China Ocean University Press.
Naylor, R., Hindar, K., Fleming, I. A., Goldburg, R., Williams, S., Volpe, J., et al. (2005). Fugitive salmon: assessing the risks of escaped fish from net-pen aquaculture. Bioscience 55, 427–437. doi: 10.1641/0006-3568(2005)055[0427:FSATRO]2.0.CO;2
Naylor, R. L., Goldburg, R. J., Primavera, J. H., Kautsky, N., Beveridge, M. C., Clay, J., et al. (2000). Effect of aquaculture on world fish supplies. Nature 405, 1017–1024. doi: 10.1038/35016500
Nielsen, R. (2011). Green and technical efficient growth in Danish fresh water aquaculture. Aquac. Econ. Manage. 15, 262–277. doi: 10.1080/13657305.2011.624574
OECD (2009). Green Growth: Overcoming the Crisis and Beyond. Paris: OECD. doi: 10.1787/9789264083639-en
Prescott-Allen, R. (1995). The Barometer of Sustainability: A Method of Assessing Progress Towards Sustainable Societies. Victoria, BC, Switzerland: International union for the conservation of nature and natural resources and PADATA.
Qiu, F., Chen, Y., Tan, J., Liu, J., Zheng, Z., and Zhang, X. (2020). Spatial-temporal heterogeneity of green development efficiency and its influencing factors in growing metropolitan Area: a case study for the Xuzhou Metropolitan Area. Chinese Geograph. Sci. 30, 352–365. doi: 10.1007/s11769-020-1114-3
Rahman, S., Barmon, B. K., and Ahmed, N. (2011). Diversification economies and efficiencies in a ‘blue-green revolution' combination: a case study of prawn-carp-rice farming in the ‘gher' system in Bangladesh. Aquac. Int. 19, 665–682. doi: 10.1007/s10499-010-9382-z
Schaltegger, S., and Sturm, A. (1990). Ökologische Rationalität: ansatzpunkte zur Ausgestaltung von ökologieorientierten Managementinstrumenten. Die Unternehmung 44, 273–290.
Schulte, J., and Knuts, S. (2022). Sustainability impact and effects analysis - a risk management tool for sustainable product development. Sustain. Prod. Consumpt. 30, 737–751. doi: 10.1016/j.spc.2022.01.004
See, K. F., Ibrahim, R. A., and Goh, K. H. (2021). Aquaculture efficiency and productivity: A comprehensive review and bibliometric analysis. Aquaculture 544, 736881. doi: 10.1016/j.aquaculture.2021.736881
Sharma, K. R., Leung, P., Chen, H., and Peterson, A. (1999). Economic efficiency and optimum stocking densities in fish polyculture: an application of data envelopment analysis (DEA) to Chinese fish farms. Aquaculture 180, 207–221. doi: 10.1016/S0044-8486(99)00202-1
Shen, Y., Sun, S., Yue, S., and Sun, X. (2020). Ecological development efficiency index of tropics and subtropics in China. Environ. Sci. Pollut. Res. Int. 27, 14160–14174. doi: 10.1007/s11356-020-07844-y
Sievers, M., Korsøen, Ø., Warren-Myers, F., Oppedal, F., Macaulay, G., Folkedal, O., et al. (2021). Submerged cage aquaculture of marine fish: a review of the biological challenges and opportunities. Rev. Aquac. 14, 100–119. doi: 10.1111/raq.12587
Sun, L. Q., Liu, H., Gao, Y. P., Jiang, Z. J., Lin, F., Chang, L. R., et al. (2020). Food web structure and ecosystem attributes of integrated multi-trophic aquaculture waters in Sanggou Bay. Aquac. Rep. 16, 100279. doi: 10.1016/j.aqrep.2020.100279
Sustainable Development Strategy Research Group Chinese Academy of Sciences (CAS),. (2011). China Sustainable Development Strategy Report 2011- Greening the Economic Transformation. Beijing: Science Press.
Szuwalski, C., Jin, X., Shan, X., and Clavelle, T. (2020). Marine seafood production via intense exploitation and cultivation in China: costs, benefits, and risks. PLoS ONE 15, e0227106. doi: 10.1371/journal.pone.0227106
Tang, Q. S. (2017a). Consulting Report on Green Development of Aquaculture. Beijing: China Ocean Press.
Tang, Q. S. (2017b). Development Strategy of Environment-Friendly Aquaculture: New Ideas, New Tasks and New Approaches. Beijing: Science Press.
Tang, Q. S., and Liu, H. (2016). Strategy for carbon sink and its amplification in marine fisheries. Eng. Sci. 3, 68–73. doi: 10.15302/J-SSCAE-2016.03.011
Tao, X. P., Wang, P., and Zhu, B. Z. (2016). Provincial green economic efficiency of China: a non-separable input-output SBM approach. Appl. Energy 171, 58–66. doi: 10.1016/j.apenergy.2016.02.133
Tone, K. (2001). A slacks-based measure of efficiency in data envelopment analysis. Eur. J. Operat. Res. 130, 498–509. doi: 10.1016/S0377-2217(99)00407-5
Tone, K. (2002). A slacks-based measure of super-efficiency in data envelopment analysis. Eur. J. Operat. Res. 143, 32–41. doi: 10.1016/S0377-2217(01)00324-1
Tone, K. (2004). Dealing With Undesirable Outputs in DEA: A Slacks-Based Measure (SBM) Approach. Toronto: GRIPS.
Twumasi, M. A., Jiang, Y. S., Fosu, P., Addai, B., and Essel, C. H. K. (2022). The impact of credit constraint on artisanal fishers' technical efficiency: stochastic frontier and instrumental variable approach. Reg. Stud. Mar. Sci. 50, 102149. doi: 10.1016/j.rsma.2021.102149
UNDP (1990). Human Development Report 1990: Concept and Measurement of Human development. New York: UNDP.
UNEP (2014). Towards a green economy: Pathways to sustainable development and poverty eradication. St-Martin-Bellevue, France.
UNESCAP (2009). Eco-efficiency Indicators: Measuring Resource-use Efficiency and the Impact of Economic Activities on the Environment. Bangkok: UNESCAP.
Waite, R., Beveridge, M., Brummett, R., Castine, S., Chaiyawannakarn, N., Kaushik, S., et al. (2014). Improving productivity and environmental performance of aquaculture. WorldFish.
Wang, P., and Ji, J. (2017). Research on China's mariculture efficiency evaluation and influencing factors with undesirable outputs-an empirical analysis of China's ten coastal regions. Aquac. Int. 25, 1521–1530. doi: 10.1007/s10499-017-0131-4
Wu, G., Riaz, N., and Dong, R. (2022). China's agricultural ecological efficiency and spatial spillover effect. Environ. Dev. Sustain. 25, 3073–3098. doi: 10.1007/s10668-022-02169-x
Yang, Y. Y., Guo, H. X., Chen, L. F., Liu, X., Gu, M. Y., and Ke, X. L. (2019). Regional analysis of the green development level differences mineral resource-based cities. Resour. Policy 61, 261–272. doi: 10.1016/j.resourpol.2019.02.003
Yang, Z., Ye, Z., Wang, C., and Han, Z. (2015). The difference research of formal loan in aquaculture- taking the small and medium aquaculture producers in flatfish aquaculture as an example. Chin. Agric. Sci. Bull. 31, 265–271.
Yang, Z. Y., Liu, D., and Peng, L. W. (2021). Green development of mariculture in China: estimation, regional comparison and research on development strategy. Ecol. Econ. 37, 128–135.
Yang, Z. Y., Zhang, X. Z., Han, Z. F., and Tang, K. Y. (2014). Food supply value and their factors of three pond aquaculture ecosystems: a case study of Shanghai. Asian Agric. Res. 6, 68–75.
Ye, F., Quan, Y. B., He, Y. X., and Lin, X. F. (2021). The impact of government preferences and environmental regulations on green development of China's marine economy. Environ. Impact Assess. Rev. 87, 106522. doi: 10.1016/j.eiar.2020.106522
Yu, S. W., Zheng, Y. L., Hu, X., and Shu, K. S. (2022). Spatial impacts of biomass resource endowment on provincial green development efficiency. Renew. Energy 189, 651–662. doi: 10.1016/j.renene.2022.03.051
Yu, X., Hu, Q. G., and Shen, M. H. (2020). Provincial differences and dynamic changes in mariculture efficiency in China: based on Super-SBM model and global malmquist index. Biology 9, 18. doi: 10.3390/biology9010018
Zhang, Y., Shen, L. Y., Shuai, C. Y., Tan, Y. T., Ren, Y. T., and Wu, Y. (2019). Is the low-carbon economy efficient in terms of sustainable development? A global perspective. Sustain. Dev. 27, 130–152. doi: 10.1002/sd.1884
Zhao, P. J., Zeng, L. E., Lu, H. Y., Zhou, Y., Hu, H. Y., and Wei, X. Y. (2020). Green economic efficiency and its influencing factors in China from 2008 to 2017: Based on the super-SBM model with undesirable outputs and spatial Dubin model. Sci. Total Environ. 741, 140026. doi: 10.1016/j.scitotenv.2020.140026
Zhou, L., Zhou, C. H., Che, L., and Wang, B. (2020). Spatio-temporal evolution and influencing factors of urban green development efficiency in China. J. Geograph. Sci. 30, 724–742. doi: 10.1007/s11442-020-1752-5
Zhu, Y., Zhou, X., Li, J., and Wang, F. (2022). Technological innovation, fiscal decentralization, green development efficiency: based on spatial effect and moderating effect. Sustainability 14, 4316. doi: 10.3390/su14074316
Keywords: efficiency evaluation, green development efficiency, marine fish culture, super-SBM model, sustainable development
Citation: Sun L, Yang Z, Wang Q, Peng L, Zhang Z, Liu D and Li S (2023) Evaluation of the green development efficiency of marine fish culture in China. Front. Sustain. Food Syst. 7:1274224. doi: 10.3389/fsufs.2023.1274224
Received: 09 August 2023; Accepted: 24 November 2023;
Published: 20 December 2023.
Edited by:
Erick Ochieng Ogello, Maseno University, KenyaReviewed by:
Yunzhou Li, Stony Brook University, United StatesFausto Silvestri, FIPERJ, Brazil
Felipe Landuci, Federal University of Rio de Janeiro, Brazil
Copyright © 2023 Sun, Yang, Wang, Peng, Zhang, Liu and Li. This is an open-access article distributed under the terms of the Creative Commons Attribution License (CC BY). The use, distribution or reproduction in other forums is permitted, provided the original author(s) and the copyright owner(s) are credited and that the original publication in this journal is cited, in accordance with accepted academic practice. No use, distribution or reproduction is permitted which does not comply with these terms.
*Correspondence: Zhengyong Yang, enl5YW5nQHNob3UuZWR1LmNu