 Hao Dong
 Jichang Han1*
- 1Shaanxi Provincial Land Engineering Construction Group Co., Ltd., Shaanxi, China
- 2Institute of Land Engineering and Technology, Shaanxi Provincial Land Engineering Construction Group Co., Shaanxi, China
- 3Shaanxi Construction Land Engineering Quality Inspection Co., Ltd., Shaanxi, China
- 4Land Surveying, Planning and Design Institute of Shaanxi Land Engineering Engineering Construction Group Co., Ltd., Shaanxi, China
- 5School of Ecology and Environment, Northwestern Polytechnical University, Shaanxi, China
Introduction: Agricultural eco-efficiency is an important index to evaluate the agricultural sustainable development and ecological economics, while simultaneously providing a metric for improvements to the rural environment and the stability of agricultural ecosystems.
Methods: This study took Anhui province as a case, and applied unit survey and list analysis methodologies to quantify rural agricultural non-point source pollution (NPS). Input-oriented super-efficient DEA-SBM was used to measure agricultural eco-efficiency in the typical North-South Transition Zone, and evaluated spatial correlations and differences.
Results: This study showed that NPS was relatively stable, with less than 5% local variation in Chemical Oxygen Demand (COD), Total Nitrogen (TN), and Total Phosphorus (TP) pollutants. The environmental pressure caused by livestock breeding and the use of chemical fertilizers was very substantial, and the differences of rural agricultural NPS in Anhui Province had obvious north-south characteristics. The agricultural eco-efficiency exhibited an “inverted N” trend. Affected by the “Spatial proximity effect” and the “Matthew effect”, it presented spatial agglomeration and positive spatial correlation. The regional differences were significant, and the heterogeneity increased in our study areas. The southern region had the greatest variation, followed by the northern region, with the smallest variation in the central region, although inter-regional differences were consistent.
Discussion: Though the rational allocation of resources, coordination between agricultural economic and environmental protection would be realized, and better conditions for the sustainable development of agricultural ecology and the long-term stability of agricultural ecosystem would be created.
1. Introduction
Under the extensive economic growth model, the problems of resource waste, environmental pollution and ecological deterioration caused by the economic growth that relies on the massive input and expansion of production factors have gradually become prominent. The rural areas are in the weak link of environmental governance for a long time, and the dual pressure of exogenous pollution and endogenous pollution seriously restricts the healthy development of agriculture. The distribution of pollutants with water as the carrier presents a large spatial heterogeneity (Xue et al., 2020), and rural areas have gradually become the “refuge” of pollutants transferred by urban and industrial development (Peng, 2020; Wang et al., 2022).
Under the background of urban and rural integration, the research on sustainable agricultural production mode and green development has been paid more and more attention. Large-scale agricultural planting has high technical efficiency, and agricultural pollutant emission reduction and carbon offset can be achieved through conservation tillage and biological nitrogen fixation technology (Bojnec and Latruffe, 2013; Sá et al., 2017; Mwalupaso et al., 2019). The farming method and planting structure are affected by terrain and climate (Yandun Narváez et al., 2018; Qian et al., 2022). There is a significant difference in agricultural production conditions between the north and the south of China, and there is an uneven distribution of agricultural climate resources in time and space, and the transition zone is a sensitive area for the change of agricultural production resources. Differences in temperature, sunshine and water resources directly affect the structure and quality of agricultural products (Bu et al., 2010; Zhao et al., 2021; Wang et al., 2023). Therefore, exploring the structure of agricultural non-point source pollution in the transition zone and analyzing the level and spatial difference of ecological efficiency can provide scientific basis for agricultural green production. Previous studies have shown that there are significant regional differences in rural green development (Sun et al., 2022; Liu et al., 2023), and there is spatial heterogeneity in the impact of technology application and factor allocation on agricultural green production (Grzelak et al., 2019; Coluccia et al., 2020; Cui et al., 2021). The agricultural ecological efficiency based on opportunity cost accounting basically takes Qinling Mountains and Huaihe River as the dividing line. The southern region has better economic, resource and environmental benefits than the northern region, and the loss of agricultural production efficiency is mainly due to excessive consumption of resources and excessive discharge of environmental pollutants (Abdella et al., 2021; Zhang et al., 2022). At present, most of the research focuses on the analysis of agricultural green production using various methods from different regional scales, and relatively lacks the research on the north-south transition zone.
This paper takes Anhui Province as a typical representative of the north-south transition zone, discusses the spatial and temporal differences of green agricultural production, and intends to solve the following scientific problems:
1. What is the law of the status quo and evolution of agricultural non-point source pollution in the north-south transition zone? What is the level of agricultural eco-efficiency in the transition zone?
2. Is there a regional difference in the eco-efficiency of the north-south transition zone? Is there a temporal and spatial variation?
In summary, this study based on the super-DEA-SBM model of undesired output, the agricultural ecological efficiency is calculated, and its evolution trend and spatial characteristics are analyzed.
2. Materials and methods
2.1. Overview of the study area
Anhui Province (114°54′—119°37′E, 29°41′—34°38′N), located north and south of the Qinling Mountains, is the birthplace of rural reform and a typical large agricultural province in central China, with suitable climatic conditions and characteristics of diversified and multi-type agricultural development. The topography of the province is complex, the Yangtze River and the Huaihe River run through it, and the province is divided into northern Anhui, central Anhui and southern Anhui (Figure 1). The north of Huaihe River is northern Anhui, including Fuyang, Bozhou, Huaibei, Suzhou, Huainan, and Bengbu. The terrain is low and flat, mainly plain, and the agriculture is mainly wheat planting. Central Anhui is an area south of the Huaihe River in the north of the Yangtze River, including Liuan, Hefei, Chuzhou and Anqing; southern Anhui is an area south of the Yangtze River, including Chizhou, Tongling, Wuhu, Maanshan, Huangshan, and Xuancheng. Central and southern Anhui are mainly hilly and mountainous areas, mainly producing agricultural and sideline products such as rice and tea.
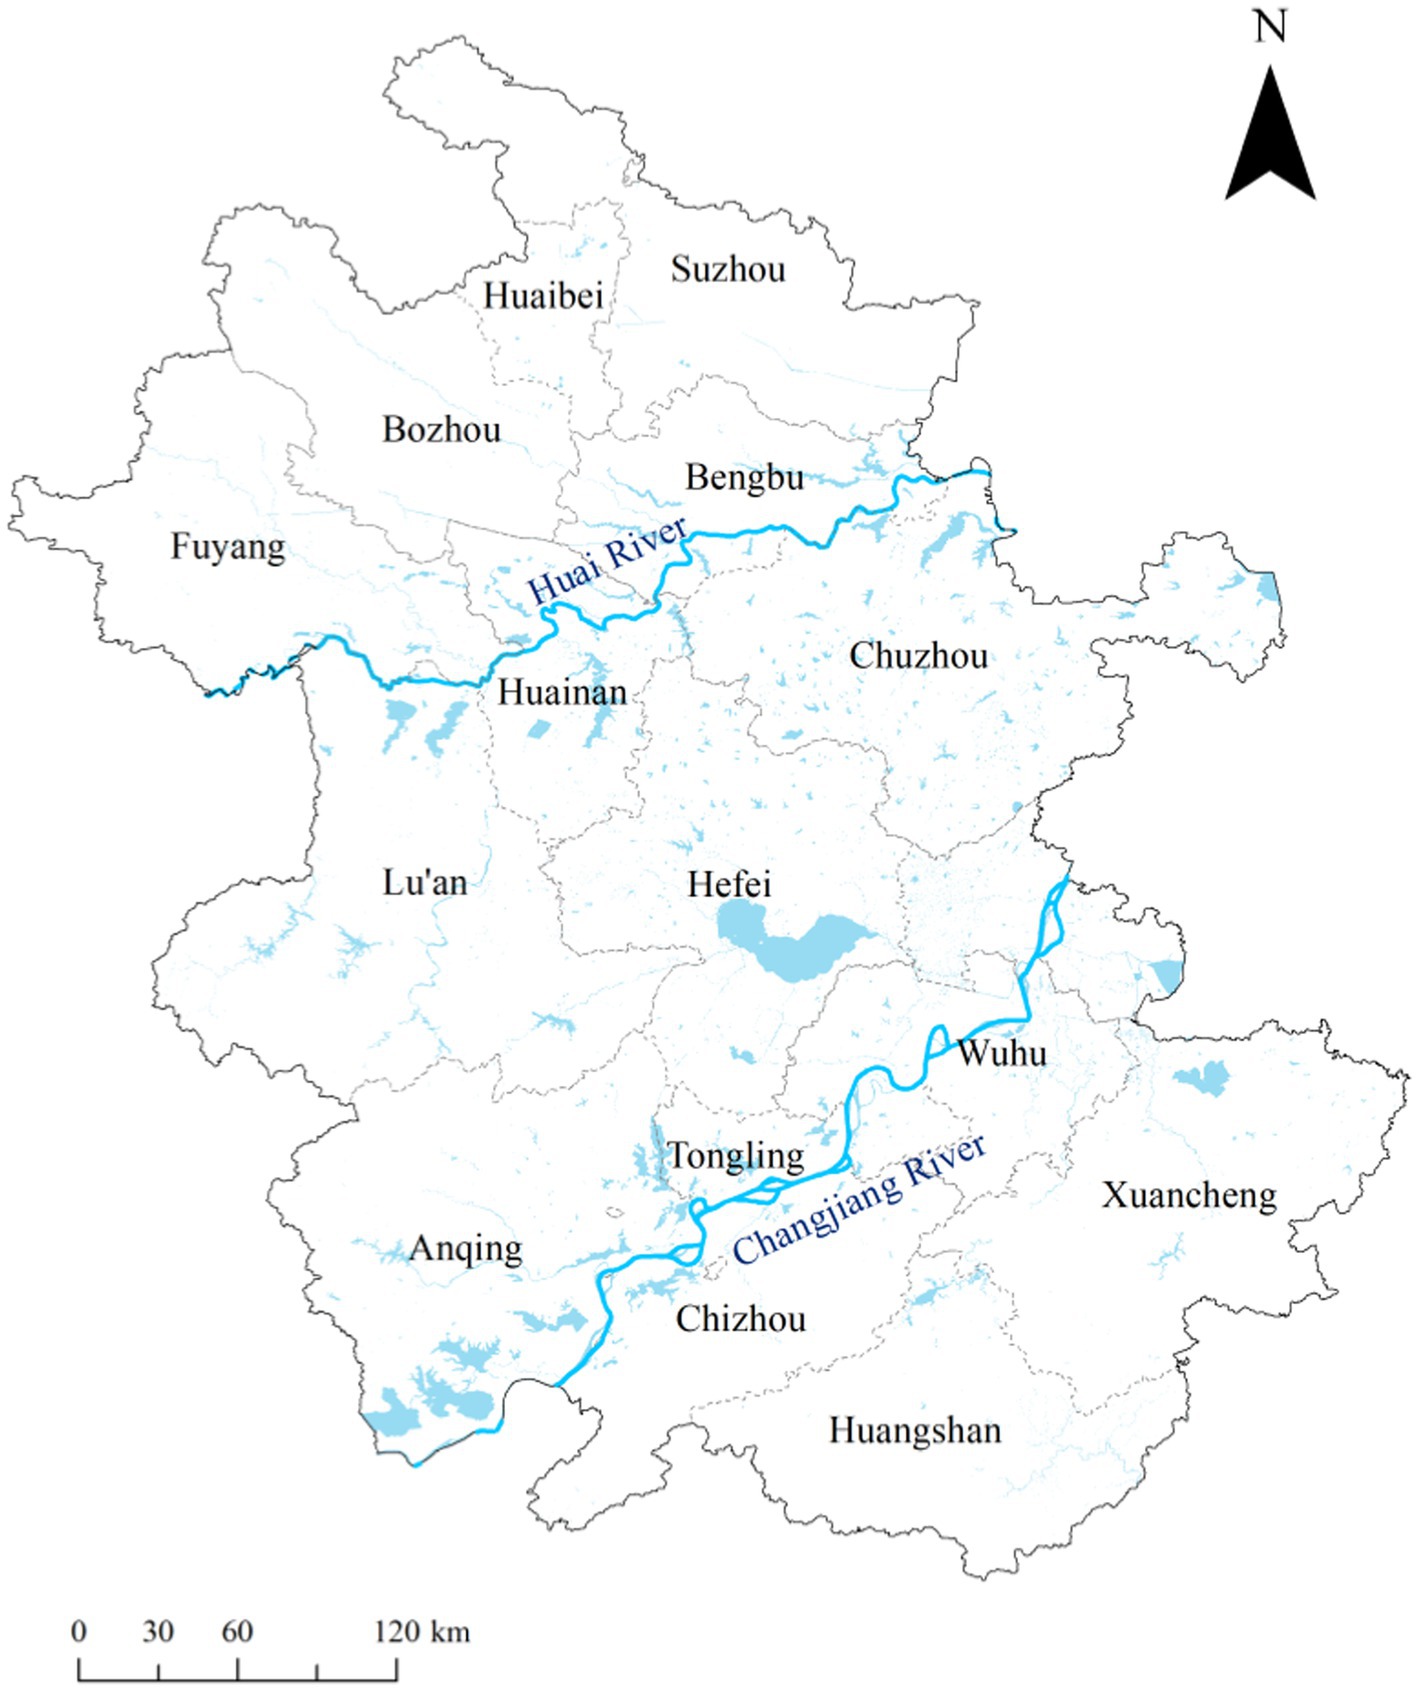
Figure 1. Study area and spatial distribution.
2.2. Data source and processing
In this paper, the total sown area of crops, the number of employees in agriculture, forestry, animal husbandry and fishery, the total power of agricultural machinery, the conversion amount of fertilizer used, the amount of pesticides used, and the effective irrigation area were selected as input indicators, the total output value of agriculture, forestry, animal husbandry and fishery was the expected output, and the total amount of agricultural non-point source pollution was the non-expected output. Panel data of prefecture-level cities in Anhui Province were collected from 2005 to 2022. The data mainly come from China Statistical Yearbook, Anhui Provincial Statistical Yearbook and the compilation of agricultural industry statistical development data.
2.3. Research method
2.3.1. Measuring method of agricultural non-point source pollution
Agricultural non-point source pollutants are mainly chemical oxygen demand (COD), total nitrogen (TN), and total phosphorus (TP), most of which come from farmland fertilizer application, livestock and poultry breeding, farmland production of solid waste and rural life. This paper adopts the method of unit investigation and checklist analysis (Zou et al., 2020). The emissions of each pollution source are calculated according to the research results of agricultural pollution production coefficient and emission coefficient, and the calculation formula is shown in Eq. (1).
In the equation, E represents the emission of COD, TN and TP from agricultural non-point source pollution, is the quantity of statistical unit q, is the pollution production intensity coefficient of statistical unit, is the loss rate of related resources, and is the pollution emission coefficient determined by agricultural statistic and spatial feature S.
2.3.2. Measuring method of agricultural ecological efficiency
Eco-efficiency measures the level of expected output and undesired output brought by the input of certain agricultural production factors, which can reflect the development of agricultural economy and the ecological environment at the same time. This paper chooses to use the input-oriented undesired output super-DEA-SBM model (Du et al., 2010). The Data Envelopment Analysis (DEA) method was proposed by Charnes, Coopor, and Rhodes in 1978. Keep the input or output of decision making units (DMUs) unchanged, and use statistical models and planning methods to determine a relatively effective production frontier. At the same time, each decision-making unit is projected onto the production frontier surface, and there is no need to non-dimensionalize the index. A method to evaluate the relative effectiveness by comparing the degree of deviation between the decision-making unit and the frontier surface.
For U , if there are M input, N expected output and R non-expected output, the efficiency model of the k-th DMU is shown in Eq. (2):
In the equation, ρ represents agro-ecological efficiency, , , and are the relaxation variables of input, expected output and unexpected output respectively, , , and are the i-th input variable, j-th expected output variable and l-th unexpected output variable of .
2.3.3. Spatial autocorrelation and difference measurement method of agricultural eco-efficiency
This paper uses Global Moran’s I statistics to measure the autocorrelation coefficient of ecological efficiency, and uses stata 15 software tool to realize the calculation. At the same time, Moran scatter plot is drawn to clarify the spatial distribution characteristics of cities. This study uses the Theil index to measure the overall difference (T) and decomposes it into intra-regional differences (Tw) and inter-regional differences (Tb) as follows:
Where n is the number of prefecture-cities, the transition zone is divided into three groups: northern Anhui, Guanzhong region and Southern Anhui. The numbers of the three groups of cities are , , and respectively. is the mean value of agroecological efficiency of all cities, is the mean value of the region in group i, and is the agroecological efficiency value of the j-th city in the region in group i-th.
3. Data analysis and research results
3.1. Measurement of agricultural non-point source pollution
3.1.1. Current situation of total agricultural non-point source pollution
The agricultural non-point source pollution in Anhui Province from 2005 to 2022 was calculated (Figure 2). The average COD, TN and TP emissions in rural areas were 87.95 × 10⁴ t, 29.97 × 10⁴ t, and 4.3 × 10⁴ t, respectively, and the three non-point source pollutants showed the same trend. From 2005 to 2011, it showed a downward trend, and then slowly increased to 2019, and then showed a steady downward trend, with the greatest decline in 2011 and 2021. The lists of COD, TN and TP pollution produced by the four main types of surface source pollution sources are shown in Figure 3.
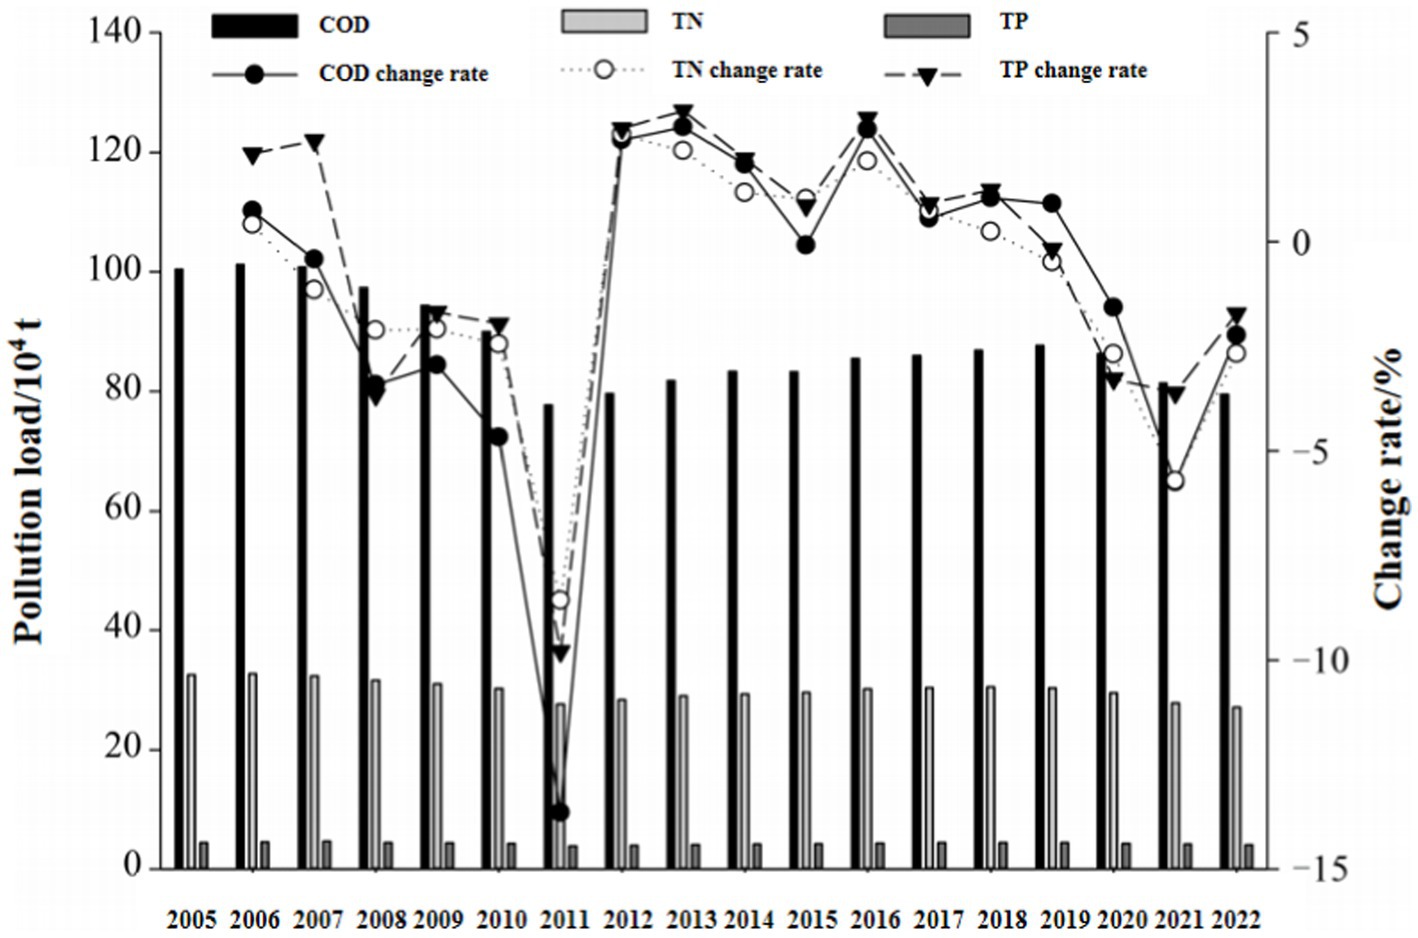
Figure 2. Rural non-point source pollution during 2005–2022.
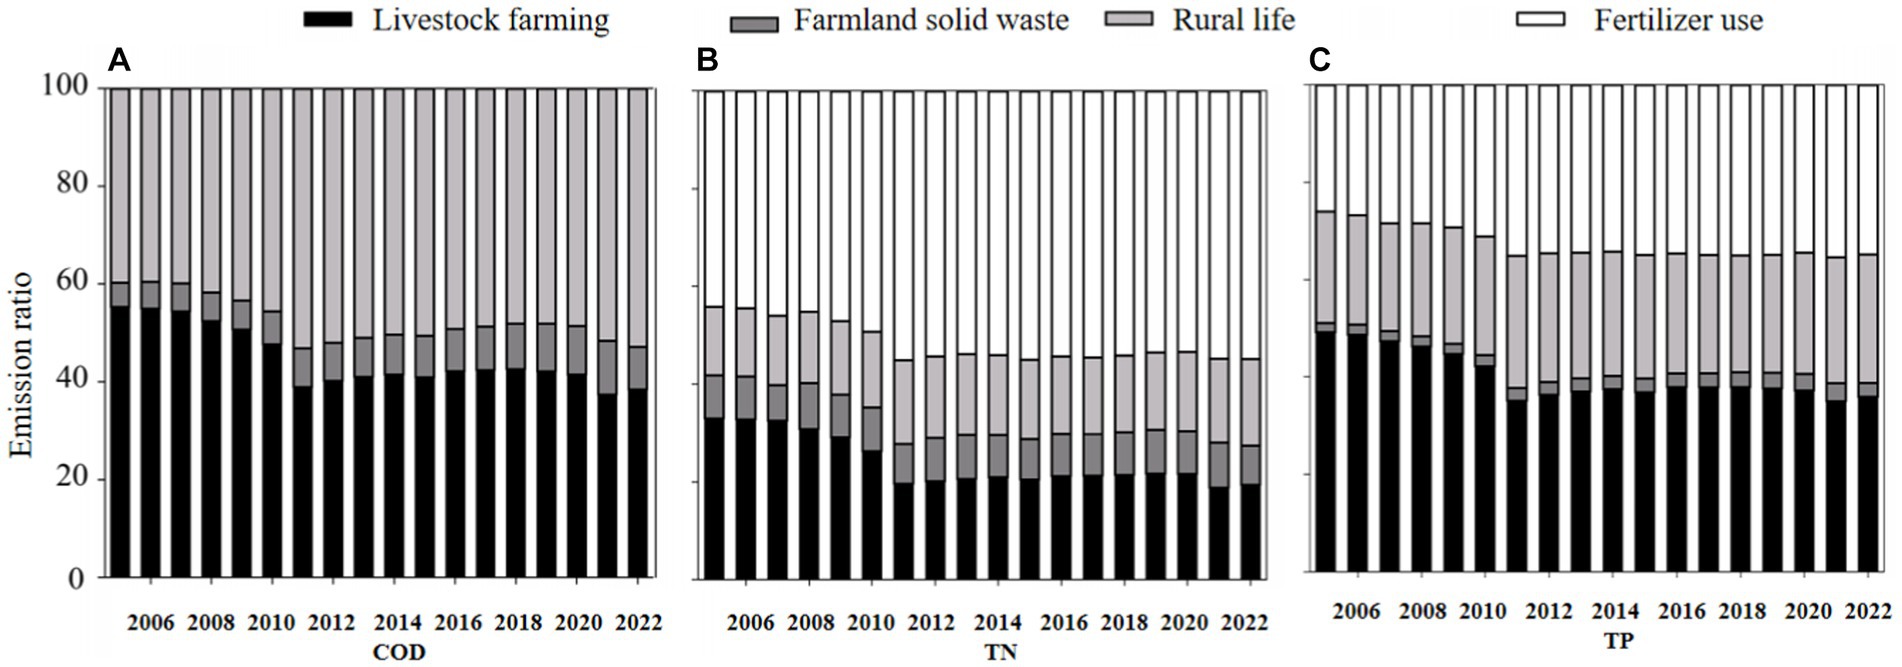
Figure 3. List of rural non-point source pollution emission percentages.
From the perspective of rural non-point source pollution composition, COD mainly comes from livestock and poultry breeding and rural life, with an average contribution rate of 44.68 and 47.47%. The change of COD contribution rate of livestock and poultry breeding tends to decline, the increase of agricultural products leads to the increase of farmland solid waste, which leads to the increase of COD contribution rate, and the change of COD proportion generated by rural life is more obvious. Fertilizer use and livestock breeding are the main causes of TN pollution, with annual contribution rates of 51.57 and 24%, respectively. The proportion of TN emissions from fertilizer use increased significantly, the contribution rate of livestock breeding and rural life decreased and increased respectively, and the change trend of farmland solid waste was not significant. The main sources of TP from agricultural non-point sources were fertilizer use and livestock breeding, with average contribution rates of 40.02 and 32.69% respectively, followed by rural living sources and farmland solid waste.
3.1.2. Spatial and temporal distribution of agricultural non-point source pollution structure
The non-point source pollution emissions from agricultural production and life in various cities were summarized, and the spatial distribution in 2005, 2011, 2017, and 2022 were selected (Figure 4). It was found that there were obvious regional differences in non-point source pollution in Anhui Province, the composition of pollutants was relatively stable, and the vertical change law was not significant. COD emission is the main emission in various cities, followed by TN and TP, and the highest emission area is Yulin, a large agricultural city in northern China, with an average annual emission of 19.88 × 10⁴ t, accounting for 16.26% of the total in Anhui Province. It is followed by Suzhou and Bozhou in the north and Lu’an in the middle, accounting for more than 10%. Relatively few areas are Chizhou, Huangshan and Tongling in the south, with an average annual proportion of 2.17, 2.08, and 0.83%, respectively, with a significant north-south distribution difference. Agricultural non-point source pollution in various cities is not very regular, and the pollutant emissions in Tongling, Huainan, Bengbu and Huaibei increased, with an average annual change rate of 12.66, 5.6, 0.48, and 0.16%, respectively, while those in other areas decreased, and Bozhou was the fastest, with an average annual change rate of −3.15%.
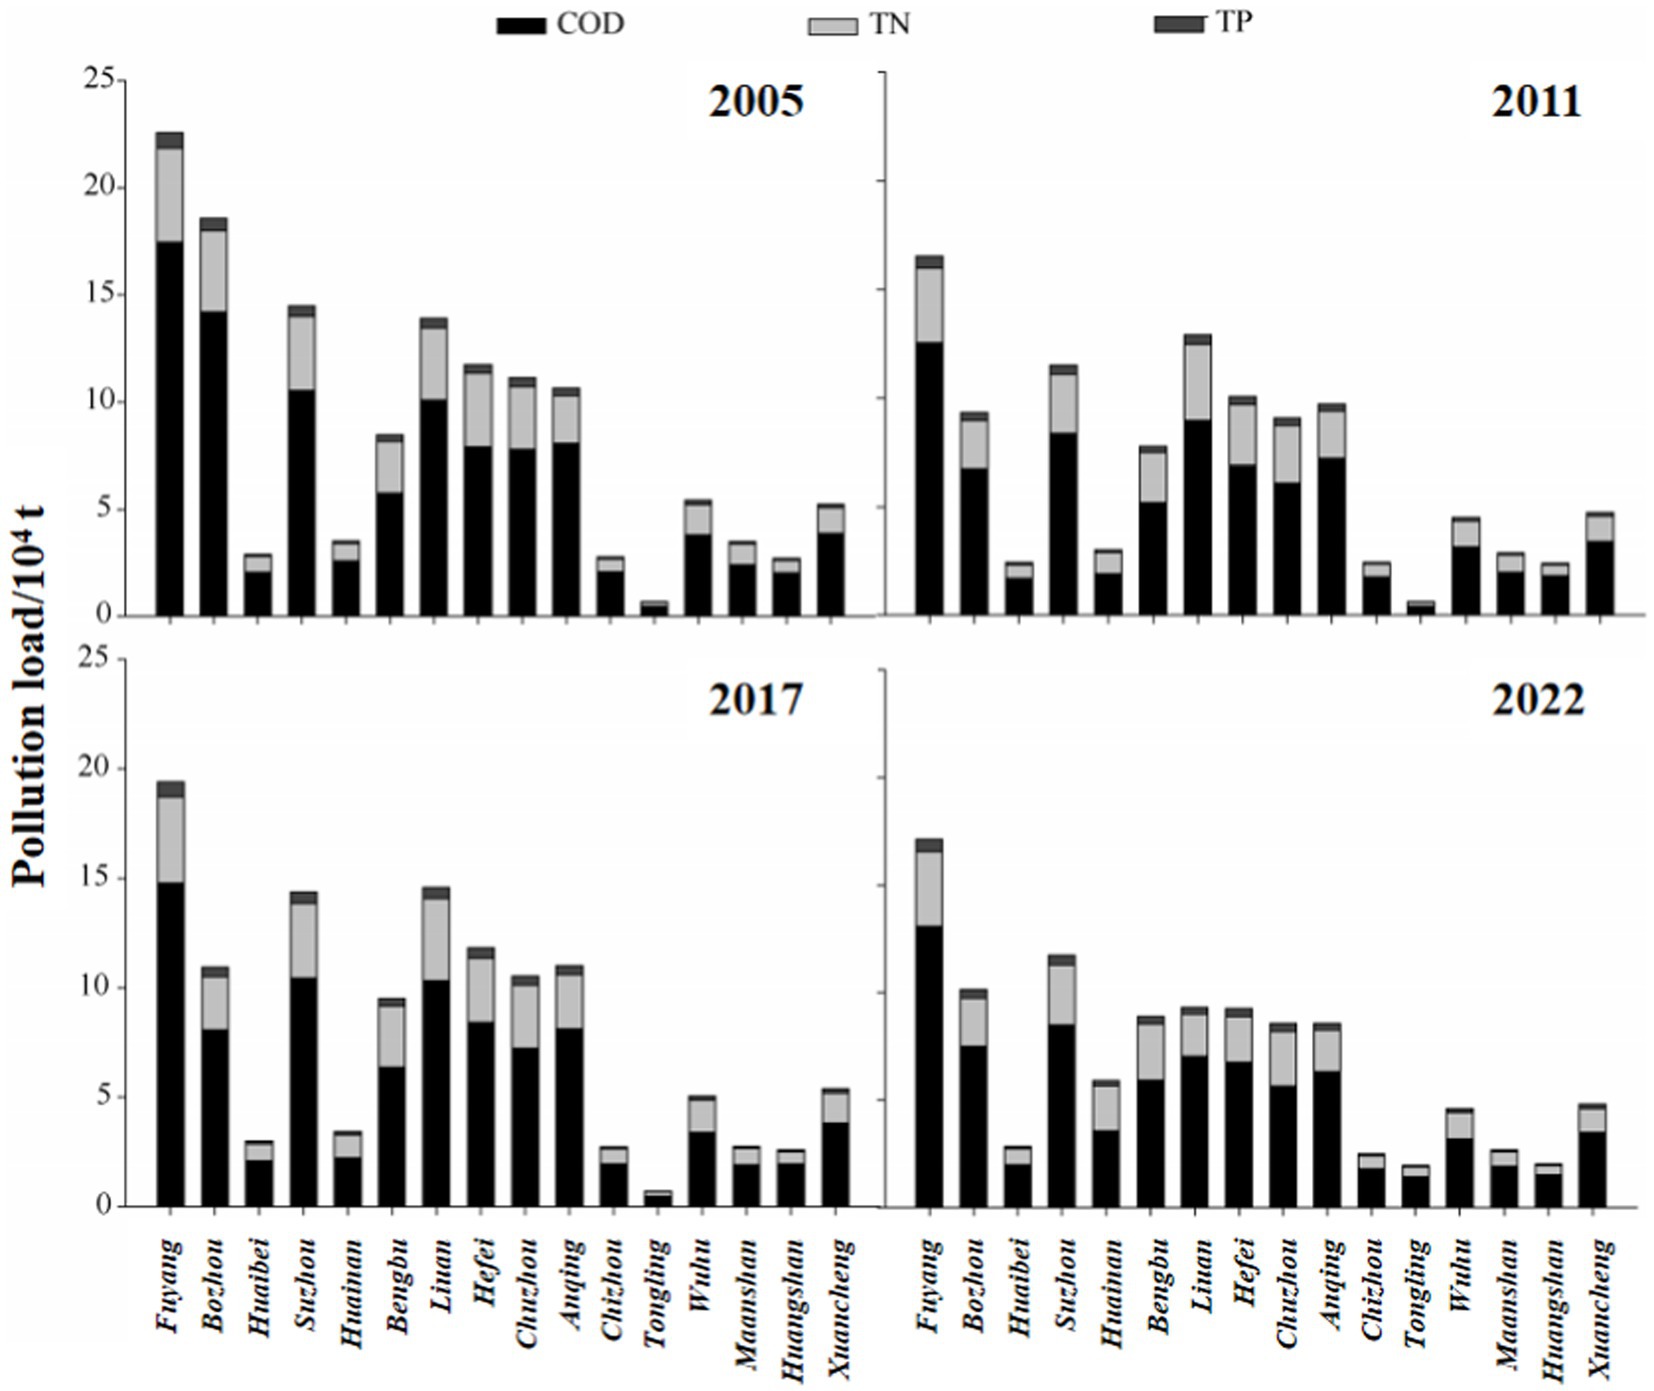
Figure 4. Spatial distribution of rural non-point source pollution in several years during 2005–2022.
3.2. Agroecological efficiency extraction
The input-oriented super-DEA-SBM was used to estimate the value of agricultural eco-efficiency from 2005 to 2022 (Table 1; Figure 5). The value showed an “inverted N” type trend of first decreasing, then rising and then slowly decreasing, and the efficiency value fluctuated around 0.7. In Anhui Province, the degree of intensive land use is low, the input of sowing area is excessive, and the policy effect of guiding the transfer of agricultural labor is not significant. As a result, the redundancy rate of agricultural employees has increased since 2013, but the surplus of fertilizers and pesticides has decreased since 2020 (Figure 6).
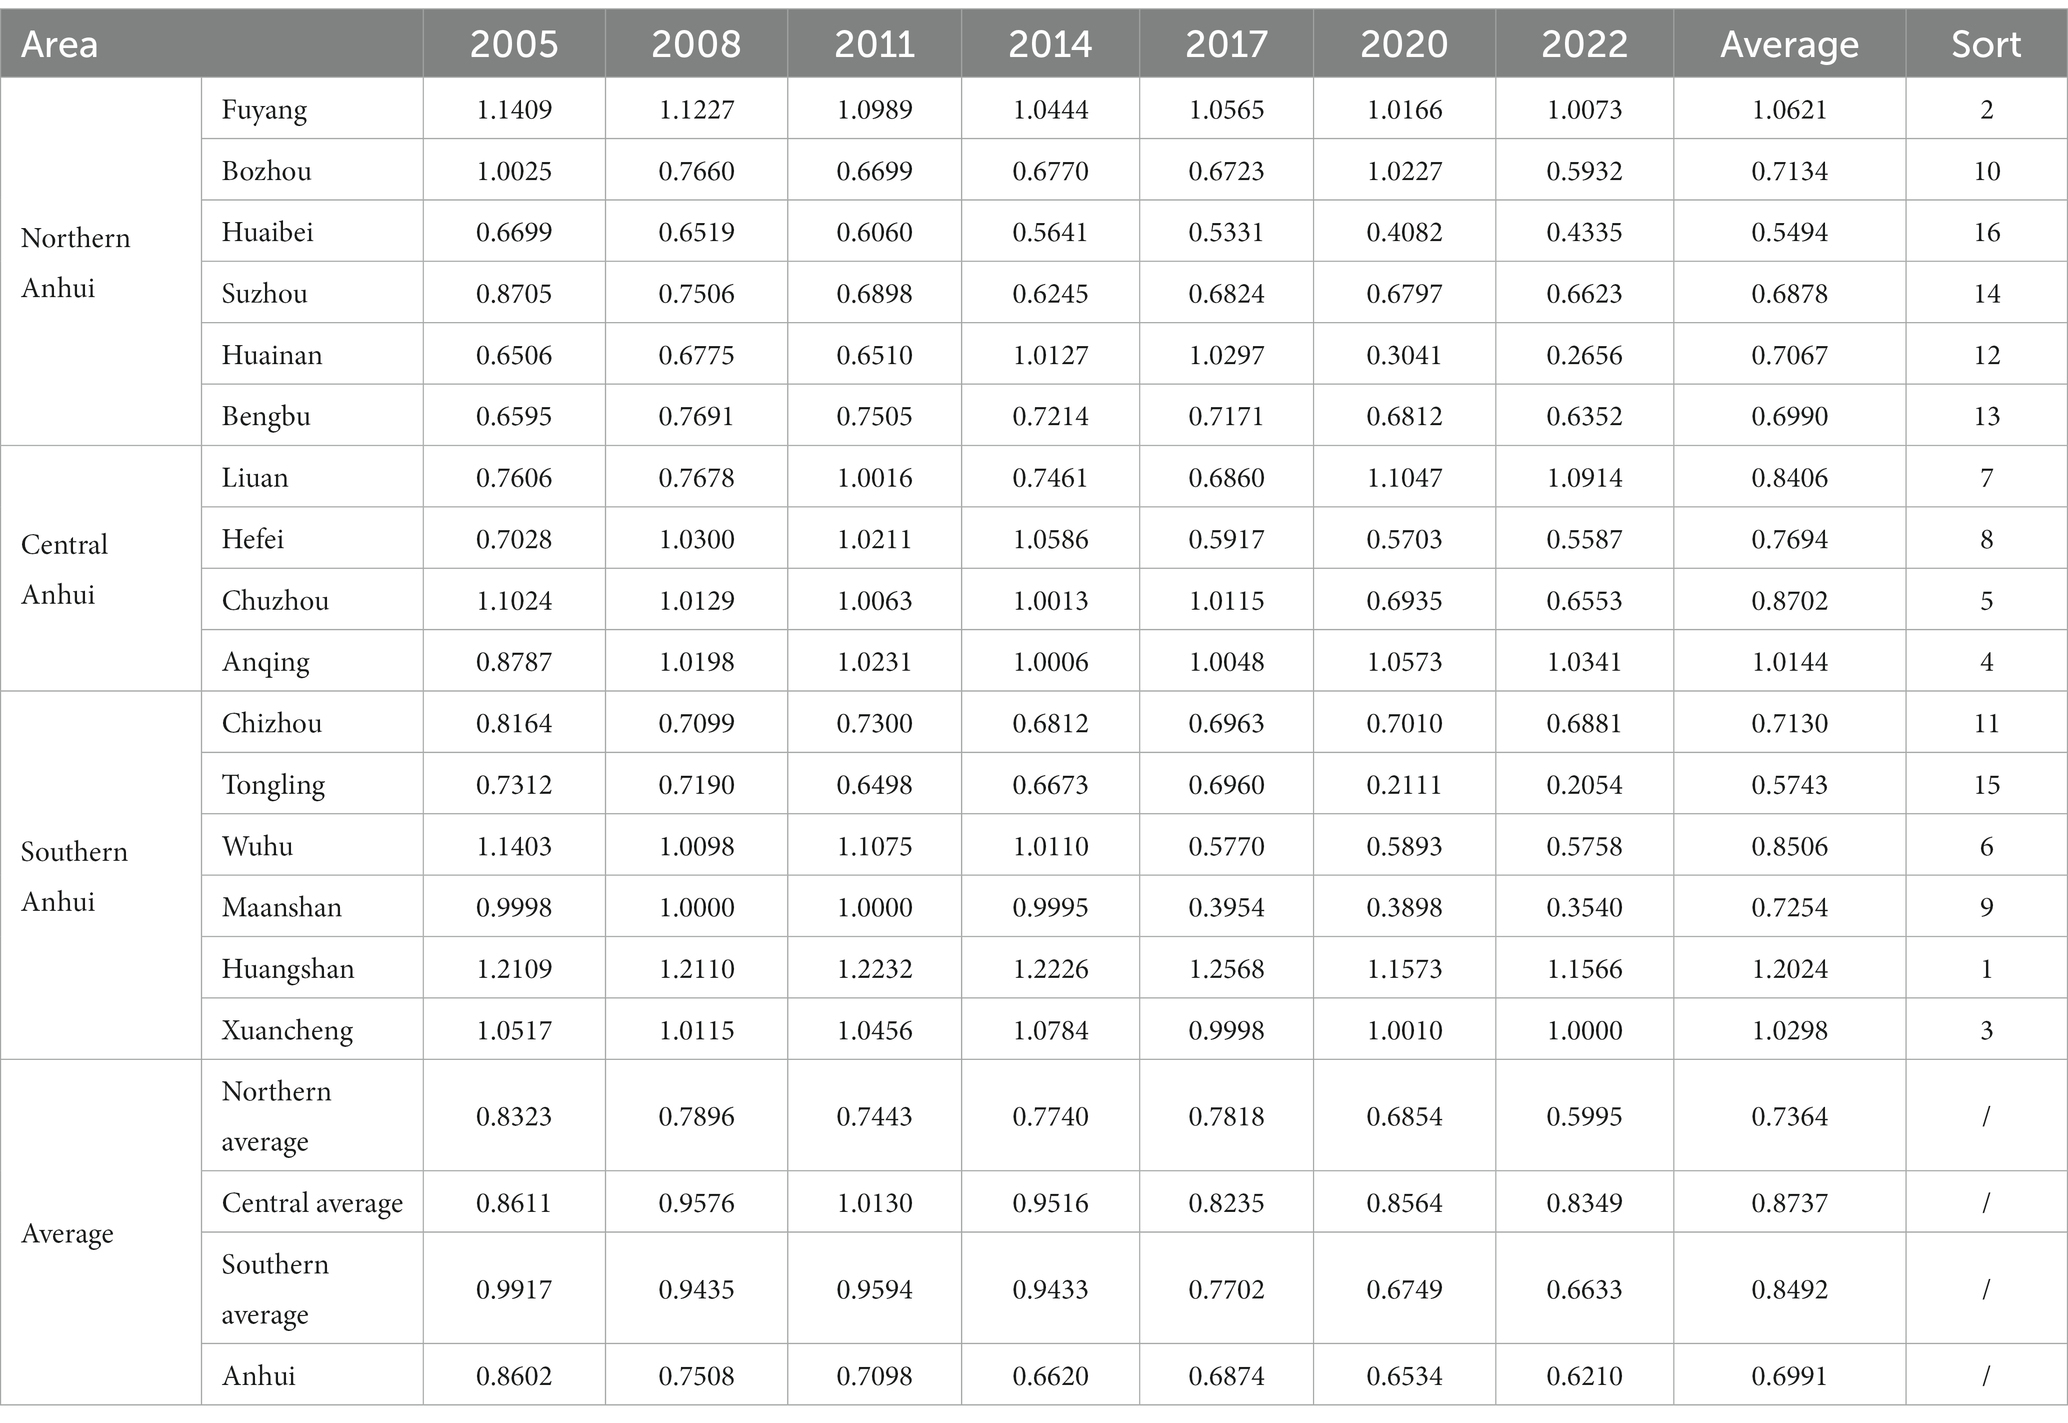
Table 1. Agricultural eco-efficiency of several years during 2005–2022.
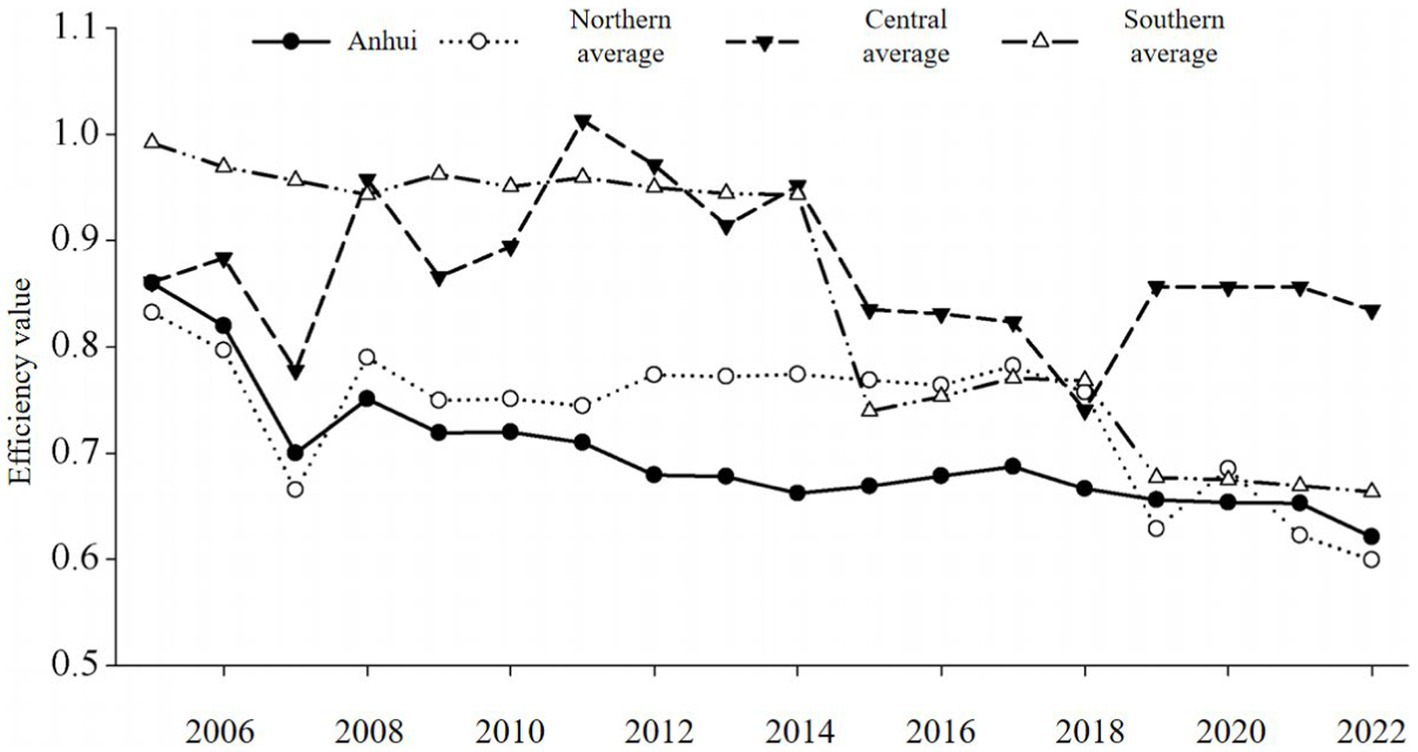
Figure 5. Average value of regional agricultural ecological efficiency during 2005–2022.
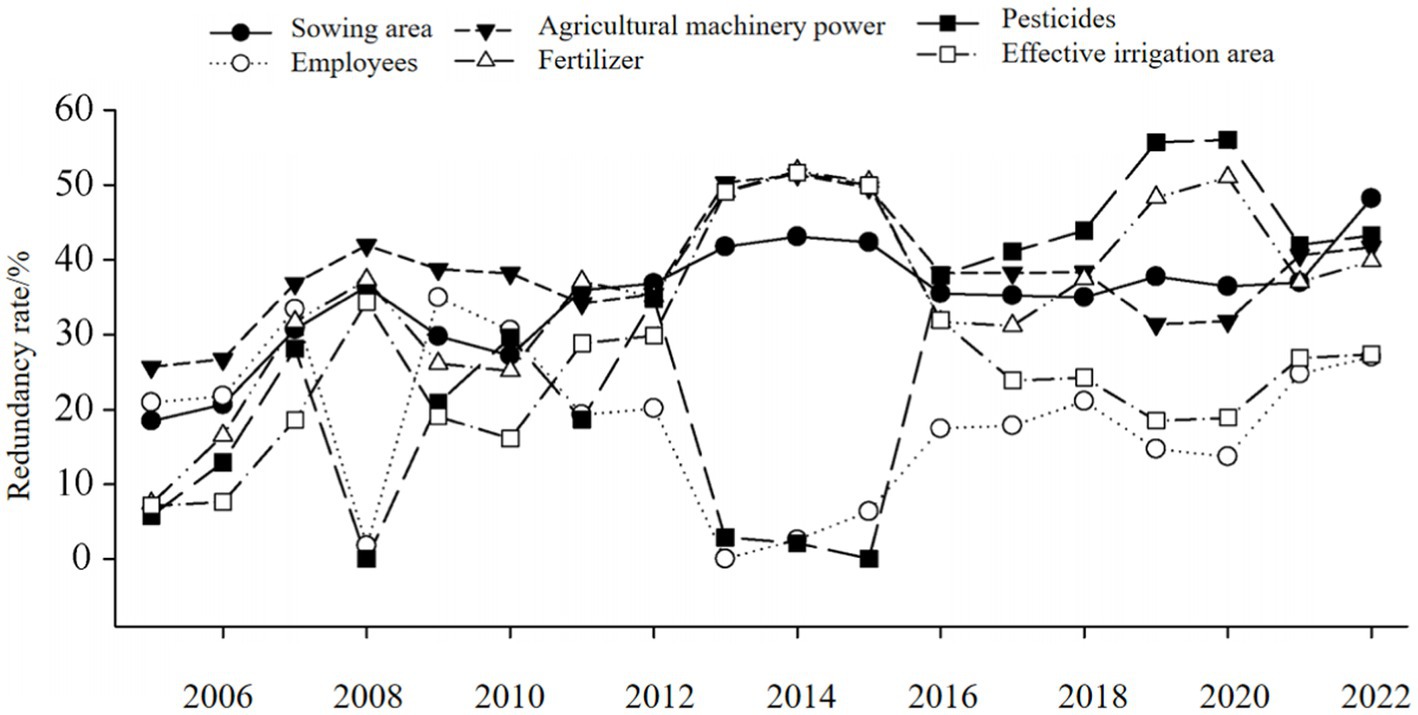
Figure 6. Agricultural production redundancy rate during 2005–2022.
The average eco-efficiency level in the southern region is comparable to that in the central region, which is significantly higher than that in the northern region, and the gap is narrowing. The eco-efficiency in the southern region fluctuates greatly. The agricultural eco-efficiency values of Huangshan, Xuancheng, Wuhu, and other cities in the south are higher, but the agricultural eco-efficiency of resource-based cities such as Chizhou and Tongling in the south is lower. The eco-efficiency of the four cities in the central region is at the upper-middle level of the transitional zone. The agricultural eco-efficiency in the northern region is only high in Fuyang, while the agricultural eco-efficiency in other northern regions is low.
3.2.1. The temporal and spatial evolution characteristics of agricultural eco-efficiency
The global autocorrelation index of agroecological efficiency ranged from 0.076 to 0.348, and except for some years, the rest could pass the test at the significance level of 10%, showing a positive Moran’s I index of spatial autocorrelation (Table 2). The regions with similar agroecological efficiency are adjacent to each other, and the agricultural green production among the regions has a mutual promotion relationship, and the change trend is first rising and then decreasing, showing the phenomenon of “dispersion, agglomeration and dispersion.” Among them, the correlation was strongest in 2015, and the spatial agglomeration of regions with similar efficiency levels was constantly adjusted.
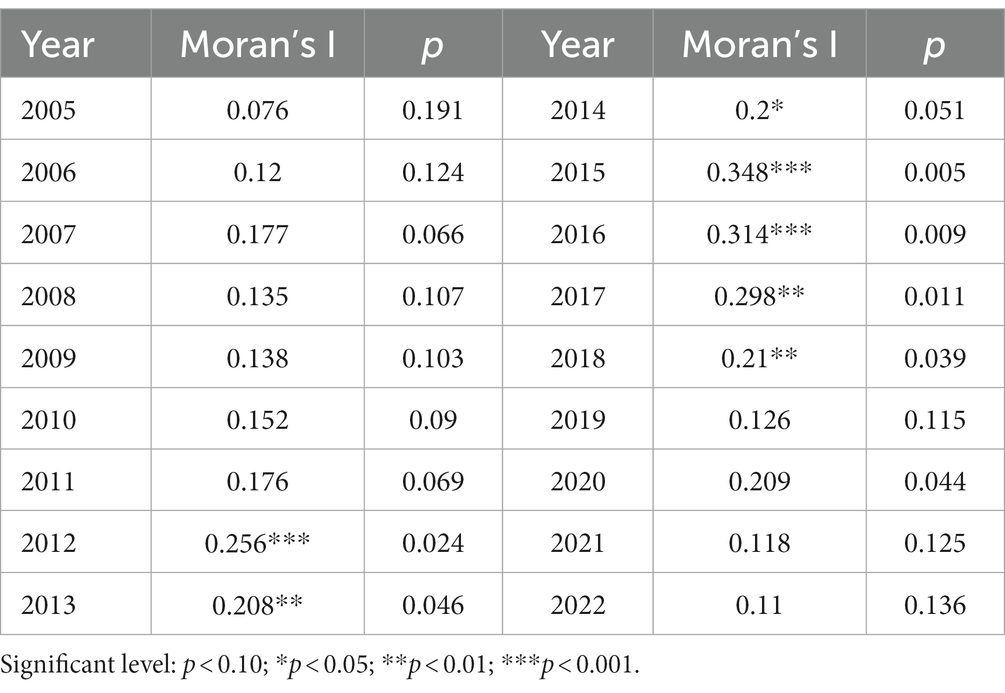
Table 2. A Global spatial autocorrelation of agricultural eco-efficiency during 2005–2022.
The Moran’s I scatter plot of agricultural eco-efficiency was drawn by selecting 2007, 2011, 2015 and 2020 as the research cross section (Figure 7). After 2007, the efficiency “depressions” of Anqing, Fuyang, and Huangshan were improved. Under the influence of “spatial proximity effect” and “Matthew effect,” the spatial agglomeration of ecological agriculture efficiency was enhanced from 2005 to 2015, mainly concentrated in the “high-high” agglomeration area in the first quadrant and the “low-low” agglomeration area in the third quadrant, showing the diffusion and driving radiation effects of agricultural ecological efficiency. After 2011, the weakening of spatial agglomeration of agricultural eco-efficiency means that regional heterogeneity is enhanced and the difference is expanded, and the spatial spillover effect is reduced.
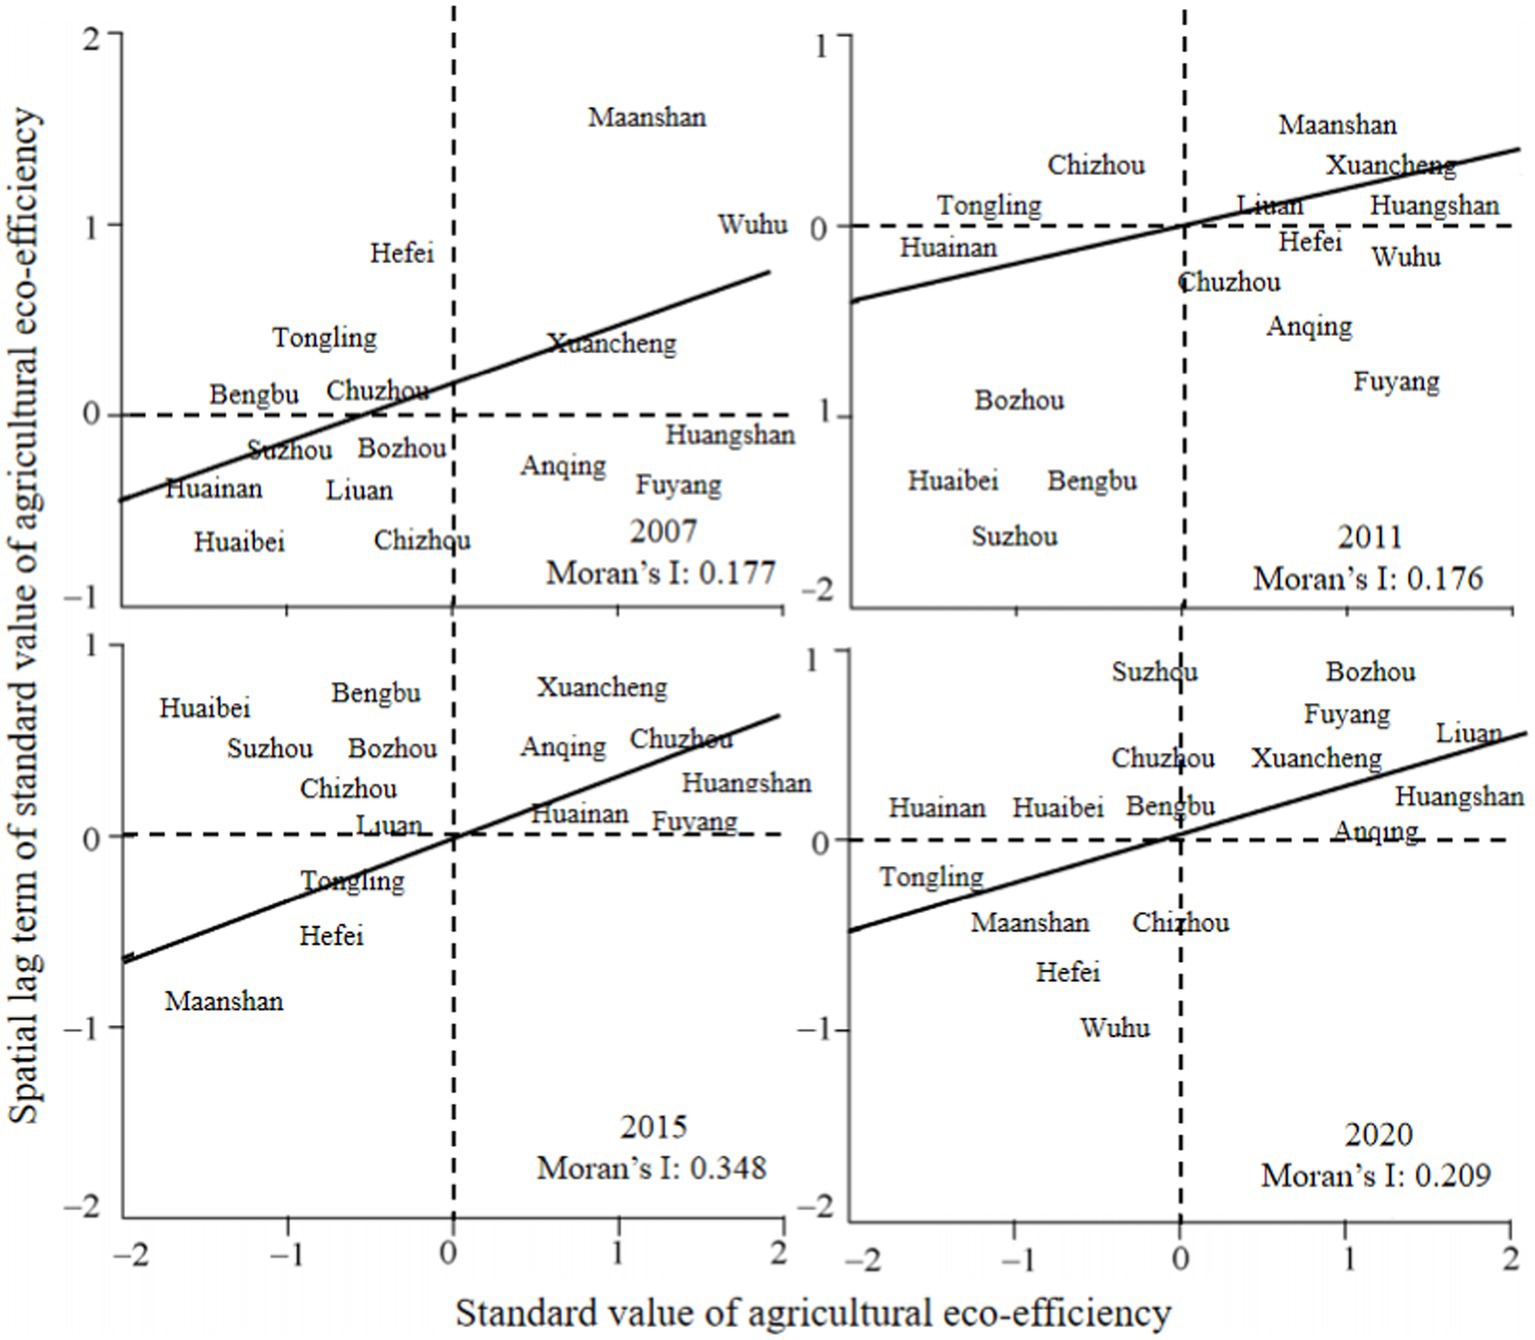
Figure 7. Moran’s I scatter plot of agricultural eco-efficiency in several years during 2005–2022.
The “high-high” agglomeration area shows a trend of marginal diffusion and spreads to the adjacent inter-provincial marginal areas of the transitional zone. Taking 2020 as an example, the agglomeration area is mainly Huangshan and Xuancheng in southern Anhui, Anqing, and Lu’an in central Anhui, Bozhou, and Fuyang in northern Anhui, which are concentrated in the border area of Henan, Anhui, Hubei, and Jiangxi. The “low-high” agglomeration area gradually moves from the central and southern parts to the central and northern parts. In 2020, the area is Suzhou, Chuzhou, Bengbu, Huainan and Huaibei along the Huaihe River, and the ecological efficiency level is similar. The “low-low” agglomeration area is mainly Tongling, Chizhou, Ma’anshan, and other southern resource-based cities, which are affected by resource utilization and environmental impact. The efficiency of ecological agriculture is low, and it has become a “new depression” of agricultural ecological efficiency in the transitional zone.
The results of the Theil index of agricultural eco-efficiency (Figure 8) show that the total difference of agricultural eco-efficiency is small, between 0.02 and 0.1, showing an increasing trend, which is mainly caused by intra-group differences. The internal differences in the transitional zone are gradually enlarged, and the southern differences > northern differences > central differences, and the degree of heterogeneity increase in the southern region is significantly higher than that in the central and northern regions. In recent years, the differences in agricultural production in the southern region of the Yangtze River have gradually increased due to industrial adjustment, production conditions and policy changes. The difference in agricultural production efficiency in the northern region south of the Huaihe River is lower than that in the south. The central region is basically unchanged. The difference between the groups is small, and the fluctuation is not obvious. The overall difference of agricultural eco-efficiency in the south, middle, and north is small.
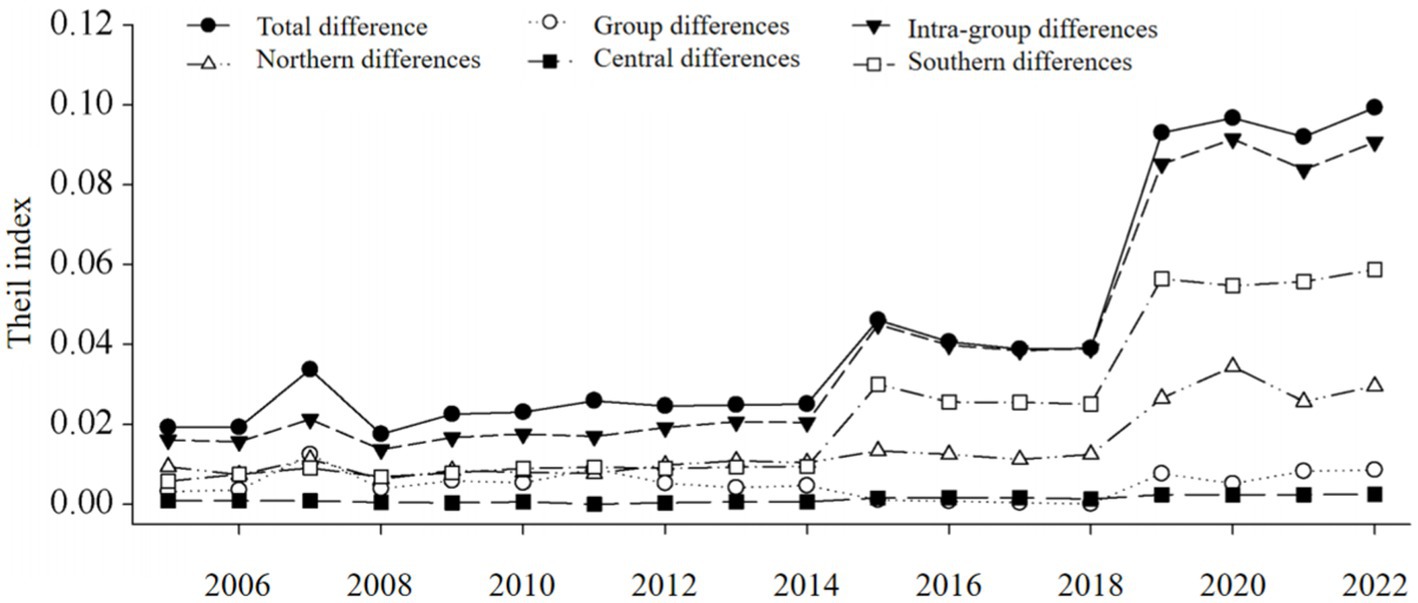
Figure 8. Theil index of agricultural eco-efficiency during 2005–2022.
4. Discussion
4.1. Sources and prevention of agricultural non-point source pollution
Livestock breeding and agricultural fertilizer use are the main reasons for the increase of rural ecological environment pressure, not only in the north-south transition zone, but also in the Yellow River irrigation area (Zhang et al., 2012; Chen et al., 2017) and the upper and middle reaches of the Yangtze River (Yang et al., 2017). The formation of agricultural non-point source pollution is affected by many factors such as geography, climate and soil. Its migration and transformation are the process of pollutants transferring from the soil circle to other circles such as the water circle, which is an important factor leading to the deterioration of water quality (Wang et al., 2018). Therefore, it is necessary to realize the resource utilization and fertilizer utilization of livestock manure through anaerobic fermentation treatment and composting treatment, so as to reduce the harm of chemical fertilizer to farmland soil and water body (Xiong et al., 2010; Qian et al., 2018; Liu et al., 2020; Wu et al., 2021). Relying on scientific and technological means such as soil testing and formula fertilization technology, green prevention and control of pests and diseases, and precise pesticide application technology, the use of chemical fertilizers and pesticides in Anhui, located in the north-south transition zone, has been decreasing year by year since 2013, and the comprehensive utilization rate of straw and livestock manure has been steadily improved. Since the “Tenth Five-Year Plan,” Anhui has invested CNY 12.9 billion in water pollution prevention and control and river management, including agricultural non-point source pollution control and ecological construction projects in the Huaihe River Basin. During the “Eleventh Five-Year Plan” period, Anhui has increased investment in green organic agricultural products production and agricultural green production technology, and promoted the optimization and adjustment of agricultural structure. The implementation of policies such as “the implementation of the battle against agricultural non-point source pollution,” “the implementation plan for the prevention and control of agricultural non-point source pollution in Anhui Province,” and “the implementation plan for accelerating the agricultural non-point source pollution control in the Yangtze River Economic Belt in Anhui Province” has promoted the sustainable development of new agricultural modernization.
The study found that the emission of agricultural non-point source pollution in the northern and central parts of the transitional zone was significantly higher than that in the south, which may be related to topography, capital intensity of agricultural production and natural resource environment. Studies have shown that topography is the main factor causing regional differences in agriculture (Zhang et al., 2020). Agricultural production in the northern and central regions of the transition zone is concentrated, mainly in the plains, with large-scale mechanized farming conditions. Although the southern part of the hilly and mountainous areas is rich in mineral resources and tourism resources, the degree of mechanization of agricultural production is low, and the rural population is relatively small. In the past, agricultural production technology was low, environmental awareness was weak, and green agriculture policy support was insufficient, which reduced the efficiency value. In recent years, the promulgation and implementation of green agriculture support policies and the promotion of green production technology have promoted the improvement of ecological efficiency. However, with Anhui’s full accession to the Yangtze River Delta and the enhancement of regional economic agglomeration and radiation capacity, the integration and coordination of resource elements has led to the policy vitality and effectiveness. It has not been fully released, and the promotion of agricultural green ecology is not yet significant. Affected by the zero growth action of chemical fertilizers and pesticides and the policy of replacing chemical fertilizers with organic fertilizers, the redundancy rate of agricultural fertilizers and agriculture has been declining in recent years.
4.2. Temporal and spatial differences of agricultural eco-efficiency in transition zone
The ecological efficiency in the southern part of the transitional zone is different, which benefits from the better resource endowment foundation and advantageous non-agricultural industries. Southern Huangshan, Xuancheng, Wuhu, and other areas are adjacent to Jiangsu and Zhejiang. Affected by the siphon effect, the regional environmental advantages and agricultural technology foundation are solid. The southern Chizhou, Tongling, and other places are rich in mineral resources, but the environmental pollution pressure generated by the mining and processing industry is large, crowding out the input of agricultural green productive resources and reducing agricultural ecological efficiency. The advantages of agricultural water conservancy conditions along the Yangtze River and the Huaihe River in the central region are prominent, and the dominant industrial belts and high-yield crop production bases are mostly gathered here (Huang et al., 2007; Velasco-Muñoz et al., 2018), such as the high-yield rice base in the south of the Huaihe River, the high-quality rape industrial belt and the melon and vegetable producing area. Fuyang in the north relies on the effect of production scale and human capital agglomeration. The improvement of agricultural industrialization and agglomeration reduces the redundancy rate of land and labor input. However, Huaibei, Suzhou and other resource-based cities or industrial transformation cities are affected by the flow of factors brought about by the transfer of industrial center of gravity, which makes the agricultural ecological efficiency low. The average ecological efficiency in the south and central regions is slightly higher than that in the north. Previous studies have shown that the areas south of the Qinling-Huaihe River and north of the Yangtze River have higher agro-ecological efficiency (Pang et al., 2016), that is, the central region of the transition zone, which is basically consistent with the conclusions of this study.
The spatial characteristics of agricultural eco-efficiency showed marginal diffusion of “high” agglomeration areas and convergence of “low and low agglomeration areas,” which was mainly due to the inter-provincial marginal agricultural technology elements, talent flow and agricultural machinery flow to promote the opening degree of the edge. Studies have shown that the high degree of integration in Jiangsu, Anhui and Henan provinces (Cao et al., 2023) is conducive to exerting the intermediary effect of information and factor exchange (Li et al., 2019), and has more advantages in clean non-agricultural industry or large-scale agricultural production, high resource utilization rate, and has a certain positive promotion effect on the surrounding areas, making the “high” agglomeration area present a marginal diffusion trend. The agricultural homogeneity of “low and low” agglomeration areas is strong, and the agricultural production conditions are similar. The diffusion effect of agricultural production in the surrounding eastern regions such as Fuyang and Anqing has gradually become prominent, benefiting the central and northern regions, forming a “trickle-down effect” (Ge et al., 2021), which has gradually improved the agricultural ecological efficiency in the central and northern regions.
The analysis of agro-ecological efficiency in the south-north transition zone in this study was only based on the situation of Anhui province, and the study region has limitations, so more regional verification should be added in future studies. At the same time, due to the availability of data, factors such as agricultural film and agricultural technology research and development funds were not considered in agricultural input. In the future, statistical survey and interview survey can be used to improve the research.
5. Conclusion
Taking Anhui Province as an example, this paper analyzes the current situation of agricultural non-point source pollution in the north-south transition zone, calculates the agricultural eco-efficiency based on the super-DEA-SBM model of undesired output, and analyzes its evolution trend and spatial characteristics. The results show that:
1. Agricultural non-point source pollution mainly comes from livestock breeding and chemical fertilizer use. The variation trends of COD, TN and TP are similar, and the regional differences are significant. The non-point source pollution in the northern cities is significantly higher than that in the central and southern cities, but the change rule is not obvious.
2. Agricultural eco-efficiency showed an “inverted N” trend, with low land use and surplus agricultural workers. However, due to the non-point source pollution prevention and control plan of Anhui Province, the redundancy rate of fertilizer and pesticide use decreased, and the surplus phenomenon improved to a certain extent. Due to the differences in resource endowment and industrial structure, the agricultural ecological efficiency in the south and central regions was higher than that in the north.
3. There is a regional positive correlation between agricultural eco-efficiency, and the change shows the characteristics of “dispersion-agglomeration-dispersion,” which is mainly concentrated in the “high-high” agglomeration area and the “low-low” agglomeration area, and the interaction within the region is obvious. However, the heterogeneity within the region is enhanced, with the largest difference in the south, followed by the north, the smallest in the middle, and the smaller difference between the south, the north and the north.
Considering the constraints of resources and environment and the development requirements of green agriculture, the ecological agriculture in the transition zone should give full play to its special location advantages, take the characteristic green agriculture as the guide, integrate the advantageous resources in the north and south, take the agricultural ecosystem as the core, rely on agricultural ecological technology and policy support, strengthen the flow of resources and production technology exchanges inside and outside the transition zone, coordinate the economic development goals and ecological construction requirements, and promote the development of green agriculture in the north-south transition zone.
5.1. Limitations and future research directions
There is a significant spatial correlation in China’s inter-provincial agricultural eco-efficiency, but the local spatial autocorrelation analysis found that there are still 2/3 provinces in the non-significant area. Therefore, we should strengthen the linkage and cooperation of regional agricultural development, form a new pattern of agricultural industry with complementary advantages and division of labor, and promote the high-quality development of agriculture. Specifically, we can build a sharing platform from the fields of agricultural science and technology innovation, rural eco-tourism, agricultural finance and insurance, agricultural brand incubation, agricultural expo promotion, etc., to achieve cooperation and mutual benefit and create a win-win situation. Secondly, due to the spatial spillover effect of agricultural pollution, the failure of pollution control in a single region objectively requires cross-regional linkage and cooperative governance. Therefore, a joint governance mechanism of information sharing, emergency linkage, collaborative governance and responsibility sharing should be constructed.
Data availability statement
The original contributions presented in the study are included in the article/supplementary material, further inquiries can be directed to the corresponding author.
Author contributions
HD: Methodology, Software, Formal analysis, Writing original draft preparation, Writing-review and editing. JH: Methodology, Software, Formal analysis, Writing-review and editing, Supervision, Project administration. YZ: Resources, Data curation. ZS: Resources, Data curation. TC: Investigation. XH: Investigation. YL: Writing original draft preparation. All authors have read and agreed to the published version of the manuscript.
Funding
This research was funded by Research project of Land Engineering Construction Group (DJNY-YB-2023-37), Construction of Shaanxi soil mass quality detection and evaluation sharing platform (2021PT-053), Shaanxi Province key research and development plan project (2022ZDLNY02-10, 2023-ZDLNY-48).
Conflict of interest
HD, JH, YZ, TC, ZS, and XH were employed by Shaanxi Provincial Land Engineering Construction Group Co., Ltd.
The remaining author declares that the research was conducted in the absence of any commercial or financial relationships that could be construed as a potential conflict of interest.
Publisher’s note
All claims expressed in this article are solely those of the authors and do not necessarily represent those of their affiliated organizations, or those of the publisher, the editors and the reviewers. Any product that may be evaluated in this article, or claim that may be made by its manufacturer, is not guaranteed or endorsed by the publisher.
References
Abdella, G. M., Kucukvar, M., Ismail, R., Abdelsalam, A. G., Onat, N. C., and Dawoud, O. (2021). A mixed model-based Johnson’s relative weights for eco-efficiency assessment: the case for global food consumption. Environ. Impact Assess. Rev. 89:106588. doi: 10.1016/j.eiar.2021.106588
Bojnec, Š., and Latruffe, L. (2013). Farm size, agricultural subsidies and farm performance in Slovenia. Land Use Policy 32, 207–217. doi: 10.1016/j.landusepol.2012.09.016
Bu, H., Tan, X., Li, S., and Zhang, Q. (2010). Temporal and spatial variations of water quality in the Jinshui River of the south Qinling Mts, China. Ecotoxicol. Environ. Saf. 73, 907–913. doi: 10.1016/j.ecoenv.2009.11.007
Cao, Y., Hua, Z., Chen, T., Li, X., Li, H., and Tao, D. (2023). Understanding population movement and the evolution of urban spatial patterns: an empirical study on social network fusion data. Land Use Policy 125:106454. doi: 10.1016/j.landusepol.2022.106454
Chen, C., Zhao, T., Liu, R., and Luo, L. (2017). Performance of five plant species in removal of nitrogen and phosphorus from an experimental phytoremediation system in the Ningxia irrigation area. Environ. Monit. Assess. 189:497. doi: 10.1007/s10661-017-6213-y
Coluccia, B., Valente, D., Fusco, G., De Leo, F., and Porrini, D. (2020). Assessing agricultural eco-efficiency in Italian regions. Ecol. Indic. 116:106483. doi: 10.1016/j.ecolind.2020.106483
Cui, Y., Khan, S. U., Deng, Y., Zhao, M., and Hou, M. (2021). Environmental improvement value of agricultural carbon reduction and its spatiotemporal dynamic evolution: evidence from China. Sci. Total Environ. 754:142170. doi: 10.1016/j.scitotenv.2020.142170
Du, J., Liang, L., and Zhu, J. (2010). A slacks-based measure of super-efficiency in data envelopment analysis: a comment. Eur. J. Oper. Res. 204, 694–697. doi: 10.1016/j.ejor.2009.12.007
Ge, K., Zou, S., Ke, S., and Chen, D. (2021). Does urban agglomeration promote urban land green use efficiency? Take the Yangtze River economic zone of China as an example. Sustainability 13:10527. doi: 10.3390/su131910527
Grzelak, A., Guth, M., Matuszczak, A., Czyżewski, B., and Brelik, A. (2019). Approaching the environmental sustainable value in agriculture: how factor endowments foster the eco-efficiency. J. Clean. Prod. 241:118304. doi: 10.1016/j.jclepro.2019.118304
Huang, D., Wang, K., and Wu, W. (2007). Problems and strategies for sustainable development of farming and animal husbandry in the agro-pastoral transition zone in northern China (APTZNC). Int. J. Sustain. Dev. World Ecol. 14, 391–399. doi: 10.1080/13504500709469739
Li, G., Li, G., and Zhou, M. (2019). Model and application of renewable energy accommodation capacity calculation considering utilization level of inter-provincial tie-line. Prot. Control Modern Power Syst. 4:1. doi: 10.1186/s41601-019-0115-7
Liu, F., Sim, J., Sun, H., Edziah, B. K., Adom, P. K., and Song, S. (2023). Assessing the role of economic globalization on energy efficiency: evidence from a global perspective. China Econ. Rev. 77:101897. doi: 10.1016/j.chieco.2022.101897
Liu, W.-R., Zeng, D., She, L., Su, W.-X., He, D.-C., Wu, G.-Y., et al. (2020). Comparisons of pollution characteristics, emission situations, and mass loads for heavy metals in the manures of different livestock and poultry in China. Sci. Total Environ. 734:139023. doi: 10.1016/j.scitotenv.2020.139023
Mwalupaso, G. E., Korotoumou, M., Eshetie, A. M., Essiagnon Alavo, J.-P., and Tian, X. (2019). Recuperating dynamism in agriculture through adoption of sustainable agricultural technology - implications for cleaner production. J. Clean. Prod. 232, 639–647. doi: 10.1016/j.jclepro.2019.05.366
Pang, J., Chen, X., Zhang, Z., and Li, H. (2016). Measuring eco-efficiency of agriculture in China. Sustainability 8:398. doi: 10.3390/su8040398
Peng, X. (2020). Strategic interaction of environmental regulation and green productivity growth in China: green innovation or pollution refuge? Sci. Total Environ. 732:139200. doi: 10.1016/j.scitotenv.2020.139200
Qian, L., Lu, H., Gao, Q., and Lu, H. (2022). Household-owned farm machinery vs. outsourced machinery services: the impact of agricultural mechanization on the land leasing behavior of relatively large-scale farmers in China. Land Use Policy 115:106008. doi: 10.1016/j.landusepol.2022.106008
Qian, Y., Song, K., Hu, T., and Ying, T. (2018). Environmental status of livestock and poultry sectors in China under current transformation stage. Sci. Total Environ. 622–623, 702–709. doi: 10.1016/j.scitotenv.2017.12.045
Sá, J. C., De, M., Lal, R., Cerri, C. C., Lorenz, K., Hungria, M., et al. (2017). Low-carbon agriculture in South America to mitigate global climate change and advance food security. Environ. Int. 98, 102–112. doi: 10.1016/j.envint.2016.10.020
Sun, H., Edziah, B. K., Sun, C., and Kporsu, A. K. (2022). Institutional quality and its spatial spillover effects on energy efficiency. Socio Econ. Plan. Sci. 83:101023. doi: 10.1016/j.seps.2021.101023
Velasco-Muñoz, J. F., Aznar-Sánchez, J. A., Belmonte-Ureña, L. J., and Román-Sánchez, I. M. (2018). Sustainable water use in agriculture: a review of worldwide research. Sustainability 10:1084. doi: 10.3390/su10041084
Wang, Y., Duan, X., Wang, L., and Zou, H. (2022). Spatial temporal patterns and driving factors of industrial pollution and structures in the Yangtze River Economic Belt. Chemosphere 303:134996. doi: 10.1016/j.chemosphere.2022.134996
Wang, D., Li, P., He, X., and He, S. (2023). Exploring the response of shallow groundwater to precipitation in the northern piedmont of the Qinling Mountains, China. Urban Clim. 47:101379. doi: 10.1016/j.uclim.2022.101379
Wang, H., Xu, J., Liu, X., Sheng, L., Zhang, D., Li, L., et al. (2018). Study on the pollution status and control measures for the livestock and poultry breeding industry in northeastern China. Environ. Sci. Pollut. Res. 25, 4435–4445. doi: 10.1007/s11356-017-0751-2
Wu, R.-T., Cai, Y.-F., Chen, Y.-X., Yang, Y.-W., Xing, S.-C., and Liao, X.-D. (2021). Occurrence of microplastic in livestock and poultry manure in South China. Environ. Pollut. 277:116790. doi: 10.1016/j.envpol.2021.116790
Xiong, X., Yanxia, L., Wei, L., Chunye, L., Wei, H., and Ming, Y. (2010). Copper content in animal manures and potential risk of soil copper pollution with animal manure use in agriculture. Resour. Conserv. Recycl. 54, 985–990. doi: 10.1016/j.resconrec.2010.02.005
Xue, L., Hou, P., Zhang, Z., Shen, M., Liu, F., and Yang, L. (2020). Application of systematic strategy for agricultural non-point source pollution control in Yangtze River basin, China. Agric. Ecosyst. Environ. 304:107148. doi: 10.1016/j.agee.2020.107148
Yandun Narváez, F., Gregorio, E., Escolà, A., Rosell-Polo, J. R., Torres-Torriti, M., and Auat Cheein, F. (2018). Terrain classification using ToF sensors for the enhancement of agricultural machinery traversability. J. Terrramech. 76, 1–13. doi: 10.1016/j.jterra.2017.10.005
Yang, S., Wang, Y., Liu, R., Zhang, A., and Yang, Z. (2017). Effect of nitrate leaching caused by swine manure application in fields of the Yellow River irrigation zone of Ningxia, China. Sci. Rep. 7:13693. doi: 10.1038/s41598-017-12953-9
Zhang, J., Liu, L., Zhao, Y., Li, H., Lian, Y., Zhang, Z., et al. (2020). Development of a high-resolution emission inventory of agricultural machinery with a novel methodology: a case study for Yangtze River Delta region. Environ. Pollut. 266:115075. doi: 10.1016/j.envpol.2020.115075
Zhang, Y., Wang, L., Tang, Z., Zhang, K., and Wang, T. (2022). Spatial effects of urban expansion on air pollution and eco-efficiency: evidence from multisource remote sensing and statistical data in China. J. Clean. Prod. 367:132973. doi: 10.1016/j.jclepro.2022.132973
Zhang, Q., Yang, Z., Zhang, H., and Yi, J. (2012). Recovery efficiency and loss of 15N-labelled urea in a rice–soil system in the upper reaches of the Yellow River basin. Agric. Ecosyst. Environ. 158, 118–126. doi: 10.1016/j.agee.2012.06.003
Zhao, Y., Feng, Q., and Lu, A. (2021). Spatiotemporal variation in vegetation coverage and its driving factors in the Guanzhong Basin, NW China. Ecol. Inform. 64:101371. doi: 10.1016/j.ecoinf.2021.101371
Keywords: rural non-point source pollution, agricultural ecological efficiency, space–time evolution characteristics, China, north-south transition zone
Citation: Dong H, Han J, Zhang Y, Chen T, Sun Z, Hou X and Liu Y (2023) Measurement and temporal and spatial characteristics of agricultural eco-efficiency under climate change: a case study of Anhui, China. Front. Sustain. Food Syst. 7:1255235. doi: 10.3389/fsufs.2023.1255235
Edited by:
Yongsheng Wang, Chinese Academy of Sciences (CAS), ChinaCopyright © 2023 Dong, Han, Zhang, Chen, Sun, Hou and Liu. This is an open-access article distributed under the terms of the Creative Commons Attribution License (CC BY). The use, distribution or reproduction in other forums is permitted, provided the original author(s) and the copyright owner(s) are credited and that the original publication in this journal is cited, in accordance with accepted academic practice. No use, distribution or reproduction is permitted which does not comply with these terms.
*Correspondence: Jichang Han, aGFuamNfc3hkakAxMjYuY29t