- 1College of Geography Science, Hebei Normal University, Shijiazhuang, China
- 2Hebei Laboratory of Environmental Evolution and Ecological Construction, Shijiazhuang, China
- 3Engineering Technology Research Center, Geographic Information Development and Application of Hebei, Institute of Geographical Sciences, Hebei Academy of Sciences, Shijiazhuang, China
- 4Key Laboratory of Land Surface Pattern and Simulation, Institute of Geographic Sciences and Natural Resources Research, CAS, Beijing, China
- 5College of Resources and Environment, University of Chinese Academy of Sciences, Beijing, China
Understanding how climate change has been affecting crop yield is a prerequisite to inform adaptation decisions and to ensure global food security. The Northeast China (NEC), located in high-latitude area, is significantly affected by climate change. There is a high demand for quantitative information on impacts of climate variability on crop yields in NEC. In this study, we applied panel regression models to explore the yield-climate relationship and its spatial variations based on experimentally observed yield (Ys) and the county-scale statistical yield (Yc) of three typical crops (e.g., maize, rice and soybean) across NEC from 1981 to 2010, as well as contemporary climate data. The results indicated that Ys (Yc) of maize, rice and soybean during the past three decades increased by 64.2% (82.0%), 47.5% (55.3%), and 59.2% (58.0%), respectively. Moreover, we found climate during crop growth period had changed significantly and the change had caused measurable impacts on crop yields. Changes in temperature, precipitation and solar radiation jointly decreased Ys (Yc) of maize and soybean by 1.3% (0.7%) and 0.3% (1.1%), respectively, however increased Ys (Yc) of rice by 1.2% (2.2%), with a large spatial difference. Therefore, the impact of climate change on yields of three crops was far less than the actual increase in crop yields. Our finding suggest that other factors, mainly improved management practices, may be the main reason for the significant increase in crop yields in NEC over the past few decades. Although historical climate change also played an important role in the yields of three crops, certain improvement in management measures not only compensated for the negative impact of climate change, but also greatly promoted the increase in crop yields. Therefore, in proposing strategies for crop production to cope with climate change, we need in-depth assessments of the role of improved management.
1 Introduction
Over the past decades, the climate has warmed quite rapidly on the planet we live on (Ren et al., 2012; IPCC, 2021). From 1900 to 2019, the mean surface temperature of the global, the Northern Hemisphere and the Southern hemisphere has a warming trend of (0.09 ± 0.01) °C, (0.09 ± 0.01) °C and (0.08 ± 0.01) °C per 10 years, respectively (Chao et al., 2023). In China, the observed data show that the nation-wide mean surface temperature has markedly increased during 1900–2018 and the change ranged between 1.3 and 1.7°C (Chao et al., 2023). Along with climate warming, it is expected to further increase climatic variability, and the frequency and severity of extreme weather events in the world (Lobell and Gourdji, 2012; Bai et al., 2021; Li et al., 2021; Zhang et al., 2021; Xiao et al., 2022). Agriculture, an essential element of current human existence, is a key focus as it is directly related to the climatic environment (Asseng et al., 2015; Zhao et al., 2017; Zampieri et al., 2019; Wang B. et al., 2020; Wang X. et al., 2020). As the world’s population continues to increase, improving agricultural productivity efficiency and maintaining high and stable grain yield is an important basis for ensuring food security and sustainable agricultural development (Lobell et al., 2008; Xiong et al., 2014). Thus, the ability to maintain the rate of crop yield increase in the face of climate change is of increasing concern (Lobell et al., 2008; Xiao and Tao, 2014; Tao et al., 2016; Rizzo et al., 2022). Based on a global dataset of field warming experiments for wheat, maize, rice and soybean, relate study noted that warmer temperature would reduce yields for wheat (−2.9 ± 2.3% K−1), maize (−7.1 ± 2.8% K−1), rice (−5.6 ± 2.0% K−1), and soybean (−10.6 ± 5.8% K−1), respectively (Wang B. et al., 2020; Wang X. et al., 2020). Indeed, explaining and quantifying the climatic drivers of crop yields is critical for prioritizing mitigation and adaptation strategies to climate change (Lobell and Field, 2007; Ortiz-Bobea et al., 2019). However, due to the complexity and uncertainty of the effects of climate change on crop growth (Wang B. et al., 2020; Wang X. et al., 2020), it is still elusive to unpack the contribution of different climate variables to crop production in special observational environment (Xie et al., 2009; Liu et al., 2010; Tao et al., 2017). Therefore, detailed regional analyses are required to explore possible mechanisms for the spatial differences in impacts of climate change on crop yield (Rizzo et al., 2022).
The Northeast China (NEC) is one of the most productive crop growing area in China, mainly growing staple crops including maize, rice and soybean (Xiao et al., 2021). Due to the high latitude and frequently occurred extreme events (e.g., chilling injury, drought, rainstorm, frost, gale) (Zhang et al., 2021), NEC is highly vulnerable to climate change and has become one of the areas with the highest yield fluctuations in China (Jiang et al., 2021; Li et al., 2021). Moreover, the NEC has experienced pronounced climate change over the past decades (Liu et al., 2012; Zhou et al., 2021). Related studies found that NEC experienced faster warming than the lower latitudes of China, along with pronounced precipitation changes (Wang et al., 2014). On the other hand, with the significantly climate warming, the potential growing season of crops has lengthened (Liu et al., 2018), and the risk of low-temperature freezes and frost injury has decreased in the NEC (Chen et al., 2012; Li et al., 2021). Therefore, to some extent, climate change over the past few decades had an important impact on crop growth process and final yield in the NEC.
Generally, the growth and development of crops is constrained or facilitated by many factors, mainly including environmental conditions such as climate and soil, and field management practices such as irrigation, fertilizers, and cultivar improvement (Challinor et al., 2014; Liu et al., 2016). Although climate risk has been recognized as the major source of crop yield volatility and uncertainty (Lobell et al., 2011), the degree and extent of climate impacts on yield of staple crops (e.g., maize, rice and soybean) in the NEC under contrasting environments and climate conditions are still imperfectly understood (Chen et al., 2011; Wang et al., 2014). Moreover, the quantitative information on climate-induce changes in yields of different crops in the NEC is scarce (Chen et al., 2011), and their spatial variations remain uncertain (Liu et al., 2018; Xiao et al., 2021). To some extent, an in-depth understanding of how this historical climate change have influenced crop yield in the NEC is critical to decisions on climate change mitigation and to China’s food production (Wang et al., 2014; Zhao et al., 2015). Therefore, it is urgent need to better quantify the impact of climate variability and change on crop productivity in the NEC (Xiao et al., 2021).
Assessing and predicting the effects of climate change on crop yields requires some numerical and/or conceptual models to reveal how crop yields respond to climate change (Bai et al 2015; Corbeels et al., 2018; Tao et al., 2019). So far, a variety of approaches, including statistical analyses and crop models, have been used to explore the influence of climate change on crop production (Lobell and Burke, 2010; Tao et al., 2014; Xiao and Tao, 2016; Tao et al., 2017; Rötter et al., 2018). Currently, process-based crop mechanism models (generally referred to as crop models) are widely used methods for simulating and evaluating the effects of climate change on crop growth, development and yield formation (Wilcox and Makowski, 2014; Muller and Martre, 2019; Xiao et al., 2019). Overall, crop models were typically developed and tested using experimental trials and thus offer the distinct advantage of leveraging decades of research on crop physiology, agronomy, and soil science, among other disciplines (Rötter et al., 2011). Yet these models also require extensive input data on cultivar., management, and soil conditions that are unavailable in many parts of the world (White et al., 2011; Ewert et al., 2015). More significantly, even in the presence of such data, crop models can be very difficult to calibrate because of a large numbers of uncertain parameters (Asseng et al., 2013; Bassu et al., 2014). Consequently, more empirical evidence is still needed to reduce the uncertainties in diagnosing and predicting the response of crop yield to climate change (Ortiz-Bobea et al., 2019). A common approach is to use statistical models trained on historical yields and some simplified measurements of weather, such as growing season average temperature and radiation, and accumulated precipitation (Tao et al., 2014; Gammans et al., 2017). Statistical models, in which historical data about crop yields and weather/climate are used to calibrate relatively simple regression equations, provide a common alternative to process-based models (Lobell and Burke, 2010; Tao et al., 2017). Generally, agronomic field experiments, conducted at particular points in time and space, are a very valuable information source (Xiao and Tao, 2014). The main advantages of statistical models are their limited reliance on field calibration data, and their transparent assessment of model uncertainties (Lobell et al., 2011).
Overall, identifying the particular crop and region that have been most affected by recent climate trends would assist to measure and analyze ongoing efforts to adapt. For the NEC, a better understanding of the impact of climate change on crop yields is essential to planning appropriate and timely responses. In this study, we link historical climate information with a long-term (1981–2010) of site (Ys) and county-level yields (Yc) for three staple crops (i.e., maize, rice and soybean) in the NEC to unpack their historical drivers based on a statistical regression model. We aim to answer the questions as (1) how crop yield and climate during crop growth period in NEC has changed? and (2) what extent the climate change has affected crop growth and yield during the period of 1981–2010 in a setting in which farmer make decisions based on the weather they observe every day?
2 Materials and methods
2.1 Study area
The NEC is located in northernmost China (115°30′–135°10′E, 38°43′–53°35′N), which includes Heilongjiang, Jilin and Liaoning Province (Figure 1), with 2.78 × 10⁷ ha of farmland. The region has a temperate monsoon climate, and it has a cool summer (mean June–August temperature 20°C) and longer winter (about 5 months), which results in a short thermal growing season (May–September) that only allow single cropping system (Wang et al., 2014). Overall, the NEC is abundant in natural resources, with ample solar radiation (Zhao et al., 2015), yet temperature and precipitation are the main limitations for crop growth and production, with an annual accumulated temperature above zero of 2,500–4,000°C day and an annual precipitation of 400–1,000 mm (Chen et al., 2011). The soil across the NEC mainly contains Phaeozem and Chernozem, and it is one of the most fertile soil regions in the world (Zhang et al., 2019). With the excellent geographical environment and favorable natural resources, the NEC is quite suitable for staple crops (e.g., maize, rice, and soybean) growing from May to September (Xiao et al., 2021), and the planting areas of maize, rice and soybean in 2015 were 1.42 × 10⁷ (51.1%), 5.82 × 10⁶ (20.9%) and 3.75 × 10⁶ ha (13.5%), respectively (Yan et al., 2020).
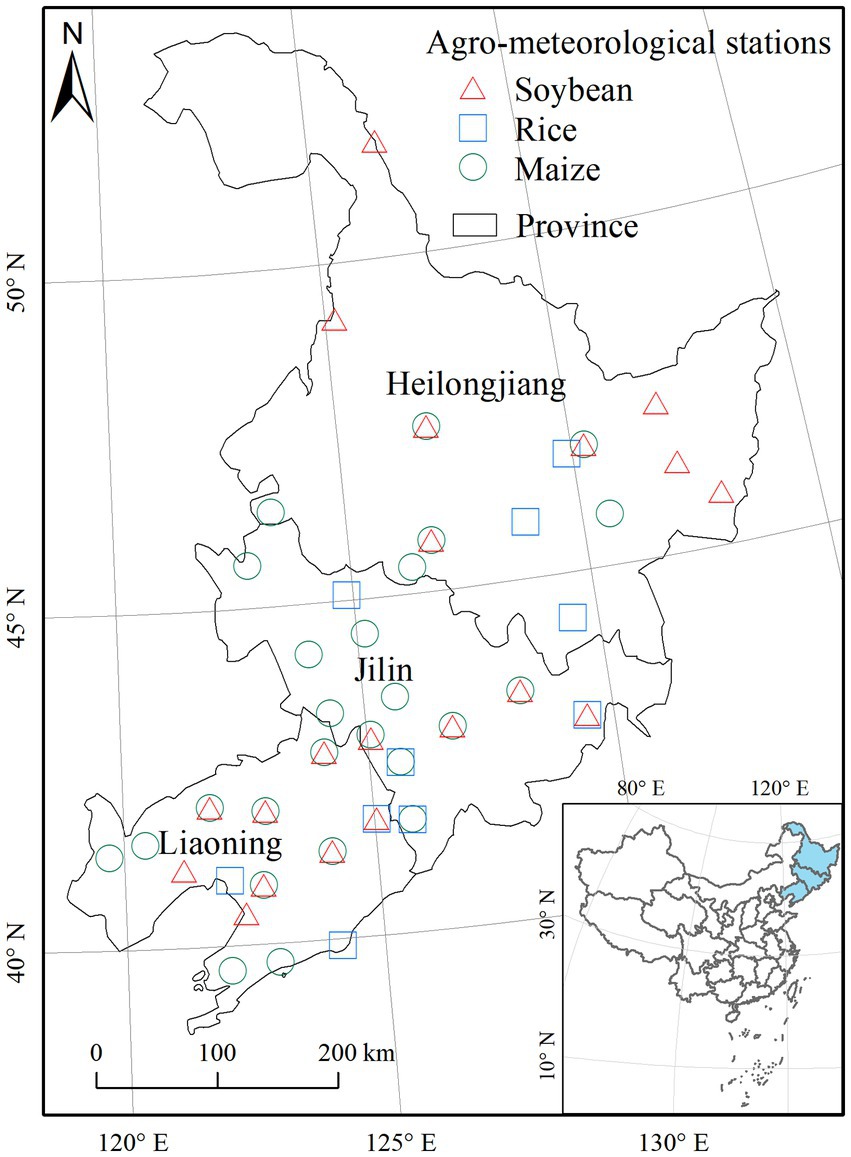
Figure 1. The locations of the agro-meteorological stations (main map) and the geographical location of the study region (bottom right inset).
2.2 Crop and climate data
The long-term experimental data for three crops (i.e., maize, rice and soybean) from 1981 to 2010 were, respectively, obtained field experiments from 25, 10, and 20 agro-meteorological stations (AgMSs) across the NEC (Figure 1, Supplementary Table S1), which are managed by the China Meteorological Administration (CMA). Since some AgMSs have the data for two crops, there were a total 40 AgMSs selected in this study (Figure 1). The purpose of these local AgMSs is to investigate local crop production and agrometeorological disasters and to provide advice for local farmers on how to cope with agrometeorological hazards (Tao et al., 2017). Overall, these field stations were distributed evenly in the main crop areas of the NEC and covered different climatic and geographic condition. Field data (e.g., cultivar type, phenological date, aboveground dry matter (biomass) and grain yield) at each AgMS were recorded, as well as the corresponding information about agronomic management (e.g., tillage practices, irrigation, fertilization and weed and pest control) (Xiao and Tao, 2014). The phenological stages of the three crops investigated in this study include sowing date (SD), emergence date (ED), flowering date (FD) and maturity date (MD) (Supplementary Table S2). Moreover, We divided the whole growth period of crops (WGP) from ED to MD into two phases, the vegetative growth period (VGP) from ED to FD and the reproductive growth period (RGP) from FD to MD. In order to explore the response of crop yield to climate change at different scales, we selected two kinds of yield data in this study, namely, the experimentally observed yield in each AgMS (Ys) and the statistical average yield (Yc) of the county where the meteorological stations are located (Supplementary Table S2). The crop yield data of county statistics were also registered in the crop growth and yield records of corresponding experimental stations. Overall, crop management practices at the AgMSs were better or similar to local farming practices (Tao et al., 2014). Cultivar choice, dates of sowing and harvesting, and application of fertilizer and irrigation water were in accordance with farmer practice in the region. Irrigation and fertilizer was applied several times every year, and pesticides were used to control pests and diseases. During the study period, due to interannual climate variability and agronomic management, sowing dates were adjusted. Moreover, the cultivars were shifted every 3–5 years as a result of breeding progress (Tao et al., 2017).
In addition, the climate data at each AgMS for the study period, including daily mean temperatures (Tmean), sunshine hours and precipitation, also obtained from the CMA. Daily solar radiation (Rad) was calculated from sunshine duration observations in the AgMS using the Angstrom-Prescott (A-P) equation (Prescott, 1940; Xiao and Tao, 2016). Considering the small area of the counties in the study and the consistent climatic conditions of each county region, we used the climatic data of the corresponding AgMSs when analyzing the relationship between the statistical yield data of the counties and different climatic factors.
2.3 Methods
The mean dates of sowing, emergence, flowering and maturity during the period of 1981–2010 for three crops (i.e., maize, rice, and soybean) were calculated for each AgMS. Generally, temperature, solar radiation and precipitation are the most important climate factors affecting crop growth and development. The average of the field-observed Tmean, Rad and accumulated precipitation (Prec) for the three growth phases (i.e., WGP, VGP, and RGP) were calculated based on the observed ED, FD, and MD at each AMS. By using regression analysis, the trends in the phenological stages (e.g., SD, ED, FD, and MD) and the duration of the growth periods (e.g., VGP, RGP, and WGP), the two yields (i.e., Ys and Yc) of three crops, and climate factors (i.e., Tmean, Prec, and Rad) were calculated for each AgMS for the period 1981–2010. The time-variant trends of above variables were determined by using the univariate linear regression model (Equation 1) as:
Where Yt is the observed phenological date/duration, yields and climate factors in the year t; k is the linear regression slope; b is the slope intercept; and Xt is year t (t = 1, 2, 3, … 30). The Durbin-Watson statistic was conducted to test the null hypothesis that the residuals from an ordinary least-squares regression are not auto-correlated. The statistical significance was determined with two-tailed t-test.
To investigate the impacts of climate change on crop yields in the NEC, the correlations between crop yields and climatic factors which affect crop growth and development were analyzed. Because the improvements of management and technology have contributed to crop yield increasing, it is difficult to explore the response of crop yield to changes in climate factors directly from the raw data (Tao et al., 2014). In this study, crop yield and climatic factors were detrended by the first-order difference method which was widely used in detrending studies (Nicholls, 1997). Firstly, the difference between the observations of the following year and the observation of the current year (the first-order difference value, Δ) was calculated. Then, bivariate correlation analysis was performed to determine the relationships between the detrended crop yields (e.g., ΔYs and ΔYc) and detrended climatic factors (e.g., ΔTmean, ΔPrec, and ΔRad) (Tao et al., 2017). The statistical significance was determined with two-tailed t-test.
In order to avoid the confounding effects of highly correlated climate variables, seven panel regression models with different predictors were established to quantify the crop responses to three climate variables (e.g., Tmean, Prec, and Rad) for each crop and each growth period (Tao et al., 2014).
Where ΔY, ΔT, ΔP, and ΔR are the first-order difference values for crop yields (i.e., ΔYs or ΔYc), Tmean, Prec, and Rad, respectively, at station i in year t. βi,0 is an intercept for each station i. β1-3 are model parameters to be fit, εi,t is an error term. In detail, the parameter β1 in four panel regress model (Equations 2–5) is estimates of crop yields sensitivity to Tmean. Likewise, the parameter β2 in four panel regress model (Equations 3, 5–7) is estimates of crop yields sensitivity to Prec. The parameter β3 in four panel regress model (Equations 4, 5, 7, 8) is estimates of crop yields sensitivity to Rad.
Therefore, the sensitivity of yield changes of three crops to Tmean, Prec, and Rad changes during a growth period, i.e., above parameter β1, β2, and β3, respectively, was estimated using multiple regression method based on the trial data on yield and climate from 1981 to 2010 in the stations across the NEC. The sensitivity was future expressed in percentage of actual mean yield across the stations during the study period as βi/Ymean×100%, where βi is β1, β2, and β3, respectively. Ymean is the actual mean yield for Ys or Yc in the stations across the NCE during 1981–2010.
For each crop and each growth period, the contribution of change in a climate variable (i.e., Tmean, Prec and Rad) on crop yields during 1981–2010 was estimated by multiplying the sensitivity of yield change to the climate variables with the magnitude of change in the climate variables across the stations in the NEC during the study period. Furthermore, for each crop and each growth period, the joint impact of climate change on crop yield during 1981–2010 was calculated by summing the impacts of changes in Tmean, Prec and Rad on crop yield.
3 Results
3.1 Climate trends in different crop growth period in NEC during 1981–2010
The stations located in various geographical and climate zones, showed diverse climatic trends in different growth periods of maize (Figure 2), rice (Supplementary Figure S1) and soybean (Supplementary Figure S2) during the investigated period of 1981–2010. For the three crops, the Tmean during the three growth periods showed insignificantly increasing trends at the most stations (Figures 2a1–c1, Supplementary Figures S1a1–c1, S2a1,c1), except that during RGP of maize (Figure 2b1). However, the Prec in the growth periods of crops decreased at most stations during 1981–2010 (Figures 2a2–c2, Supplementary Figures S1a2–c2, S2b2,c2), except that during the VGP of soybean (Supplementary Figure S2a2). The changes in Rad during the different growth periods of three crops showed a large spatial heterogeneity (Figures 2a3–c3, Supplementary Figures S1a3–c3, S2a3–c3). Overall, across all the investigated stations, warming trends were observed over three growth periods (i.e., VGP, RGP and WGP) of three crops (i.e., maize, rice and soybean) during the 1981–2010, except for the RGP of maize (Figure 3A). On the contrary, the Prec during the growth periods of maize, rice and soybean mainly showed decreasing trends during the 1981–2010, except for the VGP of soybean (Figure 3B). The Rad during the VGP of maize and soybean increased, while that during the RGP of three crops and WGP of rice and soybean showed decreasing trends during the 1981–2010 (Figure 3C).
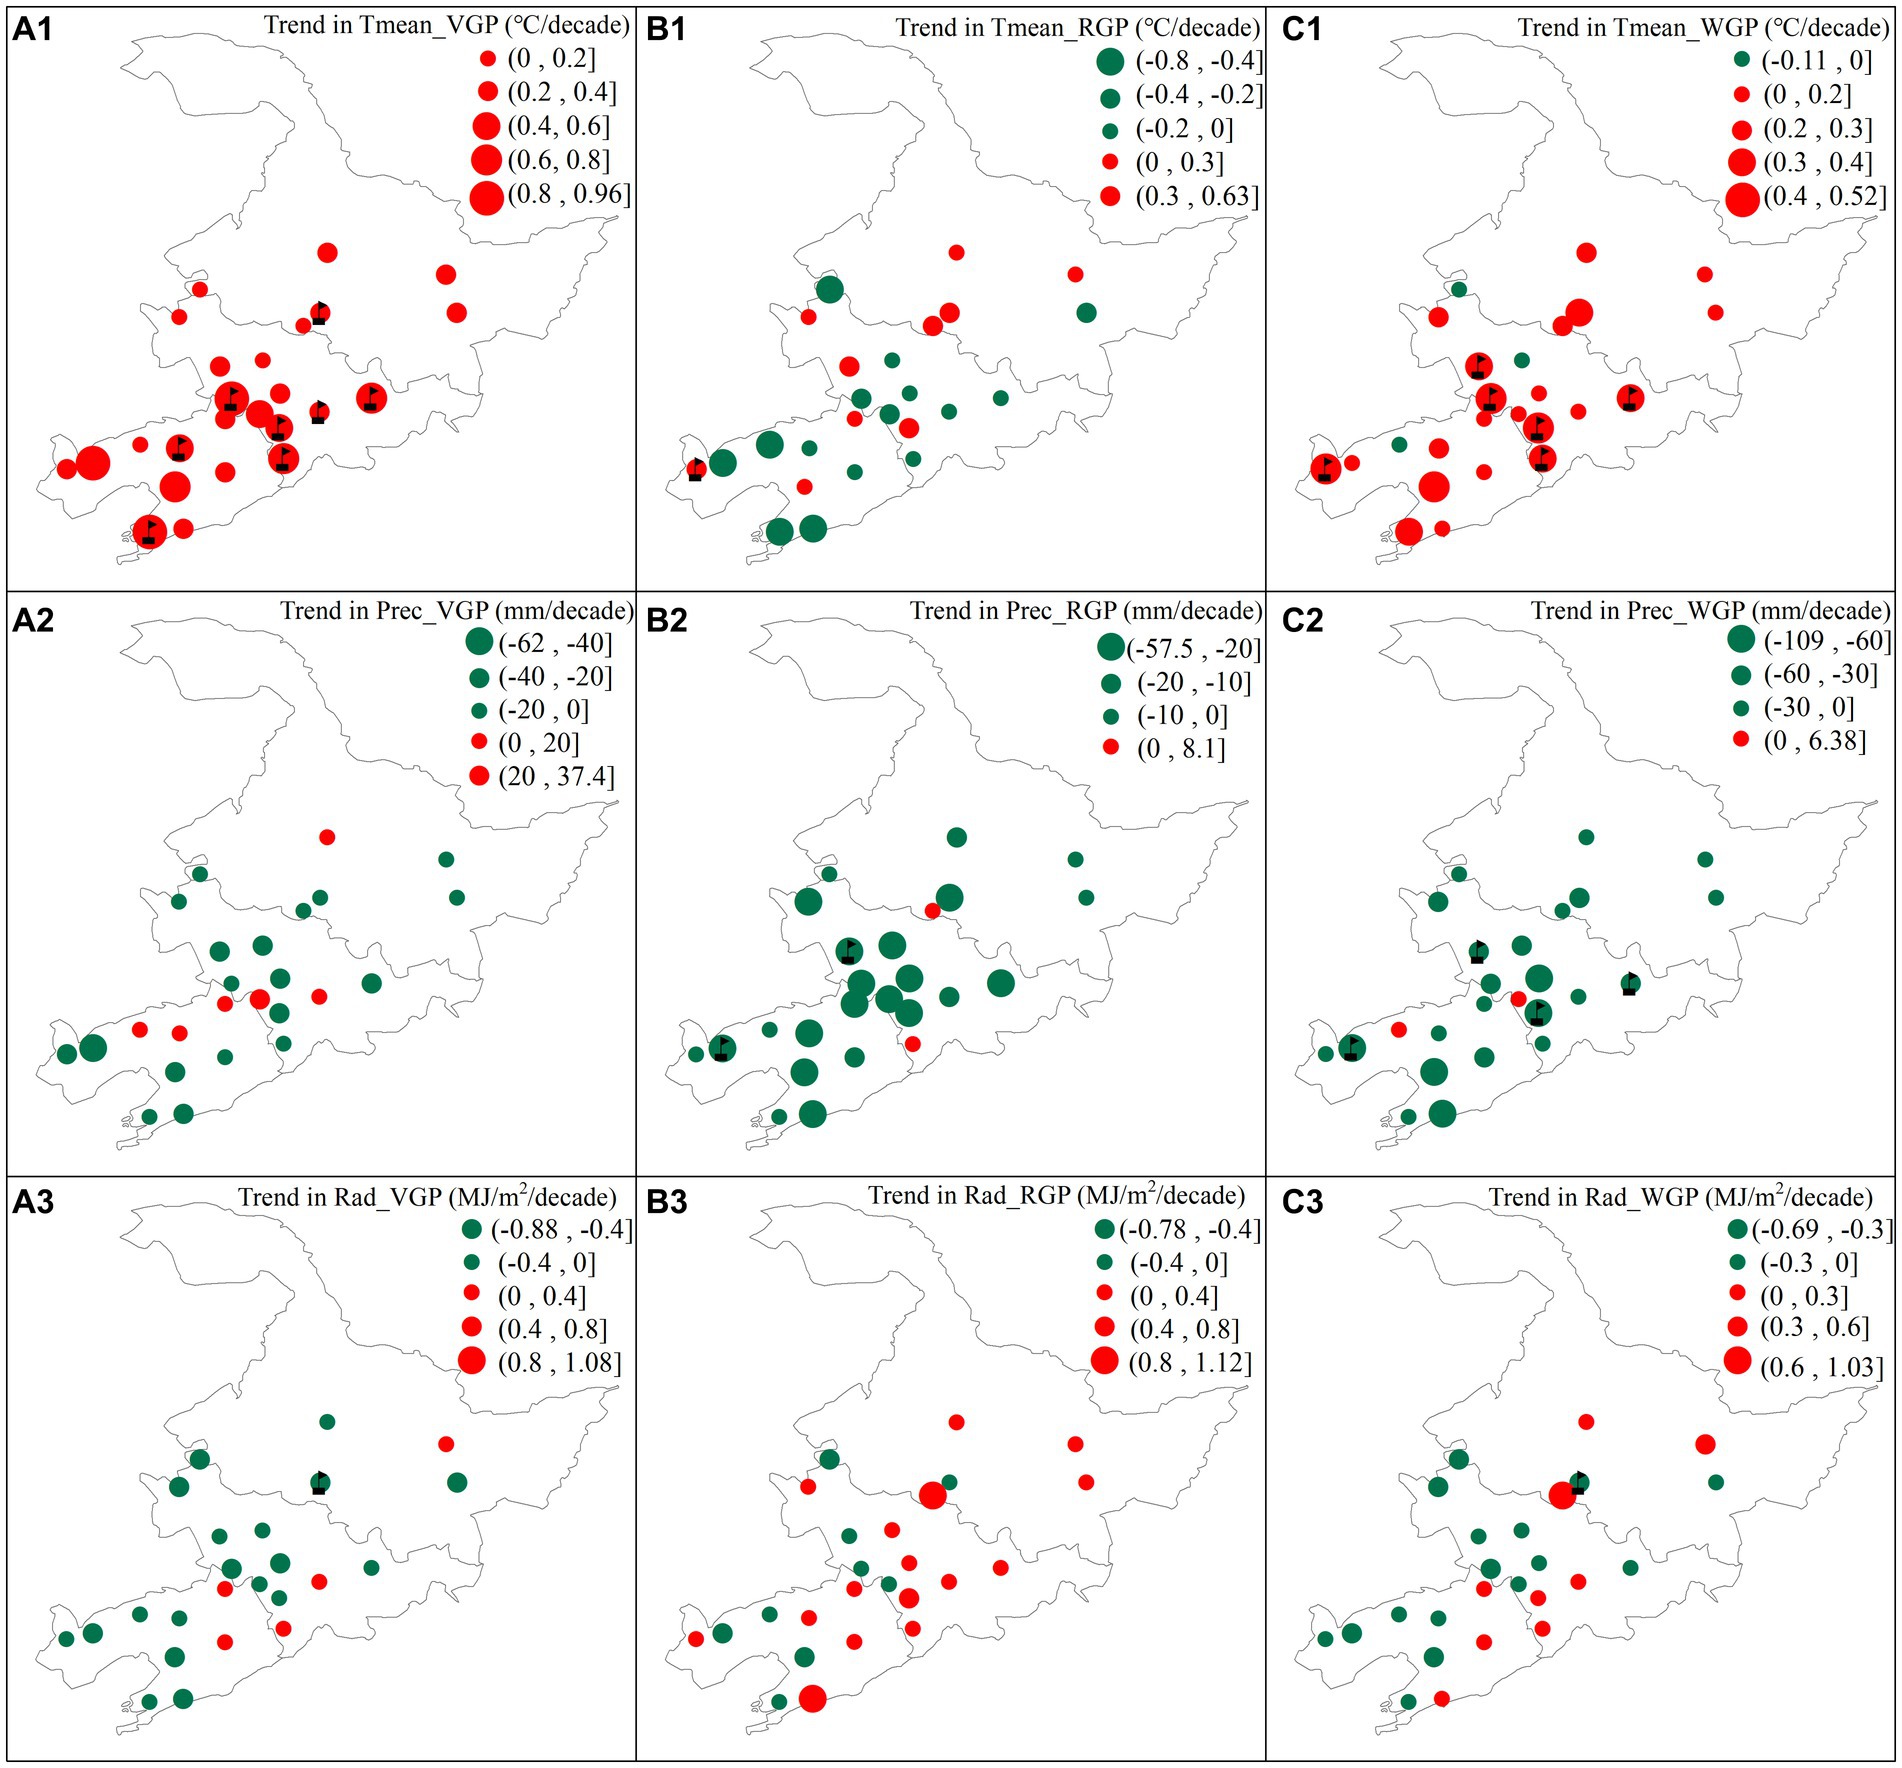
Figure 2. Trends in mean temperature (Tmean) (a1–c1), precipitation (Prec) (b2–c2) and radiation (Rad) (a3–c3) during the vegetative period from emergence to flowering (VGP) (a1–a3), the reproduction period from flowering to maturity (RGP) (b1–b3) and whole growth period from sowing to maturity (WGP) (c1–c3) of maize across Northeast China for 1981–2010. The flags show that the trend is significant at 5% probability level.
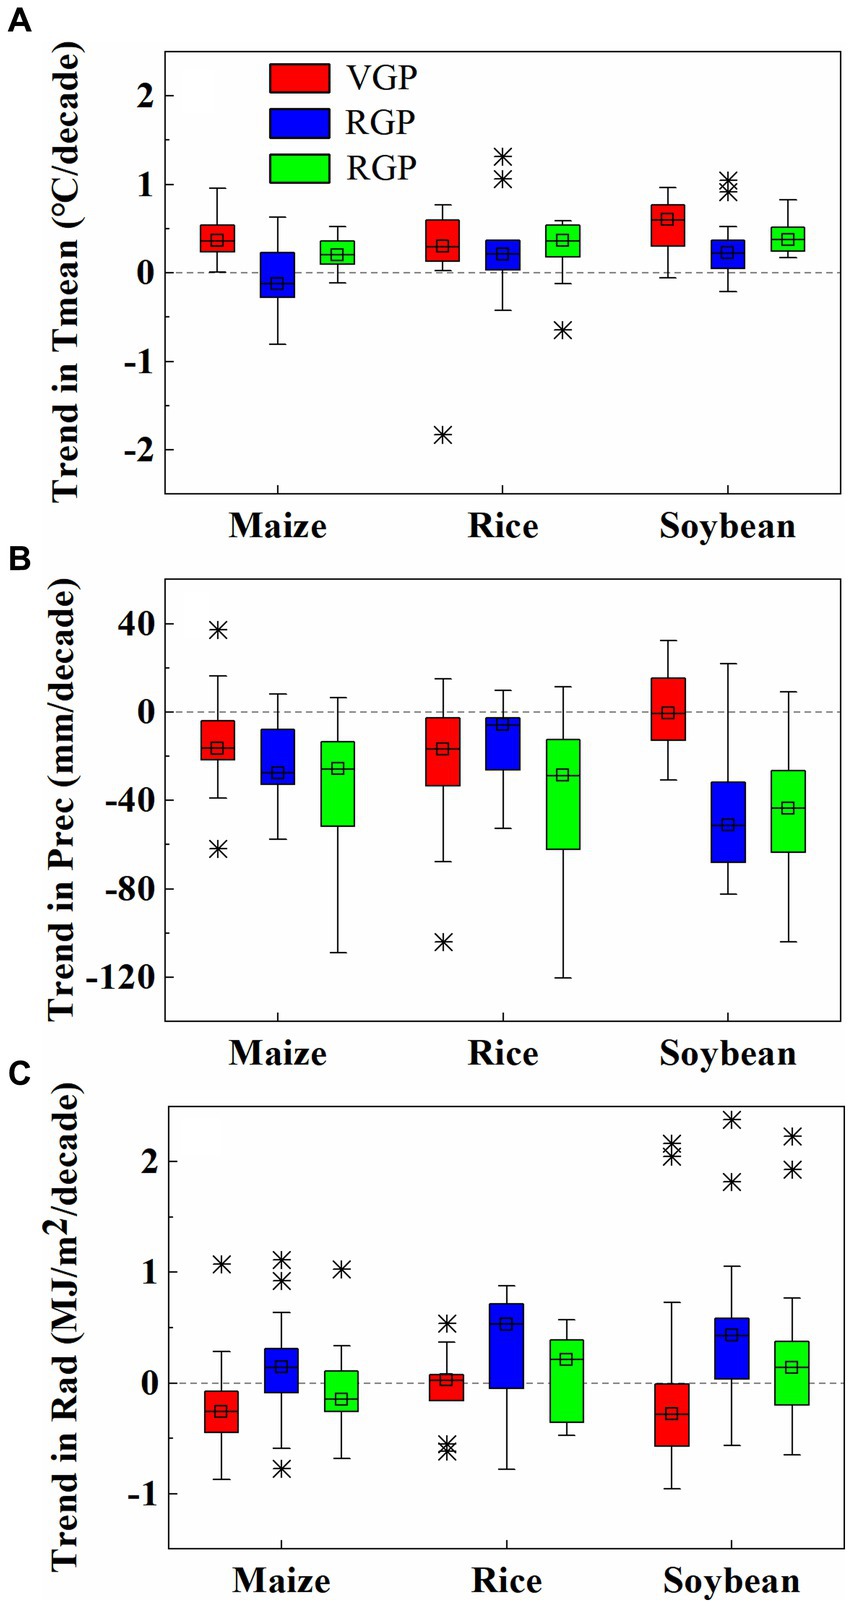
Figure 3. Trends in mean temperature (Tmean) (A), precipitation (Prec) (B) and radiation (Rad) (C) during the vegetative period from emergence to flowering (VGP), the reproduction period from flowering to maturity (RGP) and whole growth period from sowing to maturity (WGP) for maize, rice and soybean in Northeast China for 1981–2010.
3.2 Trends of crop yield in NEC during 1981–2010
During the 1981–2010, the crop yields obtained from the field observation experiment (Ys) across all the AMSs showed increasing trends, and most of them reached a significant level (p < 0.05) (Figures 4a1–c1, Supplementary Table S3). In addition, county-level crop yield statistics (Yc) showed that both maize and rice yields showed an increasing trend (Figures 4a2,b2, Supplementary Table S3); while soybean Yc showed an increasing trend in most sites, and only showed a slight decreasing trend in three sites during the 1981–2010 (Figure 4c2, Supplementary Table S3). As shown in Figure 5, the Ys in NEC was greater than Yc in most years, and the growth rate of Yc for maize and rice was greater than that of Ys, while the growth rate of Ys for soybean was greater than that of Yc. In addition, over the past three decades, maize yields have grown the most and soybean yields have grown the least (Figure 5).
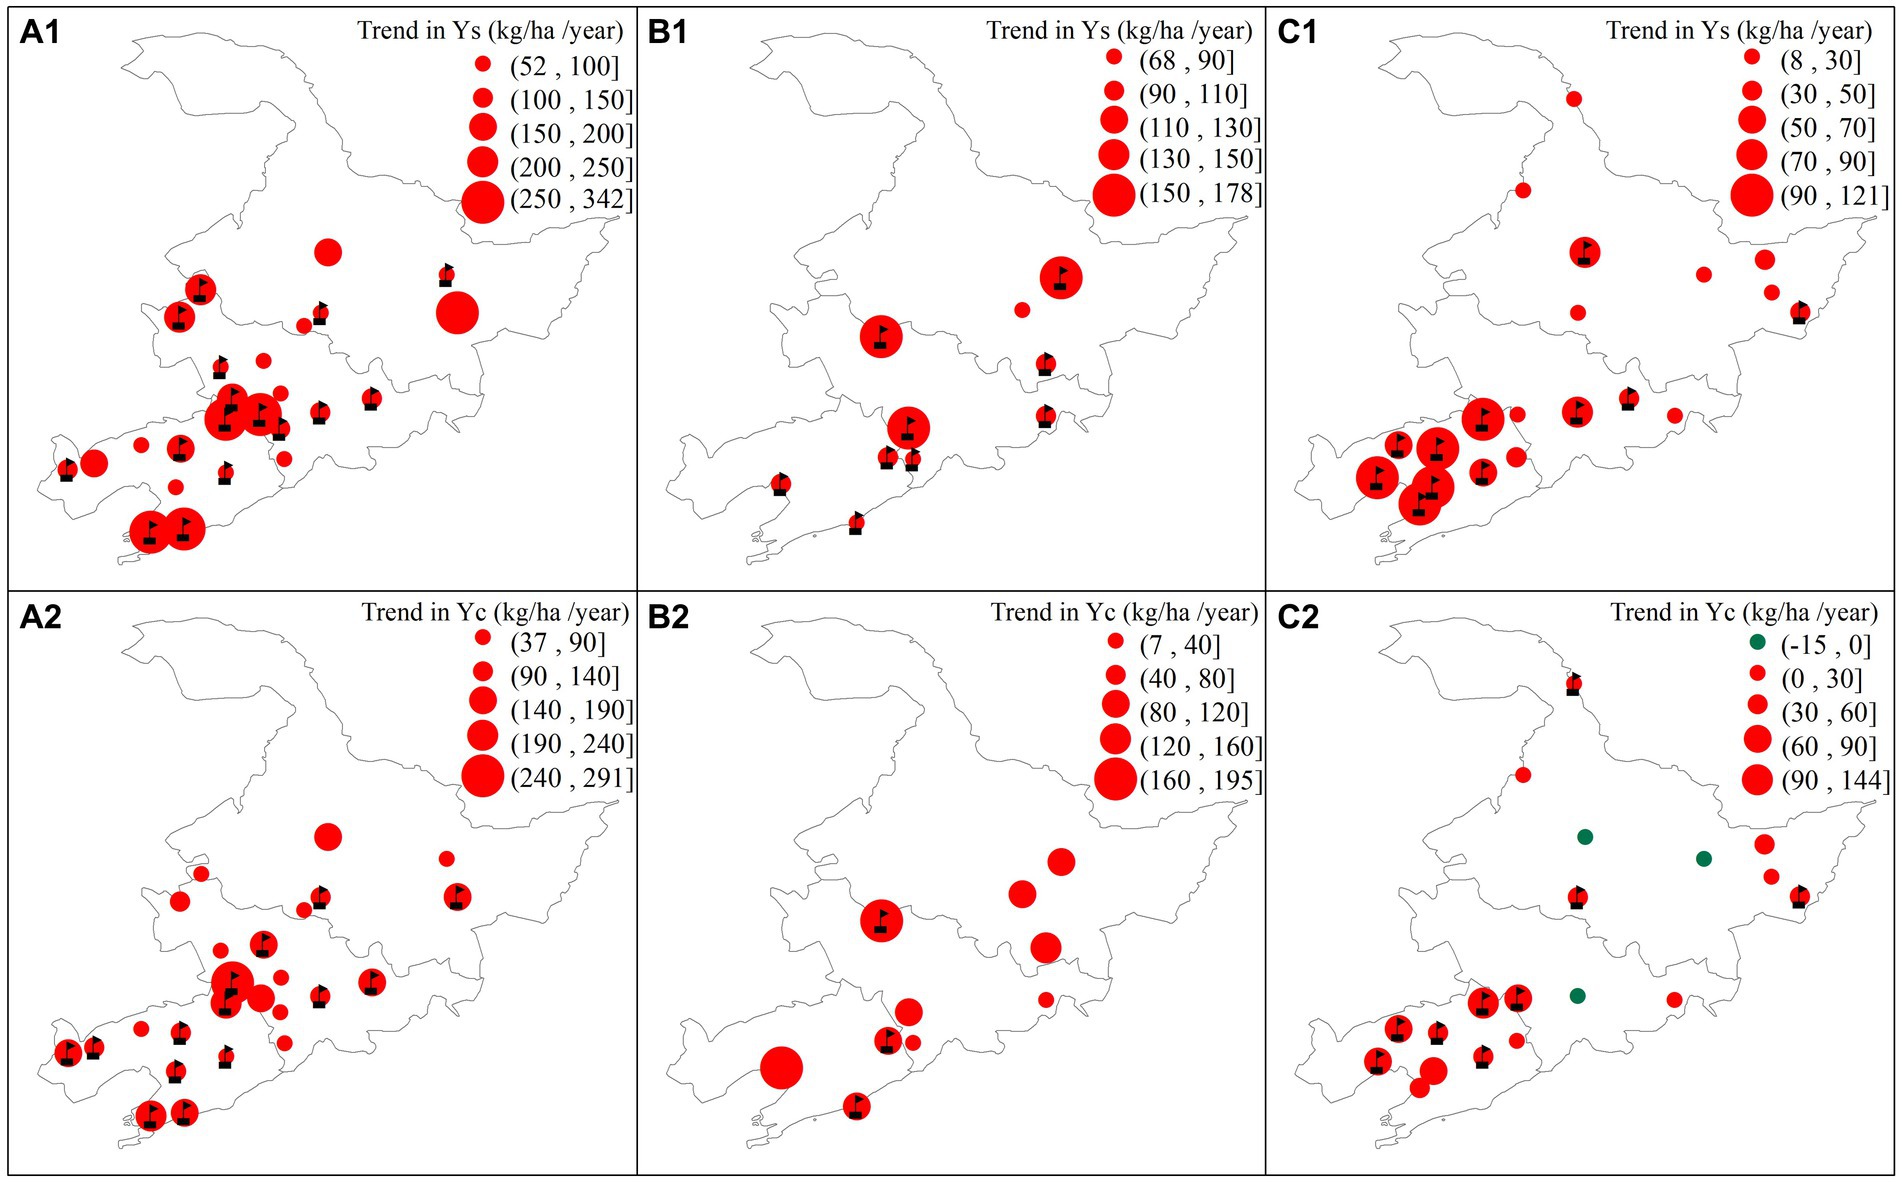
Figure 4. Trends in observed yield in agro-meteorological stations (Ys) (a1–c1) and county-level average yield (Yc) (a2–c2) for maize (a1–a2), rice (b1–b2), and soybean (c1–c2) across Northeast China for 1981–2010. The flags show that the trend is significant at 5% probability level.
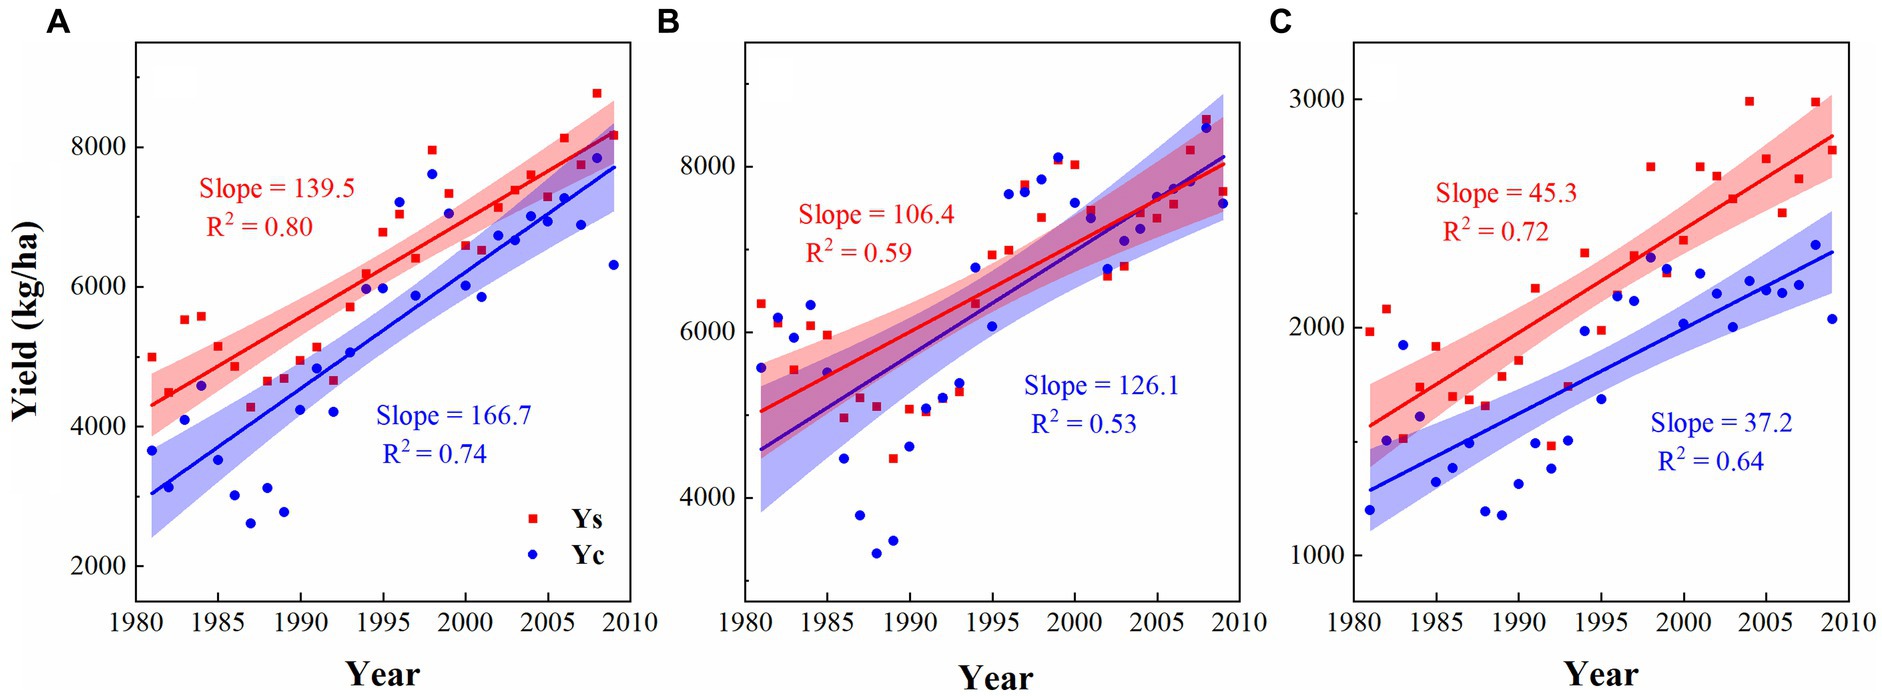
Figure 5. Trends in observed yield in agro-meteorological stations (Ys) and county-level average yield (Yc) for maize (A), rice (B), and soybean (C) in Northeast China for 1981–2010. The corresponding bands represents the 95% confidence interval.
3.3 Correlations between crop yields and climate variables during each growth period
To investigate the relationship between crop yield (e.g., Ys and Yc) and key climatic factors (e.g., Tmean, Prec, and Rad), we conducted correlation analyses between crop yields and climatic factors during different growth period of crops. Due to the spatial differences in climatic conditions and crop management at different sites, the relationship between its yield and climatic factors presents a certain spatial heterogeneity (Figure 6, Supplementary Figures S3–S7). For maize, both Ys and Yc were negatively correlated with the Tmean during the VGP and WGP at most sites (Figures 6a1,c1, Supplementary Figures S3a1,c1), while Ys was positively correlated with Tmean during RGP at 15 of the 25 sites (Figure 6b1). Moreover, at most investigated sites, the Ys and Yc of maize were positively correlated with Prec during the three growth periods (Figures 6a2–c1, Supplementary Figures S3a2–c2). However, the Ys and Yc of maize were negatively correlated with the Rad during the VGP and WGP at most sites (Figures 6a3,c3, Supplementary Figures S3a3,c3). For rice, the yield (Ys and Yc) was positively correlated with Tmean and Rad at most investigated sites, while that was negatively correlated with Prec at most site during VGP and WGP (Supplementary Figures S4, S5). In addition, the Ys and Yc of soybean were positively correlated with Tmean and Prec at most sites, while that were negatively correlated with Rad at half of investigated sites (Supplementary Figures S6, S7).
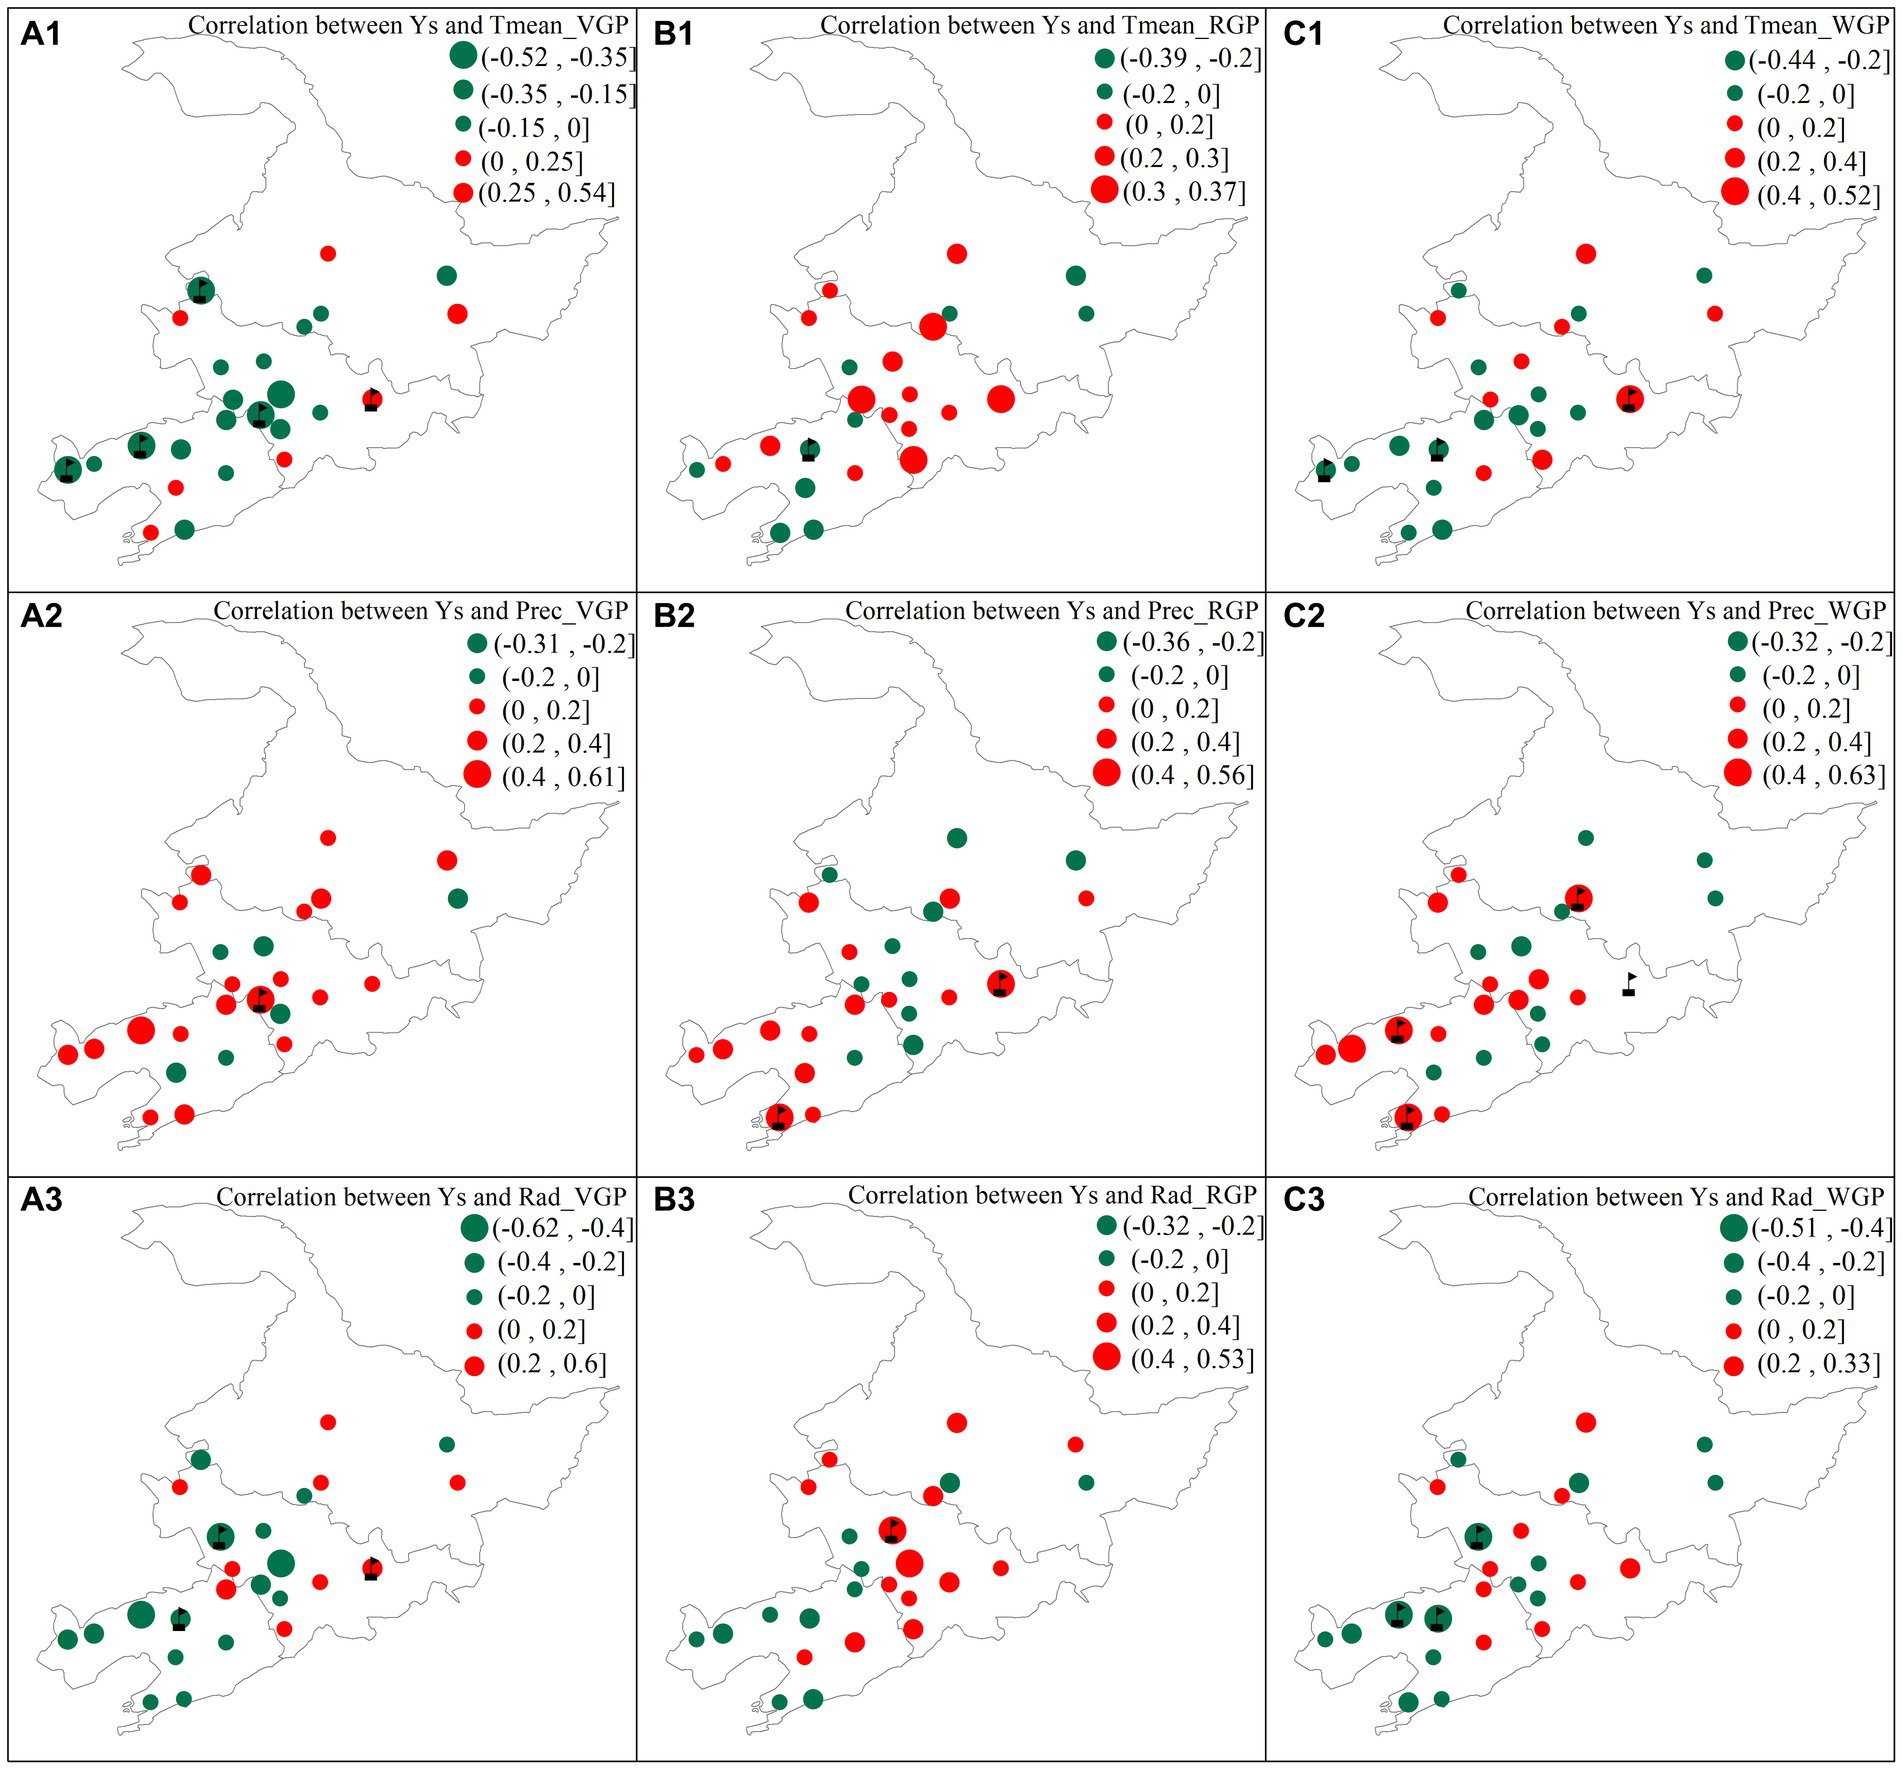
Figure 6. Correlation between observed yield in agro-meteorological stations (Ys) and mean temperature (Tmean) (a1–c1), precipitation (Prec) (b3–b3) and radiation (Rad) (c3–c3) during the vegetable period from emergence to flowering (VGP) (a1–a3), the reproduction period from flowering to maturity (RGP) (b1–b3) and whole growth period from sowing to maturity (WGP) (c1–c3) of maize across Northeast China for 1981–2010. The flags show that the correlation is significant at 5% probability level.
As shown in Figure 7, overall, the two crop yield data (Ys and Yc) of the maize, rice and soybean have relatively consistent correlations with climatic factors (i.e., Tmean, Prec, and Rad). The Ys and Yc of maize were negatively correlated with Tmean during VGP and WGP, while those of rice and soybean were positively correlated with Tmean during RGP and WGP (Figure 7). Moreover, the Ys and Yc of maize and soybean were positively correlated with Prec during the three growth period, while those of rice were negatively correlated with Prec, except Ys during RGP (Figure 7). Across all the investigated sites, maize yield (Ys and Yc) was negatively correlated with Rad, while rice yield was positively correlated with Rad, and soybean yield was less correlated with Rad (Figure 7).
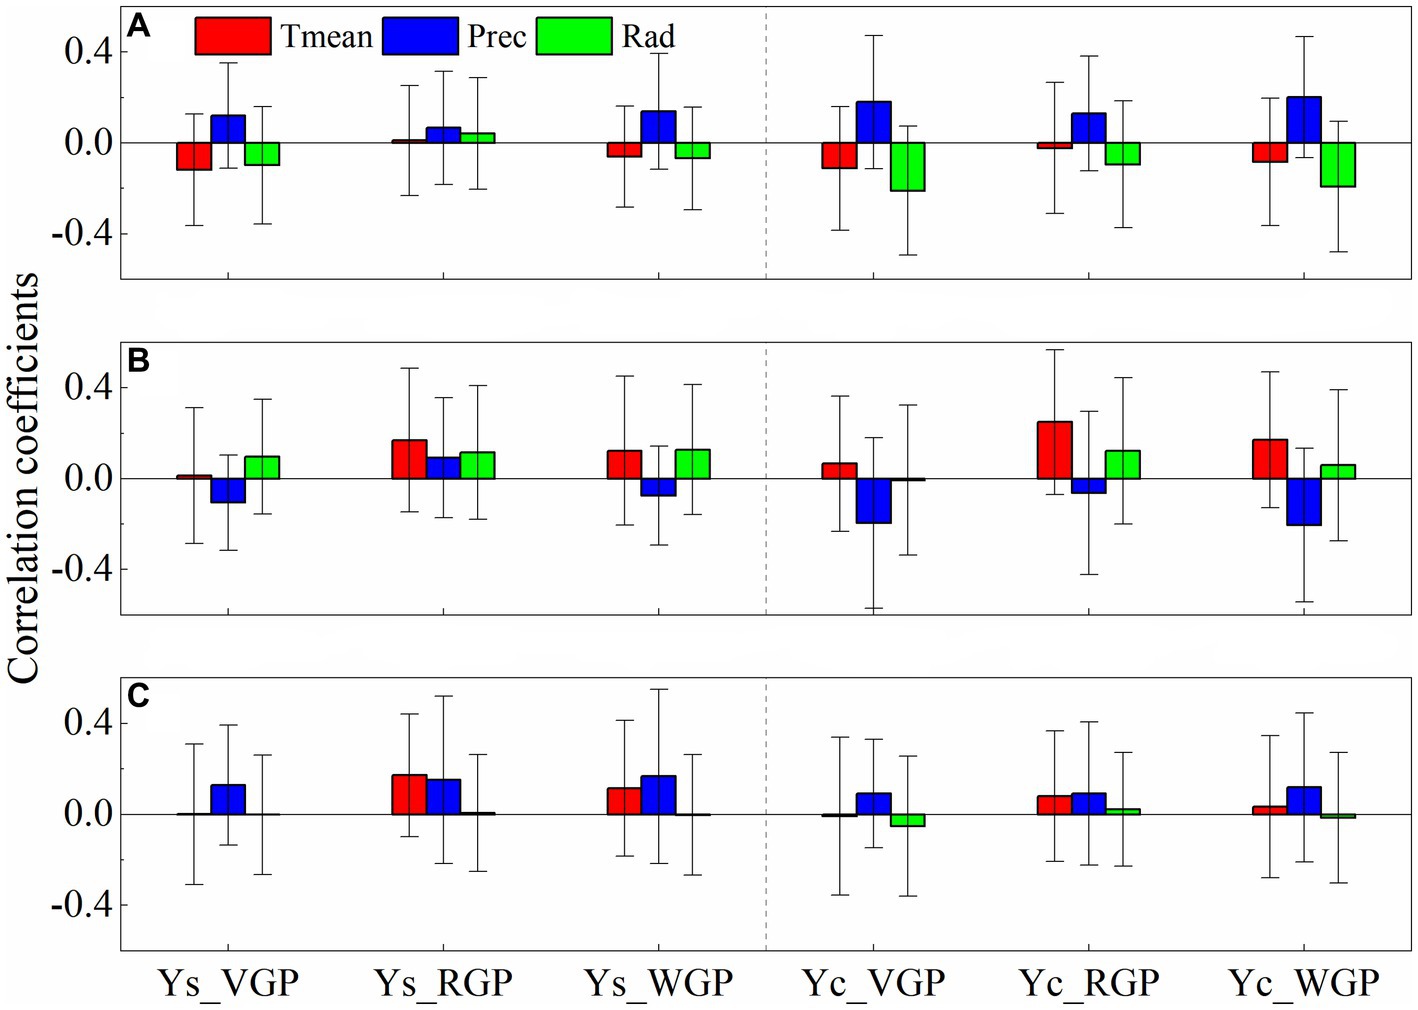
Figure 7. Mean and standard error (represented by error bar) of correlation between yield and climate variables for maize (A), rice (B), and soybean (C) across Northeast China for 1981–2010. Tmean, Prec, and Rad are mean temperature, precipitation and radiation, respectively. Ys and Yc are agro-meteorological stations and county-level average yield. VGP, RGP and WGP are the vegetable period from emergence to flowering, the reproduction period from flowering to maturity and whole growth period from sowing to maturity, respectively.
3.4 Sensitivity of crop yield to climate variables during each growth period
The estimates on sensitivity of crop yield to climate factors from four panel regression models were generally consistent (Figure 8). In addition, the sensitivity of the two yield (Ys and Yc) for three crops to climatic factors is also generally consistent (Figure 8). Overall, for every 1°C increase in Tmean during VGP or WGP, maize yield (Ys and Yc) decreased by 1–3%. The increase in temperature has a positive effect on yield of rice and soybean. For every 1°C increase in Tmean, the yield of rice increased by 2–5%, and the yield of soybean increased by 2–3% (Figure 8A). For Prec increase by 100 mm during WGP, the Ys or Yc increased for maize by about 2.8%; and Ys and Yc increased for soybean by 2.6 and 2.4%, respectively. By contrast, Yc decreased for rice by 1.8% (Figure 8B). In addition, for Rad increase by 1 MJ m2 during WGP, Ys and Yc increased for maize by 2.0 and 4.7%, respectively; Ys for rice increased by 2.5% while Yc decrease by 0.5%. However, soybean yield was less sensitive to changes in Rad (Figure 8C).
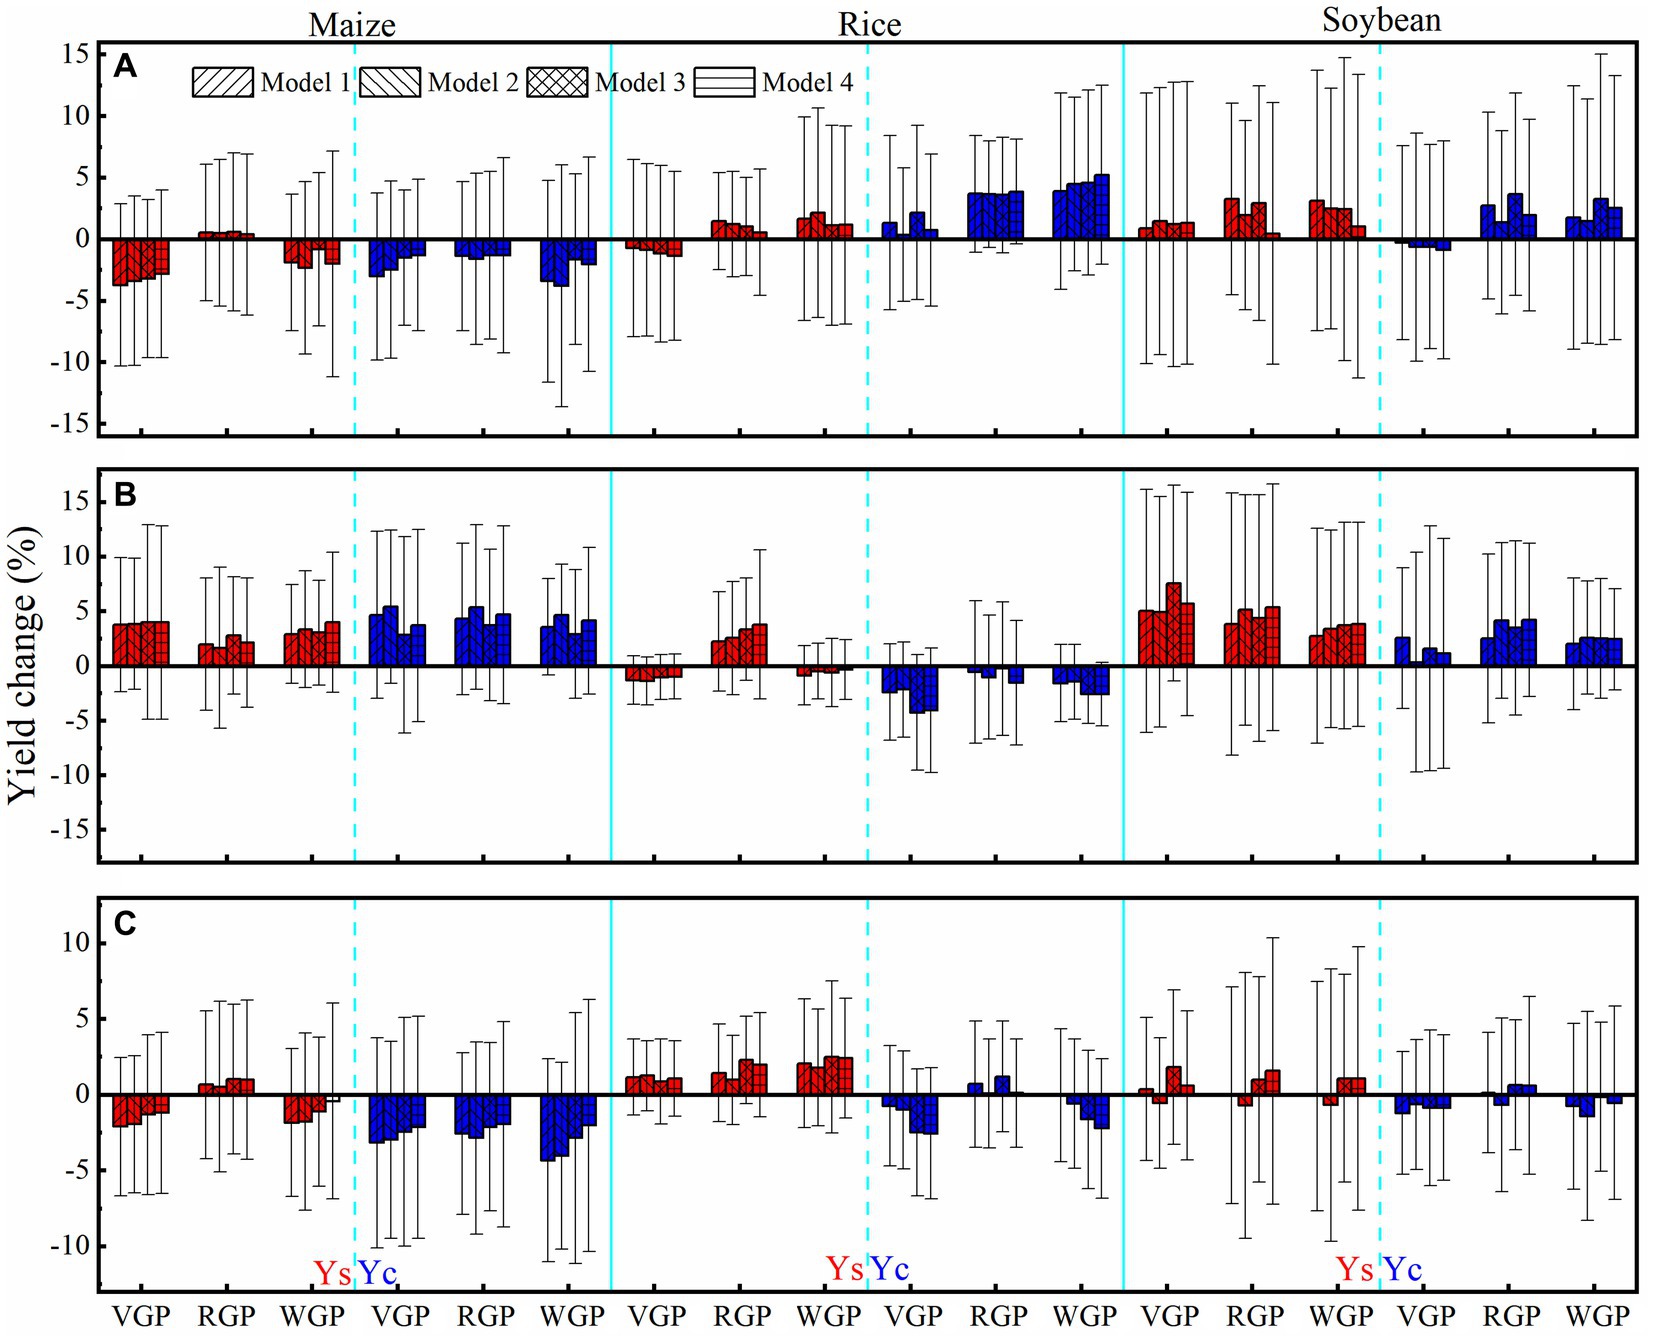
Figure 8. Estimated crop yield (Ys and Yc) changes by four panel regression models for each 1°C increase in Tmean (A), 100 mm increase in Prec (B), and 1 MJ m−2 increase in Rad (C) during different growth periods of Maize, Rice, and Soybean. The error bar represents the standard error of the estimates.
3.5 Yield change due to climate change over each growth period during 1981–2010
During the 1981–2010, climate change caused measurable impacts on three crops (i.e., maize, rice and soybean) in NEC. Due to increase in Tmean during WGP, Ys (Yc) of maize slightly decreased by 1.1% (1.0%), while Ys (Yc) of rice and soybean increased by 0.7% (2.9%) and 3.0% (2.5%), respectively (Figure 9A). Due to decrease in Prec during WGP from 1981 to 2010, Ys (Yc) of maize and soybean decreased by 4.2% (4.1%) and 6.4% (4.3%), respectively, while Ys (Yc) of rice increased by 0.6% (2.9%) (Figure 9B). Due to the change in Rad during WGP, Ys (Yc) of maize and rice increased by 2.4% (3.1%) and 2.1% (0.7%), respectively. Moreover, Ys of soybean increased by 2.5%, but Yc of soybean decreased by 1.9% (Figure 9C). In addition, climate change during WGP from 1981 to 2010, including jointly change in Tmean, Prec and Rad, decreased Ys (Yc) of maize and soybean by 1.3% (0.7%) and 0.3% (1.1%), respectively; however, increased Ys (Yc) of rice by 1.2% (2.2%) (Figure 9D).
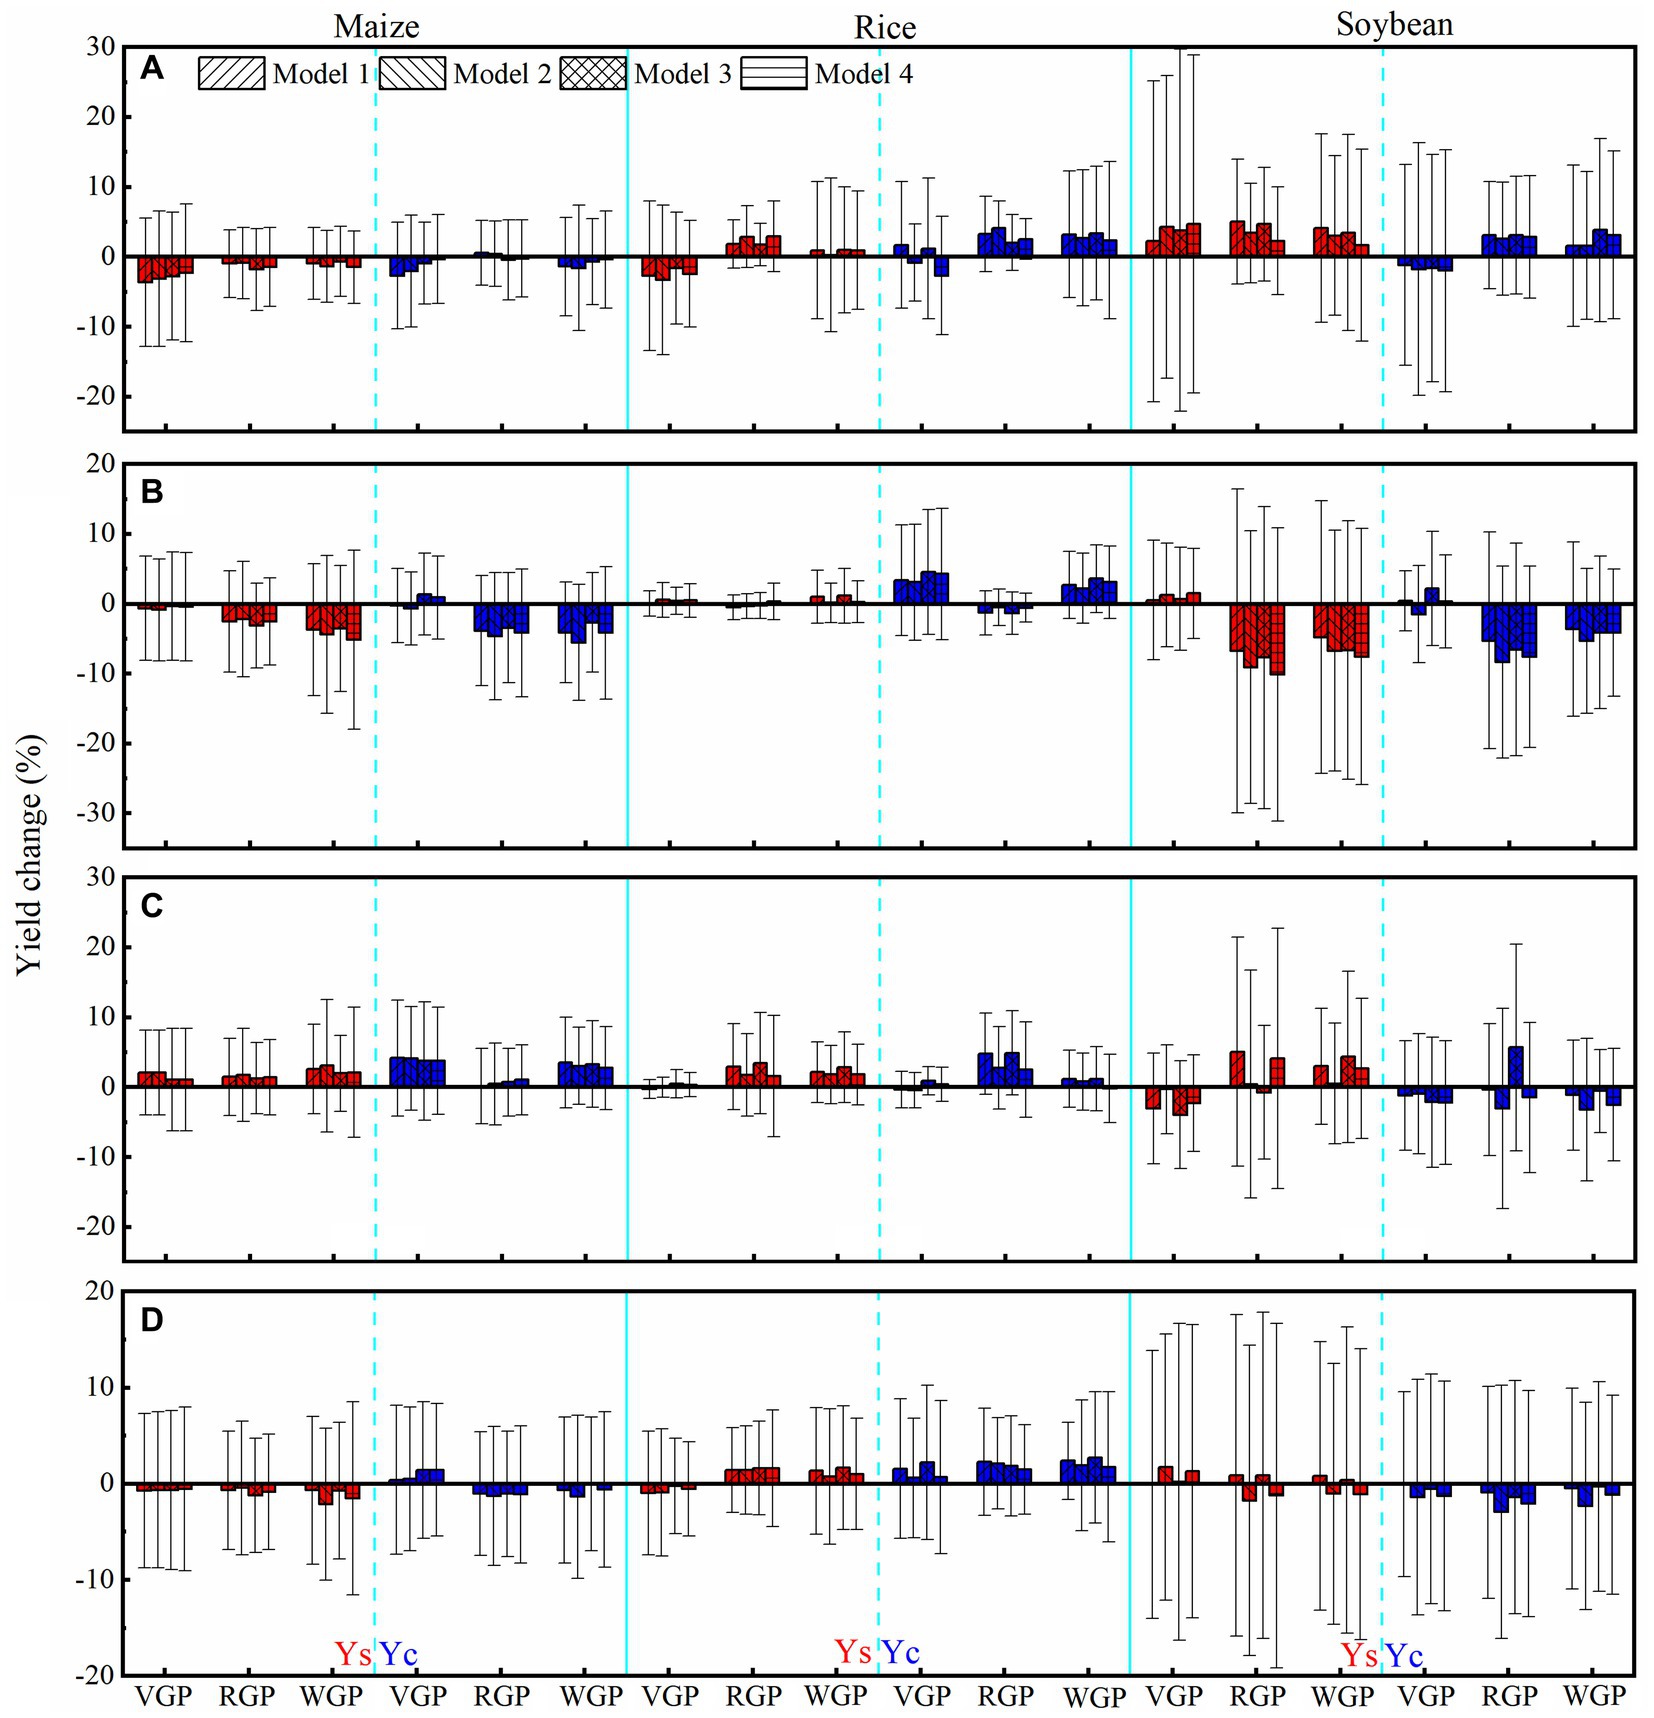
Figure 9. Estimated crop yield (Ys and Yc) changes by four panel regression models due to changes in Tmean (A), Prec (B), Rad (C), and climate change (D) during different growth periods of Maize, Rice, and Soybean from 1981 to 2010. The error bar represents the standard error of the estimates.
4 Discussion
Empirical yield-climate relationships are often explored with yield statistics at country (Gammans et al., 2017), province (Tao et al., 2008), county (Tao et al., 2012) or farm scale (Zhang et al., 2010). It was found that the response of crop yield to climate change is scale-dependent (Lobell et al., 2011). In this study, we developed a database of yield response models to evaluate the impact of these recent climate trends on major crop yields in the NEC for the period of 1981–2010. The match of scale in statistics and climate data makes it suitable to explore yield-climate relationship (Zhang et al., 2010). Based on two types of crop yield data, including the experimentally observed yield in AMSs (Ys) and the county-level yield statistics (Yc) where the stations is located, we used multivariate statistic regression models to investigate the relationships between crop yields and three key climatic factors (i.e., Tmean, Prec, and Rad). Generally, the management (e.g., irrigation, fertilization and pest control) level in the AgMSs was better than the local average level (Xiao and Tao, 2014), the Ys of three crops across the NEC was greater than Yc in most investigated years (Figure 5). Moreover, both Ys and Yc for maize, rice and soybean in the NEC showed significant increasing trends during 1981–2010, and the growth rate of Yc for maize and rice was greater than that of Ys, while the growth rate of Ys for soybean was greater than that of Yc. Continued increases in crop yields indicated that the local average management level in the NEC has considerably improved along with climate change during the past few decades (Niu et al., 2013; Liu et al., 2016).
We analyzed the spatial variations of the yield-climate relationship across the NEC during 1981–2010. These sensitivities of crop yield to climate variations were subject to large spatial differences in terms of both the sign and the magnitude (Figure 8). Previous studies also show large spatial variations in the response of crop yield to climate change, and these differences often remain unexplained or qualitatively attributed to regional differences in crop management, soils, crop varieties and other factors (Tao et al., 2012; Liu et al., 2018). In addition, as the relationship between crop yield and climatic factors presents a certain spatial heterogeneity (Figure 6), it further indicate that the spatial variations in the yield response to climate change can be partly explained by variations in local climate conditions (Wang et al., 2014). Moreover, the results also showed highly heterogeneous across crops (e.g., maize, rice and soybean), that is, different crops responded differently to climatic changes in their growth periods (Figure 9). In detail, due to climate change during crop growth period from 1981 to 2010, Ys (Yc) of maize and soybean decreased by 1.3% (0.7%) and 0.3% (1.1%), respectively, but Ys (Yc) of rice increased by 1.2% (2.2%). In fact, Ys (Yc) of maize, rice and soybean in NEC have grown by 64.2% (82.0%), 47.5% (55.3%) and 59.2% (58.0%), respectively (Figure 5). Therefore, the impact of climate change on yields of three crops was far less than the actual increase in crop yields. It is suggested that other factors (mainly improved management practices) were the main reasons for the significant increase in crop yields in NEC over the past few decades (Liu et al., 2016). Zhao et al. (2015) also noted that the maize yields across NEC increased by 7.1–57.2% due to early sowing and changing cultivars during 1981–2007. In order to provide guidance for more effective crop field management (including crop cultivar selection, sowing date adjustment, water and fertilizer optimization management), it is necessary to further analyze the contribution of different management measures to crop yield.
Generally, the changes in different climate factors (i.e., Tmean, Prec, and Rad) during 1981–2010 have different effects on the yields of three crops (Tao et al., 2012). Temperature are increasing faster in the NEC, and the impact of climate warming on crop production has been widely discussed (Chen et al., 2011; Wang et al., 2014). In this study, due to increase in Tmean, maize yield slightly decreased, but rice and soybean yield increased. The results indicated that historical climate warming had a positive effect on rice and soybeans to a certain extent, and had a lesser effect on maize. Generally, climate warming could decrease crop yield by hastening crop development rate, and reducing crop growth period and yield accumulation (Xiao and Tao, 2014). However, the increase in temperature during certain stages of crop growth could effectively reduce the risk of cold damage to crop development, especially in NEC where cold damage is more severe (Li et al., 2021). In different growth and development stages, crop has different temperature thresholds, optimum temperature and sensitivities (Tao et al., 2017). Therefore, to a certain extent, the impacts of warming temperature on crops should be analyzed in combination with local climatic conditions and the sensitivity of different crops to temperature (Wang et al., 2014). In addition, as a result of decrease in Prec, maize and soybean yield decreased, but rice yield increased (Figure 9B). The main reason is that rice has better water conditions during the growth process, and its dependence on Prec is less than that of maize and soybean due to good irrigation conditions (Zhang et al., 2019). In addition, to some extent, a decrease in Prec can increase the radiation available to crop, which has a positive effect on yield. Across NEC, due to the change in Rad during 1981–2010, both of Ys and Yc of maize and rice increased. However, Yc of soybean decreased due to the Rad change. Although solar radiation is the energy source for crop growth, long-term radiation that is too strong often causes droughts and eventually affects crop yields (Liu et al., 2018; Jiang et al., 2021). Therefore, different water conditions of crops can also indirectly affect the effects of radiation on crop yield. If the moisture conditions are good, radiation enhancement can effectively increase crop yield, otherwise, the increase in radiation may have a negative impact.
Studies have tended to focus on the response of a single crop to climate change (Wang et al., 2014; Jiang et al., 2021), and the data comes from a single source, either experimental or statistical (Tao et al., 2014). In this study, the effects of historical climate change on three important crops in the NEC were compared by using long time series of historical field trial data and statistical data, combined with statistical models considering different factors. On the whole, the results obtained from the two yield data are consistent. The results showed that there were significant differences in the response of different crops to climate change in the study area, and the adjustment and improvement of management measures in the past decades had a greater impact on crop yield. Therefore, in the process of crop response to climate change, it is necessary to take specific management measures according to the sensitivity of different crops to different climate factors.
This study further confirmed that the statistical regression equation can effectively diagnose and isolate the effects of different climate factors on crop yield. Generally, statistical models are not without serious shortcomings, and in particular they are subject to problems of co-linearity between predictor variables (e.g., Tmean and Prec, Prec and Rad, Tmean and Rad) (Tao et al., 2014). Therefore, in the multiple regression of this study, we set up four regression models containing different variable combinations for each climate factor. Overall, the estimates on response of crop yield to climate factors from four panel regression models were generally consistent, indicating that the regression results had high reliability (Tao et al., 2016). However, the estimates may be overly optimistic because data limitation prevent us from explicitly modeling effects of extreme temperature or precipitation events within the growing season, which can have disproportionately large impacts on final yields (Lobell and Burke, 2010; Tao et al., 2016). In addition, although we chose as many research sites as possible to analyze the relationship between yield and climate factors in the study area, due to the uneven distribution of research sites, there are certain limitations and uncertainties in the overall evaluation of the contribution of climate change to yield at the regional scale (Shen et al., 2014; Wang et al., 2016).
5 Conclusion
We used regression analysis of historical data to relate past crop yield outcomes to climate change. Overall, this study mainly investigated the impacts of key climatic factors (e.g., Tmean, Prec and Rad) and climate change on the yield of three crops (e.g., maize, rice and soybean) across NEC. The results of the study indicated that climate change has exerted important impacts on crop yields, but the magnitude of the impact was far smaller than the actual rate of increase in yield over the historical period from 1981 to 2010. Therefore, the improvement of management measures during the past three decades was the main reason for the increase of crop yield in NEC. In the following work, it is necessary to quantify the impacts of different field management measures on crop yield. In addition, the responses of different crops to different climatic factors were quite different. In the related research of crops responding to climate change, it is necessary to carry out comparative analysis and research on different crops, aiming to propose more targeted management measures to mitigate and adapt to future climate change.
Data availability statement
The original contributions presented in the study are included in the article/Supplementary material, further inquiries can be directed to the corresponding authors.
Author contributions
DX: conceptualization, methodology, formal analysis, writing – original draft. XY: data curation, formal analysis. HB: conceptualization, writing – review & editing. JT: writing – review & editing. FT: conceptualization, supervision, writing – review & editing. All authors contributed to the article and approved the submitted version.
Funding
The author(s) declare financial support was received for the research, authorship, and/or publication of this article. This work was supported by the Hebei Provincial Science Foundation for Distinguished Young Scholars (No. D2022205010), the Natural Science Foundation of China (42377483), the Science Foundation of Hebei Normal University (L2023B30), and the Technology Program of Hebei Academy of Sciences (23102).
Conflict of interest
The authors declare that the research was conducted in the absence of any commercial or financial relationships that could be construed as a potential conflict of interest.
Publisher’s note
All claims expressed in this article are solely those of the authors and do not necessarily represent those of their affiliated organizations, or those of the publisher, the editors and the reviewers. Any product that may be evaluated in this article, or claim that may be made by its manufacturer, is not guaranteed or endorsed by the publisher.
Supplementary material
The Supplementary material for this article can be found online at: https://www.frontiersin.org/articles/10.3389/fsufs.2023.1246347/full#supplementary-material
References
Asseng, S., Ewert, F., Martre, P., Rötter, R. P., Lobell, D. B., Cammarano, D., et al. (2015). Rising temperatures reduce global wheat production. Nat. Clim. Chang. 5, 143–147. doi: 10.1038/nclimate2470
Asseng, S., Ewert, F., Rosenzweig, C., Jones, J. W., Hatfield, J. L., Ruane, A. C., et al. (2013). Uncertainty in simulating wheat yields under climate change. Nat. Clim. Chang. 3, 827–832. doi: 10.1038/nclimate1916
Bai, H., Tao, F., Xiao, D., Liu, F., and Zhang, H. (2015). Attribution of yield change for rice-wheat rotation system in China to climate change, cultivars and agronomic management in the past three decades. Clim. Chang. 135, 539–553. doi: 10.1007/s10584-015-1579-8
Bai, H., Xiao, D., Wang, B., Liu, D. L., Feng, P., and Tang, J. (2021). Multi-model ensemble of CMIP6 projections for future extreme climate stress on wheat in the North China plain. Int. J. Climatol. 41, 171–186. doi: 10.1002/joc.6674
Bassu, S., Brisson, N., Durand, J., Boote, K., Lizaso, J., Jones, J. W., et al. (2014). How do various maize crop models vary in their responses to climate change factors. Glob. Chang. Biol. 20, 2301–2320. doi: 10.1111/gcb.12520
Challinor, A., Watson, J., Lobell, D. B., Howden, S. M., Smith, D. R., and Chhetri, H. (2014). A meta-analysis of crop yield under climate change and adaptation. Nat. Clim. Chang. 4, 287–291. doi: 10.1038/nclimate2153
Chao, Q., Li, R., Cui, T., and Wei, C. (2023). Scientific progress and future prospects in climate change: an interpretation of part 1 of China’s fourth National Assessment Report on climate change. China Popul. Resour. Environ. 33, 74–79.
Chen, C., Lei, C., Deng, A., Qian, C., Hoogmoed, W., and Zhang, W. (2011). Will higher minimum temperatures increase corn production in Northeast China? An analysis of historical data over 1965–2008. Agric. For. Meteorol. 151, 1580–1588. doi: 10.1016/j.agrformet.2011.06.013
Chen, C., Qian, C., Deng, A., and Zhang, W. (2012). Progressive and active adaptations of cropping system to climate change in Northeast China. Eur. J. Agron. 38, 94–103. doi: 10.1016/j.eja.2011.07.003
Corbeels, M., Berre, D., Rusinamhodzi, L., and Lopez-Ridaura, S. (2018). Can we use crop modelling for identifying climate change adaptation opinion? Agric. For. Meteorol. 256-257, 46–52. doi: 10.1016/j.agrformet.2018.02.026
Ewert, F., Rötter, R. P., Bindi, M., Webber, H., Trnka, M., Kersebaum, K. C., et al. (2015). Crop modelling for integrated assessment of risk to food production from climate change. Environ. Model. Softw. 72, 287–303. doi: 10.1016/j.envsoft.2014.12.003
Gammans, M., Mérel, P., and Ortiz-Bobea, A. (2017). Negative impacts of climate change on cereal yields: statistical evidence from France. Environ. Res. Lett. 12:054007. doi: 10.1088/1748-9326/aa6b0c
IPCC (2021) in Climate change 2021: The physical science basis. Contribution of working group I to the sixth assessment report of the intergovernmental panel on climate change. eds. V. Masson-Delmotte, P. Zhai, A. Pirani, S. L. Connors, C. Péan, and Y. Chen, et al. (Cambridge, New York, NY: Cambridge University Press)
Jiang, R., He, W., He, L., Yang, J., Qian, B., Zhou, W., et al. (2021). Modelling adaptation strategies to reduce adverse impacts of climate change on maize cropping system in Northeast China. Sci. Rep. 11:810. doi: 10.1038/s41598-020-79988-3
Li, Z., Zhang, Z., Zhang, J., Luo, Y., and Zhang, L. (2021). A new framework to quantify maize production risk from chilling injury in Northeast China. Clim. Risk Manag. 32:100299. doi: 10.1016/j.crm.2021.100299
Liu, Y., Wang, E., Yang, X., and Wang, J. (2010). Contributions of climatic and crop varietal changes to crop production in the North China plain, since 1980s. Glob. Chang. Biol. 16, 2287–2299. doi: 10.1111/j.1365-2486.2009.02077.x
Liu, Z., Yang, X., Hubbard, K. G., and Lin, X. (2012). Maize potential yields and yield gaps in the changing climate of Northeast China. Glob. Chang. Biol. 18, 3441–3454. doi: 10.1111/j.1365-2486.2012.02774.x
Liu, Z., Yang, X., Lin, X., Gowda, P., Lv, S., and Wang, J. (2018). Climate zones determine where substantial increases of maize yields can be attained in Northeast China. Clim. Chang. 149, 473–487. doi: 10.1007/s10584-018-2243-x
Liu, Z., Yang, X., Lin, X., Hubbard, K. G., Lv, S., and Wang, J. (2016). Narrowing the agronomic yield gaps of maize by improved soil, cultivar, and agricultural management practices in different climate zones of Northeast China. Earth Interact. 20, 1–18. doi: 10.1175/EI-D-15-0032.1
Lobell, D. B., and Burke, M. B. (2010). On the use of statistical models to predict crop yield responses to climate change. Agric. For. Meteorol. 150, 1443–1452. doi: 10.1016/j.agrformet.2010.07.008
Lobell, D. B., Burke, M., Tebaldi, C., Mastrandrea, M. D., Falcon, W. P., and Naylor, R. (2008). Prioritizing climate change adaptation needs for food security in 2030. Science 319, 607–610. doi: 10.1126/science.1152339
Lobell, D. B., and Field, C. B. (2007). Global scale climate-crop yield relationships and the impacts of recent warming. Environ. Res. Lett. 2:014002. doi: 10.1088/1748-9326/2/1/014002
Lobell, D. B., and Gourdji, S. M. (2012). The influence of climate change on global crop productivity. Plant Physiol. 160, 1686–1697. doi: 10.1104/pp.112.208298
Lobell, D. B., Schlenker, W., and Costa-Roberts, J. (2011). Climate trends and global crop production since 1980. Science 333, 616–620. doi: 10.1126/science.1204531
Muller, B., and Martre, P. (2019). Plant and crop simulation models: powerful tools to link physiology, genetics, and phenomics. J. Exp. Bot. 70, 2339–2344. doi: 10.1093/jxb/erz175
Nicholls, N. (1997). Increased Australian wheat yield due to recent climate trends. Nature 387, 484–485. doi: 10.1038/387484a0
Niu, X., Xie, R., Liu, X., Zhang, F., Li, S., and Gao, S. (2013). Maize yield gains in Northeast China in the last six decades. J. Integr. Agricult. 12, 630–637. doi: 10.1016/S2095-3119(13)60281-6
Ortiz-Bobea, A., Wang, H., Carrillo, C. M., and Ault, T. R. (2019). Unpacking the climatic drivers of US agricultural yields. Environ. Res. Lett. 14:064003. doi: 10.1088/1748-9326/ab1e75
Prescott, J. A. (1940). Evaporation from a water surface in relation to solar radiation. Trans. R. Soc. South Aust. 64, 114–118.
Ren, G., Ding, Y., Zhao, Z., Zheng, J., Wu, T., Tang, G., et al. (2012). Recent progress in studies of climate change in China. Adv. Atmos. Sci. 29, 958–977. doi: 10.1007/s00376-012-1200-2
Rizzo, G., Monzon, J. P., Tenorio, F. A., Howard, R., Cassman, K. G., and Grassini, P. (2022). Climate and agronomy, not genetics, underpin recent maize yield gains in favorable environments. Proc. Natl. Acad. Sci. U. S. A. 119:e2113629119. doi: 10.1073/pnas.2113629119
Rötter, R. P., Carter, T. R., Olesen, J. E., and Porter, J. R. (2011). Crop-climate models need an overhaul. Nat. Clim. Chang. 1, 175–177. doi: 10.1038/nclimate1152
Rötter, R. P., Hoffmann, M. P., Koch, M., and Müller, C. (2018). Progress in modelling agricultural impacts of and adaptations to climate change. Curr. Opin. Plant Biol. 45, 255–261. doi: 10.1016/j.pbi.2018.05.009
Shen, X. J., Liu, B. H., Li, G. D., Wu, Z. F., Jin, Y. H., Yu, P. J., et al. (2014). Spatiotemporal change of diurnal temperature range and its relationship with sunshine duration and precipitation in China. J. Geophys. Res. Atmos. 119, 13163–13179. doi: 10.1002/2014JD022326
Tao, F., Xiao, D., Zhang, S., Zhang, Z., and Rötter, R. P. (2017). Wheat yield benefited from increases in minimum temperature in the Huang-Huai-Hai plain of China in the past three decades. Agric. For. Meteorol. 239, 1–14. doi: 10.1016/j.agrformet.2017.02.033
Tao, F., Yokozawa, M., Liu, J., and Zhang, Z. (2008). Climate–crop yield relationships at province scale in China and the impacts of recent climate trends. Clim. Res. 38, 83–94. doi: 10.3354/cr00771
Tao, F., Yokozawa, M., and Zhang, Z. (2019). Modelling the impacts of weather and climate variability on crop productivity over a large area: a new process-based model development, optimization, and uncertainties analysis. Agric. For. Meteorol. 149, 831–850. doi: 10.1016/j.agrformet.2008.11.004
Tao, F., Zhang, Z., Xiao, D., Zhang, S., Rötter, R. P., Shi, W., et al. (2014). Responses of wheat growth and yield to climate change in different climate zones of China, 1981–2009. Agric. For. Meteorol. 189-190, 91–104. doi: 10.1016/j.agrformet.2014.01.013
Tao, F., Zhang, Z., Zhang, S., Rötter, R. P., Shi, W. J., Xiao, D. P., et al. (2016). Historical data provide new insights into response and adaptation of maize production systems to climate change/variability in China. Field Crop Res. 185, 1–11. doi: 10.1016/j.fcr.2015.10.013
Tao, F., Zhang, Z., Zhang, S., Zhu, Z., and Shi, W. (2012). Response of crop yields to climate trends since 1980 in China. Clim. Res. 54, 233–247. doi: 10.3354/cr01131
Wang, B., Feng, P., Liu, D. L., O’Leary, G. J., Macadam, I., Waters, C., et al. (2020). Sources of uncertainty for wheat yield projections under future climate are site-specific. Nat. Food 1, 720–728. doi: 10.1038/s43016-020-00181-w
Wang, W., Lu, H., Yang, D. W., Sothea, K., Jiao, Y., Gao, B., et al. (2016). Modelling hydrologic processes in the Mekong River basin using a distributed model driven by satellite precipitation and rain gauge observations. PLoS One 11:e0152229. doi: 10.1371/journal.pone.0152229
Wang, X., Peng, L., Zhang, X., Yin, G., Zhao, C., and Piao, S. (2014). Divergence of climate impacts on maize yield in Northeast China. Agric. Ecosyst. Environ. 196, 51–58. doi: 10.1016/j.agee.2014.06.009
Wang, X., Zhao, C., Müller, C., Wang, C., Ciais, P., Janssens, I., et al. (2020). Emergent constraint on crop yield response to warmer temperature from field experiments. Nat. Sustain. 3, 908–916. doi: 10.1038/s41893-020-0569-7
White, J. W., Hoogenboom, G., Kimball, B. A., and Wall, G. W. (2011). Methodologies for simulating impacts of climate change on crop production. Field Crop Res. 124, 357–368. doi: 10.1016/j.fcr.2011.07.001
Wilcox, J., and Makowski, D. (2014). A meta-analysis of the predicted effects of climate change on wheat yields using simulation studies. Field Crop Res. 156, 180–190. doi: 10.1016/j.fcr.2013.11.008
Xiao, D., Bai, H., Liu, D. L., Tang, J., Wang, B., Shen, Y., et al. (2022). Projecting future changes in extreme climate for maize production in the North China plain and the role of adjusting the sowing date. Mitig. Adapt. Strateg. Glob. Chang. 27:21. doi: 10.1007/s11027-022-09995-4
Xiao, D., and Tao, F. (2014). Contributions of cultivars, management and climate change to winter wheat yield in the North China plain in the past three decades. Eur. J. Agron. 52, 112–122. doi: 10.1016/j.eja.2013.09.020
Xiao, D., and Tao, F. (2016). Contributions of cultivar shift, management practice and climate change to maize yield in North China plain in 1981–2009. Int. J. Biometeorol. 60, 1111–1122. doi: 10.1007/s00484-015-1104-9
Xiao, D., Zhang, Y., Bai, H., and Tang, J. (2021). Trends and climate response in the phenology of crops in Northeast China. Front. Earth Sci. 9:811621. doi: 10.3389/feart.2021.811621
Xiao, D., Zhao, Y., Bai, H., Hu, Y., and Cao, J. (2019). Impacts of climate warming and crop management on maize phenology in northern China. J. Arid. Land 11, 892–903. doi: 10.1007/s40333-019-0028-3
Xie, L., Guo, M., Cao, M., Liu, E., and Gao, X. (2009). Strategies and counter measures to climate change for agriculture in Northeast China. Adv. Clim. Chang. Res. 5, 174–178.
Xiong, W., Holman, I. P., You, L., Yang, J., and Wu, W. (2014). Impacts of observed growing-season warming trends since 1980 on crop yields in China. Reg. Environ. Chang. 14, 7–16. doi: 10.1007/s10113-013-0418-6
Yan, M., Wei, D., and Wu, Y. (2020). Analysis on the spatio-temporal evolution of the main food crops planting structure in the three northeastern provinces. J. North Agricult. 48, 114–118. Chinese with English abstract. doi: 10.12190/j.issn.2096-1197.2020.06.19
Zampieri, M., Ceglar, A., Dentener, F., Dosio, A., Naumann, G., van den Berg, M., et al. (2019). When will current climate extremes affecting maize production become the norm? Earth’s Future 7, 113–122. doi: 10.1029/2018EF000995
Zhang, F., Yang, X., Sun, S., Gao, J., Liu, Z., Zhang, Z., et al. (2021). Spatiotemporal analysis of extreme agrometeorological events during selected growth stages of maize (Zea mays L.) from 1960 to 2017 in Northeast China. Theor. Appl. Climatol. 143, 943–955. doi: 10.1007/s00704-020-03465-0
Zhang, H., Zhou, G., Liu, D., Wang, B., Xiao, D., and He, L. (2019). Climate-associated rice yield change in the Northeast China plain: a simulation analysis based on CMIP5 multi-model ensemble projection. Sci. Total Environ. 666, 126–138. doi: 10.1016/j.scitotenv.2019.01.415
Zhang, T., Zhu, J., and Wassmann, R. (2010). Responses of rice yields to recent climate change in China: an empirical assessment based on long-term observations at different spatial scales (1981–2005). Agric. For. Meteorol. 150, 1128–1137. doi: 10.1016/j.agrformet.2010.04.013
Zhao, C., Liu, B., Piao, S., Wang, X., Lobell, D. B., Huang, Y., et al. (2017). Temperature increase reduces global yields of major crops in four independent estimates. Proc. Natl. Acad. Sci. U. S. A. 114, 9326–9331. doi: 10.1073/pnas.1701762114
Zhao, J., Yang, X., Dai, S., Lv, S., and Wang, J. (2015). Increased utilization of lengthening growing season and warming temperatures by adjusting sowing dates and cultivar selection for spring maize in Northeast China. Eur. J. Agron. 67, 12–19. doi: 10.1016/j.eja.2015.03.006
Keywords: model, climate change, yield, adaptation, Northeast China
Citation: Xiao D, Yang X, Bai H, Tang J and Tao F (2024) Trends and climate response in the yield of staple crops across Northeast China. Front. Sustain. Food Syst. 7:1246347. doi: 10.3389/fsufs.2023.1246347
Edited by:
Roberto Valdivia, Oregon State University, United StatesReviewed by:
Xiangjin Shen, Chinese Academy of Sciences (CAS), ChinaShuo Chen, Purdue University, United States
Copyright © 2024 Xiao, Yang, Bai, Tang and Tao. This is an open-access article distributed under the terms of the Creative Commons Attribution License (CC BY). The use, distribution or reproduction in other forums is permitted, provided the original author(s) and the copyright owner(s) are credited and that the original publication in this journal is cited, in accordance with accepted academic practice. No use, distribution or reproduction is permitted which does not comply with these terms.
*Correspondence: Dengpan Xiao, eGlhb2RwQHNqemlhbS5hYy5jbg==; Fulu Tao, dGFvZmxAaWdzbnJyLmFjLmNu
 Dengpan Xiao
 Xiaohui Yang1,2
 Huizi Bai
 Fulu Tao