 Wenjiang Ma1Yifei Ding2Miaoqin Bai1Adili Aihemaiti1Lijiang Zhou1
 Zhongna Yang1*Qiong Ma1*Shimza Bint Aslam3
- 1Department of Economics and Management, Tarim University, Alar, China
- 2College of Economics and Management, Huazhong Agricultural University, Wuhan, China
- 3Institute of Agricultural and Resource Economics, University of Agriculture, Faisalabad, Pakistan
Although Enhancing green total factor productivity (GTFP) within the agricultural sector is crucial for fostering sustainable development. In this paper, the GTFP of China’s maize industry is analyzed using the SBM-GML index method, considering data from the primary maize-producing provinces from 2004 to 2020. This analysis incorporates carbon emissions as undesirable outputs. The spatial Durbin model aids in investigating the factors influencing maize GTFP. Our findings reveal a positive trajectory for China’s maize GTFP over the designated period, featuring an average yearly increase of 0.8%. This ascension is primarily attributed to advancements in green maize technology. In the key cultivation regions of the Yellow and Huaihai areas, the Northern region, and the Southwest region, the average annual growth rates were 1.5%, 0.87%, and 0.09%, respectively. Among the direct influences, variables such as regional human capital, the extent of maize cultivation area, financial assistance towards agriculture, and the degree of agricultural mechanization considerably bolster the optimization of maize GTFP. Conversely, urbanization and the prevalence of natural disasters in the agricultural sector pose substantial challenges to enhancing maize GTFP. Furthermore, the spatial spillover effects reveal that natural agricultural disasters in a particular region inadvertently contribute to the improvement of maize GTFP in adjacent regions. Additionally, the regional human capital levels can significantly impede the progress of maize GTFP in neighboring regions. Therefore, to ensure food security, it is imperative to actively advocate for green development within the maize industry to Enhancing green total factor productivity (GTFP) in agriculture is crucial for agriculture to promote sustainable development. In this paper, using data from 2004-2020 from China’s main maize-producing provinces, the SBM-GML index method is used to measure China’s maize GTFP, and the spatial Durbin model is applied to examine the influencing factors and spatial spillover effects of China’s maize GTFP growth. The results of the study revealed a positive trajectory of Chinese maize GTFP over the specified period, with an average annual growth of 0.8%. This enhancement is mainly attributed to the progress of green maize technology. The average annual growth rates were 1.5%, 0.87%, and 0.09% in the major cultivation areas of the Yellow and Huaihai regions, the northern and southwestern regions, respectively. The analysis of influencing factors showed that among the direct influencing factors, variables such as regional human capital, extent of maize cultivation area, financial assistance to agriculture and degree of agricultural mechanisation contributed significantly to the optimization of maize GTFP. Conversely, urbanisation and the prevalence of natural disasters in the agricultural sector pose significant challenges to improving maize GTFP. Furthermore, spatial spillovers reveal that natural agricultural disasters in a given region unintentionally contribute to the improvement of maize GTFP in neighbouring regions. Furthermore, regional human capital levels can significantly hinder progress in maize GTFP in neighbouring regions. Therefore, in order to ensure food security, the greening of maize production must be actively promoted.
1. Introduction
As global climate change and resource shortages intensify, food production is slowing down, and the world’s food supply is getting tighter. Maize is the world’s most widely planted and most productive cereal crop, topping the list of the three major grains (maize, wheat, and rice). China is the world’s second-largest producer and consumer of maize, with the second-largest sown area, total production, and consumption behind the USA (Kong et al., 2002; Olubunmi et al., 2022). In the last few years of the new century, China’s maize production and consumption have grown quickly. In 2021, 43.32 million ha were planted, which is 44.75% of the total area of the three major staple foods and makes maize the largest grain crop currently planted in China at the moment.But, the negative externalities associated with the rapid growth of maize production have caused serious damage to the ecological environment.GTFP of maize refers to the inclusion of undesirable output such as carbon emission and non-point source pollution in the measurement of TFP of maize.The improvement of maize’s GTFP has become an important tool to overcome the dilemma of “resource-environment-sustainable growth” in agriculture (Fu et al., 2022; Ye et al., 2023).
Currently, research on GTFP in agriculture has focused on these three areas (Song et al., 2022; Wang X. et al., 2022; Wang Y. et al., 2022). First is the definition of the concept of GTFP and the construction of the indicator system. GTFP refers to the inclusion of undesirable output indicators based on the traditional total factor productivity calculation that treats environmental pollution in the production process as a factor input or as a by-product of economic development and generally measures undesirable outputs around agricultural fertilizers, pesticides, surface pollution, and carbon emissions to make the study more scientific (Reinhard et al., 1999; Hailu and Veeman, 2001; Sun, 2022; Yu D. et al., 2022; Yu et al., 2022a,b).
The second aspect is about the methodology for measuring agricultural GTFP. There are two primary methods for calculating agricultural GTFP, namely the parametric method and the non-parametric method. The parametric method generally uses parametric stochastic frontier analysis (SFA), the SFA model beyond logarithmic functions, and the SFA-Malmquist method to measure and decompose agricultural total factor productivity (Hong et al., 2022; Wang F. et al., 2022; Wang L. et al., 2022). The DEA non-parametric method is the most commonly used method to measure AGTFP (Fang et al., 2021; Yang et al., 2022). The DEA method was first used to measure efficiency based on the traditional distance function (DF), but Faere et al. (1989) incorporated undesirable output into the efficiency measurement system and proposed a directional distance function (DDF) based on the output perspective. Chung et al. (1997) further developed the Malmquist-Luenberger (ML) indicator based on the DDF to measure total factor productivity with undesired output. Based on Chung et al. (1997)’s research, Oh (2010) further proposed the Global-Malmquist-Luenberger (GML) index to address the problem that the ML index is not circularly transferable and cannot be solved by linear programming. Tone (2001) proposed a slack-based efficiency measure, the SBM method, for the “slack” problem.
The third aspect is about the search for factors influencing the optimization or deterioration of GTFP. In the relevant studies analyzing the factors influencing GTFP in agriculture, the influencing factors that are more recognized by most scholars include agricultural disaster rate, crop sowing area, mechanization level, production labor, irrigation facility level, economic development level, industrial structure, urbanization level, environmental regulation, and other aspects. The study showed that economic level, financial investment, wheat disaster area, and wheat sown area per capita all had a negative impact on the GTFP of wheat (Dai and Xu, 2022); five factors, such as grain production machinery and labor, had a significant positive or negative impact on the GTFP of grain in Henan Province; three factors, such as diesel used in grain production, had a significant negative impact on technological progress; and four factors, including financial input, had a significant positive or negative effect on technical efficiency (Deng, 2019). Furthermore, Sang et al. (2023) found that agricultural mechanization services help to narrow the income gap between rural households and alleviate income inequality in rural areas.
The above review reveals that previous studies have rarely included carbon emissions in the GTPF measurement system and have neglected the spatial effects of agricultural GTFP, resulting in biased conclusions. Given this, this paper attempts to make a marginal contribution to the research in this area through the following three aspects: First, the SBM-GML index method is used to measure maize GTFP from the perspective of carbon emissions and reveal its spatial and temporal evolution patterns. Secondly, in terms of research methodology, the spatial Durbin model is applied to explore the significant influencing factors of maize GTFP. Finally, spatial decomposition effects are applied to analyze the direct and indirect effects on maize GTFP.
The overall objective of this study is to determine the GTFP of maize in China based on a carbon emissions perspective and to identify its influencing factors for the sustainable development of the maize industry. Improving the green total factor productivity of corn is one of the ways to realize the sustainable development of corn production. More specifically, this study will: (1) establish a maize GTFP measurement system, SBM-GML, for measuring GTFP in China’s major maize production areas and analyze its causes in both temporal and spatial dimensions; (2) identify the key causes affecting maize GTFP and spatial spillover effects; explore new pathways for achieving green and high-quality maize development in China; help identify the main drivers of maize development and explore its intrinsic influence mechanism; and help the connotation and extension of maize green development; and (3) at the same time, using maize as the research object makes up for the lack of GTFP measurement research objects, and aims to explore a new way to achieve green and high-quality development of maize in China, reduce carbon emissions from maize production through agricultural technology progress and agricultural technology efficiency improvement, and explore its intrinsic influence mechanism by identifying the main driving forces of maize development, which has certain theoretical and practical significance.
The plan for the research is as follows: first, to measure China’s maize GTFP and explain its endogenous sources of growth in both time and space; second, to analyze the important factors affecting China’s maize GTFP and spatial spillover effects; and finally, to draw conclusions and make corresponding policy recommendations.
2. Materials and methods
2.1. Study area
China’s major maize producing regions are divided into three agricultural zones due to their geographical location and resource endowments (Figure 1): the Northern Region, comprising six provinces (Heilongjiang, Jilin, Liaoning, Inner Mongolia, Gansu, and Xinjiang); the Huaihai Region, comprising six provinces (Henan, Shandong, Hebei, Shanxi, Shaanxi, and Anhui); and the Southwest Region, comprising five provinces (Sichuan, Yunnan, Guizhou, Guangxi, and Hubei).
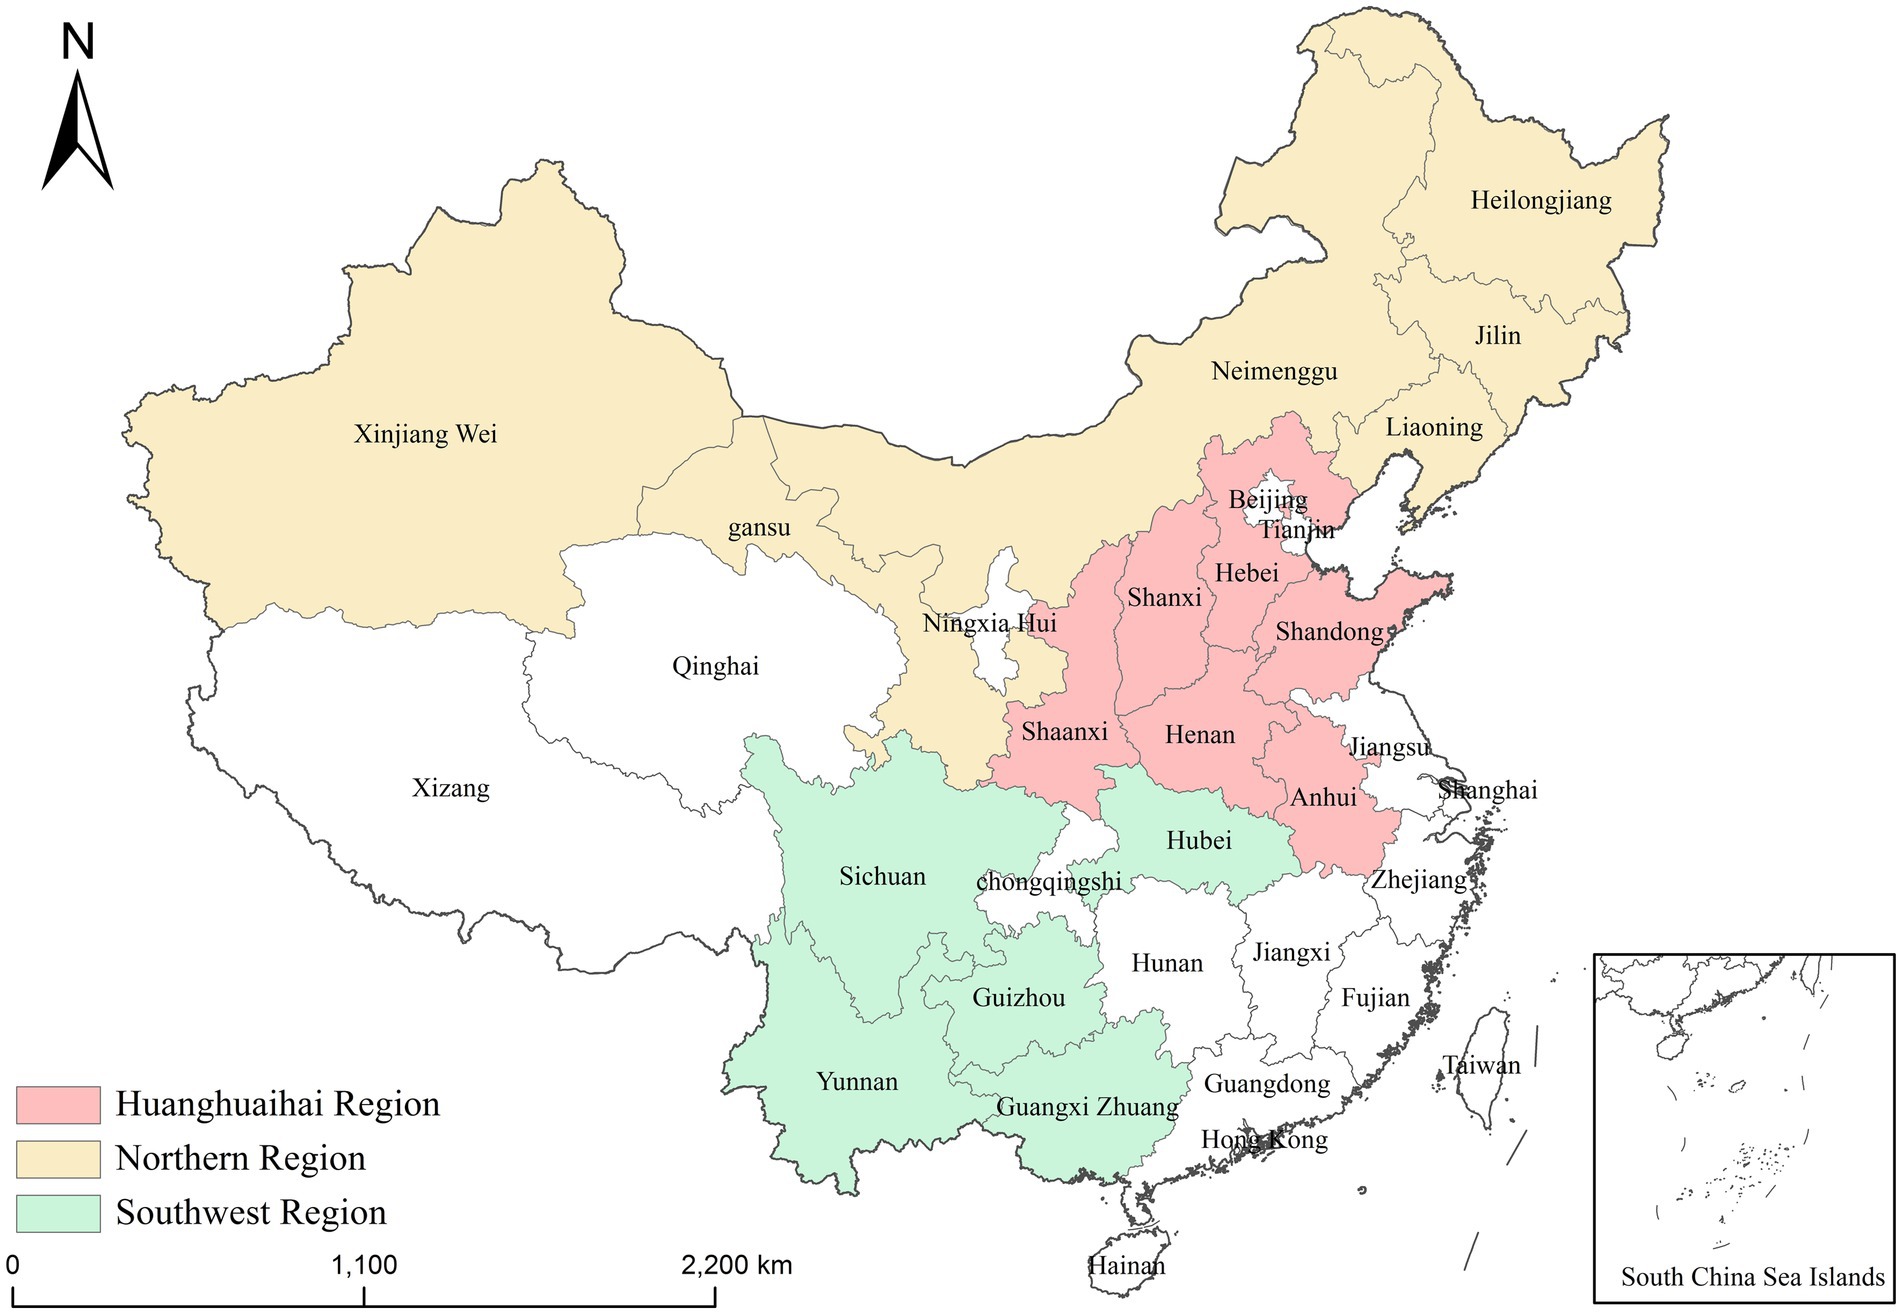
Figure 1. Three major maize-producing regions and 17 major producing provinces in China.
All seventeen of China’s major maize-producing provinces were selected for this study. These provinces are leading the nation in maize sown area and total maize production (Figure 2), while the total maize production of the 17 provinces studied accounts for 95.08% of China’s total maize production in 2022. They were chosen to be more representative of the study and reflect the changes in maize production in China (Kuo et al., 2022; Liu S. et al., 2022; Shuo et al., 2022).
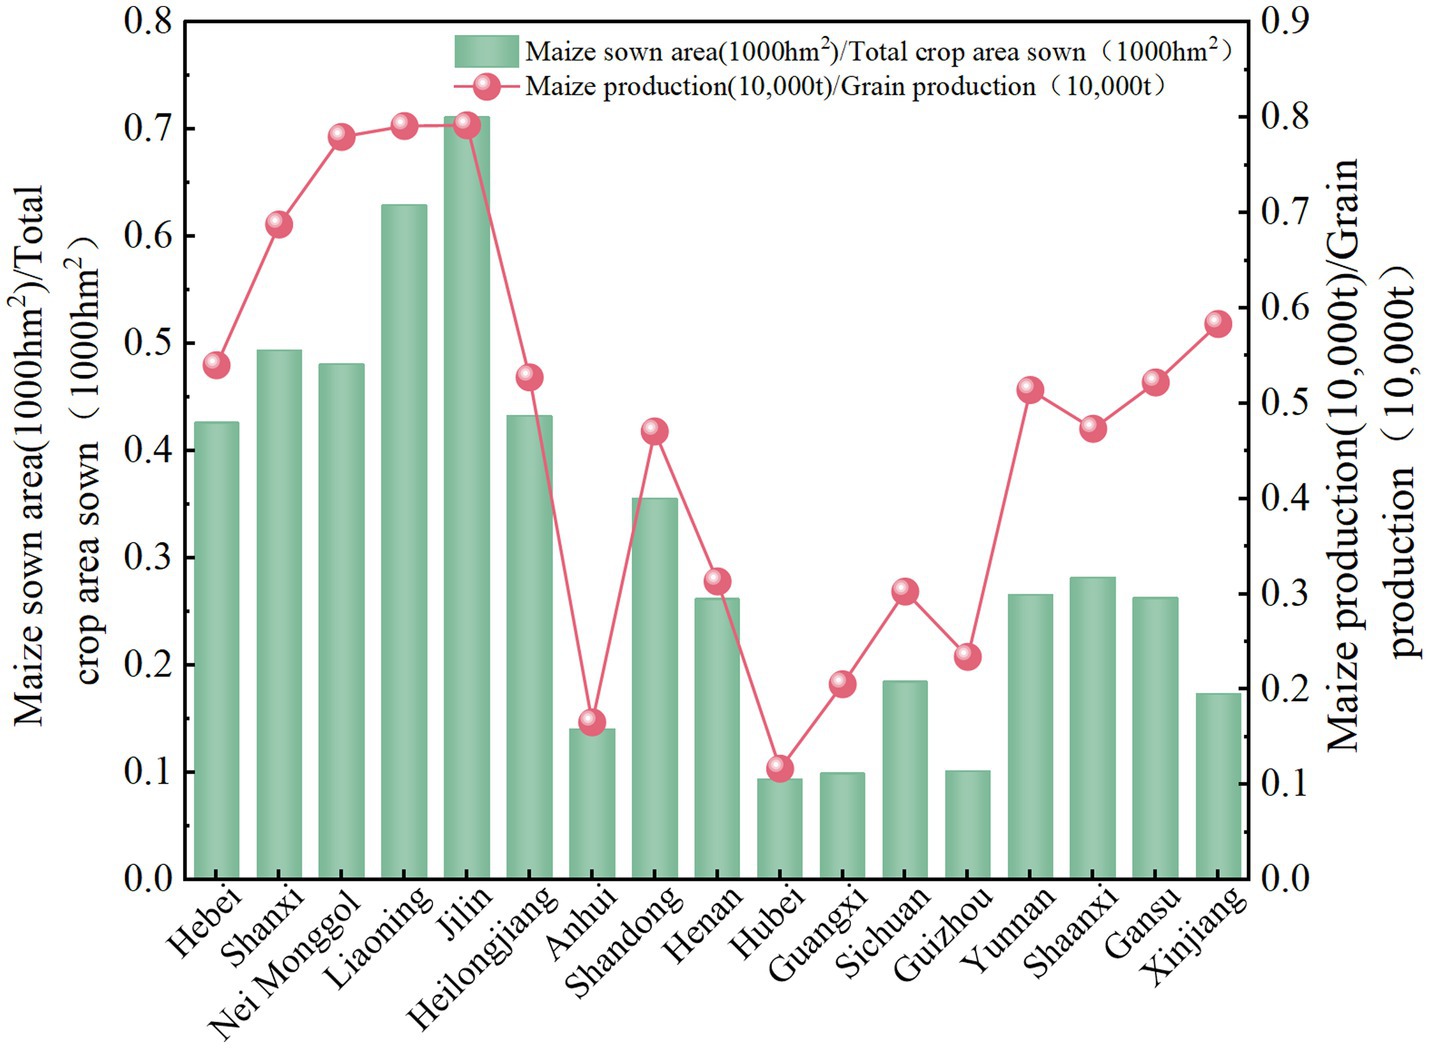
Figure 2. Total sown area and total production in China’s 17 major maize-producing provinces, 2021.
Figure 3 shows that China’s total maize production increased from 130,287,100 tons in 2004 to 27,255,06 tons in 2021, an increase of 1.09 times in production during the period; the sown area of maize expanded from 254,456,700 hectares to 433,242,400 hectares during the same period, an increase of 70.26%, and maize has become the largest sown area and most productive crop in China (Chen et al., 2022).China’s maize production has been growing consistently since 2004, but the study period was set at 2004–2020 based on data availability.
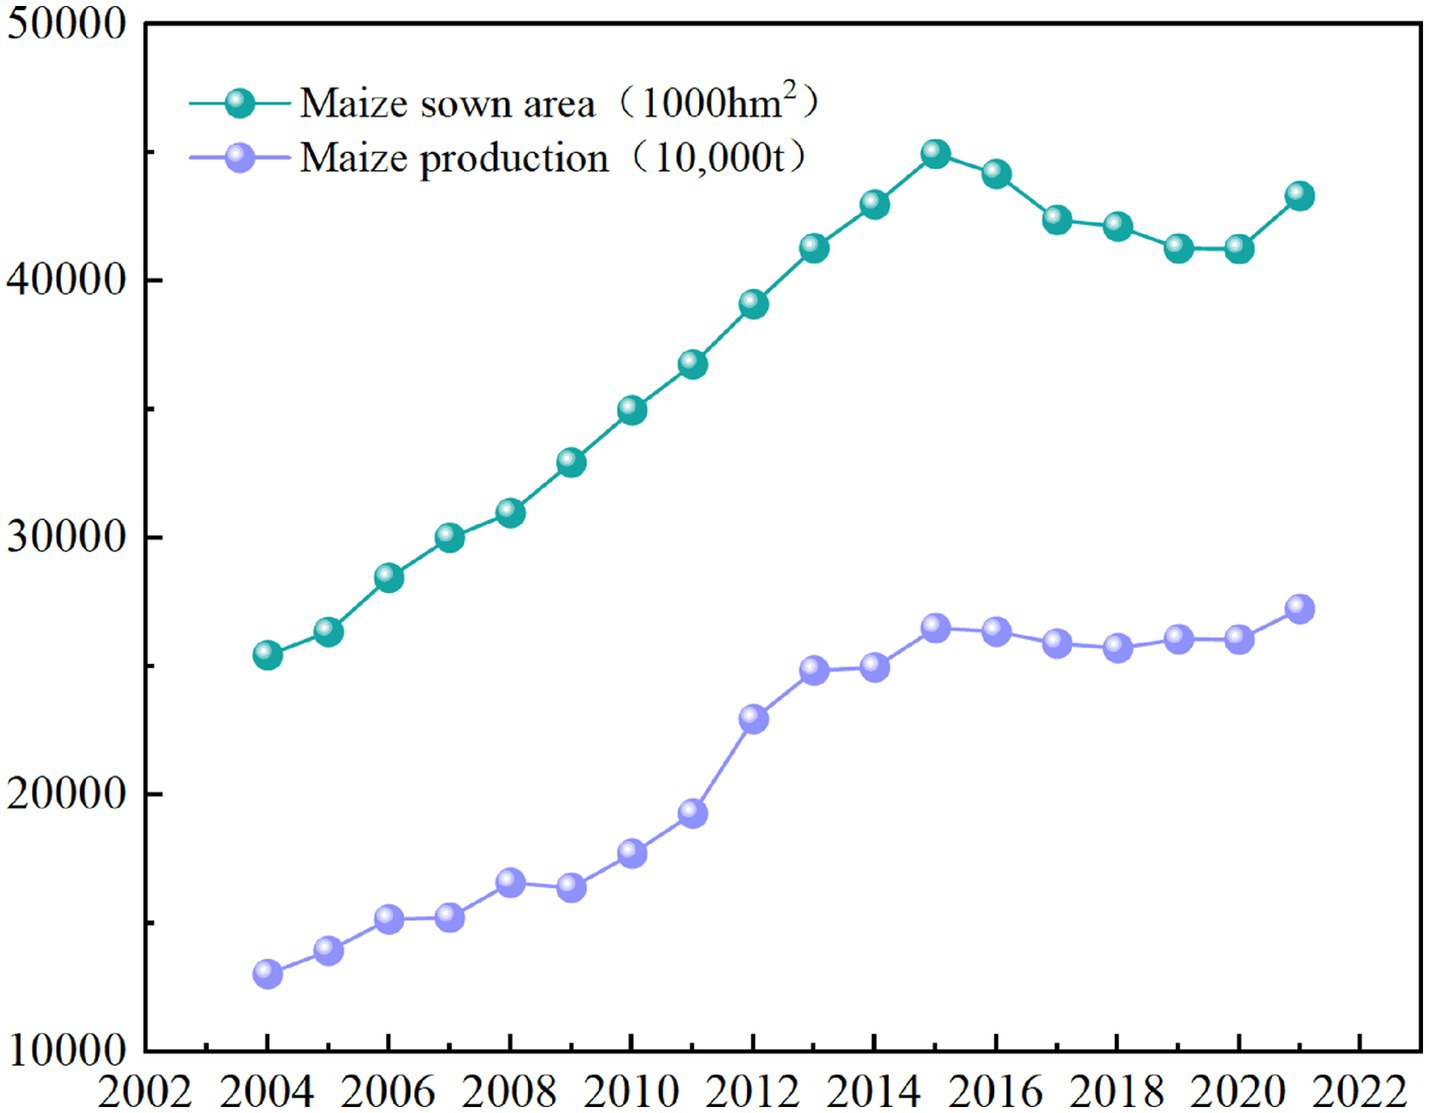
Figure 3. The change of maize sown area and production in China, 2004–2020.
2.2. Research methodology
2.2.1. Calculation of carbon emissions
In this study, carbon emissions are considered undesirable outputs. Based on the findings of previous scholars (Li et al., 2011; Xu T. et al., 2022), carbon emissions are calculated to include emission factors for five sources of carbon emissions, namely, pesticide use, converted fertilizer use, agricultural film, agricultural diesel use, and maize sown area (Table 1), calculated as:
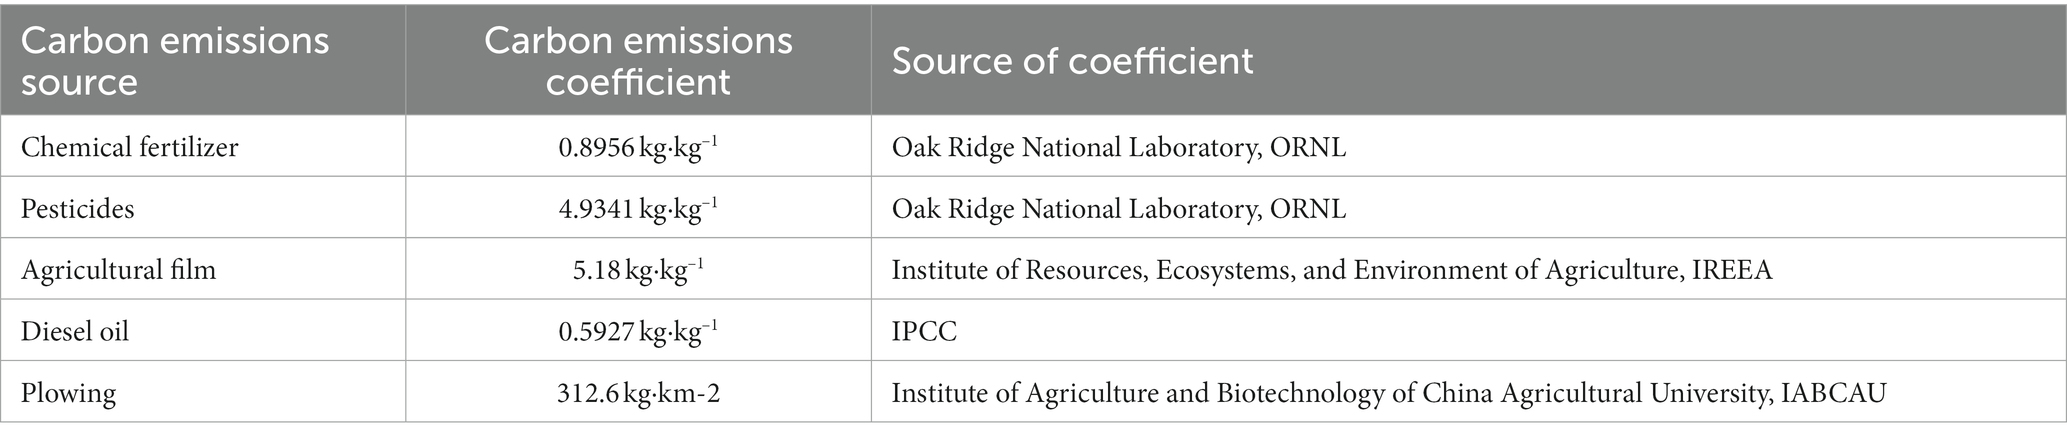
Table 1. Carbon emissions’ influencing factors and coefficients.
Where, E represents the total carbon emissions in maize production, Ei represents the emissions of various carbon emission sources, Ti is the number of each carbon source, and δ is the carbon emission coefficient of each carbon emission source. The carbon emissions coefficient is derived from the existing literature. Based on the existing literature, this paper gives a summary of the carbon emission coefficient for growing (Table 1).
2.2.2. Measurement of green total factor productivity (GTFP) in maize
In this study, MATLAB software combined with SBM-GML index was used to measure. The SBM model solves the slackness problem and productivity evaluation problem (Kumar et al., 2021; Shi et al., 2022). The basic form of the model is as follows:
where, denote inputs, desired outputs, and undesirable outputs, respectively; P, Q, and R represent the numbers of the three vectors, respectively; represent slack variables for inputs, desired outputs, and undesirable outputs (carbon emissions), respectively; is the weighting percentage.; denotes constant returns to scale, or variable returns to scale if this constraint is removed. The objective function of SBM represents the ratio of input–output efficiency, and the SBM model measures only static productivity. This study uses the GML to measure the change in GTFP in Chinese maize agriculture by referring to Tone and Oh’s research findings. The GML index can be expressed as:
GTFP in agriculture rises when GML > 1 and falls when GML < 1. The GML index is decomposed into technical efficiency and technical progress, with GEC denoting the technical efficiency index and GTC representing the technical progress index.
2.2.3. Spatial empirical methods
2.2.3.1. Estimation of Moran’s I index
The global spatial correlation reflects the overall characteristics of the spatial association of variables and is often measured by the global Moran’s I index (Chen and Shen, 2020; Pinto et al., 2021), which can be written as Equation 4.
where, S2 is the variance of the sample and ωij is the (i, j) element of the spatial weight matrix. Moran’s I index ranges from −1 to 1, where a value greater than 0 indicates a positive correlation between regions, and the closer the value is to 1, the greater the correlation; similarly, a value less than 0 indicates a negative correlation between regions. When I = 0, the variable is not spatially correlated, and the variables are not spatially correlated when I = 0. In the selection of the spatial weight matrix ωij, the geographical distance weight matrix is chosen in this study. The geographical distance between the capital cities of the two provinces is calculated by latitude and longitude, and the reciprocal of the distance is used as the weight setting, i.e., wij = 1/dij, if i ≠ j; and wij = 0, if i = j.
2.2.3.2. Spatial Durbin model
It has been shown that agricultural GTFP exhibits a strong spatial correlation. Therefore, to examine the spatial autocorrelation of maize GTFP, traditional econometric regression models are no longer applicable, and this paper chooses to use spatial econometric models to analyze the intrinsic relationships. The more commonly used spatial econometric models include the spatial lag model (SLM), also known as the spatial autoregressive model (SAR), the spatial error model (SEM), and the spatial Durbin model (SDM), which under certain conditions can be formed into a spatial lag model and a spatial error model (Pan et al., 2021; Gu et al., 2022). In this paper, we construct a spatial econometric model to investigate the factors influencing GTFP in the main maize-producing areas of China. This will be followed by an LR test to verify whether the spatial Durbin model (SDM) degenerates into a spatial lag model and a spatial error model.
Where, i denotes the ith maize-growing province and city, t denotes the year of observation, ρ is the spatial autoregressive coefficient of the explanatory variable (maize GTFP), αi is the coefficient of the influencing factor variable, μi is a regional fixed effect, δt is a time fixed effect, and εit is the residual term.
2.3. Description of variables
2.3.1. Input–output indicator selection
The accounting system for maize GTFP includes both input and output components. Choosing the right input and output variables is the key to measuring maize GTFP (Xu Q. et al., 2022). The three main types of input indicators are labor, agricultural materials, and land resources (Hlahla, 2022). Output indicators are divided into two main categories (Liu et al., 2023): desired output and undesired output. Drawing on the existing literature (Ma et al., 2022) combined with the characteristics of maize production, the input–output variables in this study were selected as shown in Table 2.
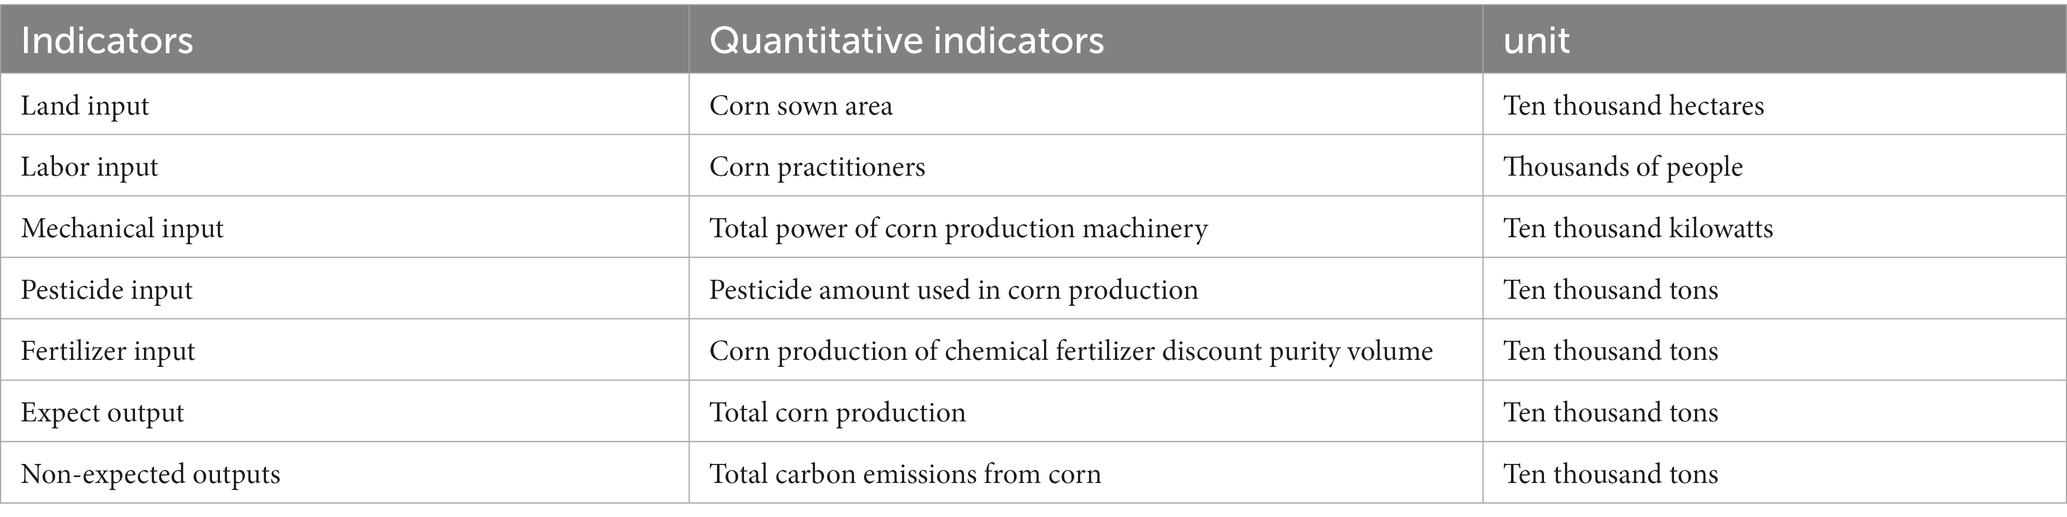
Table 2. Selection of input–output variables.
2.3.2. Selection of indicators for influencing factors
When carbon emissions are taken into account, the GTFP of maize mostly reflects how much the existing inputs of production materials contribute to the output. Based on the current maize production situation in China and the research results of other scholars (Zhang et al., 2021; Xing et al., 2023; Yao et al., 2023), the following indicators were chosen as the factors that affect maize’s GTFP.
2.3.2.1. Explanatory variables
In this paper, maize GTFP is used as the explanatory variable, while maize GTFP is calculated from the SBM-GML index, which includes non-desired outputs. However, maize GTFP, as measured directly by the SBM-GML index, is a dynamic indicator. Therefore, it must be transformed by it. The year 2004 is set as the base period, and the GTFP for that year is specified as 1. The GTFP for other years is obtained by multiplying it cumulatively.
2.3.2.2. Explanatory variables
The key factors affecting GTFP include infrastructure, business conditions, and natural climate change. With reference to studies on the factors impacting GTFP in agriculture (Li et al., 2022), the following explanatory variables are selected in this paper: (1) The level of economic development (GDP), expressed using regional GDP per capita. (2) The level of urbanization (URB), expressed using the share of the non-farm population in the total population. (3) The level of agricultural natural disasters (ADR), as measured by the ratio of the area affected to the total area sown by crops in the region. (4) Regional human capital (HC), expressed using the average number of years of schooling of the regional labor force. (5) Maize cultivation structure level (CPS), expressed as a share of the maize-sown area in the crop-sown area. (6) The level of financial support to agriculture (FSA), as measured by the expenditure on agriculture, forestry, and water in each province in a calendar year. (7) The level of agricultural mechanization (MACH), is measured by the ratio of total regional agricultural machinery power to total crop sown area.
2.4. Data sources and descriptive statistics
This paper uses 17 major maize-producing provinces in China as the study area, and the study spans the period 2004–2020. Data on inputs and outputs in the maize GTFP accounting were obtained from the 2005–2021 National Compilation of Agricultural Costs and Returns and the China Rural Statistical Yearbook. The National Compilation of Agricultural Costs and Returns, the China Agricultural Statistical Yearbook, regional yearbooks, and the EPS database were used to get information about other variables. Table 3 shows the results of the descriptive statistical analysis of the research data. In addition, the measurement results of this paper were mainly realized through Stata 17 software.
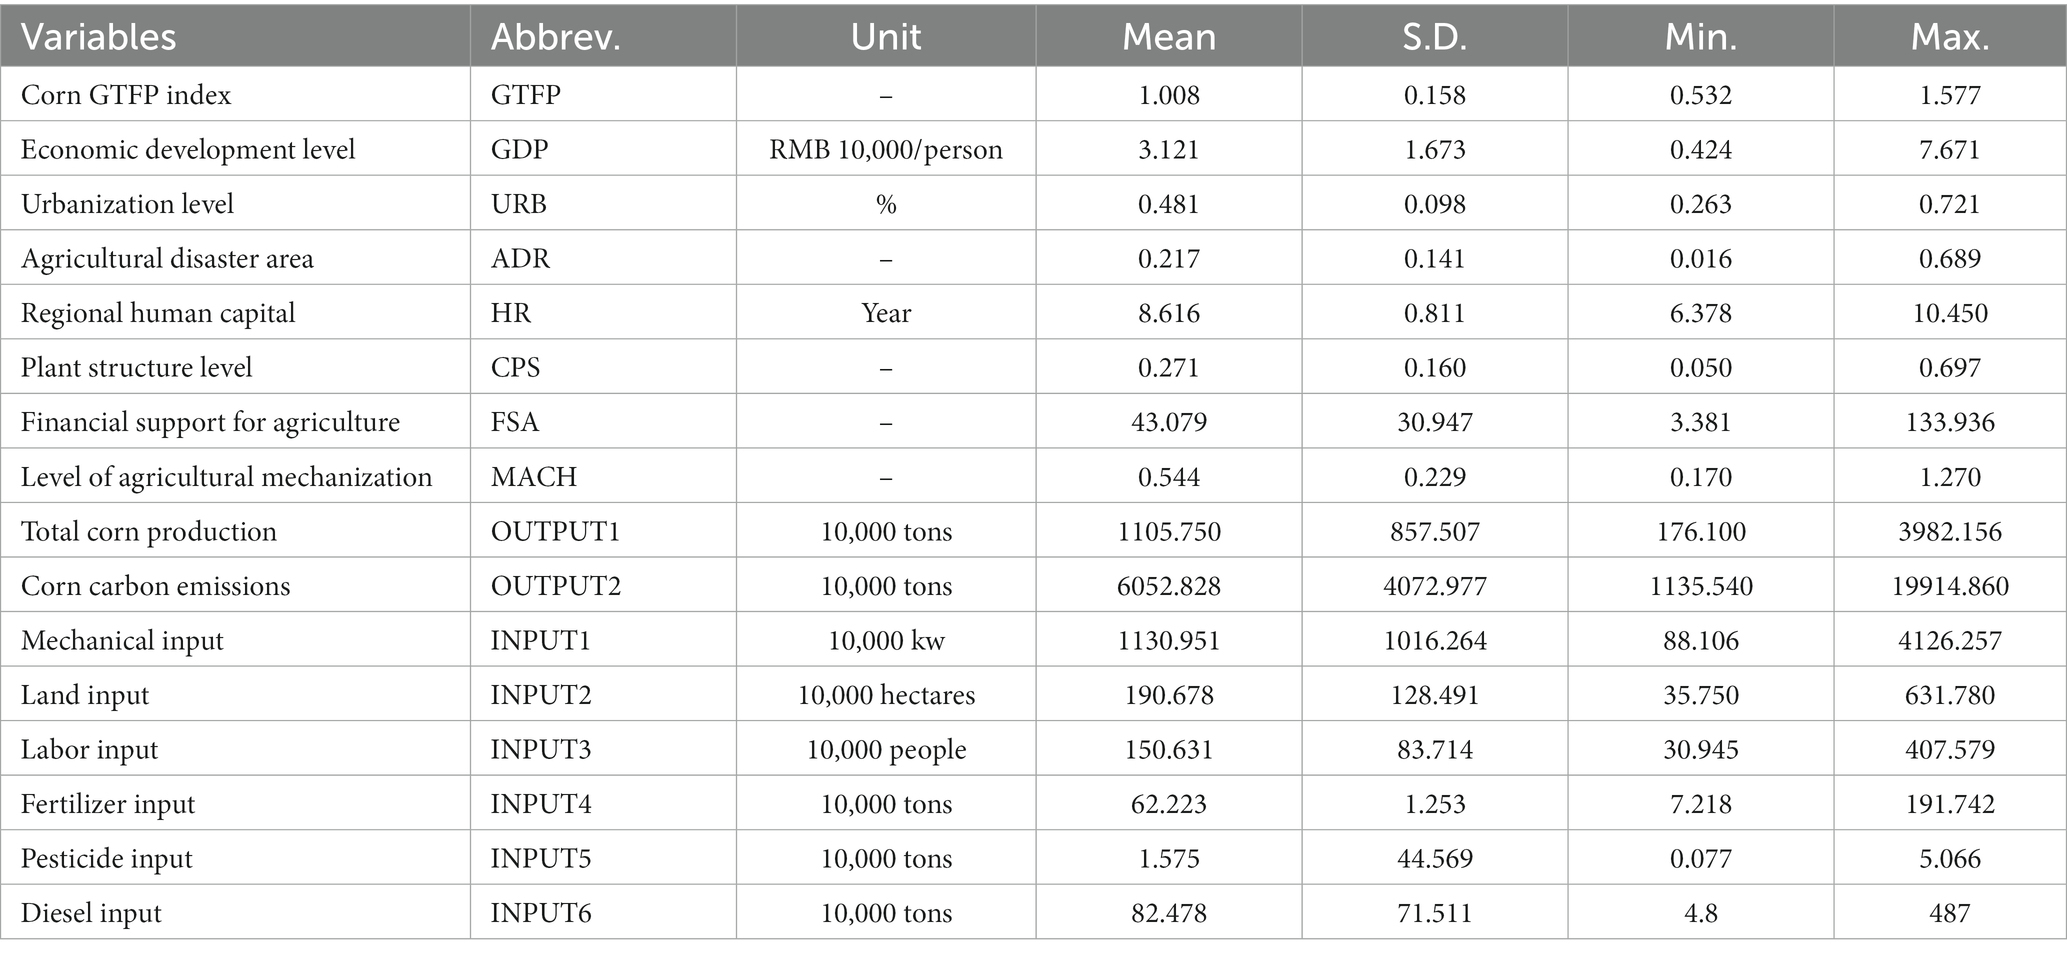
Table 3. Descriptive statistics for all variables.
3. Results
3.1. Measurement of GTFP in maize in China
3.1.1. Chinese maize GTFP in a time-series perspective
The dynamic maize green total factor productivity (GTFP), maize green technical efficiency (GEC), and maize green technical progress (GTC) in the main maize-producing areas of China from 2004 to 2020 were measured using Matlab software based on the SBM-GML method, as shown in Figure 4. As can be seen in Figure 4, China’s maize GTFP showed an overall “M”-shaped fluctuation during the study period, with sustained growth over a longer period from 2013 to 2018. From 2004 to 2014, China’s maize GEC was higher than China’s maize GTC for many years; from 2015 to 2020, China’s maize GTC outpaced maize GEC, with an overall upward trend in maize GTFP driven by technological progress; and from 2013 to 2020, maize GTC was basically the same as maize GTC. In 2013–2020, maize GTC largely kept pace with maize GTFP, suggesting that the source of growth in maize GTFP was mainly maize green technological progress (Gao et al., 2022; Liu S. et al., 2022).The possible reason is that maize, as one of the three main grains in China, is easy to popularize agricultural technology in the process of maize production, which is conducive to the growth of GTFP of maize.
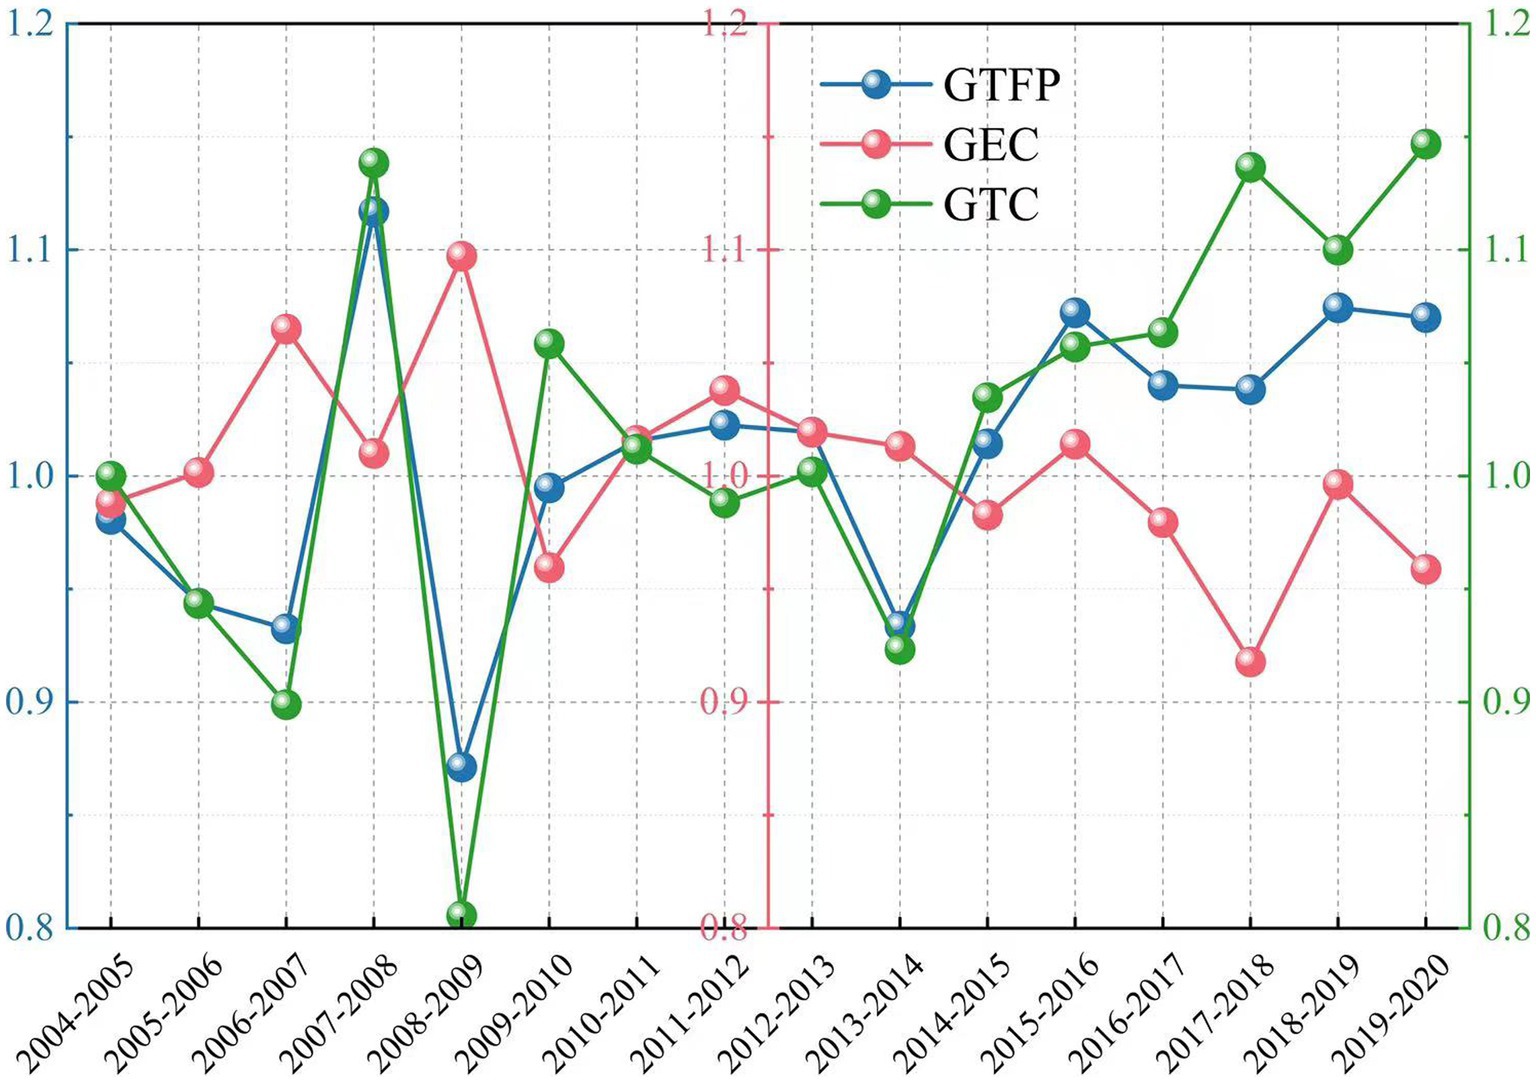
Figure 4. GTFP and its decomposition for maize production in China, 2004–2020.
Table 4 shows the change in GTFP and its decomposition index for the main maize-producing areas from 2004 to 2020. There has been a long-standing and unavoidable pattern of unrefined agricultural growth that depletes resources and pollutes the environment, and the maize GTFP that reflects this reality is closer to the actual efficiency of maize production. Overall, the average value of GTFP in China’s major maize-producing areas from 2004 to 2020 is 1.008. Even though there is a general trend toward more efficiency, the growth of maize GTFP is weak, mainly due to the large decline in maize GTFP in the early years, which slowed down the growth dynamics.
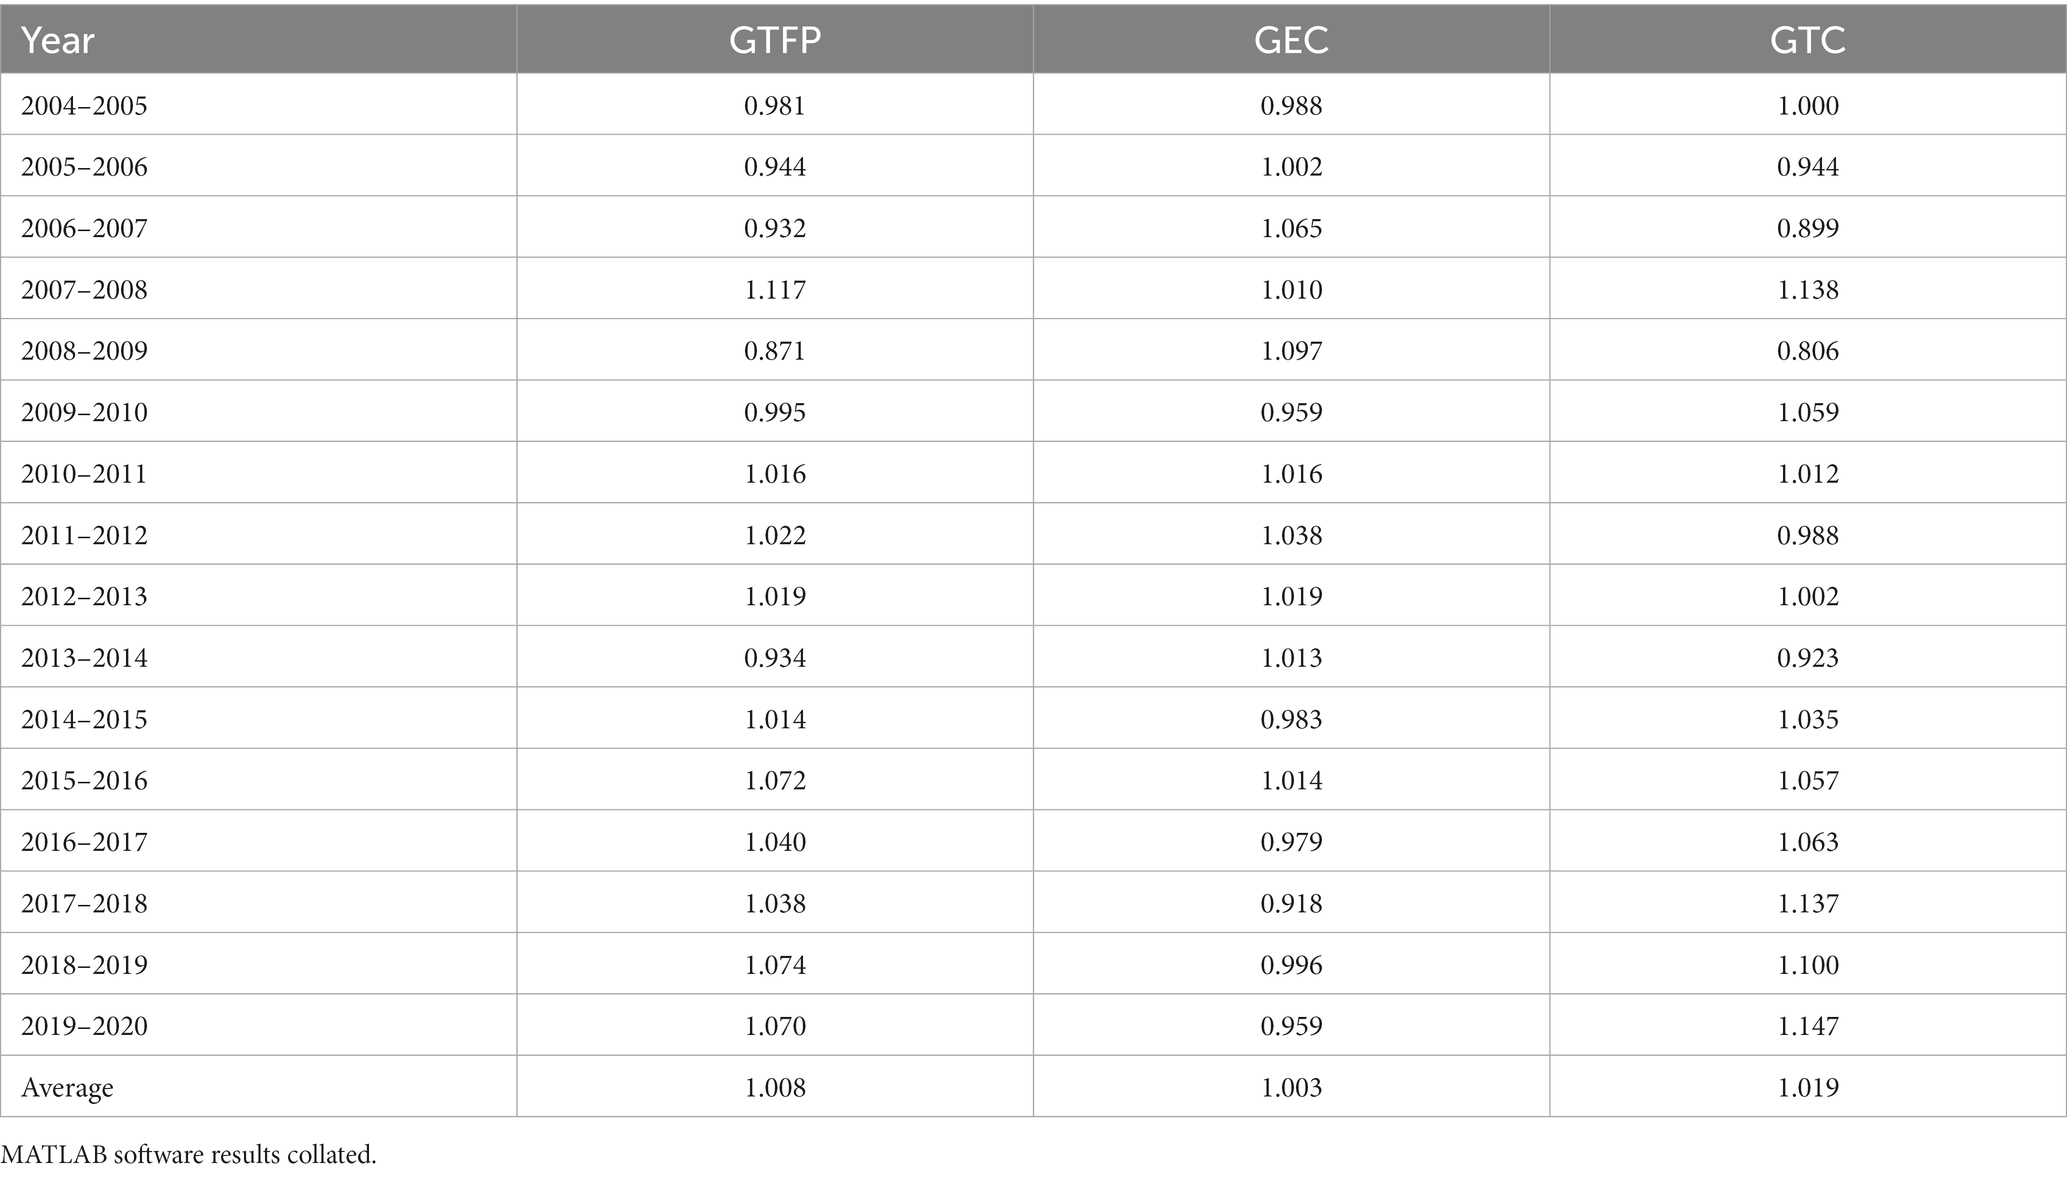
Table 4. Values of GTFP, GEC, and GTC for maize production in China, 2004–2020.
The dynamics of agricultural GTFP in the major grain-producing regions in 2002–2019 can be broadly discussed in the following three phases: (1) From 2004 through 2009, it can be seen that GEC drove GTFP, while GTC hindered its enhancement, and the impact of GTC on GTFP was more significant. Therefore, the drive of GEC failed to compensate for the negative effect of GTC, thus preventing GTFP from improving. (2) Between 2010 and 2016, GEC remained dominant, showing significant fluctuating growth with a significant positive effect on the change of GTFP, and the improvement of GTC had a significant impact on GTFP when the two-way driving effect of GEC and GTC enabled GTFP to improve effectively. (3) Between 2016 and 2020, the development of green technology in China significantly improved, in which the change in GTC is the main one and has a significant positive effect on the change in GTFP, while the effect of GEC on GTFP is negative. The improvement in GTC can compensate for the negative effect caused by the decline in GEC, which in turn promotes the improvement in GTFP. During this period, the development of green technology was an important factor contributing to the increase in GTFP, which could be attributed to the introduction of government policies on non-point source pollution, which increased investment in new technologies, thus promoting the development of green technology and thus the increase in GTFP (Huang et al., 2022).
3.1.2. The spatial perspective of Chinese maize GTFP
The annual average GTFP change indices and decomposition indices for the 17 provinces in China’s major maize-producing regions and the northern region, the Yellow and Huaihai Sea region, and the southwest region from 2004 to 2020 are shown in Table 5. At the provincial level, from 2004 to 2020, 15 provinces (Heilongjiang, Jilin, Liaoning, Neimenggu, Xinjiang, Henan, Shandong, Hebei, Shanxi, Shaanxi, Anhui, Sichuan, Yunnan, Guizhou, and Guangxi) have an agricultural GTFP change index greater than 1, and only two provinces (Gansu and Hubei) have a maize GTFP change index less than 1.
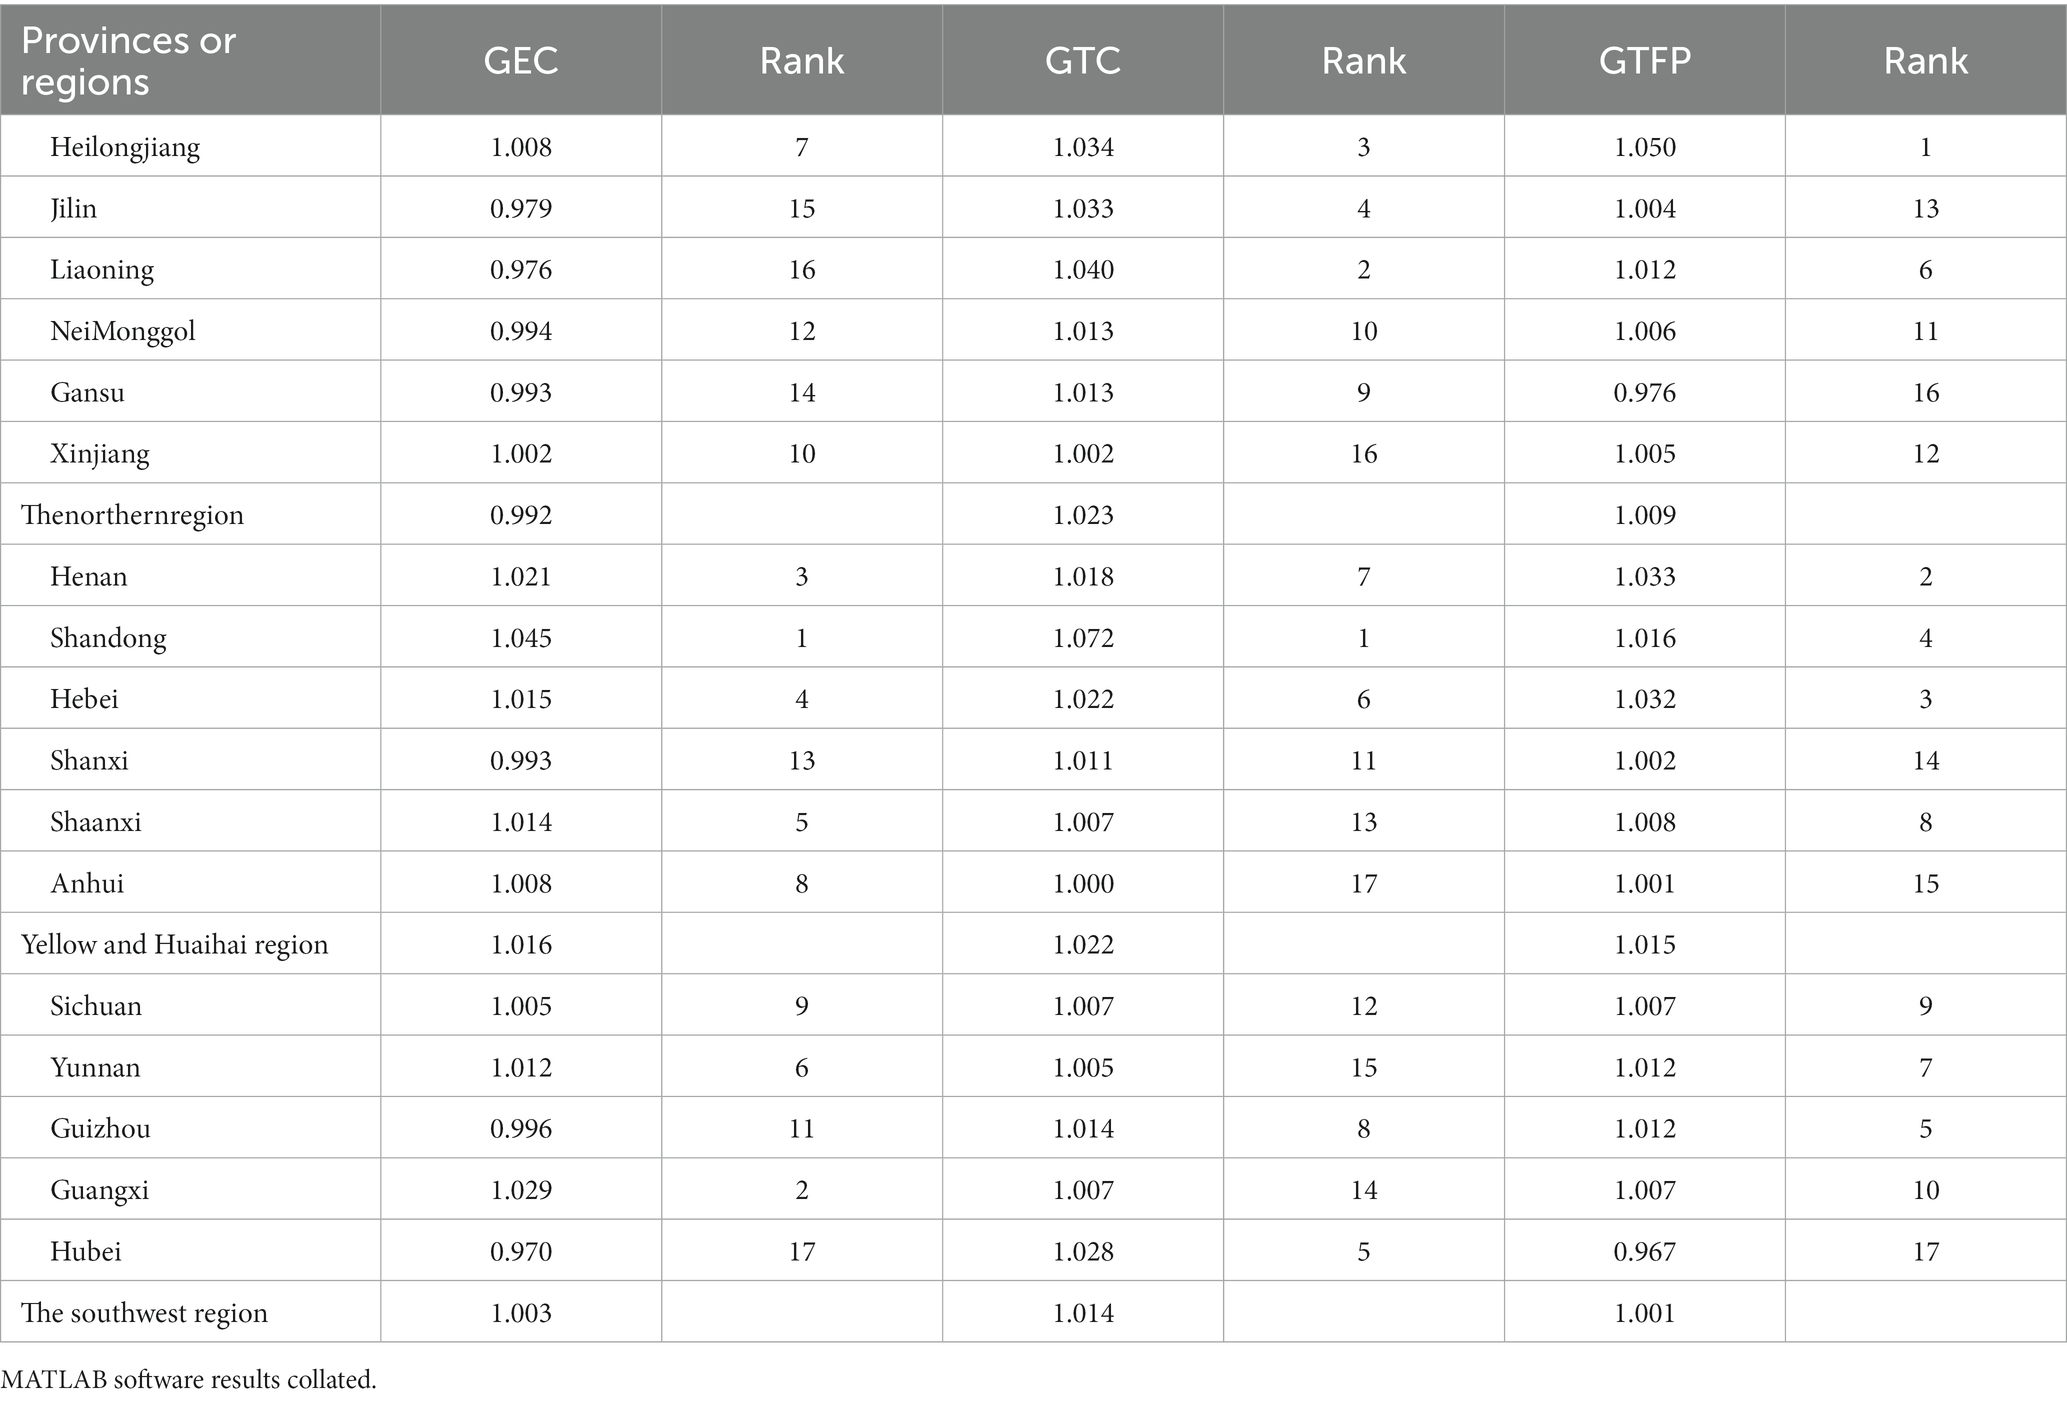
Table 5. Comparative analysis of maize GTFP, GEC, and GTC by major maize-producing areas in China, 2004–2020.
The majority of provinces were able to keep making progress toward being green and efficient. Among them, Heilongjiang ranks first in the GTFP for maize with a GTFP change index of 1.050, while Hubei ranks last with a GTFP change index of 0.967, making the difference in maize GTFP between provinces more obvious. According to the indices of GTFP, GEC, and GTC in the major maize-producing provinces, they are divided into the following three types: (1) The high-efficiency zone of maize green production (Heilongjiang, Henan, Hebei, Shandong, Guizhou, and Liaoning). The difference between GEC and GTC in these provinces is small, suggesting that both GEC and GTC are driving maize GTFP growth. The balance between economic growth and environmental friendliness in maize production is well achieved. (2) The medium maize green production efficiency zones (Yunnan, Shaanxi, Sichuan, Guangxi, Neimenggu, and Xinjiang), where the degree of improvement in agricultural green production is relatively small. This can be explained by the immaturity of early agricultural production systems, the relatively weak awareness of environmental protection and resource conservation among farmers, and the frequent occurrence of natural disasters, which eventually resulted in a slightly declining GTFP. (3) Maize green production efficiency zones (Jilin, Shanxi, Anhui, Gansu, and Hubei), which had an average annual maize GTFP index of less than 1 in these provinces from 2004 to 2020 and whose overall production efficiency was in retreat due to their primitive agricultural production practices.
At the regional level, the best result in green maize production is in the Yellow and Huaihai regions, with a maize GTFP variation index of 1.015, it may be caused by the different level of economic development, technological innovation strength and technological improvement efficiency among different regions, and the maize GTFP of three provinces, Henan, Hebei, and Shandong, is greater than the average of all provinces. Lastly, the southwest region has a maize GTFP index of 1.001, but the overall agricultural GTFP is still on the rise between 2004 and 2020, with Sichuan, Guangxi, and Hubei provinces all ranking lower. Therefore, it is necessary to improve the green production status of maize in the southwest region.
Table 5. Comparative analysis of maize GTFP, GEC, and GTC by major maize-producing areas in China, 2004–2020.
3.2. Spatial correlation test
Before establishing a spatial measure, a pre-test for spatial autocorrelation must generally be conducted. The most famous ones are the Moran’I index, the Gearys’C index, and the Getic-Ord index, while the Moran’s I index is now preferred for testing among most studies (Maya et al., 2019). From the results of the global Moran’s I index test, it was observed that maize GTFP was significant and positive in the majority of years, indicating a strong spatial autocorrelation of agricultural GTFP. The global Moran’s I test shows that maize GTFP in China shows a strong spatial dependence in all years. The global Moran’s I test (Table 6) shows that the maize GTFPs in China all exhibited strong spatial dependence.
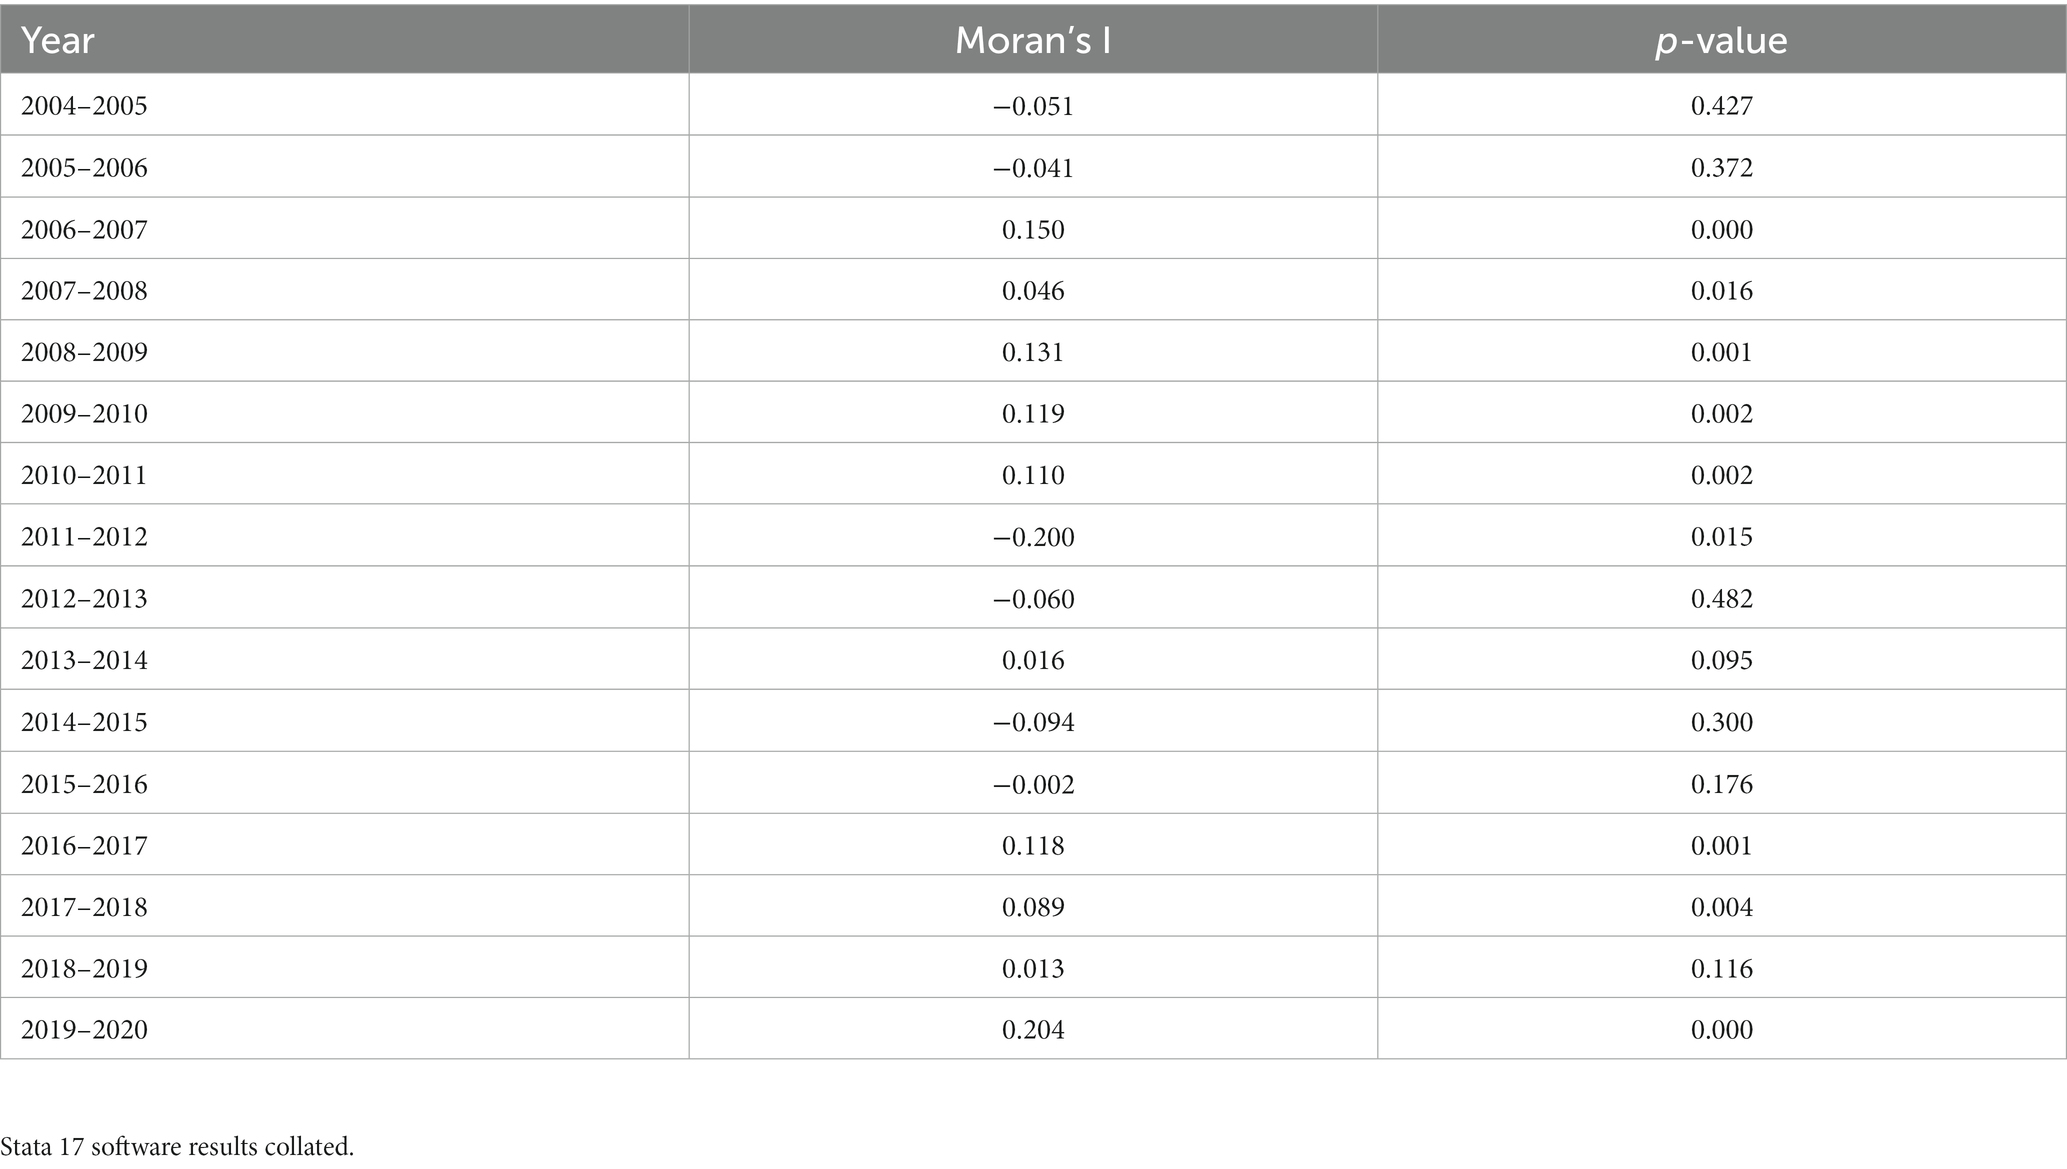
Table 6. Global Moran’s I test in 2004–2020.
3.3. Spatial regression results
The Hausman test was used to determine whether fixed effects or random effects were used for the spatial regressions, and the results were significant at the 1% level, rejecting the original hypothesis that fixed effects were better than random effects. In the selection of the spatial econometric model, the spatial lag model (SAR), the spatial error model (SEM), and the spatial Durbin model (SDM) were regressed under the selected geographic distance weight matrix, and the LR test was applied to verify whether the spatial Durbin model (SDM) would degenerate into the spatial lag model (SAR) and the spatial error model (SEM), and the statistical value results were significantly positive at the 1% level. Significantly positive; therefore, the final regression results of the Durbin spatio-temporal stationary model were selected for analysis as follows (Table 7).
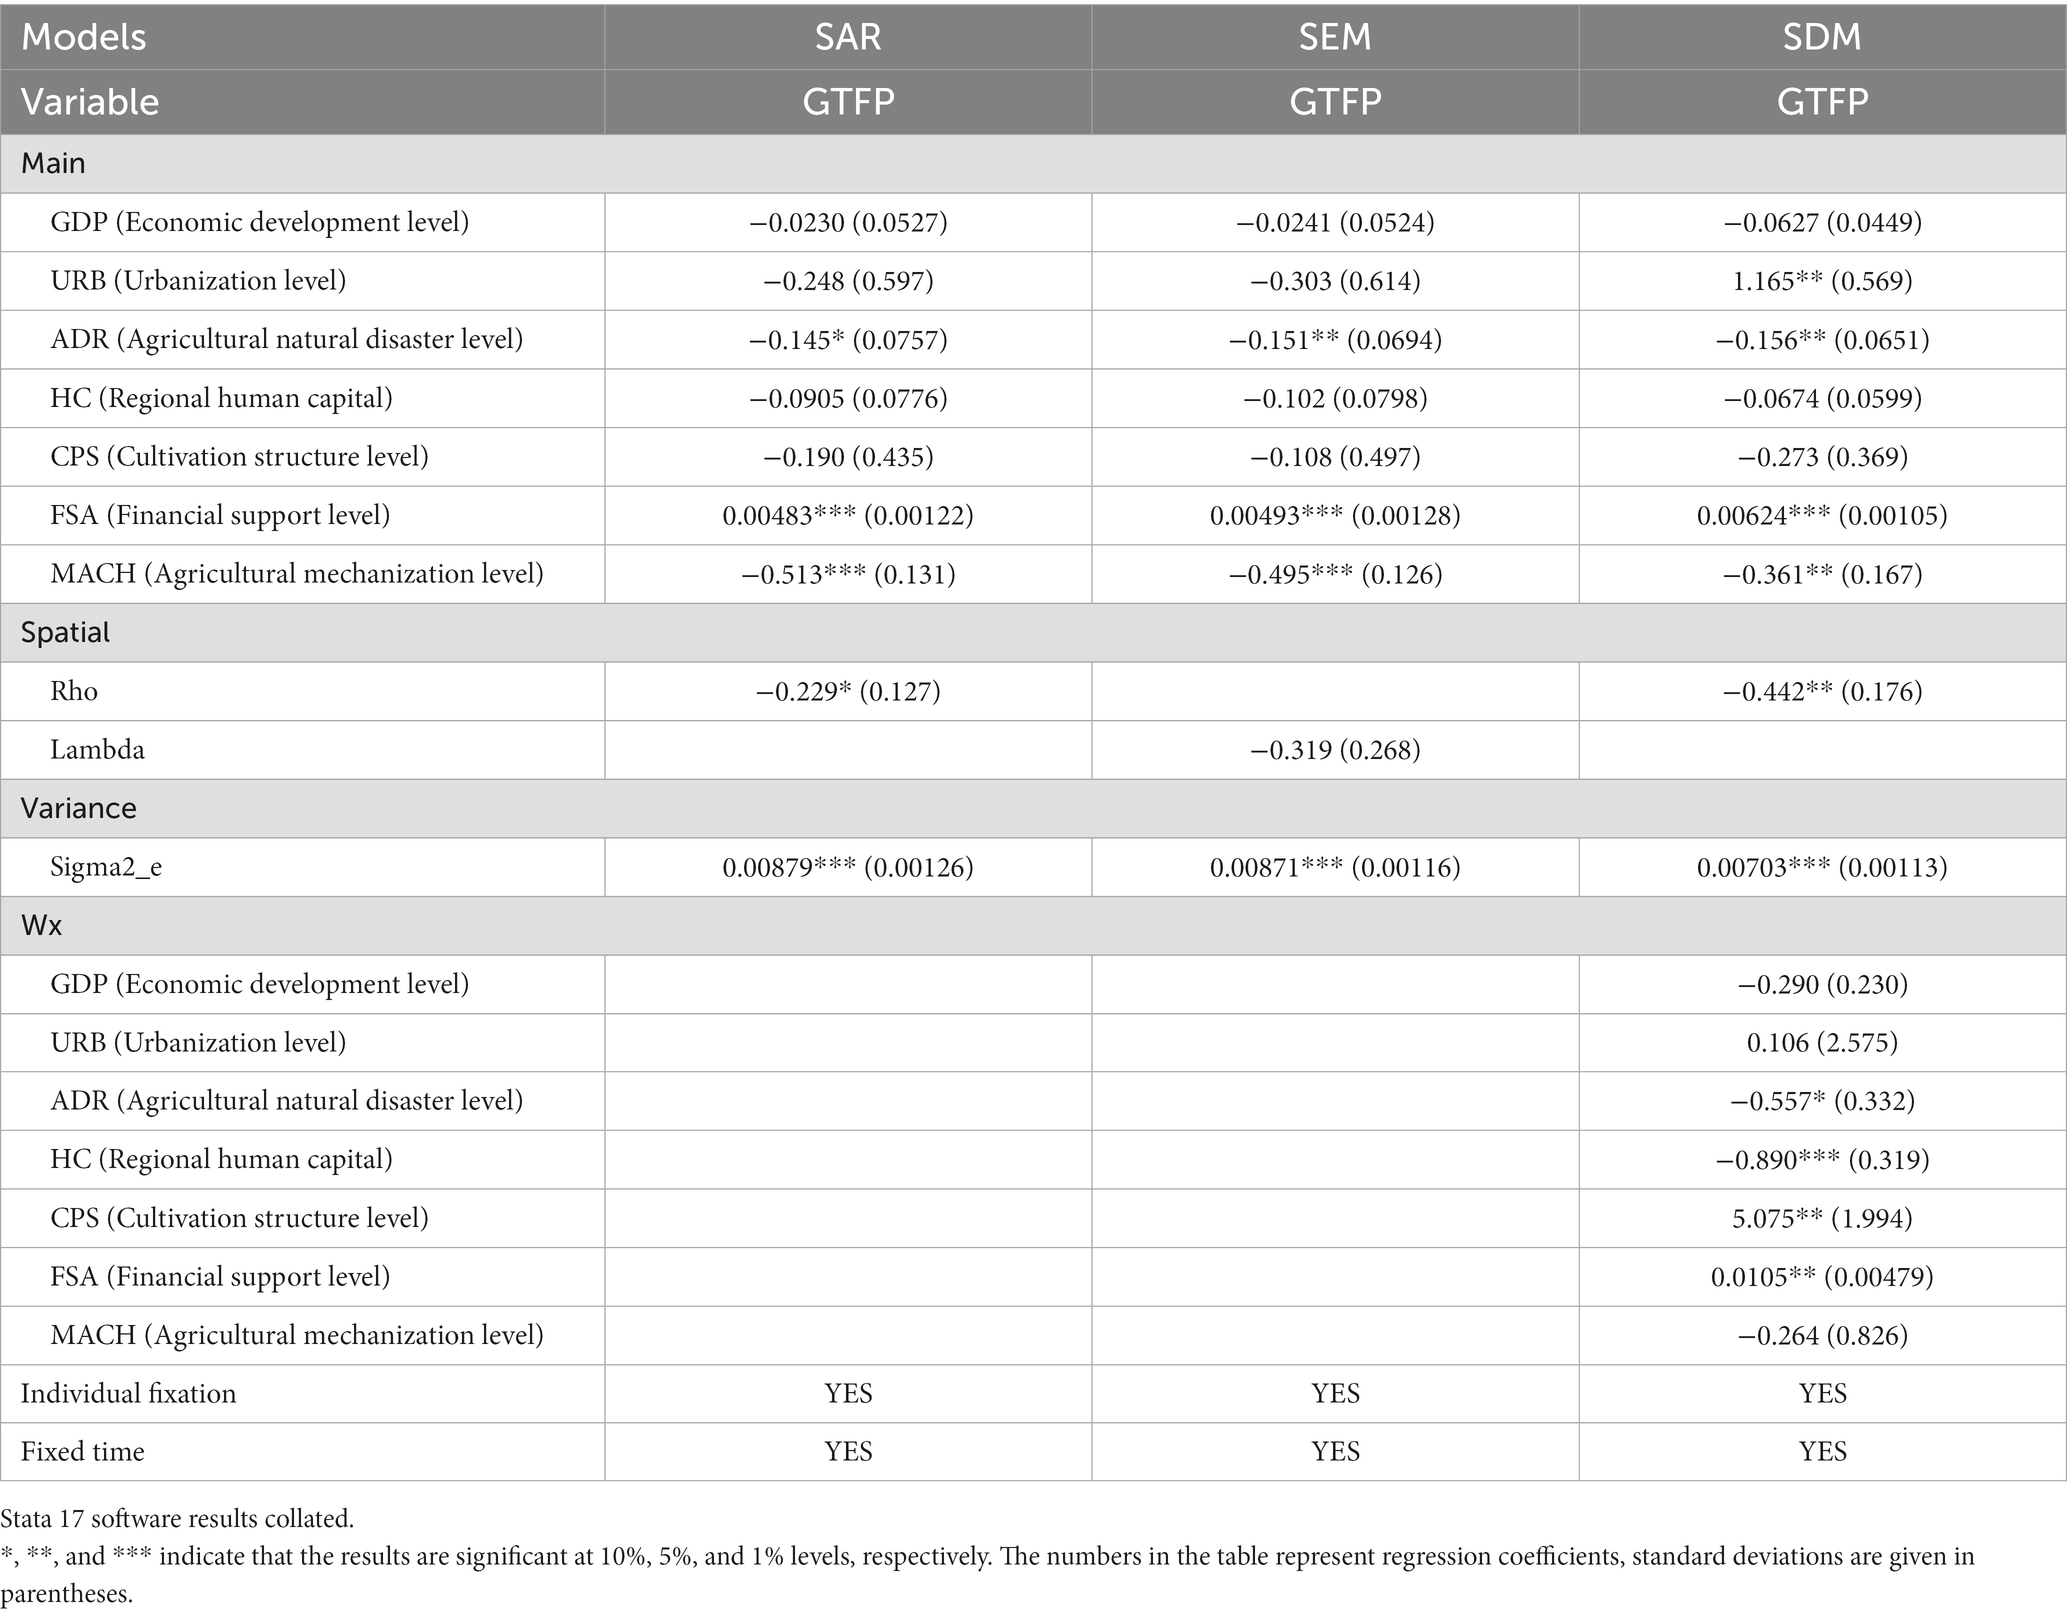
Table 7. Empirical regression results.
In the spatial Durbin model, the coefficients of the direct effects of the level of urbanization and the level of financial support to agriculture were both significantly positive, which indicates that these variables helped increase maize GTFP. On the other hand, the level of agricultural disaster and the level of agricultural mechanization, both of which were significantly negative at the 5% level, slowed the growth of maize GTFP. However, the regression coefficients of economic development level, regional human capital, and maize planting structure level were not significant, but the coefficient of the spatially lagged term of regional human capital was significantly negative at the 1% level and the coefficient of the spatially lagged term of maize planting structure level was significantly positive at the 5% level, indicating that the effect of high or low regional human capital and a reasonable maize planting structure level on maize GTFP in the province was not significant. The coefficient of the spatially lagged term is positive at the 5% level. In addition, the coefficient of the spatially lagged term of the degree of agricultural disaster is significantly negative at the 10% level, showing a negative spatial spillover effect on the GTFP of agriculture in neighboring provinces, while the coefficient of the spatially lagged term of the level of financial support to agriculture is significantly positive at the 5% level, showing a positive spatial spillover effect on the GTFP of agriculture in neighboring provinces.
3.4. Decomposition of spatial effects
Table 8 shows the results of the effect decomposition of the spatial Durbin model. The significant influences are explained in this study as follows:
1. The regression coefficient for the level of urbanization (URB) is significantly negative at the 10% level, with each unit of elevation reducing the maize GTFP by 1.550 units, and its direct and indirect effects are both negative, indicating that the rural population moves to a certain extent into the urban, it not only inhibits the elevation of the maize GTFP in the region but also hinders the development of the maize GTFP in neighboring areas.
2. In terms of direct effects, the coefficient of the impact of the level of agricultural natural disasters (ADR) on the GTFP of maize in the region was negative and passed the 1% significance test. This indicates that the level of agricultural natural disasters had a negative, hindering effect on the GTFP of maize in the region. In the indirect effect, the coefficient of the effect of the level of agricultural natural disasters on GTFP in the surrounding area was positive and passed the significance test at the 10% level. This indicates that the level of agricultural disaster has a positive effect on the GTFP of maize in geographically adjacent areas.
3. For every additional unit of regional human capital (HC), maize GTFP goes down by 0.229, which is not statistically significant. The effects of direct and spatial spillover are 0.156 (significant at the 1% level) and −0.385 (significant at the 5% level), respectively. The results indicate there is a certain offsetting effect between the direct and indirect effects, which ultimately makes the total effect insignificant, so it is necessary to reasonably guide the flow of talents between provinces to bring into play the positive externalities of human capital.
4. For every 1 unit increase in cropping structure (CPS), maize GTFP increases by 1.145, which mainly comes from the direct effect. The indirect effect is not statistically significant, which indicates that the adjustment of crop structure only positively affects maize GTFP in the province and does not significantly affect the optimization or deterioration of maize GTFP in the surrounding areas.
5. For every 1 unit increase in financial support to agriculture (FSA), maize’s GTFP goes up by 0.00936. Its growth contribution is primarily attributable to its direct effect (0.00752). The effect of its spatial spillover is insignificant, which implies the need to improve policies to support agricultural development as well as increase financial investment to promote sustainable agricultural development.
6. Using mechanization (MACH) can help make the best use of production resources, bring in more advanced technologies for agricultural production, and help the province’s maize GTFP grow by making technological progress. But China’s level of mechanization in agriculture is not yet at the same level as that of developed countries. So, creating an imbalance between supply and demand, which always leads to fierce competition on the domestic market and the province’s aggressive development of agricultural mechanization will lead to a situation where supply and demand are not in balance. The vigorous development of agricultural mechanization in the province will hinder the development of mechanization levels in neighboring provinces, inhibiting the growth of agricultural GTFP in neighboring provinces.
7. In terms of the level of economic development (PGDP), as the economy continues to develop, it will hinder the growth of maize GTFP in the region, but will promote the growth of maize GTFP in the surrounding areas, but none of it is significant.
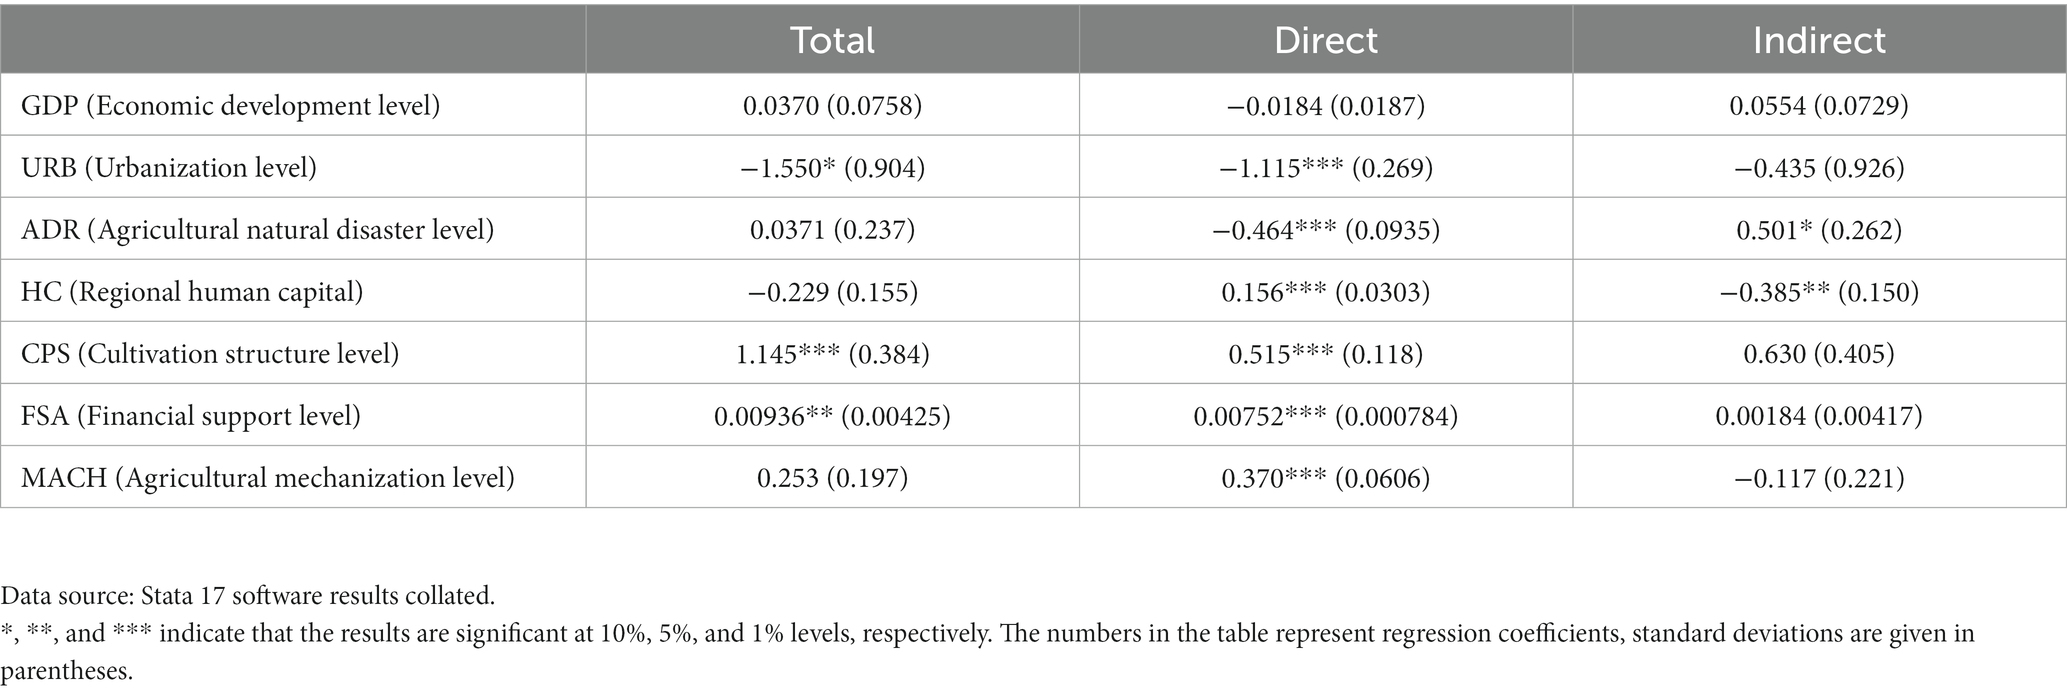
Table 8. Decomposition of effects for the spatial Durbin model.
3.5. Robustness test
The neighborhood space weight matrix was used to validate the results to make sure they were accurate. The results were generally in line with the signs of the coefficients of the above variables, which showed that the model results were reliable (Table 9).
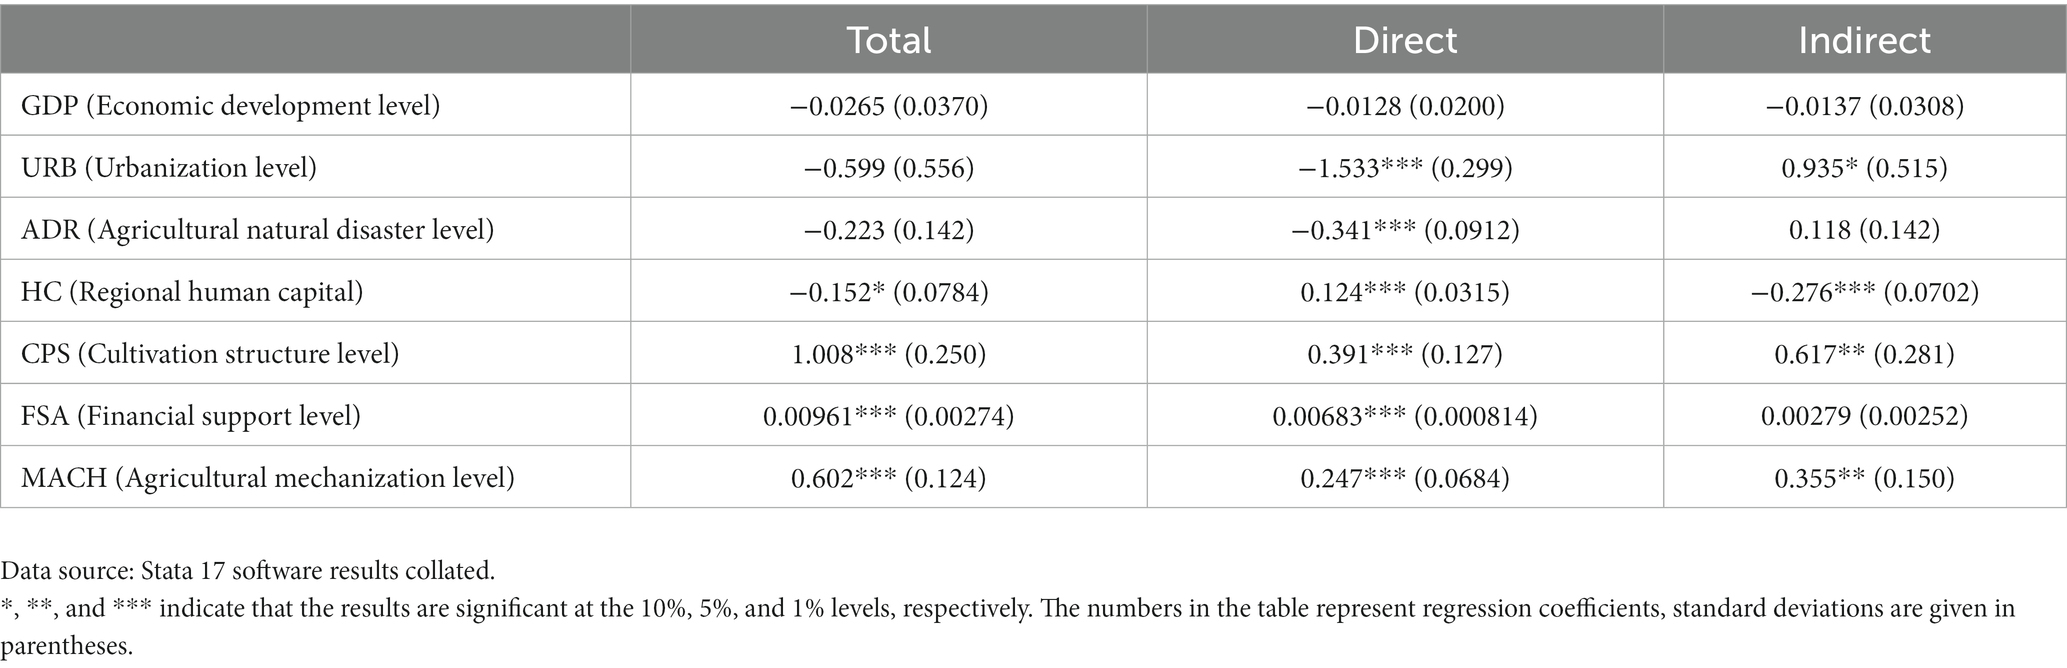
Table 9. Robustness test results.
4. Discussion
Striving for green development in agriculture is closely tied to the healthy expansion of our agricultural economy, and is also fundamental for sustainable food production and food security. It plays a crucial role in the balanced growth of our economy, society, and environment. As a result, studying the Green Total Factor Productivity (GTFP) of maize is of utmost importance. In recent times, research into the green development of maize has gained traction, attracting attention from scholars both locally and globally (Xu X. et al., 2019; Xu X. et al., 2020; Edison, 2022; Gupta et al., 2022; Liu S. et al., 2022; Liu W. et al., 2022).
Following the same trajectory, this study evaluates the productivity of maize in China’s main maize production regions by integrating carbon emissions into the measurement of maize GTFP. This approach provides a more comprehensive understanding of maize production efficiency. Our findings show that the growth of China’s maize GTFP is primarily fueled by the country’s strong commitment to green agriculture. In the delicate balance between agricultural development and environmental protection, the government has stepped up its promotion of green agricultural policies. This move has sparked a shift in farmers’ mindset, encouraging them to adopt more eco-friendly production methods. The subsequent decrease in pollutants and undesirable output is a promising initial accomplishment towards the green development of maize.
These findings hold significant practical and theoretical implications. They contribute to ensuring national food security, promoting sustainable agricultural growth, modernizing the agriculture sector, supporting economic growth, and protecting the environment. Moreover, these findings offer insights into solving the “three rural issues.” As such, this trend towards greener maize production practices is a vital step in promoting sustainable food production.
In this paper, by combing through the research on the spatial correlation of GTFP, most previous studies have assumed that the variables are independent for each province. However, in reality, because agriculture has the attribute of a public good, there will inevitably be some correlation among provinces, and whether and what kind of impact the influencing factors in the home province will have on the green total factor productivity of maize in neighboring provinces is one of the pressing questions in this paper. Some research (Liu, 2019; Hu J. et al., 2022; Hu Q. et al., 2022; Xiao et al., 2022; Zhao et al., 2022) argues that while spatial correlations and maize GTFP are considered together, the interactions between different regions are neglected, and the traditional regression model analysis fails to reflect the role of each influencing factor well. To better study the trends of GTFP changes in China’s major maize-producing regions, this study further examined the spatial characteristics of agricultural GTFP in the major maize-producing regions using the Moran index, based on which an empirical study was conducted on the factors affecting the green development of maize in China using the spatial Durbin model. The results show that regional human capital, maize planting structure, level of agricultural financial support and level of agricultural mechanisation all have significant effects on maize GTFP growth, indicating that higher regional human capital, more optimised maize planting structure, higher level of agricultural financial support and higher level of agricultural mechanisation are conducive to promoting maize green total factor productivity growth; the degree of regional natural disasters has a driving effect on maize GTFP growth in the surrounding areas growth is driven, possibly because more severe agricultural disasters reduce the region’s total maize production, thus hindering the growth of local maize green factor productivity, but instead promoting the growth of surrounding maize green factor productivity; regional human capital has a significant inhibitory effect on the increase of maize total factor productivity in the surrounding region, possibly because the inflow of talent from the surrounding area leads to the growth of surrounding maize GTFP decreased.The level of economic development in the region had no significant effect on maize GTFP growth in the region and adjacent areas. Through systematic and in-depth analysis, it will help to understand the current situation and influencing factors of maize GTFP in China and gain insight into the differences in maize development among different regions, etc., to achieve sustainable development among regions and ensure regional food security and even the food security of the whole country.
5. Conclusions and policy implications
5.1. Conclusion
To address the problems of traditional maize TFP measurement, this paper incorporates undesirable output (carbon emissions) into the research framework of maize TFP from the perspective of green development and uses the SBM-GML indicator to measure the dynamic evolution of China’s maize GTFP in 2004–2020 and analyze it’s influencing factors.
1. From the perspective of time evolution, China’s maize GTFP showed an upward trend during 2004–2020, with an average annual growth rate of 0.8%, gradually changing from being driven by a combination of technological progress and technical efficiency, but the contribution of technological progress was greater than that of technical efficiency.
2. From the perspective of spatial partitioning, the growth of China’s maize GTFP is dominated by the Yellow and Huaihai Sea region and the northern region, with mean values of 1.015 and 1.009, respectively, during the study period, while the southwest region lags behind the northern region and the Yellow and Huaihai Sea region, with a mean value of 1.001, but is still greater than 1 and is in the optimization stage.
3. In terms of influencing factors, the region’s regional human capital, maize cultivation structure, level of financial support for agriculture, and level of agricultural mechanization have significant promoting effects on the growth of maize GTFP, while the level of urbanization and the frequency of natural disasters significantly inhibit the growth of maize GTFP. The level of natural disasters in the region plays a driving role in the growth of maize GTFP in neighboring regions, and the regional human capital had a significant inhibitory effect on the increase in maize total factor productivity in the neighboring region. The level of economic development in the region had no significant effect on maize GTFP growth in the region and adjacent areas.
5.2. Policy recommendations
The following recommendations are made based on the findings of the research:
1. Farmers should improve their scientific quality and focus on transforming their development methods to improve agro-ecological efficiency, while focusing on cultivating new agricultural business entities, such as training highly qualified farmers, establishing rural cooperatives, and supporting leading agricultural enterprises, as well as prioritizing ecology, the need to vigorously develop the agricultural machinery industry, and more importantly, making breakthroughs in green agricultural production technologies to promote high-quality agricultural economic development (Gesche et al., 2022).
2. To improve the technical efficiency of maize production and reduce pollution, farmers should strengthen technical training and rationalize the planting structure so as to reduce the agricultural disaster rate. This would provide a theoretical reference and policy basis for further improving maize GTFP (Zhu L. et al., 2022; Zhu Y. et al., 2022).
3. Technological progress plays an important role in boosting GTFP in Chinese agriculture, both temporally and regionally. However, technical efficiency can often be a constraint on the growth of this productivity. At the same time, the farther the distance of technology diffusion, the weaker the technology, and the farther the distance, the lower the level of agricultural technology. This means China needs to be able to innovate in science and technology, establish an agricultural technology extension system, increase extension services, strengthen inter-regional exchanges and cooperation, and close the gap in technology levels (Wang et al., 2020; Guo et al., 2021; Zhang F. et al., 2022; Zhang Y. et al., 2022).
5.3. Limitations of the study and future research
This study uses the SBM-GML index to measure maize GTFP, explores its dynamic evolution, and identifies the important factors affecting the improvement of maize GTFP based on spatial measurement. Due to the limitations of research capacity and conditions, some limitations are worth noting:
Firstly, in the process of data collection and processing, the full range of carbon emission indicators cannot be directly obtained. At present, China’s agricultural green total factor productivity non-expected output indicators do not have a complete measurement system, and their measurement results have some deviations from the actual situation. This paper provides a more detailed assessment of China’s carbon emissions, based on references to relevant domestic and international research and drawing on the currently accepted calculation methods for various indicators.
Secondly, from the breadth and depth of research, as an important grain crop production base in China, the main maize-producing areas are responsible for the major task of ensuring national food security and the balance between supply and demand of agricultural products. With the rising food consumption level of residents in the new era, the main producing areas, the main marketing areas, and balanced production and marketing areas are working together to enhance the comprehensive grain production capacity (Murrell et al., 2022; Skawińska and Zalewski, 2022; Stavi et al., 2022; Teeuwen et al., 2022). How can the interests of the three regions be balanced? Furthermore, the study of GTFP in China’s main maize-producing regions is of great significance in promoting GTFP in China’s major maize-producing regions and in formulating green development strategies in a scientific manner. This aspect is yet to be further explored.
Thirdly, the prospect of this study is to find out the factors affecting the growth of GTFP in maize by measuring the GTFP of maize in China’s three major maize producing regions and exploring its spatial spillover effects by analysing its temporal and spatial dynamic evolution patterns, so as to contribute to the development of food security. Future research will focus more on the spatial spillover effects of green total factor productivity in agriculture.
Data availability statement
The raw data supporting the conclusions of this article will be made available by the authors, without undue reservation.
Author contributions
WM, YD, and ZY initiated the study. WM, YD, and MB collected the data, processed the data, and performed analysis. WM, YD, MB, AA, LZ, ZY, QM, and SA wrote and revised the manuscript. All authors contributed to the article and approved the submitted version.
Funding
This work was supported by the Ministry of Education Executive Committee Project (project no: NJX22141) and the Tarim University Graduate Student Innovation and Entrepreneurship Project (project nos: TDGRI202267 and TDETR202218).
Conflict of interest
The authors declare that the research was conducted in the absence of any commercial or financial relationships that could be construed as a potential conflict of interest.
Publisher’s note
All claims expressed in this article are solely those of the authors and do not necessarily represent those of their affiliated organizations, or those of the publisher, the editors and the reviewers. Any product that may be evaluated in this article, or claim that may be made by its manufacturer, is not guaranteed or endorsed by the publisher.
References
Chen, Y., and Shen, T. J. (2020). Unifying conspecific-encounter index v and Moran's I index. Ecography 43, 1902–1904. doi: 10.1111/ecog.05281
Chen, H., Zhu, S., Sun, J., Zhong, K., Shen, M., and Wang, X. (2022). A study of the spatial structure and regional interaction of agricultural green total factor productivity in China based on SNA and VAR methods. Sustainability 14:7508. doi: 10.3390/su14127508
Chung, Y. H., Färe, R., and Grosskopf, S. (1997). Productivity and undesirable outputs: a directional distance function approach. J. Environ. Manag. 51, 229–240. doi: 10.1006/jema.1997.0146
Dai, R., and Xu, S. (2022). Spatiotemporal characteristics and influencing factors of the green total factor productivity of wheat in China. Trans. Chin. Soc. Agric. Eng. 38, 304–314. doi: 10.11975/j.issn.1002-6819.2022.08.035
Deng, C. (2019). Study on green total factor productivity of grain and its influencing factors in Henan Province. (master’s thesis) Zhengzhou: Henan Agricultural University.
Edison, (2022). The determinants of farmers’ technical efficiency in corn production: empirical evidence from Jambi Province. IOP Conf. Series Earth Environ. Sci. 1097:012010. doi: 10.1088/1755-1315/1097/1/012010
Faere, R., Grosskopf, S., Lovell, C. A. K., and Pasurka, C. (1989). Multilateral productivity comparisons when some outputs are undesirable: a nonparametric approach. Rev. Econ. Stat. 71, 90–98. doi: 10.2307/1928055
Fang, L., Hu, R., Mao, H., and Chen, S. (2021). How crop insurance influences agricultural green total factor productivity: evidence from Chinese farmers. J. Clean. Prod. 321:128977. doi: 10.1016/j.jclepro.2021.128977
Fu, L., Mao, X., Mao, X., and Wang, J. (2022). Evaluation of agricultural sustainable development based on resource use efficiency: empirical evidence from Zhejiang Province, China. Front. Environ. Sci. 10:860481. doi: 10.3389/fenvs.2022.860481
Gao, Q., Cheng, C., Sun, G., and Li, J. (2022). The impact of digital inclusive finance on agricultural green Total factor productivity: evidence from China. Front. Ecol. Evol. 10:905644. doi: 10.3389/fevo.2022.905644
Gesche, K., Le Vay, L., Buck, B. H., Costa, P., Barry, A., Dewhurst, T., et al. (2022). Prospects of low trophic marine aquaculture contributing to food security in a net zero-carbon world. Front. Sustain. Food Syst. 6:875509. doi: 10.3389/fsufs.2022.875509
Gu, B., Liu, J., and Ji, Q. (2022). The effect of social sphere digitalization on green total factor productivity in China: evidence from a dynamic spatial Durbin model. J. Environ. Manag. 320:115946. doi: 10.1016/j.jenvman.2022.115946
Guo, X., Deng, C., Wang, D., Du, X., Li, J., and Wan, B. (2021). International comparison of the efficiency of agricultural science, technology, and innovation: a case study of G20 countries. Sustainability 13:2769. doi: 10.3390/su13052769
Gupta, V. S., Biswas, S., Snow, D., and WuSmart, J. (2022). Targeted method for quantifying air-borne pesticide residues from conventional seed coat treatments to better assess exposure risk during maize planting. Bull. Environ. Contam. Toxicol. 109, 1051–1058. doi: 10.1007/s00128-022-03627-y
Hailu, A., and Veeman, T. S. (2001). Non-parametric productivity analysis with undesirable outputs: an application to the Canadian pulp and paper industry. Am. J. Agric. Econ. 83, 605–616. doi: 10.1111/0002-9092.00181
Hlahla, S. (2022). Gender perspectives of the water, energy, land, and food security nexus in sub-Saharan Africa. Front. Sustain. Food Syst. 6:719913. doi: 10.3389/fsufs.2022.719913
Hong, M., Tian, M., and Wang, J. (2022). Digital inclusive finance, agricultural industrial structure optimization and agricultural green Total factor productivity. Sustainability 14:11450. doi: 10.3390/su141811450
Hu, Q., Li, X., and Feng, Y. (2022). Do green credit affect green Total factor productivity? Empirical evidence from China. Front. Energy Res. 9:821242. doi: 10.3389/fenrg.2021.821242
Hu, J., Zhang, X., and Wang, T. (2022). Spatial Spillover effects of resource misallocation on the green Total factor productivity in Chinese agriculture. Int. J. Environ. Res. Public Health 19:15718. doi: 10.3390/ijerph192315718
Huang, X., Wang, X., Chen, B., Li, F., Su, S., and Zhang, T. (2022). Temporal trend and regional disparity of agricultural green Total factor productivity in China: data envelopment analysis with biennial environmental technology. Discret. Dyn. Nat. Soc. 2022, 1–17. doi: 10.1155/2022/2219779
Kong, X., Su, L., Wang, H., and Qiu, H. (2002). Agricultural carbon footprint and food security: an assessment of multiple carbon mitigation strategies in China. China Agric. Econ. Rev. 14, 686–708. doi: 10.1108/CAER-02-2022-0034
Kumar, U., Singh, A., and Mishra, M. (2021). White matter alteration in adults with prelingual deafness: a TBSS and SBM analysis of fractional anisotropy data. Brain Cogn. 148:105676. doi: 10.1016/j.bandc.2020.105676
Kuo, L., Liping, G., Jie, P., and Mingyu, L. (2022). Evaluation of future maize yield changes and adaptation strategies in China. Sustainability 14:9246. doi: 10.3390/su14159246
Li, H., Tang, M., Cao, A., and Guo, L. (2022). Assessing the relationship between air pollution, agricultural insurance, and agricultural green total factor productivity: evidence from China. Environ. Sci. Pollut. Res. Int. 29, 78381–78395. doi: 10.1007/s11356-022-21287-7
Li, B., Zhang, J., and Li, H. (2011). Research on spatial-temporal characteristics and affecting factors decomposition of agricultural carbon emission in China. China Popul. Resour. Environ. 21, 80–86. doi: 10.3969/j.issn.1002-2104.2011.08.013
Liu, X. (2019). Dynamic analysis of spatial convergence of green total factor productivity in China’s primary provinces along its belt and road initiative. CJPRE 17, 101–112. doi: 10.1080/10042857.2019.1611342
Liu, S., Lei, P., Li, X., and Li, Y. (2022). A nonseparable undesirable output modified three-stage data envelopment analysis application for evaluation of agricultural green total factor productivity in China. Sci. Total Environ. 838:155947. doi: 10.1016/j.scitotenv.2022.155947
Liu, W., Li, Z., Li, Y., Ye, T., Chen, S., and Liu, Y. (2022). Heterogeneous impacts of excessive wetness on maize yields in China: evidence from statistical yields and process-based crop models. Agric. For. Meteorol. 327:109205. doi: 10.1016/j.agrformet.2022.109205
Liu, Z., Zhang, M., Li, Q., and Zhao, X. (2023). The impact of green trade barriers on agricultural green total factor productivity: evidence from China and OECD countries. Econ. Anal. Policy 78, 319–331. doi: 10.1016/j.eap.2023.03.011
Ma, G., Lv, D., Luo, Y., and Jiang, T. (2022). Environmental regulation, urban-rural income gap and agricultural green Total factor productivity. Sustainability 14:8995. doi: 10.3390/su14158995
Maya, K., Kiranmay, S., and Richa, S. (2019). Using Moran's I and GIS to study the spatial pattern of land surface temperature in relation to land use/cover around a thermal power plant in Singrauli district, Madhya Pradesh, India. RSASE 15:100239. doi: 10.1016/j.rsase.2019.100239
Murrell, A. J., Jones, R., Rose, S., Firestine, A., and Bute, J. (2022). Food security as ethics and social responsibility: an application of the food abundance index in an urban setting. Int. J. Environ. Res. Public Health 19:10042. doi: 10.3390/ijerph191610042
Oh, D. H. (2010). A global Malmquist-Luenberger productivity index. J. Product. Anal. 34, 183–197. doi: 10.1007/s11123-010-0178-y
Olubunmi, O. F., Ibukun, A. O., Adeyinka, A. F., and Olusola, O. A. (2022). Trends in climate, socioeconomic indices and food security in Nigeria: current realities and challenges ahead. Front. Sustain. Food Syst. 6:940858. doi: 10.3389/fsufs.2022.940858
Pan, X., Guo, S., Li, M., and Song, J. (2021). The effect of technology infrastructure investment on technological innovation ——a study based on spatial durbin model. Technovation 107:102315. doi: 10.1016/j.technovation.2021.102315
Pinto, E. P., Pires, M. A., Matos, R. S., Zamora, R. M., Menezes, R. P., Araújo, R. S., et al. (2021). Lacunarity exponent and Moran index: a complementary methodology to analyze AFM images and its application to chitosan films. Phys. A: Stat. Mech. Appl. 581:126192. doi: 10.1016/j.physa.2021.126192
Reinhard, S., Lovell, C. A. K., and Thijssen, G. (1999). Econometric estimation of technical and environmental efficiency: an application to Dutch dairy farms. Am. J. Agric. Econ. 81, 44–60. doi: 10.2307/1244449
Sang, X., Luo, X., Razzaq, A., Huang, Y., and Erfanian, S. (2023). Can agricultural mechanization services narrow the income gap in rural China? Heliyon 9:e13367. doi: 10.1016/j.heliyon.2023.e13367
Shi, H., Li, P., Wei, J., and Songbai, S. (2022). Green growth efficiency evaluation of major domestic oil-gas resource-based cities——based on panel data of SBM model and Malmquist-Luenberger index. Front. Earth Sci. 10:911646. doi: 10.3389/feart.2022.911646
Shuo, C., Weihang, L., Puyu, F., Tao, Y., Yuchi, M., and Zhou, Z. (2022). Improving spatial disaggregation of crop yield by incorporating machine learning with multisource data: a case study of Chinese maize yield. Remote Sens. 14:2340. doi: 10.3390/rs14102340
Skawińska, E., and Zalewski, R. I. (2022). Combining the water–energy–food and food waste–food loss–food security nexuses to reduce resource waste. Energies 15:5866. doi: 10.3390/en15165866
Song, Y., Zhang, B., Wang, J., and Kwek, K. (2022). The impact of climate change on China's agricultural green total factor productivity. Technol. Forecast. Soc. Change 185:122054. doi: 10.1016/j.techfore.2022.122054
Stavi, I., de Roque, P. J., Paschalidou, A. K., Adamo, S. B., Galvin, K., de Sherbinin, A., et al. (2022). Food security among dryland pastoralists and agropastoralists: the climate, land-use change, and population dynamics nexus. Anthr. Rev. 9, 299–323. doi: 10.1177/20530196211007512
Sun, Y. (2022). Environmental regulation, agricultural green technology innovation, and agricultural green total factor productivity. Front. Environ. Sci. 10:955954. doi: 10.3389/fenvs.2022.955954
Teeuwen, A. S., Meyer, M. A., Dou, Y., and Nelson, A. (2022). A systematic review of the impact of food security governance measures as simulated in modelling studies. Nat. Food 3, 619–630. doi: 10.1038/s43016-022-00571-2
Tone, K. (2001). A slacks-based measure of efficiency in data envelopment analysis. Eur. J. Oper. Res. 130, 498–509. doi: 10.1016/S0377-2217(99)00407-5
Wang, L., Tang, J., Tang, M., Su, M., and Guo, L. (2022). Scale of operation, financial support, and agricultural green Total factor productivity: evidence from China. Int. J. Environ. Res. Public Health 19:9043. doi: 10.3390/ijerph19159043
Wang, F., Wang, H., Liu, C., Xiong, L., and Kong, F. (2022). Does economic agglomeration improve agricultural green total factor productivity? Evidence from China's Yangtze river delta. Sci. Prog. 105:00368504221135460. doi: 10.1177/00368504221135460
Wang, Y., Wu, Q., and Song, J. (2022). Spatial network structure characteristics of green total factor productivity in transportation and its influencing factors: evidence from China. Front. Environ. Sci. 10:982245. doi: 10.3389/fenvs.2022.982245
Wang, F., Wu, L., and Zhang, F. (2020). Network structure and influencing factors of agricultural science and technology innovation spatial correlation network—a study based on data from 30 provinces in China. Symmetry 12:1773. doi: 10.3390/sym12111773
Wang, X., Zhou, H., Huang, Y., and Ji, J. (2022). Variation of subsoiling effect at wing Mounting Heights on soil properties and crop growth in wheat–maize cropping system. Agriculture 12:1684. doi: 10.3390/agriculture12101684
Xiao, S., Wang, S., Zeng, F., and Huang, W. C. (2022). Spatial differences and influencing factors of industrial green Total factor productivity in Chinese industries. Sustainability 14:9229. doi: 10.3390/su14159229
Xing, X., Zhang, Q., Ye, A., and Zeng, G. (2023). Mechanism and empirical test of the impact of consumption upgrading on agricultural green Total factor productivity in China. Agriculture 13:151. doi: 10.3390/agriculture13010151
Xu, X., Huang, X., Huang, J., Gao, X., and Chen, L. (2019). Spatial-temporal characteristics of agriculture green Total factor productivity in China, 1998–2016: based on more sophisticated calculations of carbon emissions. Int. J. Environ. Res. Public Health 16:3932. doi: 10.3390/ijerph16203932
Xu, T., Kang, C., and Zhang, H. (2022). China's efforts towards carbon neutrality: does energy-saving and emission-reduction policy mitigate carbon emissions? J. Environ. Manag. 316:115286. doi: 10.1016/j.jenvman.2022.115286
Xu, X., Zhang, L., Chen, L., and Liu, C. (2020). The role of soil N2O emissions in agricultural green Total factor productivity: an empirical study from China around 2006 when agricultural tax was abolished. Agriculture 10:150. doi: 10.3390/agriculture10050150
Xu, Q., Zhu, P., and Tang, L. (2022). Agricultural services: another way of farmland utilization and its effect on agricultural green Total factor productivity in China. Land 11:1170. doi: 10.3390/land11081170
Yang, Y., Ma, H., and Wu, G. (2022). Agricultural green Total factor productivity under the distortion of the factor market in China. Sustainability 14:9309. doi: 10.3390/su14159309
Yao, H., Gu, X., and Yu, Q. (2023). Impact of graduate student expansion and innovative human capital on green Total factor productivity. Sustainability 15:1721. doi: 10.3390/su15021721
Ye, F., Yang, Z., Yu, M., Watson, S., and Lovell, A. (2023). Can market-oriented reform of agricultural subsidies promote the growth of agricultural green Total factor productivity? Empirical evidence from maize in China. Agriculture 13:251. doi: 10.3390/agriculture13020251
Yu, Z., Lin, Q., and Huang, C. (2022a). Re-measurement of agriculture green Total factor productivity in China from a carbon sink perspective. Agriculture 12:2025. doi: 10.3390/agriculture12122025
Yu, D., Liu, L., Gao, S., Yuan, S., Shen, Q., and Chen, H. (2022). Impact of carbon trading on agricultural green total factor productivity in China. J. Clean. Prod. 367:132789. doi: 10.1016/j.jclepro.2022.132789
Yu, Z., Mao, S., and Lin, Q. (2022b). Has China’s carbon emissions trading pilot policy improved agricultural green Total factor productivity? Agriculture 12:1444. doi: 10.3390/agriculture12091444
Zhang, J., Lu, G., Skitmore, M., and Ballesteros, P. P. (2021). A critical review of the current research mainstreams and the influencing factors of green total factor productivity. Environ. Sci. Pollut. Res. Int. 28, 35392–35405. doi: 10.1007/s11356-021-14467-4
Zhang, F., Wang, F., Hao, R., and Wu, L. (2022). Agricultural science and technology innovation, spatial Spillover and agricultural green development—taking 30 provinces in China as the research object. Appl. Sci. 12:845. doi: 10.3390/app12020845
Zhang, Y., Wei, J., Wang, Y., and Tsai, S. B. (2022). An empirical study on the growth of agricultural green Total factor productivity in the Huanghuai River economic zone by big data computing. Math. Probl. Eng. 2022, 1–11. doi: 10.1155/2022/1775027
Zhao, P., Wu, H., Lu, Z., Kou, J., and Du, J. (2022). Spatial differences, distributional dynamics, and driving factors of green total factor productivity in China. Front. Environ. Sci. 10:1058612. doi: 10.3389/fenvs.2022.1058612
Zhu, L., Shi, R., Mi, L., Liu, P., and Wang, G. (2022). Spatial distribution and convergence of agricultural green Total factor productivity in China. Int. J. Environ. Res. Public Health 19:8786. doi: 10.3390/ijerph19148786
Keywords: maize GTFP, spatial and temporal differences, food security, carbon emissions, spatial measurement
Citation: Ma W, Ding Y, Bai M, Aihemaiti A, Zhou L, Yang Z, Ma Q and Aslam SB (2023) Assessing green total factor productivity and spatial spillover effect in China’s maize industry for sustainable food production: a carbon emissions perspective. Front. Sustain. Food Syst. 7:1235132. doi: 10.3389/fsufs.2023.1235132
Edited by:
Muhammad Asad Ur Rehman Naseer, Bahauddin Zakariya University, PakistanCopyright © 2023 Ma, Ding, Bai, Aihemaiti, Zhou, Yang, Ma and Aslam. This is an open-access article distributed under the terms of the Creative Commons Attribution License (CC BY). The use, distribution or reproduction in other forums is permitted, provided the original author(s) and the copyright owner(s) are credited and that the original publication in this journal is cited, in accordance with accepted academic practice. No use, distribution or reproduction is permitted which does not comply with these terms.
*Correspondence: Zhongna Yang, eWFuZ3pob25nbmFAdGFydS5lZHUuY24=; Qiong Ma, bWFxaW9uZ0B0YXJ1LmVkdS5jbg==