
95% of researchers rate our articles as excellent or good
Learn more about the work of our research integrity team to safeguard the quality of each article we publish.
Find out more
ORIGINAL RESEARCH article
Front. Sustain. Food Syst. , 18 September 2023
Sec. Waste Management in Agroecosystems
Volume 7 - 2023 | https://doi.org/10.3389/fsufs.2023.1234472
 Rashmi Yadav1
 Susama Sudhishri1*
 Manoj Khanna1Khajanchi Lal1
 Anchal Dass2*H. L. Kushwaha3
 Kalikinkar Bandyopadhyay4
 Abir Dey5Ajay Kushwah3Ramineni Harsha Nag3
Biogas slurry serves as a useful organic fertilizer due to its substantial nutrient content, and its characterization enables the evaluation of nutrient content and its efficient utilization. This study focuses on the variations in the nutrient content of biogas slurry from different dairy farm systems located near the ICAR-Indian Agricultural Research Institute (IARI) (New Delhi), Daryapur Kalan (New Delhi), and Madanpur (Uttar Pradesh) during the pre-monsoon, monsoon, and post-monsoon seasons. The study reveals significant variations in macronutrient levels, particularly nitrogen (N), which showed variations exceeding 3% and a wider range of almost 6% during the pre-monsoon and post-monsoon periods. Spatial differences between dairy farms also contributed to the variance, with more than 10% differences observed between IARI and Daryapur Kalan and between IARI and Madanpur. Phosphorus (P) remained stable across seasons with spatial variation, while potassium (K) exhibited a reverse trend. Correlation analysis highlighted strong positive associations between N content and phosphorus (0.959), organic carbon (0.954), pH (0.813), and electrical conductivity (0.806). The findings suggest the use of biogas slurry has a potential to reduce the synthetic fertilizer consumption of N, P, and K by approximately 8.78%, 11.01%, and 14.33%, respectively and using them for further for nutrigation.
Agriculture is an important sector of the Indian economy, and its contribution to the country’s GDP is significant. Agriculture and allied sectors contributed approximately 20.2% to the total GVA (Gross Value Added) in the financial year 2020–21 and 18.8% in 2021–2022. The performance of agriculture has considerable implications for the overall growth and development of the nation. Substantial improvements in food grain production have been made as a result of the “Green revolution,” (Economic Survey, 2021-2022, GOI, Ministry of Economic Affairs), but agricultural viability received little consideration. In India, the only way to guarantee accessibility and affordability of chemical fertilizers based on fossil fuels at the farm level is through imports and subsidies, which are highly reliant on national GDP. Estimates from the Food and Agriculture Organization of the United Nations (FAO) predict that the average demand for agricultural commodities will increase by 60% by 2030 compared to current levels, with emerging economies accounting for more than 85% of this increase (Mia and Shamsuddin, 2010). Intensification of food production is therefore essential to meet the growing demand for food. Chemical fertilizers are more frequently used since they are widely accessible and reasonably priced. In India, urea, diammonium phosphate (DAP), and potassium chloride are the three most commonly utilized inorganic fertilizers (MOP). According to one recent study, India consumed on average approximately 500 Lakh Metric Tons (LMT) of fertilizer per year in the last 10 years (GOI, Ministry of Chemicals and Fertilizers, Department of Fertilizers, 2020). While using inorganic fertilizers improperly can be detrimental to soil health, they can also improve crop yields. Overuse of inorganic fertilizers can result in soil degradation, which includes soil acidity, reduced soil fertility, and nutrient depletion, all of which may have an impact on crop yields over time (Dass et al., 2008, 2013, 2015c). Additionally, the industrial production of nitrogenous chemical fertilizers involves the use of non-renewable petroleum fuels and high temperatures and pressures. The cost of chemical fertilizers is affected by the daily increase in the price of petroleum. Moreover, more than 50% of the applied N-fertilizers are lost through various agricultural processes, which not only results in a financial loss to farmers but also pollutes the environment (Dass et al., 2015a,b). In a multi-year study of monoculture wheat farming, the quality of the soil, the purity of the groundwater, and the number of beneficial microorganisms were all reduced, making the plants more susceptible to pathogens and parasites under synthetic fertilizers (Singh et al., 2011). Farmers frequently over-apply phosphorus to increase its availability to crops, but this also raises the possibility that the majority of the phosphorus may be lost through runoff, leaching, or soil erosion and end up in lakes, rivers, and oceans. This causes monetary loss and environmental damage (Tirado and Allsopp, 2012; Dass et al., 2015a). According to the findings of Wan et al. (2021), chemical fertilizers have been extensively used worldwide, particularly in China, to increase citrus yields, which has negatively impacted the soil environment in citrus orchards.
The use of organic fertilizers offers a potential solution to this problem. The practice of organic farming as an environmentally sound agricultural method has drawn worldwide attention to the current situation. Organic fertilizers are made from natural sources, such as animal manure, compost, and crop residues. The resulting product also reduces reliance on chemical fertilizers (Gulen and Arslan, 2005). Organic fertilizers help improve soil health by increasing soil organic matter (SOM) and enhancing soil structure and fertility, among other things (Promoting the Use of Organic Manure, 2017). Manure and other organic residues could potentially be used, and their use should be strongly encouraged. As previously mentioned, there is growing concern about the alterations that synthetic N fertilizers are causing in the global N cycle and the potential consequences for human health and the environment (Townsend et al., 2003). The need for synthetically manufactured N could be significantly decreased by recycling as much N as is practical. India has a vast livestock population of approximately 512.05 million heads in Dikshit and Pratap (2010), Kumar et al. (2015). Livestock excretions include the necessary trace minerals for crop growth, such as nitrogen (N), phosphorus (P), and potassium (K) (Manure Inventory, n.d.). An animal’s ability to produce manure varies depending on its environment and diet. In India, animals produce 730 MT of dung annually (or 2 MT of dung per day), of which only 60% is recoverable. However, in India, bovine (cattle + buffalo) excretions meet practically all the demand for manure. They generate a mere 256.2 million tons of dung every year, yet this holds significant nitrogen potential to fulfill the fertilizer requirements. On average, 0.3 kg of slurry is produced from 1 kg of cow dung. In India, 76.8 MT of slurry is produced annually (Kumar et al., 2015). Recently, the Indian government has taken significant steps to promote the use of biogas slurry as fertilizer in the country; several schemes have been launched to encourage farmers to adopt biogas technology and utilize the resulting slurry as fertilizer. Biogas slurry, also known as digestate, is a byproduct of anaerobic digestion that has gained significant attention in recent years as a valuable fertilizer. The process of anaerobic digestion converts organic material into biogas, a sustainable energy source, without the use of oxygen (Şencan et al., 2023). The remaining digestate is rich in nutrients such as N, P, and K, making it an excellent source of fertilizer for agricultural use. On average, the composition of biogas slurry is 1.5% N, 1.1% P, and 1% K (SNV, 2011). The use of biogas slurry as fertilizer has several advantages over traditional chemical fertilizers. First, it is an organic fertilizer that promotes soil health and biodiversity, reduces soil erosion, and enhances crop yields. Second, it is a sustainable alternative to chemical fertilizers, which often contribute to environmental problems such as water pollution, soil degradation, and greenhouse gas emissions. Third, it is a cost-effective solution for farmers, as they can produce their own fertilizer by utilizing their agricultural waste. There is a significant amount of macronutrients in biogas slurry, and the concentration of hazardous heavy metals is also quite low compared to synthetic fertilizers. The financial worth of organic fertilizer lies in its potential to spike agricultural productivity and benefit farmers. Nonetheless, the decision to use organic fertilizer depends on the value-for-money ratio, which determines its cost-effectiveness. The quantity of N found in one cubic meter of bio-slurry ranges from 0.16 to 1.05 kilograms, which is approximately equivalent to 0.35 to 2.5 kilograms of urea (Vinh, 2010).
A study by Kumar et al. (2015) found that 730 metric tons of dung from bovine (cattle + buffalo) dung alone can produce annually around 76.8 metric tons of slurry, which contains approximately 1.15 metric tons of N. Based on the conversion rate of 1 kilogram of nitrogen being equivalent to 2.2 kilograms of urea fertilizer, and given the current cost of Rs. 276 per 50-kilogram bag of urea, the estimated cost of 1.15 × 10⁹ kilograms of N is 13.74 × 10⁹ INR. Using this estimate, the study suggests that 76.8 metric tons of slurry can significantly reduce India’s import bill by 13.74 billion INR. It is also worth noting that the use of organic fertilizers can help reduce the country’s dependence on imported chemical fertilizers, which can have economic and environmental benefits. Putting resources from nature to use to produce biogas and then using the leftovers as fertilizer allows for the best use of these resources. In addition to being a natural and nutrient-rich substance for plant growth, bio-slurry also contributes to soil health. Nutrigation is an effective approach to improving the management of nutrients and water in agricultural systems, enhancing crop health, production, and resource efficiency. It helps boost soil fertility and water retention capacity, and improve soil structure, thus promoting better crop yields. The utilization of biogas slurry can lead to a sustainable and healthy agricultural system by reducing the dependence on synthetic fertilizers and promoting the use of organic resources. Despite these benefits, its use as a fertilizer also poses some challenges, such as variability in nutrient content. Seasonal and locational variations in the nutrient content of biogas slurry can occur due to changes in feedstock availability and composition, in addition to changes in temperature and other environmental factors. Depending on the physiological state of the animals and their management, several authors provide slurry composition values that fluctuate (Germon et al., 1979). Slurry is a heterogeneous substance in terms of its chemical composition. It can vary in composition due to several factors. These include the type and age of the animals producing the slurry, their feeding practices and management, the quality of the feed they consume, and how the slurry is diluted and stored. If not available, taking into account the concentration of dietary elements may aid in the revision of the standard calculations. Seasonal analysis of the nutrient content of slurry is vital during the seasonal feeding cycle. This paper aims to provide an overview of the characterization of biogas slurry to be used as fertilizer in agriculture and, secondly, to know the locations and seasonal variation of the nutrient content of biogas slurry for its proper management throughout the year.
The study was carried out at the Water Technology Centre, ICAR – Indian Agricultural Research Institute (IARI), New Delhi, India. Slurry samples were gathered from biogas plants established in three distinct dairy farming systems. Firstly, at the integrated farming system (IFS) model located within the Division of Agronomy (latitude 28° 38′ 24.0252″ N, longitude 77° 10′ 26.328″ E) at IARI farm, operating under the Khadi and Village Industries Commission (KVIC) Model. Secondly, in Daryapur Kalan village, within the North-West district of Delhi (latitude 28° 48′ 50.7996″ N, longitude 77° 0′ 42.57″ E), following the Deenbandhu model. Lastly, samples were collected from the Deenbandhu model in Madanpur village, located in Farrukhabad district, Uttar Pradesh (latitude 26° 22′ 14.77″ N, longitude 83° 37′ 41.49″ E). The detailed descriptions of the models are shown in Table 1.
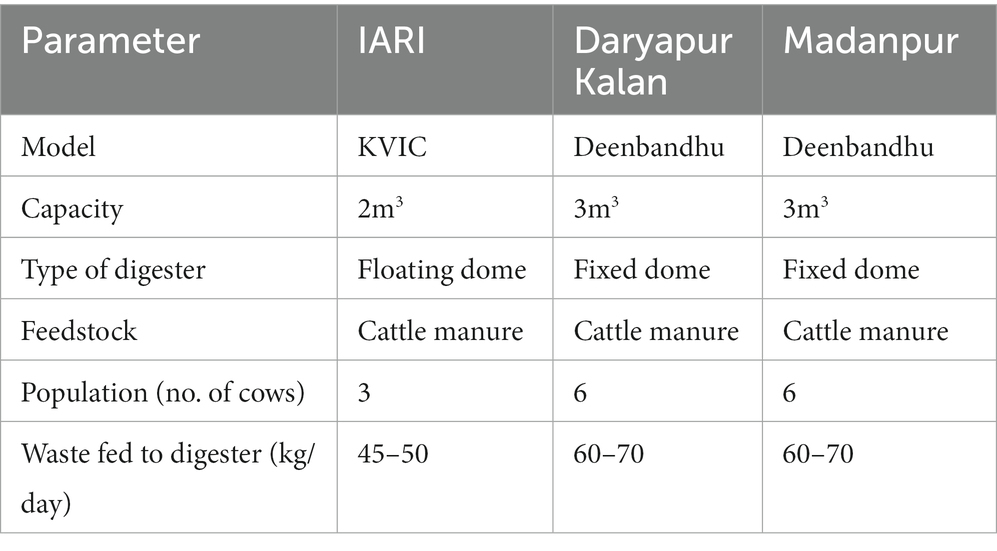
Table 1. Specifications of the biogas plants studied.
The slurry collected from the dairy farm at IARI was kept clean every day on a concrete floor and was properly ventilated. Cattle were housed in lots designed to accommodate a specific number of animals. The animals are fed a controlled diet consisting of grain-based feed, often supplemented with roughage, minerals, and other additives to meet their nutritional requirements twice a day. Inside the dairy farm, troughs for food and water have been built. A dung tank (1 m3) and a urine tank (0.5 m3) were built to collect drained dung and urine right next to the dairy unit. The cow dung from the dairy farm, consisting of about 45–50 kg and 50 L of water (1:1), was then fed to the biogas unit, from which bio-digested slurry and biogas are collected through their respective outlets. Slurry from a dairy farm was stored outdoors in adjacent, covered concrete tanks throughout the entire duration of the study; there were no cows in a gestating state. The slurry collected from the Daryapur Kalan dairy farm had an earthen floor and came from non-breeding cows that were fed twice a day with locally available materials depending on the season: bhusa (straw), choker (bran), jowar (Sorghum bicolor L.) grains, barseem (Trifoliumalexandrinum L.) and jai (oat: Avena fatua). The farm was cleaned periodically. Cow dung from the farm was fed to the biogas unit in a ratio of 1:2, and the bio-digested slurry was collected from the outlet and fed to an earthen pit. During the study period, there were cows in gestation. The slurry collected from Madanpur in Uttar Pradesh had an earthen floor and was well-ventilated and cleaned periodically. The farm had non-breeding and breeding cows that were fed twice with locally available materials, depending on the season. In a 1: 2 ratio, cow manure from the barn was fed to the biogas unit, and the bio-digested slurry was collected from the outlet and put into an earthen pit. Cows were lactating and in gestation at the time of the research. At each farm, three subsamples were taken.
The biogas slurry samples were collected from a range of depths of 0.3 to 0.6 meters after being stirred uniformly using a single sampling method by a sampler from the biogas plant. The fermentation cycle typically spans 45 to 55 days in all seasons, with anaerobic digestion reaching 82 to 85%. After sample collection, the sampler was withdrawn, and the collected biogas slurry was transferred from the sampler into an appropriate collection vessel. The collected sample volume was 1 L. The water content varied between 92 and 93%. The samples from these sites were collected for three different seasons: pre-monsoon (PEM), monsoon (MON), and post-monsoon (POM), with three replications each. All collected samples were immediately taken to the laboratory, air dried for 9 to 18 days for all seasons, then crushed and passed through a 2 mm sieve. The biogas slurry was then analyzed at the Soil and Plant Quality Laboratory, Water Technology Centre, ICAR-IARI, New Delhi, for various parameters using standard methods.
The physical and chemical parameters considered for the study and their procedures of analysis are shown in Table 2. Total N was quantified using the Kjeldahl distillation method. The samples were prepared by thoroughly mixing and homogenizing them. In the first step, the sample is digested with concentrated sulfuric acid (H2SO4) using a digestion mixture. In the second step, the acid digest is distilled with 40% sodium hydroxide (NaOH), and the released ammonia (NH3) is absorbed in 4% boric acid. The distillate was titrated with standard 0.1 N hydrochloric acid. The volume of acid required to reach the endpoint was used to calculate the total N content of the sample. Available N was determined by the alkaline permanganate method (Subbiah and Asija, 1956). Phosphorus was determined using the Olsen method, preceded by acid digestion, and extracted with 0.5 NaHCO3 in the presence of Darco G-60 (Fisher Scientific, Hampton, USA). Phosphorus in the extract was treated with ammonium molybdate, which resulted in the formation of phosphomolybdate, which was again reduced by the ascorbic acid. Due to this reduction, the Mo6+ was converted to Mo3+, with the complex exhibiting a blue color. The intensity of the blue color obtained was measured at the appropriate wavelength of 430 nm on a visible spectrophotometer. The potassium content in the slurry was determined by the ammonium acetate method of K determination (Hanway and Heidel, 1952) and by recording the flame photometer reading for each working standard solution of K, adjusting the blank to zero and the highest concentration among the working standards to 100. Organic carbon was determined by the method of Walkley and Black (1934). pH and EC are important parameters for the characterization of biogas slurry and were thus measured on fresh samples using a pH meter and a conductivity meter, respectively. Total solids in the biogas slurry were determined by drying a known weight of slurry in an oven at 105°C until a constant weight was reached. The weight of the dry residue was used to calculate the total solid content of the slurry.
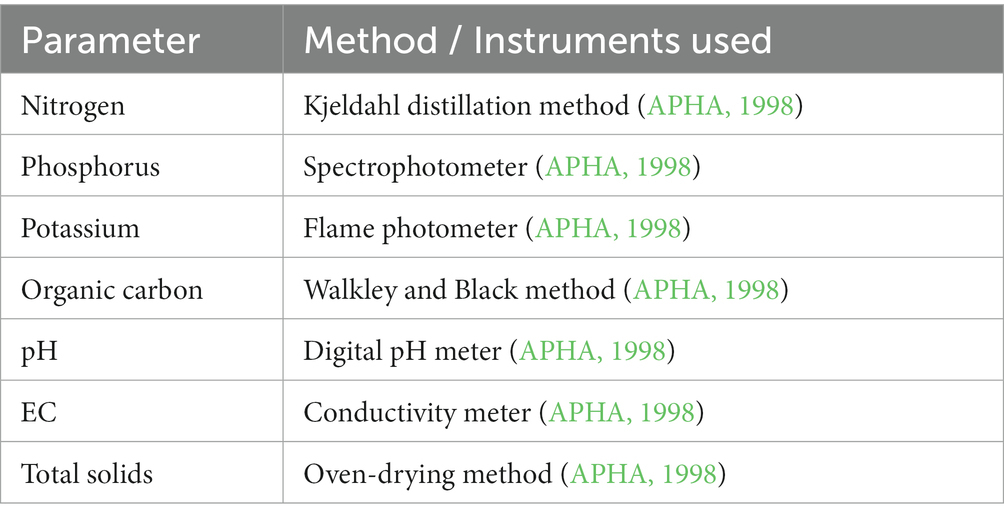
Table 2. Protocols and instruments used to determine the physico-chemical parameters of slurry.
All data were statistically analyzed using the standard procedures of the Analysis of Variance for a Completely Randomized Design to find out the mean, maximum, minimum, and standard error of the mean and least significant difference values for the fertilizer elements [i.e., total nitrogen (TN), available nitrogen (AN), total phosphorus (TP), available phosphorus (AP), total potassium (TK), available potassium (AK), organic carbon (OC)], and physico–chemical properties [i.e., pH, electrical conductivity (EC) and total solids (TS)] of the studied slurries. The significance of the treatment was analyzed using the “F” test at a 5% probability level.
A statistical analysis was performed for each season (pre-monsoon, monsoon, and post-monsoon) and the three locations (IARI, Daryapur Kalan, and Madanpur) in order to analyze their variability. The slurry’s temporal variations were examined using a one-way Analysis of Variance (ANOVA). Furthermore, a correlation analysis, specifically Pearson’s coefficient of linear correlation, was conducted to explore the relationship between the nutrient content of the slurry and the physical properties under investigation.
Concerning the cattle slurries, the type of feeding adapted, management of dairy farm and slurry collection tank storage and dilution and the season variation in the three dairy farm system had influence on slurry characteristics. As presented in Table 3, the data has been methodically organized in a chronological sequence. This arrangement aims to facilitate the comprehension of shifts in slurry characteristics, specifically tracking the changes from the pre-monsoon to the monsoon season (June to September) and from the monsoon to the post-monsoon period (October to December). The samples were first obtained in the pre-monsoon season between March and May. The ANOVA showed a significant difference between the dairy farming systems for all the parameters except for EC and pH in IARI and Daryapur Kalan. The pH value observed in IARI was found to be slightly higher on the alkaline side. The average values of total N and available N were analyzed, revealing a consistent pattern of decrease from pre-monsoon to post-monsoon seasons. The lowest average values were observed during the post-monsoon season, with total N and available N as 18,623 mg/ L and 490 mg/ L, and the highest was recorded for the pre-monsoon season as 19,987 mg/ L total N and 549 mg/ L available N. In addition to this, the highest average values were recorded for the IFS in IARI, with total N amounting to 21,828 mg/L and available N as 538 mg/L, followed by the floating dome biogas plant installed in Daryapur Kalan with a total N of 18,769 and available N as 514 mg/L. The lowest average values were observed in the Madanpur district of Uttar Pradesh, with 17,759 and 501 total and available N, respectively. A significant difference (p < 0.05) was observed among all three locations. This indicates a systematic decrease in the levels of total and available N during the period between the pre-monsoon and post-monsoon seasons. Significant differences in total and available P contents were also found among different dairy farm systems. The average values of available and total P remained relatively constant during the pre-monsoon, monsoon, and post-monsoon seasons in all three locations, with the average values for total and available P being 8,331 mg/L, 2918 mg/L in the pre-monsoon, 8,307 mg/L 2897 mg/L in the monsoon, and 8,295 mg/L 2863 mg/L in pthe ost-monsoon season, respectively. Only in the case of K were the average values were seen to be contrasting as compared to N. The highest average total and available K were observed to be in the post-monsoon season at 3815 mg/L and 855 mg/L, while the lowest values were seen in the pre-monsoon season at 2875 mg/L and 666 mg/L for total and available P. Throughout the analysis, the highest values were observed for total and available N during the pre-monsoon season. These values reflect the different degrees of mineralization of N that can be observed during seasonal variation, the dairy farm management system, and the dietary intake of the animals, whereas the lowest values were observed for total and available K in the pre-monsoon season and a relatively constant level was observed for total and available P in all three seasons. In this context (Duthion and Germon, 1979), the majority of the phosphorus (approximately 80% of the total amount) was identified within the solid part of the slurry, existing in an inorganic form that plants can directly absorb. The remaining 20% was present in an organic form.
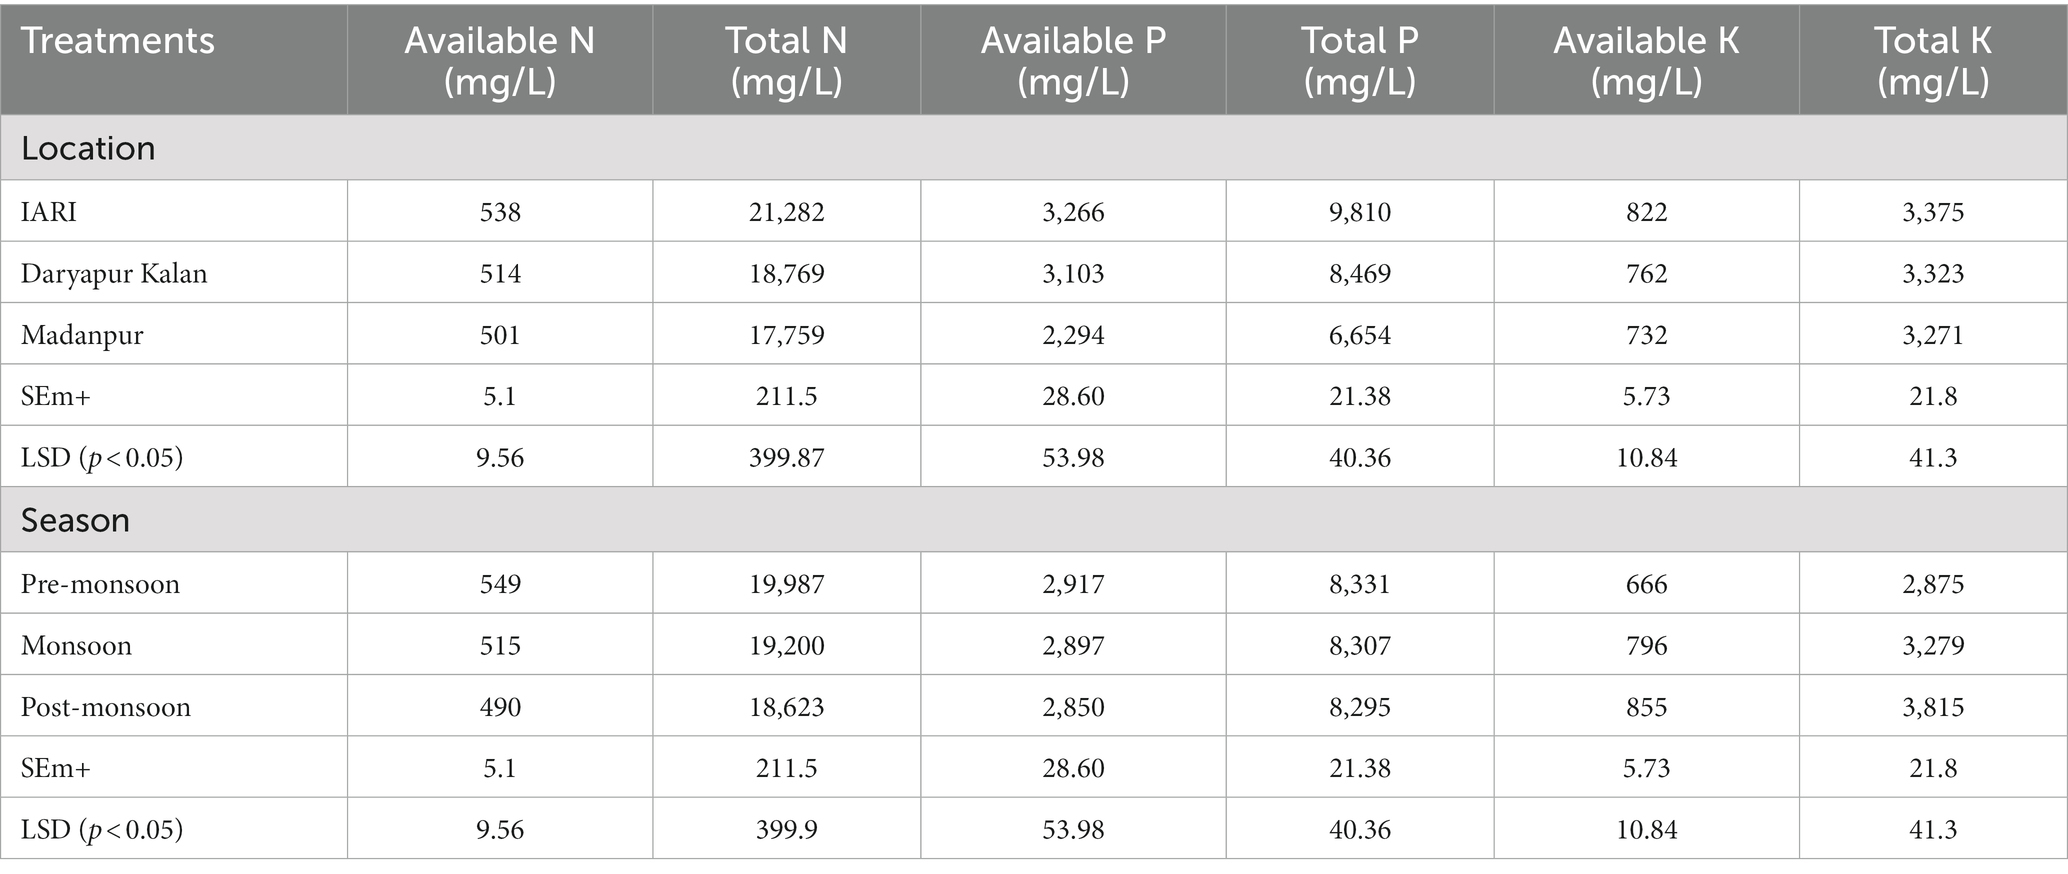
Table 3. Variation in the total and available nitrogen (N), phosphorus (P), and potassium (K) composition of biogas slurry as influenced by location and season.
The organic carbon (OC) in the biogas slurry (Table 4) contributes to the stability of microorganisms, which in turn continues the process of decomposition activity and improves the nutrient dynamics of the digestate quality. In the slurry samples studied, the values of OC ranged from 42.0 to 46.8%, with the highest percentage observed in the pre-monsoon season. Total solids are the amount of material in the slurry that is not water. The values for TS ranged from 5.2 to 6%, with the highest percentage observed in the post-monsoon season. The values for EC ranged from 1.7 to 1.8 (ms/cm), with the highest conductivity observed in the pre-monsoon season. The pH values, which are a measure of the acidity or alkalinity of an organic or inorganic substance, ranged from 7.6 to 8.3, with the highest pH value observed in the pre-monsoon season. Most of the slurry samples analyzed had a pH level above the neutral range. Thus, slurry is said to have properties that can help correct soil acidity (Sánchez and González, 2005). The addition of organic fertilizers to acidic soils increases soil organic matter content, reduces Al (aluminum) toxicity, and improves conditions for plant growth (Wong et al., 2003).
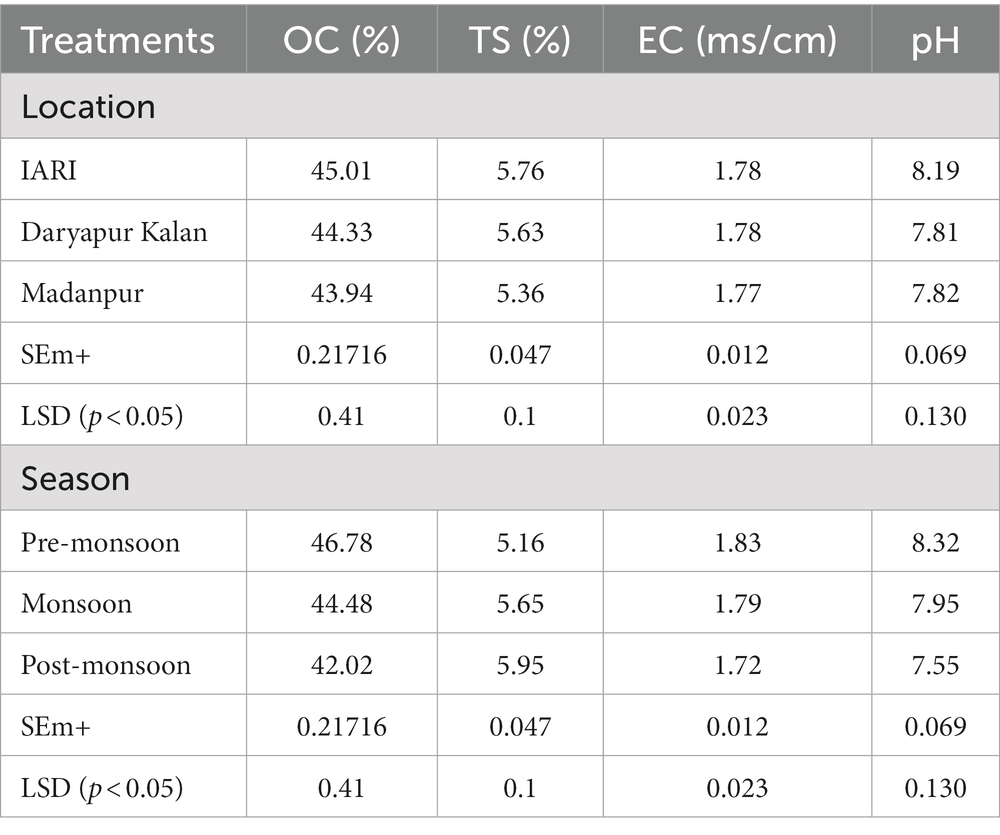
Table 4. Variation in biogas slurry characteristics as influenced by location and season: total solids (TS), organic carbon (OC), electrical conductivity (EC), and pH.
The interaction effects of seasons (pre-monsoon, monsoon, and post-monsoon) and locations (IARI, Daryapur Kalan, and Madanpur) on TN, AN, TP, AP, TK, AK, OC, TS, EC, pH, OC, and TS levels depicted in Figures 1–5 were highest in the pre-monsoon and gradually decreased in the monsoon and post-monsoon seasons. EC was highest in the pre-monsoon and lowest in the post-monsoon season, while pH was highest in tge pre-monsoon and gradually decreased in the monsoon and post-monsoon seasons. Overall, the results suggest that the season and location have a significant impact on the different parameters analyzed. In terms of organic carbon (OC) content, IARI had the highest value (45.0%), followed by Daryapur Kalan (44.3%) and Madanpur (43.9%). During the three seasons, the highest OC content was found during the pre-monsoon season (46.8%), followed by the monsoon season (44.5%), and the post-monsoon season (42.0%). In terms of total solids (TS) content, all three locations had similar values, with Madanpur having the lowest value (5.4%), and Daryapur Kalan and IARI having the value 5.6% and 5.76%, respectively. The TS content was the highest during the post-monsoon season (6%), followed by the monsoon season (5.7%) and the pre-monsoon season (5.2%). For electrical conductivity (EC), all three locations had similar values, with IARI having the highest level (1.78 ms/cm) and Madanpur having the lowest (1.77 ms/cm). The EC values were highest during the pre-monsoon season (1.83 ms/cm), followed by the monsoon season (1.79 ms/cm), and the post-monsoon season (1.72 ms/cm). Finally for pH, IARI had the highest value (8.19), followed by the Madanpur (7.82) and Daryapur Kalan (7.81). The pre-monsoon season had the pH value (8.32), followed by the monsoon season (7.95), and the post-monsoon season (7.55).
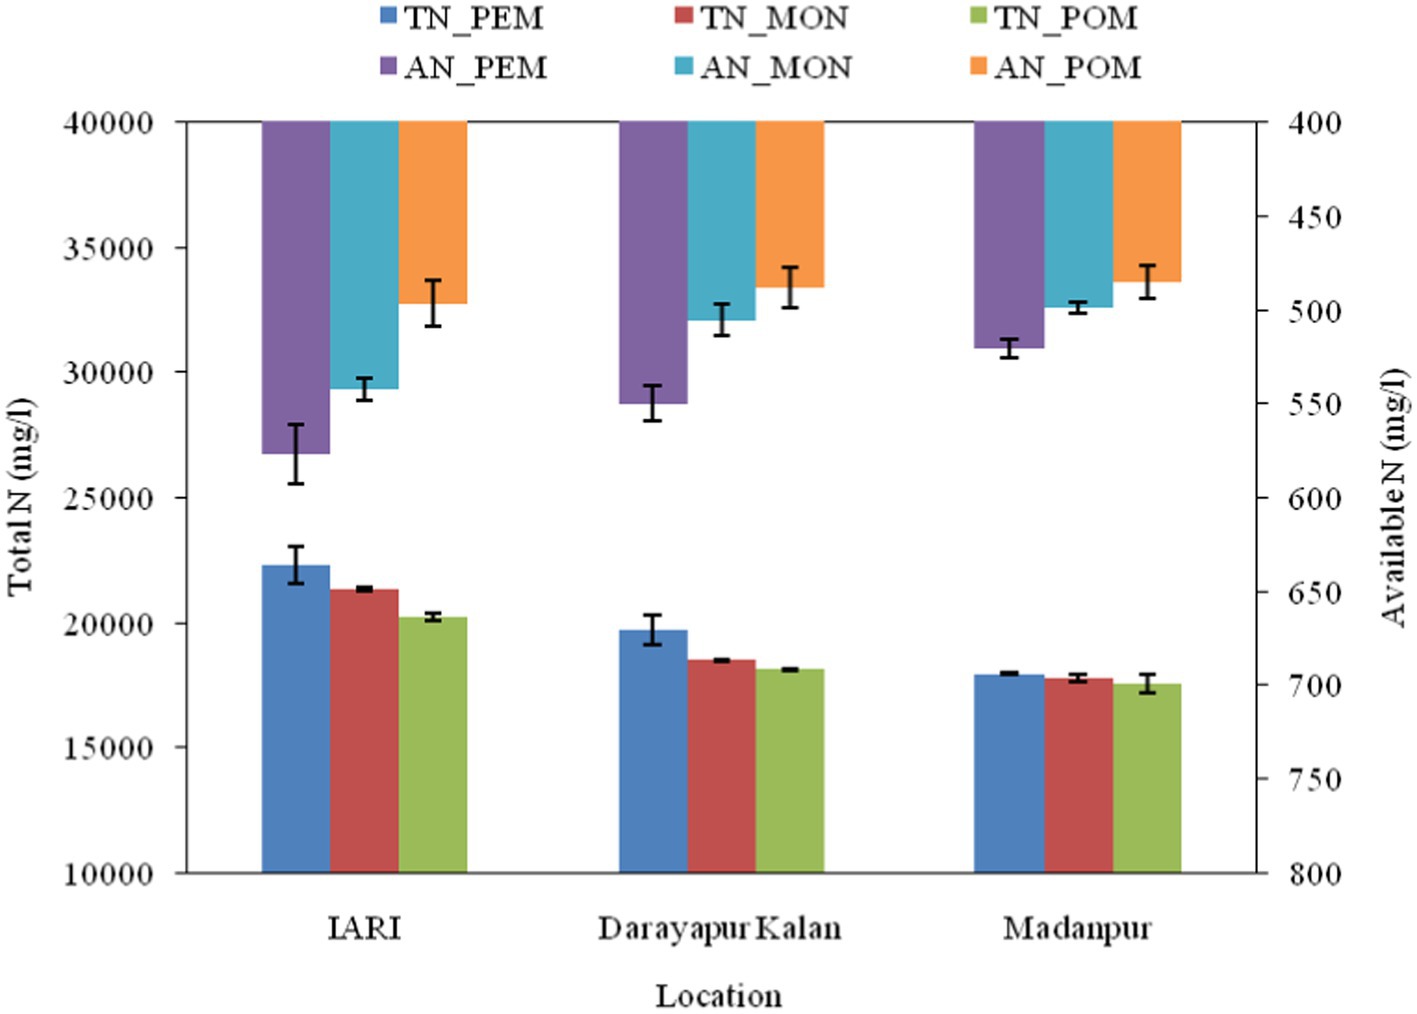
Figure 1. Spatio-temporal impact of biogas slurry on total and available N levels.
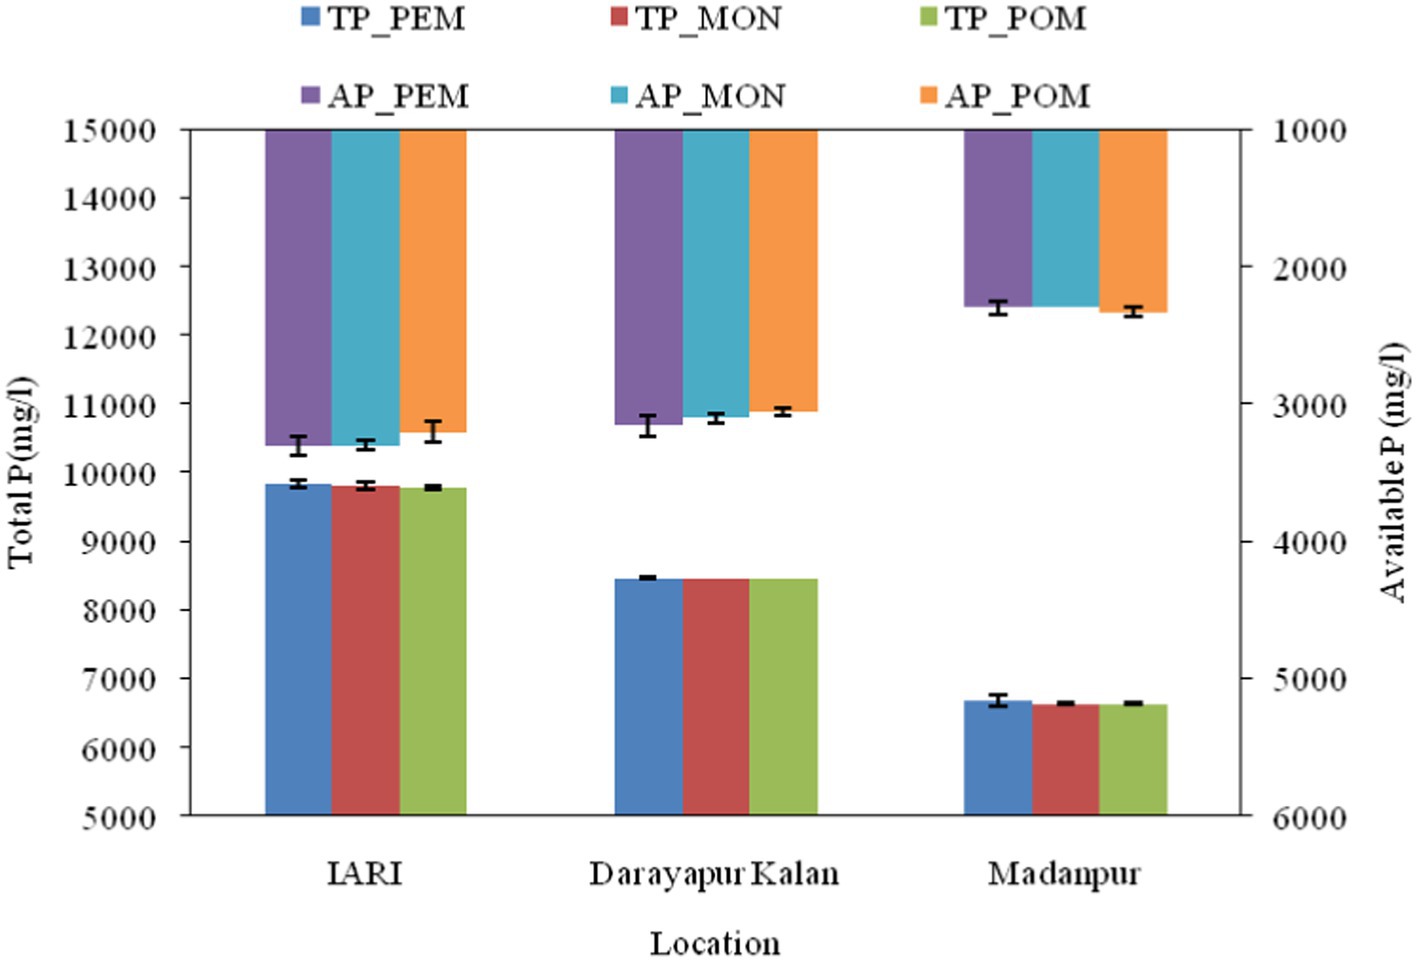
Figure 2. Spatio-temporal influence of biogas slurry on total and available P levels.
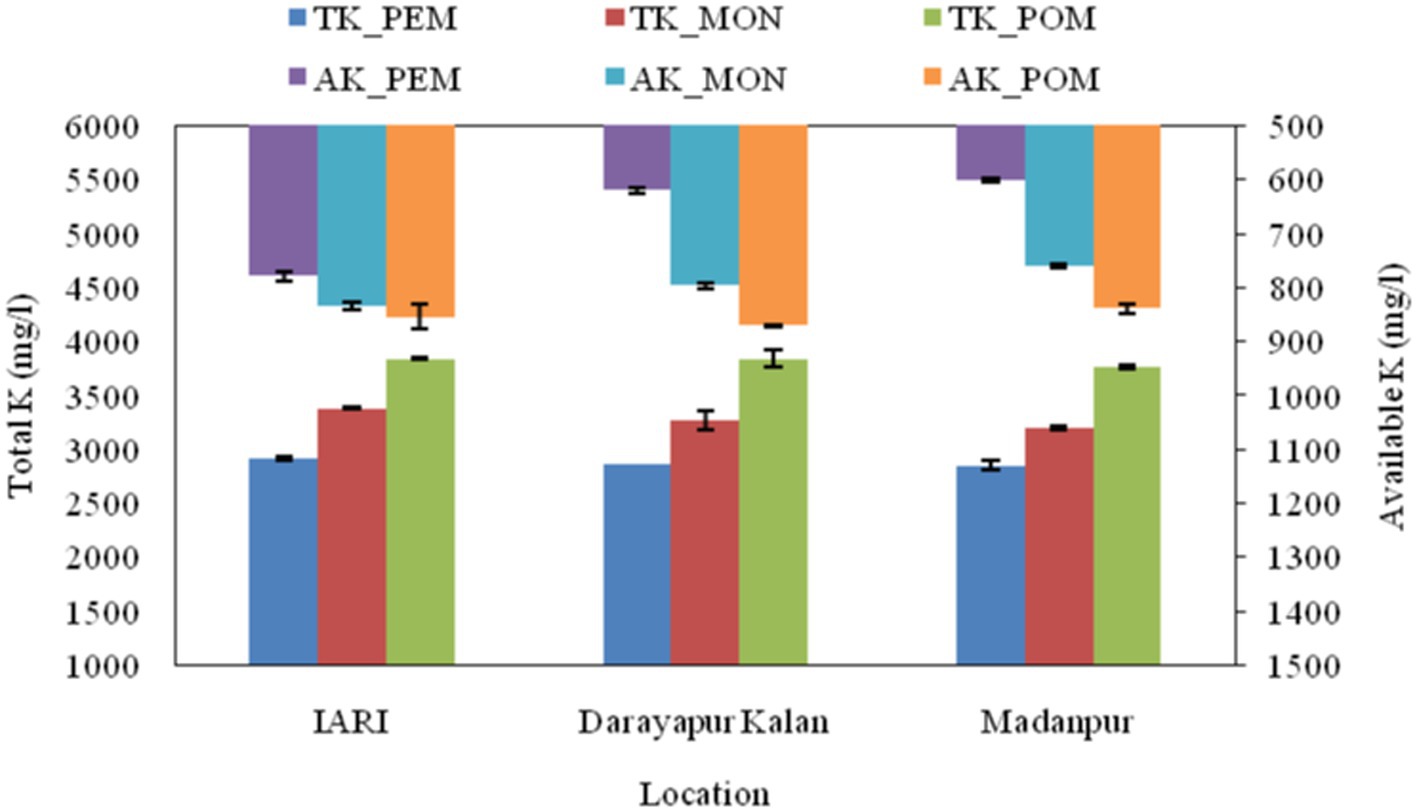
Figure 3. Spatio-temporal influence of biogas slurry on total and available K levels.
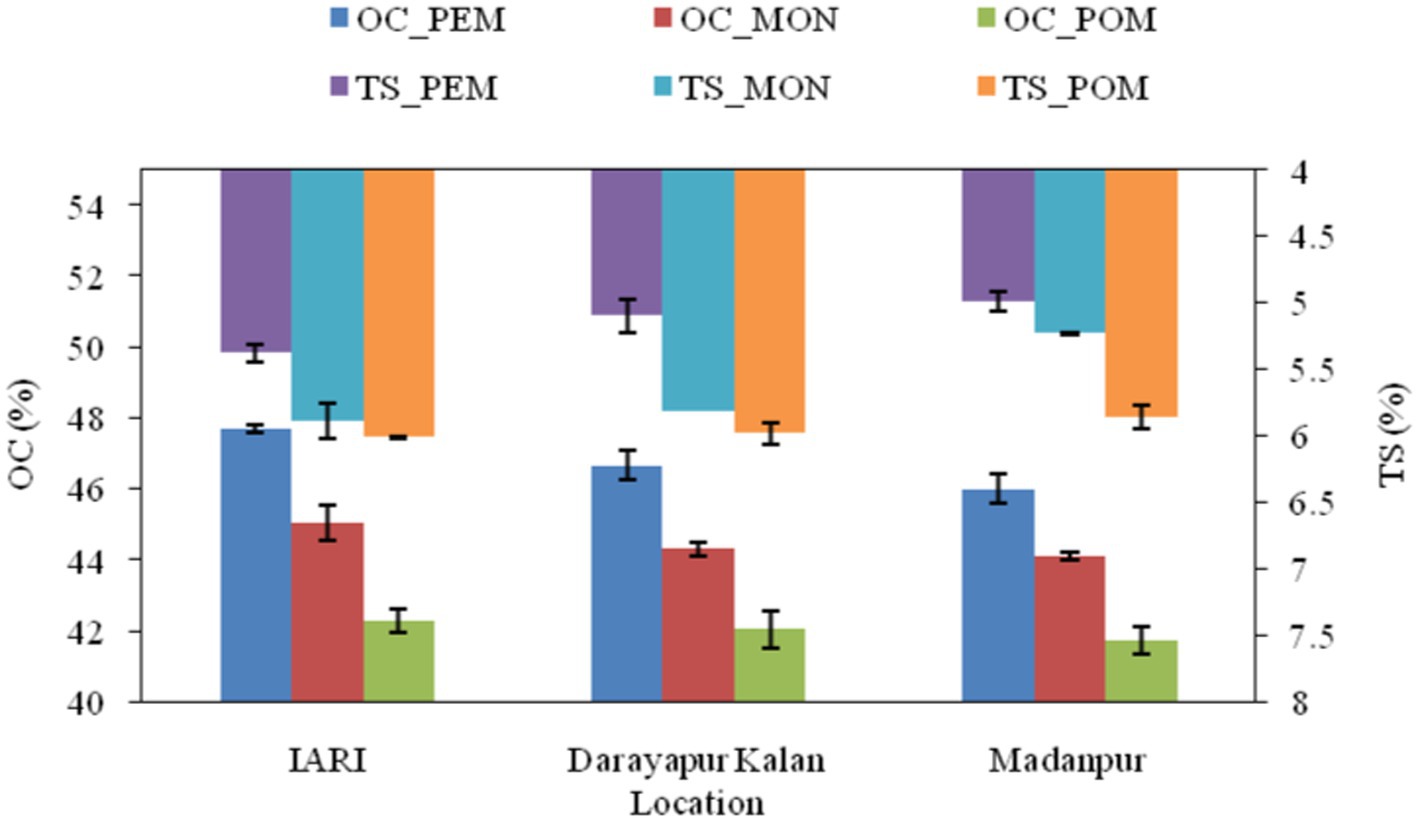
Figure 4. Spatio-temporal influence of biogas slurry on organic carbon and total solids levels.
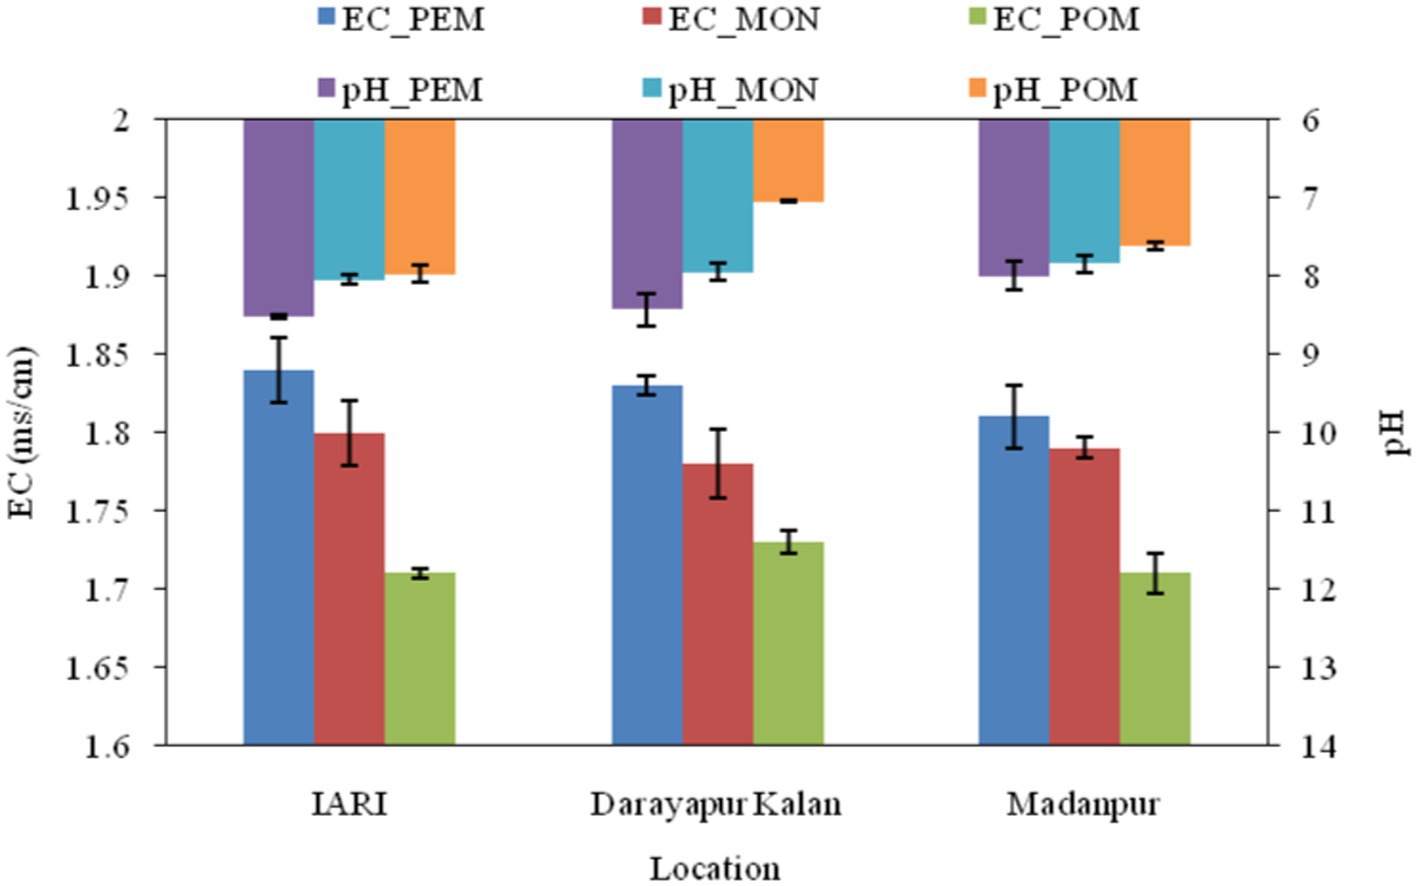
Figure 5. Spatio-temporal influence of biogas slurry on EC and pH levels.
The interactive effects of season and location on the mean C:N ratio of slurry (Figure 6) suggest that the C:N ratio is relatively consistent across the different seasons and samples, with some slight variations for IARI samples. But for the Madanpur location, post-monsoon season recorded significantly higher C:N ratios than post-monsoon season. At the Daryapur Kalan location, the monsoon season showed marginally higher values than the pre-monsoon season; the reverse was true for the other two locations.
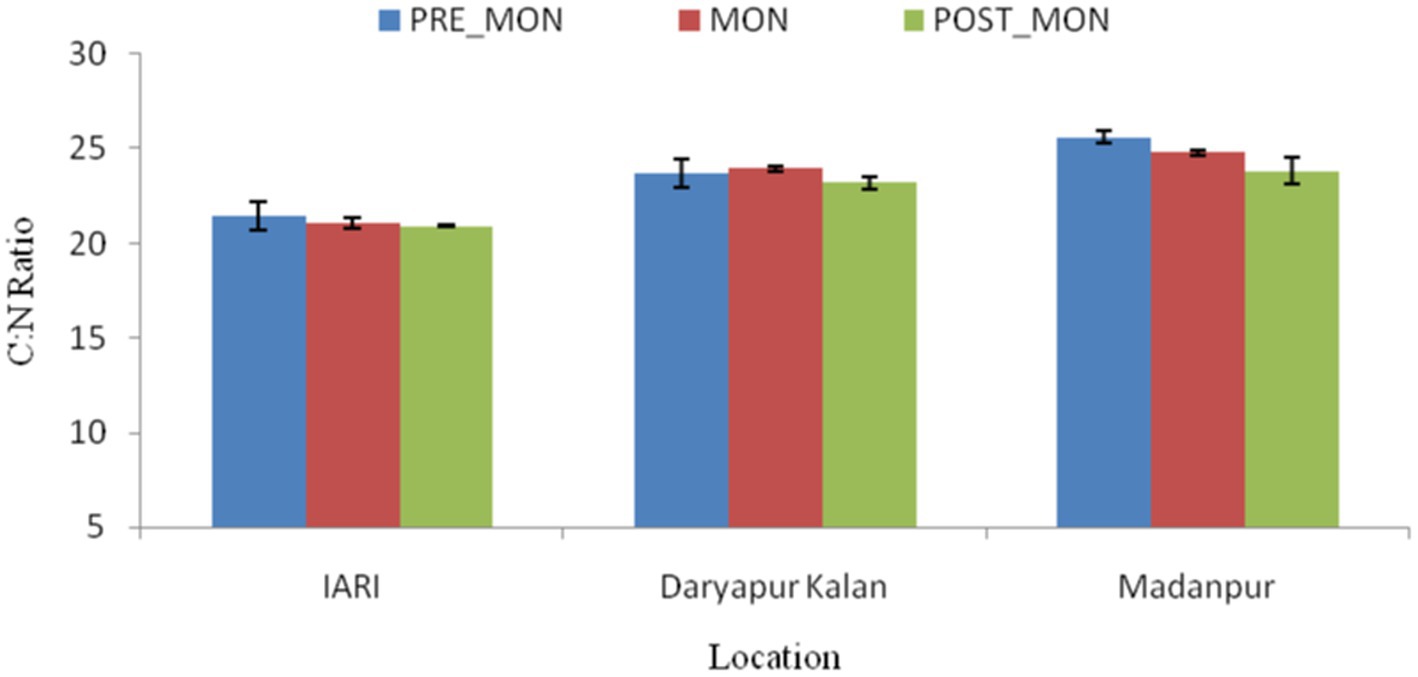
Figure 6. Comparative analysis of C:N ratios in biogas slurry samples.
The correlation matrix (Table 5) provides insights into the significance levels of Pearson’s correlation coefficients between different parameters in the studied slurries.
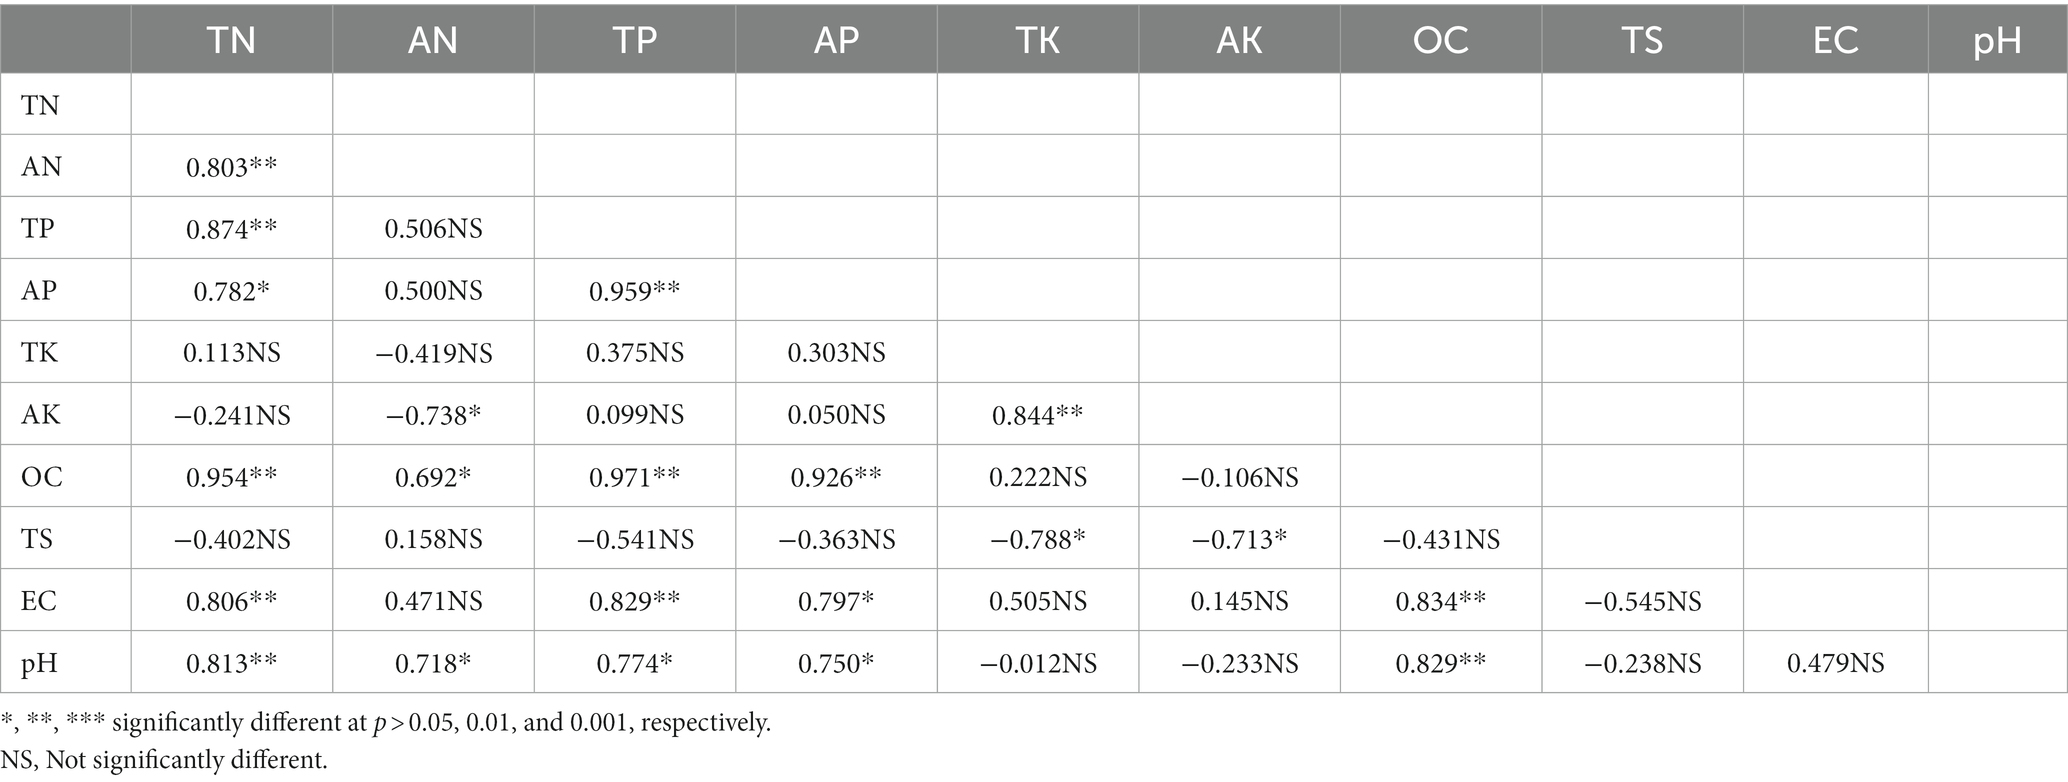
Table 5. Correlation matrix between the different parameters studied in biogas slurry.
The relationships between total N and available N, total P and available P, OC, EC, and pH were all positive and significant. It was interesting to note that, with increases or decreases in total N, most of the parameters studied frequently spiked or fell. However, total N did not correlate significantly with total K, available K, or TS. Available nitrogen and OC exhibited a very favorable association with one another, with available N tending to increase with OC. There did not appear to be any significant relationship between available N and the other parameters studied.
Strong and positive relationships existed between total P and available P, available N, OC, pH, and EC. These variables tended to increase or decrease together with total P. However, there was no significant correlation between total P and total K, available K, TS, or EC. Additionally, there was a significant positive association between available P and total P, indicating that as total P increased, available P tended to rise as well. However, no explicit relationship was observed between available P and the other factors.
Total K did not show any significant correlation with the other variables. On the other hand, there was a strong positive correlation between available K and total K, indicating that as total K increased, available K tended to increase as well.
In contrast to P and K, OC exhibited strong positive correlations with total N, available N, total P, available P, EC, and pH. These variables tended to increase or decrease in conjunction with OC. However, no significant correlation was observed between OC and total K, available K, or TS. Finally, there were no significant correlations between TS and any of the other variables. On the other hand, a positive and significant correlation existed between EC and total N.
The consumption and production of NPK in India are shown in Tables 6, 7. Based on the average nutrient content obtained from the study, which was total N (2.13%), total P (0.98%), and total K (0.38%), and considering the annual slurry production of 76.8 MT as mentioned in Kumar et al. (2015), the nutrient content provided by the slurry would amount to approximately 1.63 MT of N, 0.75 MT of P, and 0.29 MT of K. By comparing the nutrient content provided by the slurry to the consumption of NPK in India (Table 6), it is estimated that if slurry is used instead of synthetic fertilizer, there is the potential to reduce N consumption (Devarenjan et al., 2019; Ghosh et al., 2021) by approximately 8.78%, P consumption by approximately 11.01%, and K consumption by approximately 14.33%. The findings of Debebe and Soromessa (2019) through pilot research on the effects of utilizing bio-slurry in Ethiopia showed that 80.8% of users saved between $1,000 and $2,000 annually and 19.2% saved between $2,000 and $3,000 annually. The researchers took into account the fact that chemical fertilizers are more costly than the bio-slurry created by biogas facilities. Each family saved 39 kg of nitrogen, 19 kg of phosphate, and 39 kg of potash per year by using bio-slurry.
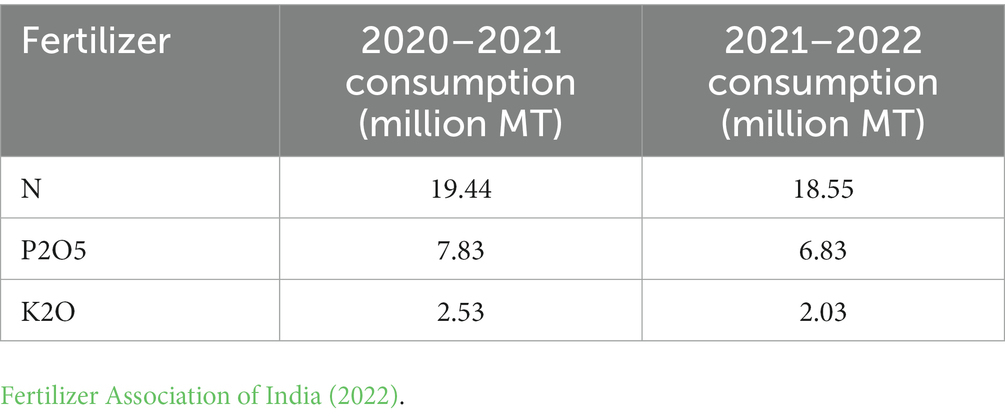
Table 6. Consumption of NPK for 2020–21 and 2021–22 in million metric tons (MT).
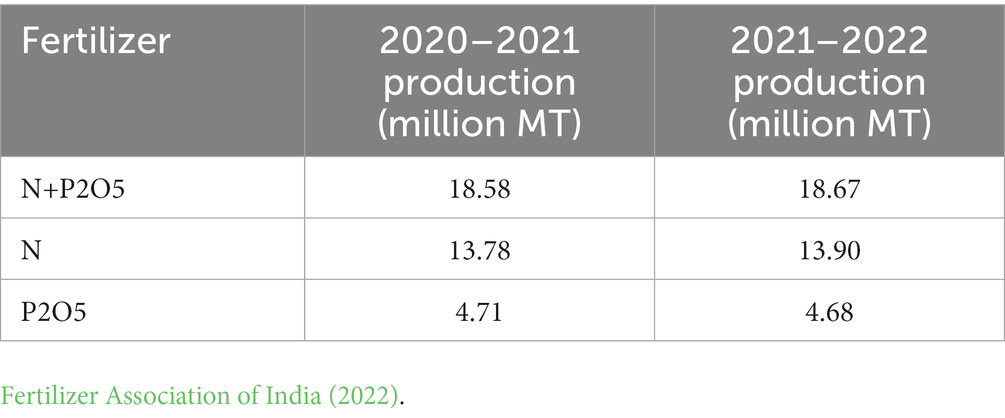
Table 7. Fertilizer production for 2020–2021 and 2021–2022 in million metric tons (MT).
The results of the biogas slurry nutrient analysis showed significant differences among dairy farm systems for all macronutrients. It is important to properly account for the nutrients present in agricultural systems based on the specific management methods employed on the farm. In other words, different nutrient management practices can affect the availability and distribution of nutrients in agricultural systems. To ensure accurate assessment and allocation of nutrients, it is necessary to consider the specific management system used and its impact on nutrient management. Specific seasonal manure analyzes are crucial for crop nutrition planning.
The results of the study revealed that the biogas plant utilizing cow dung from the farm with non-breeding cows as a substrate demonstrated higher efficiency in terms of sanitation compared to the biogas plant using cow dung from the farm with gestating cows as a substrate. Additionally, the biogas slurry obtained from an open earthen pit without coverage showed negative effects on nutrient content. Rainfall-induced nutrient loss and dilution could be responsible for this. Covering manure storage structures prevented water from soaking in and increasing the moisture content of the manure. Volatilization and evaporation losses are significantly reduced by synthetic coverings, such as those used in liquid manure storage facilities. The quantity of water can also be reduced by diverting precipitation away from manure heaps or packs (such as in dry lot settings) (Agriculture, Food, and Rural Development in Manitoba, 2015). In comparison with the biogas plant that used pig slurry from the maternal (breeding) farm as a substrate, the efficiency of sanitization of the input biomass, such as pig slurry, was significantly higher in the fattening farm-based biogas plant (Pietruszka et al., 2023). To enhance the nutrient content of the biogas slurry used as fertilizer in agriculture, it is advisable to prioritize the utilization of cow dung with a higher proportion of fattening or non-breeding cows rather than gestating cows. Furthermore, the study highlights how the dilution used during the feeding input for biogas production has a notable impact on the nutrient concentration of the biogas slurry. Careful management of the dilution process can help maintain optimal nutrient levels in the slurry. Dilution of the slurry with water has the greatest effect on the concentration of certain elements and chemical compounds in the mixture. The more diluted the slurry, the fewer chemical components it contains (Marszałek et al., 2014). In summary, by utilizing cow dung with a greater proportion of fattening or non-breeding cows, ensuring proper sanitation practices, and minimizing dilution during the feeding input stage, the nutrient content of biogas slurry can be increased. Several previous studies have revealed that feeding beef cattle a highly concentrated diet (60% C + 40% F) leads to the formation of manure with increased biogas output (Orrico Júnior et al., 2010; Costa et al., 2013; Mendonça Costa et al., 2016). The selection of cow dung from the former sources contributes to improved sanitation and nutrient preservation during the biogas production process. This enhanced slurry can then be effectively used as fertilizer in agricultural practices. Additionally, the fertilizer produced by the anaerobic digestion of manure from properly fed animals has a higher macronutrient content and, thus, a better agronomic value. Kowalski et al. (2013) discovered that the analysis of the average values for N, biochemical oxygen demand, P, and dry mass in pig slurry revealed a trend of higher average values occurring during the spring season, with the lowest average results being found in winter; only in the case of K, the average values remained at nearly the same level throughout the year. The analysis of the average values of TN (total nitrogen), AN (available nitrogen), OC (organic carbon), EC (electrical conductivity), pH, and TS (total solids) in different seasons revealed a consistent pattern of decrease between monsoon and post-monsoon periods. However, TK (total potassium) and AK (available potassium) displayed the opposite trend, showing an increase during the same time frame. On the other hand, TP (total phosphorus) and AP (available phosphorus) remained relatively consistent in all three seasons, from pre-monsoon to post-monsoon. A similar study reported that summer and fall dairy manure had higher nutrient levels than winter and spring manure (Rieck-Hinz et al., 2013).
Based on the correlation matrix, it could be inferred that N (nitrogen) can be predicted using any of the mentioned parameters, as it exhibits a positive correlation with all of them except for potassium. Moreover, the nitrogen content shows a positive correlation with pH in all seasons of the biogas slurry sample. However, predicting phosphorus and potassium using easily determined parameters such as pH and electrical conductivity (EC) proves to be challenging. Among the easily determined parameters, pH was found to have the highest correlation with other parameters, except for potassium and total solids.
The current study shows that seasonal variations affect the properties of slurry and emphasizes the importance of season-specific analyzes for accurate nutritional planning. The parameters TN, AN, OC, EC, pH, and TS exhibited a systematic decrease from monsoon to post-monsoon season, while TK and AK showed the opposite trend. TP and AP, however, remained stable throughout the different seasons. The correlation analysis revealed strong positive associations between nitrogen content in biogas slurry and phosphorus, potassium, total solids, and electrical conductivity. By replacing synthetic fertilizers with slurry, there is a potential reduction in N consumption of 8.78%, in P consumption of 11.01%, and in K consumption of 14.33%. These findings demonstrate the interdependence of nutrient content and physical properties in slurry. Effective management of nitrogen levels can impact the availability of other essential nutrients and enhance the overall quality of the slurry as fertilizer. By considering these correlations, farmers and researchers can make informed decisions about nutrient management, the use of biogas slurry in fertigation, and tailor the application of biogas slurry to maximize its effectiveness as a fertilizer.
The original contributions presented in the study are included in the article/supplementary material, further inquiries can be directed to the corresponding author.
SS: conceptualization, visualization, and supervision. RY and SS: investigation and writing. KL, AbD, AnD, and RY: methodology. KL, AnD, and AbD: validation. AnD and MK: formal analysis. SS, KL, MK, KB, and HK: resources. RY, AK, and RN: data curation. SS, AnD, KL, MK, HK, and KB: writing, review and editing. All authors contributed to the article and approved the submitted version.
The authors are grateful to the Director and Dean of ICAR-IARI, New Delhi, for granting a fellowship to RY and to the Project Director and Professor of Water Technology Centre, ICAR-IARI, New Delhi, for providing necessary facilities and project staff during the research program.
The authors declare that the research was conducted in the absence of any commercial or financial relationships that could be construed as a potential conflict of interest.
All claims expressed in this article are solely those of the authors and do not necessarily represent those of their affiliated organizations, or those of the publisher, the editors and the reviewers. Any product that may be evaluated in this article, or claim that may be made by its manufacturer, is not guaranteed or endorsed by the publisher.
Agriculture, Food, and Rural Development in Manitoba . (2015). Properties of manure.YWdyaWVudkBnb3YubWIuY2E=manitoba.ca/agriculture
APHA (1998). Standard methods for the examination of water and wastewater. American Public Health Association, American Water Works Association and Water Environmental Federation, Washington, DC.
Costa, M. S. S. D. M., Costa, L. A. D. M., De, L. J., and Pivetta, L. A. (2013). Potentials of biogas production from super young bulls manure fed with different diets. EngenhariaAgrícola 33, 1090–1098. doi: 10.1590/S0100-69162013000600002
Dass, A., Jat, S. L., and Rana, K. S. (2015a). “Resource conserving techniques for improving nitrogen-use efficiency” in Nutrient use efficiency: From basics to advances. eds. A. Rakshit, H. B. Singh, and A. Sen (New Delhi: Springer)
Dass, A., Lenka, N. K., Patnaik, U. S., and Sudhishri, S. (2008). Integrated nutrient Management for Production, economics, and soil improvement in winter vegetables. Int. J. Veg. Sci. 14, 104–120. doi: 10.1080/19315260801934266
Dass, A., Shivkumar, B. G., Dhar, S., and Kumar, K. (2015b). Soil and plant based precision N-management in rabimaize (Zea mays L.) in north-Indian alluvial plains. Ann. Agric. Res. 36, 358–363.
Dass, A., Sudhishri, S., and Lenka, N. K. (2013). Integrated nutrient management to improve finger millet productivity and soil conditions in hilly region of eastern India. J. Crop Improv. 27, 528–546. doi: 10.1080/15427528.2013.800828
Dass, A., Vyas, A. K., and Kaur, R. (2015c). Nitrogen management in precision farming by soil plant analyses development meter. e-planet 63, 33–35.
Debebe, Y., and Soromessa, T. (2019). Socio economic and environmental benefits of biogas slurry. J. Environ. Earth Sci. 6. doi: 10.13140/RG.2.2.14097.07521
Devarenjan, J., Herbert, G. M. J., and Amutha, D. (2019). Utilization of bioslurry from BiogasPlant as fertilizer. Int. J. Recent Technol. Eng. 4, 2277–3878. doi: 10.35940/ijrte.D8144.118419
Dikshit, A. K., and Pratap, S. (2010). Environmental value of dung in mixed crop-livestock systems. Indian J. Anim. Sci. 80, 679–682.
Duthion, C., and Germon, J. C. (1979). Land spreading of semi-liquid pig manure. Effect on soil, water and plants. Recherche Environnement (France).no. 11. The Commission of the European Communities, Directorate-General for Scientific and Technical Information and Information Management, European Centre, Kirchberg, Luxembourg.
Fertilizer Association of India (2022) Annual review of fertilizer production and consumption 2021-22. 893–895. Fertilizer Association of India. New Delhi
Germon, J. C., Duthion, C., Couton, Y., Grosman, R., Guenot, L., and Mortier, J. (1979). “Landspreading of liquid pig manure. III.1. Survey of the pig farms in the “Bresse”” in Effluents from livestock. ed. E. Grasser (London: Applied Science Publishers Ltd.), 80–95.
Ghosh, S., Sarkar, A., Bagdi, T., and Hazra, A. K. (2021). Organic farming and digested biogas slurry for sustainable agriculture in India: a review. J. Soc. Work Soc. Dev. 12:2.
GOI, Ministry of Chemicals and Fertilizers, Department of Fertilizers (2020). Annual Report 2020-2021 Government of India Ministry of Chemicals and Fertilizers Department of Fertilizers GOI, Ministry of Chemicals and Fertilizers, Department of Fertilizers, –New Delhi.
Hanway, J. J., and Heidal, H. (1952). Soil analysis methods as used in Iowa State College Soil Testing Laboratory. Iowa State College of Agriculture Bulletin 57, 1–31.
Kowalski, Z., Makara, A., and Fijorek, K. (2013). Changes in the properties of pig manure slurry. ActaBiochimicaPolonica 60, 845–850. doi: 10.18388/abp.2013_2070
Kumar, S., Lalchand, M., Mahesh, M., and Shakeel, K. (2015). Biogas slurry: source of nutrients for eco-friendly agriculture. Int. J. Extensive Res. 2, 42–46.
Manure Inventory . UMass extension, crops dairy, livestock equine publications. Factsheet 08-20. Boston (n.d.).
Marszałek, M., Kowalski, Z., and Makara, A. (2014). Physicochemical and microbiological characteristics of pig slurry. Technic. Trans. Chem. 1, 81–91.
Mendonça Costa, M. S. S., Lucas, J. Jr., Mendonça Costa, L. A., and Orrico, A. C. A. (2016). A highly concentrated diet increases biogas production and the agronomic value of young bull’s manure. Waste Manag. 48, 521–527. doi: 10.1016/j.wasman.2015.09.038
Mia, M. A. B., and Shamsuddin, Z. H. (2010). Rhizobium as a crop enhancer and biofertilizer for increased cereal production. Afr. J. Biotechnol. 9, 6001–6009.
Orrico Júnior, M. A. P., Orrico, A. C. A., and Lucas Júnior, J. d. (2010). Effects of roughage: concentrate in relation to time of hydraulic retention under anaerobic bio digestion of cattle manure. EngenhariaAgrícola 30, 386–394. doi: 10.1590/S0100-69162010000300003
Pietruszka, A., Maślanko, M., and Ciecholewska-Juśko, D. (2023). Sanitization of biomass in agricultural biogas plants depends on the type of substrates. Animals 13:855. doi: 10.3390/ani13050855
Promoting the Use of Organic Manure . (2017). National Centre for organic and natural farming, Ghaziabad, Ministry of Agriculture & Farmers Welfare, Delhi.
Rieck-Hinz, A. M., Miller, G. A., and Schafer, J. W. J. (2013). Nutrient content of dairy manure from three handling systems. J. Prod. Agric. 9, 82–86. doi: 10.2134/jpa1996.0082
Sánchez, M., and González, J. L. (2005). The fertilizer value of pig slurry. I. Values depending on the type of operation. Bioresour. Technol. 96, 1117–1123. doi: 10.1016/j.biortech.2004.10.002
Şencan, S., Öztürk, A. B., and Gülen, J., (2023). Process simulation of biohythane production by two-stage anaerobic fermentation process. 2nd international conference on innovative academic studies. 1–4. Konya, Türkiye
Singh, J. S., Pandey, V. C., and Singh, D. P. (2011). Efficient soil microorganisms: a new dimension for sustainable agriculture and environmental development. Agric. Ecosyst. Environ. 140, 339–353. doi: 10.1016/j.agee.2011.01.017
Subbiah, B. V., and Asija, G. L. (1956). A Rapid Procedure for the Estimation of Available Nitrogen in Soils. Current Science 25, 259–260.
SNV . (2011). Technology and mass- dissemination experiences from Asia. Biogas compact course. Oldenburg, PPRE- Oldenburg University.
Tirado, R., and Allsopp, M. (2012). Phosphorus in agriculture problems and solutions. Technical Report(Review), 36.
Townsend, A. R., Howarth, R. W., Bazzaz, F. A., Booth, M. S., Cleveland, C. C., Collinge, S. K., et al. (2003). Human health effects of a changing global nitrogen cycle. Front. Ecol. Environ. 1, 240–248. doi: 10.2307/3868011
Vinh, N. Q. (2010). Utilization of liquid bio-slurry as fertilizer for green mustards and lettuces in Dong Nai province, Vietnam Publication. Vietnam.
Walkley, A. J., and Black, I. A. (1934). Estimation of soil organic carbon by the chromic acid titration method. Soil Sci. 37, 29–38.
Wan, L. J., Tian, Y., He, M., Zheng, Y. Q., Lyu, Q., Xie, R. J., et al. (2021). Effects of chemical fertilizer combined with organic fertilizer application on soil properties, Citrus growth physiology, and yield. Agriculture 11:1207. doi: 10.3390/agriculture11121207
Keywords: biogas slurry, correlation, nutrigation, nutrient content, temporal variation, organic carbon
Citation: Yadav R, Sudhishri S, Khanna M, Lal K, Dass A, Kushwaha HL, Bandyopadhyay K, Dey A, Kushwah A and Nag RH (2023) Temporal characterization of biogas slurry: a pre-requisite for sustainable nutrigation in crop production. Front. Sustain. Food Syst. 7:1234472. doi: 10.3389/fsufs.2023.1234472
Edited by:
José Martinez, Institut National de recherche pour l’agriculture, l’alimentation et l’environnement (INRAE), FranceReviewed by:
Zichen Wang, Jiangsu Academy of Agricultural Sciences (JAAS), ChinaCopyright © 2023 Yadav, Sudhishri, Khanna, Lal, Dass, Kushwaha, Bandyopadhyay, Dey, Kushwah and Nag. This is an open-access article distributed under the terms of the Creative Commons Attribution License (CC BY). The use, distribution or reproduction in other forums is permitted, provided the original author(s) and the copyright owner(s) are credited and that the original publication in this journal is cited, in accordance with accepted academic practice. No use, distribution or reproduction is permitted which does not comply with these terms.
*Correspondence: Susama Sudhishri, c3VzYW1hX3NAcmVkaWZmbWFpbC5jb20=; Anchal Dass, YW5jaGFsX2lhcmlAcmVkaWZmbWFpbC5jb20=
Disclaimer: All claims expressed in this article are solely those of the authors and do not necessarily represent those of their affiliated organizations, or those of the publisher, the editors and the reviewers. Any product that may be evaluated in this article or claim that may be made by its manufacturer is not guaranteed or endorsed by the publisher.
Research integrity at Frontiers
Learn more about the work of our research integrity team to safeguard the quality of each article we publish.