 Himeno Sameshima
 Rie Akamatsu2*
 Fumi Hayashi
 Yukari Takemi
- 1Former Graduate School of Humanities and Sciences, Ochanomizu University, Bunkyo, Tokyo, Japan
- 2Natural Science Division, Faculty of Core Research, Ochanomizu University, Bunkyo, Tokyo, Japan
- 3Faculty of Nutrition, Kagawa Nutrition University, Sakado, Saitama, Japan
Introduction: Diets that promote people’s health and environment-friendly are essential for achieving a sustainable society. Protein sources are the main contributors of greenhouse gas emissions (GHGE), and lower intakes of livestock meat and more intakes of poultry meat and legumes are recommended. Although Japanese consume less meat than other countries, it is unclear whether the GHGE of healthy Japanese meals is sufficient to solve climate change. In addition, most previous studies have focused on general household meals, not necessarily healthy meals. Therefore, we explored recommended food choices of protein sources in both healthy and environment-friendly meals.
Methods: We used data on healthy meals provided by retailers certified under the “Healthy Meal and Food Environment” Certification System. We first examined the number of main ingredients in the staple, main, and side dishes. We then compared the GHGE of meals with different combinations of main ingredients of main dishes (protein sources). To estimate the GHGE, we developed a database of GHGE per food weight for each food in the Standard Tables of Food Composition in Japan.
Results: Data on a total of 509 meals were considered in the analysis. The mean ± standard deviation of the total GHGE of one meal was 1044.7 ± 614.9 g-CO2 eq/650 kcal. The minimum and maximum values were 412.5 and 4268.5 g-CO2 eq/650 kcal, respectively. Regarding meat, chicken was more likely to be used in meals with low GHGE.
Discussion: The healthy meals with the lowest GHGE in this study had the potential to contribute to solving climate change. Although healthy meals in this study were created with the same nutrient level criteria, a large difference existed between the minimum and maximum GHGE and it depends on the choice of protein ingredients. The findings may be useful to develop food guide for Japanese taking environmental perspectives into account.
1. Introduction
In future food choices, it is essential to consider not only people’s health, but also the global environment. Incorporating global environmental perspectives, the EAT-Lancet Committee has published guidelines for sustainable diets (Willett et al., 2019). They suggest a shift from an animal-based to a plant-based diet. For example, the guideline recommends 14 g of beef per day (Willett et al., 2019); this is a daily guideline, not for one meal, but per day. In addition, the EAT-Lancet guidelines are a uniform global policy, so each country needs to develop its own guidelines that take into account the health status and cultural background of the country (Willett et al., 2019). The Japanese Ministry of Agriculture, Forestry, and Fisheries (2022) has started to discuss the direction of future food guides based on the situation in other countries. The proposal was to add to the existing food guide “information that provides hints on specific food and ingredient choices in daily diets,” and to “quantitatively present such information using environmental indicators (Japanese Ministry of Agriculture, Forestry, and Fisheries, 2022).
One way to promote environmentally friendly food choices is to show the volume of greenhouse gas emissions (GHGE) contained in one meal (Japanese Ministry of Agriculture, Forestry, and Fisheries, 2022). The GHGE burden has been shown to vary widely among foods (Clune et al., 2017): vegetables, fruits, cereals (except rice), and pulses (including soybeans) have the lowest GHGE; eggs and non-ruminant livestock (fish, chicken, and pork) have medium GHGE; and ruminant livestock (sheep, cattle) have the highest GHGE. Meat has been shown to be the major source of GHGE emissions in the Japanese diet (Akenji et al., 2019; Sugimoto et al., 2021) and the factor that causes differences in GHGE emissions among household consumption (Koide et al., 2019; Li et al., 2022). Therefore, attention to the selection of protein sources may be important for reducing dietary GHGE.
A systematic review (Hallström et al., 2015) of the environmental impact reduction potential of dietary transformation included 12 studies that used GHGE as an environmental indicator and showed the GHGE reduction potential for each scenario compared with the reference diets in each study (the reference diets in most of the studies were estimated by using the average food intake in each country): vegan diet (no animal products, reduction potential: 25–55%), vegetarian diet (no meat products, 20–35%), ruminant replaced by non-ruminant (sheep and beef replaced by pork and chicken, 20–35%), and healthy diet (0–35%). Also, in examining meal levels, a meat-free diet reduced GHGE by up to 77% compared with the meat-containing diet (Ernstoff et al., 2019).
Previous studies in Japan have shown that the GHGE of diet or meals varied depending on the choice of protein source food groups (Ita et al., 2011; Sugimoto et al., 2021; Nakamura and Itsubo, 2022). However, the subjects of these previous studies were the average intake and model menus of the general population, not necessarily healthy meals. The average amount of protein source foods may differ between a typical family meal and a healthy meal. Therefore, understanding the environmentally desirable food choices and amounts of foods that serve as protein sources in healthy meals would enable us to propose both healthy and environmentally beneficial meals. However, to the best of our knowledge, no study has estimated GHGE in the Japanese healthy meals, and it is unclear whether the same food choices are recommended in healthy meals as in general household meals. The results of the comparison could also be applied to the development of food guidelines that incorporate environmental perspectives in Asian countries where rice is the staple food. This study follows the article that emphasizes the need to consider both health and environmental perspectives (Heller et al., 2013; Willett et al., 2019).
In Japan, the “Healthy Meal and Food Environment” Certification System was launched in 2018 to develop a healthy food environment (“Healthy Meal and Food Environment” Certification System, 2023a). It certifies retailers that continuously provide healthy meals in a healthy environment through restaurants, takeouts (bento), and office meal services. The meals provided by certified retailers are nutritionally balanced meals that meet certification standards (“Healthy Meal and Food Environment” Certification System, 2023b); therefore, the meals could serve as a model for Japanese healthy meals. Also, the meals include a staple, main, and side (SMS) dish (in this study, “dish” referred to a cuisine as part of a meal. For example, salad, grilled fish, omelet, and so on). SMS meals are a traditional style of Japanese cuisine. A higher frequency of SMS meals has been associated with a better intake of nutrients (Kurotani et al., 2018), and higher adherence to Japanese food guidelines that recommend SMS meals is associated with a lower risk of total mortality (Oba et al., 2009; Kurotani et al., 2016). Therefore, examining specific characteristics of these healthy Japanese SMS meals may provide useful insights for other countries. SMS dishes each have a main ingredient: for example, the main ingredient of main dishes are meat, fish, soybeans, and eggs (Yoshiike et al., 2007). The number of main ingredients per meal and the amount of each main ingredient serve as specific characteristics of a meal.
To promote diets that improve people’s health and are sustainable from the global environment perspective, we need to know what ingredients to choose in a meal. This study was conducted to provide basic data for developing food guidelines of a healthy meal with low environmental impact. We used data for healthy Japanese meals and (i) estimate GHGE of Japanese healthy meals and (ii) explored the main ingredients of main dishes (protein sources) in low-GHGE meals.
2. Materials and methods
2.1. Data collection
We used the dietary data for healthy meals provided by retailers certified under the “Healthy Meal and Food Environment” Certification System between 2018 and 2020 in Japan. The meals provided by certified retailers met certification standards. An English translation of the certification criteria is shown in Supplementary Table 1. The certification standards for the two patterns’ energy category are set as “More than 450 kcal and less than 650 kcal” and “More than 650 kcal and equal to or less than 850 kcal,” respectively. Each retailer registers more than one menu item. Certification is conducted by the Healthy Meal and Food Environment Consortium, which comprises multiple academic associations related to nutrition and disease.
We included all retailers certified by 2020 and collected dietary data from all businesses that provided consent to use the data. We collected data from application documents submitted by retailers. We obtained data for 602 meals (368 restaurant meals and 234 takeout meals) from 136 retailers (91 restaurants and 45 takeouts).
Prior to data collection, we asked the retailers through the certification system management office to indicate whether they approved the following condition related to the research data: “The contents of the application documents will be compiled and analyzed as a whole by the consortium or the secretariat, and presented publicly or at conferences, etc.” Those retailers who agreed to the same were included in the analysis. The Healthy Meal and Food Environment Consortium was informed of the use of the data from this survey and permission was obtained from them. Anonymous and statistical data collection was performed to ensure that individual retailers could not be identified, and efforts were made to protect personal information. As this study handled only dietary data, it was not subject to the Ethics Special Review Board of Ochanomizu University Biomedical Research.
2.2. Features of the meals: basic characteristics, nutrition quantity, and amount of food
The application documents submitted by the retailers included the retail sector, price, nutrition quantity, name of ingredients, and weight of ingredients in each meal. Because the nutrient calculation software differed among retailers, the researchers conducted nutrient calculations to unify them (Excel Eiyo-Kun ver. 8, Kenpakusha, Tokyo). The calculations were based on the food weight (g) of the ingredients reported by the retailers. Two researchers performed the nutritional calculations, and one researcher checked all the input data for any discrepancies with the data in the application documents of the retailers. After the nutritional calculations, the researchers confirmed that these nutritional quantities met the certification criteria.
In this study, the amount of food was calculated for each main ingredient of the SMS dishes. The definition of the main ingredients was based on the Japanese Food Guide Spinning Top (Japanese Ministry of Health Labour and Welfare, and Ministry of Agriculture, Forestry, and Fisheries, 2005; Yoshiike et al., 2007): main ingredients of staple dish (cereals); main ingredients of main dish [meat, fish and seafood (fish), soybeans, and eggs]; main ingredients of side dishes (vegetables, potatoes, mushrooms, and seaweed); and others (sugar, other beans, nuts, fat and oils, confectionary, beverage, and seasoning). In general, the main ingredients of these food groups were consistent with those in the Standard Tables of Food Composition in Japan (STFCJ; Japanese Ministry of Education, Culture, Sports, Science and Technology, 2015). As an exception, pulses were divided into soybeans and other beans because only soybeans are considered a main ingredient of main dishes.
In the data regarding the weight of ingredients submitted by the retailers, some of the same foods had different forms such as “raw” or “boiled.” Therefore, we unified the food weights before calculating the amount of food, using the method described in the National Health and Nutrition Survey (Japanese Ministry of Health, Labour and Welfare, 2019). Briefly, food weights were standardized to the steamed weight for rice, boiled weight for noodles, soaked weight for dried foods, and raw weight for all other ingredients.
2.3. The number of main ingredients of the SMS dishes
The main ingredients of the SMS dishes were defined based on the Japanese food guide. The main ingredients of each dish were as follows: staple dish—cereal; main dish—meat, fish, soybeans, eggs; and side dish—vegetables, potatoes, mushrooms, and seaweed. Of these food groups, we counted the number of main ingredients in the SMS dishes. According to a previous study (Torheim et al., 2003) that counted the number of foods, the criterion was to use at least 0.1 g of each food group per meal.
2.4. Main ingredients for main dishes (protein sources)
The main ingredients of the main dishes were further classified into the following eight protein sources: beef, pork, chicken, other livestock meat (other meat), processed meat products (ham), fish, soybeans, and eggs. Meat was divided into subcategories (beef, pork, chicken, other meat, and ham) because of the differences in the GHGE burden of this food group (Clune et al., 2017; Sugimoto et al., 2021).
2.5. Calculation of dietary GHGE
To estimate the GHGE of meals, we developed a database of GHGE per food weight (g-CO2 eq/g) for each of the foods in the STFCJ.
The method for creating the database was similar to the method described by Sugimoto et al. (2021) for creating the database for the production price-based Global Link Input–Output (GLIO) model. In their study, Sugimoto et al. (2021) created databases using three methods and compared them, and stated that the production price-based GLIO model method might be more valid than the other methods (literature-based method and consumption price-based GLIO model method).
Given the use of retailers’ meals in this study, many processed foods were not included in the STFCJ, and it was not possible to distinguish between cultured and natural fish. Therefore, we developed a new database with the aim of creating data for foods not listed in the STFCJ and data that take the production ratio of cultured and natural fish into account.
The method for creating the database has been described in detail by Sugimoto et al. (2021). Briefly, the database was developed through the following steps:
Step 1—Collection of unit production cost data: Collect unit production cost data for food commodities from the Table of Domestic Products (TDP) by Sector and Commodity 2005 (Japanese Ministry of Internal Affairs and Communications, 2005a).
Step 2—Supplementation of unit production cost data: For commodities for which unit production costs could not be collected in Step 1, data on production volume and production value were collected from national statistical data to calculate unit production costs. The statistical data used in this study are listed in Supplementary Table 2. For commodities for which unit production costs could not be collected in Step 1, data on production volume and production value were collected from national statistical data to calculate unit production costs (Japanese Ministry of Internal Affairs and Communications, 2005b; Japanese Ministry of Agriculture, Forestry and Fisheries, 2005a,b,c,d,e,f).
Step 3—Linking foods in the STFCJ to commodities in the TDP: For all foods in the STFCJ and all foods used in meals in this study, the food commodities in the TDP were linked. The rules for this link are based on those of Sugimoto et al. (2021).
Step 4—Calculation of unadjusted GHGE: The unit cost of the linked commodities was multiplied by the emission intensity of the commodities to obtain the GHGE (g-CO2 eq/g) per food weight for each food product. The emission intensity was obtained by downloading the GLIO model values from the website of the Embodied Energy and Emission Intensity Data for Japan Using Input–Output Tables (National Institute for Environmental Studies, 2012). Nansai et al. (2012) have described a method for setting emission intensity.
Step 5—Calculation of the adjusted GHGE: The GHGE obtained in Step 4 was adjusted according to the food disposal and weight change rates. The disposal rate and weight change rates were obtained from the STFCJ.
In particular, the following special measures were used for foods in the STFCJ tied to multiple commodities:
• Chestnuts: For the two commodities tied to fruit and forestry specialties, the average GHGE was used.
• Leachate (tea, coffee): Adjusted GHGE values based on the ingredients (e.g., tea leaves) and water content in the STFCJ were used. For example, according to the STFCJ, green tea leachate can be prepared using 10 g of tea leaves in 430 mL of hot water. Therefore, the GHGE value of “green tea leachate” was determined by taking the average GHGE of “green tea (TDP commodity code 1129011101)” multiplied by 10/440 and the GHGE of “green tea beverage (TDP commodity code 1129021301).” Sugimoto et al. (2021) applied this method for tea and coffee, and it was also used for dashi (Japanese soup stock) in this study.
• Processed food: The GHGE was calculated assuming that the food was made from the ingredients. In this study, the recipes for processed foods in the STFCJ were used as a reference. Based on the total weight of the processed food, the GHGE per unit weight of processed food (g-CO2 eq/g) was calculated.
• Fish and seaweed: Some fish and seaweed are tied to two or more of the following sectors in Step 3: marine fisheries, inland fisheries, marine aquaculture, and inland aquaculture. Sugimoto et al. (2021) used average GHGE values for multiple commodities. However, several fish species were biased toward one type of fishery. Therefore, in this study, the ratio of production for each type of fishery was determined and used to adjust the GHGE values. For example, “yellowtail” was tied to two commodities: “yellowtail (TDP commodities code 171011112)” for marine fishery and “yellowtail (TDP commodity code 311041102)” for marine aquaculture, with a 3:7 production ratio between these two items (Japanese Ministry of Agriculture, Forestry and Fisheries, 2005d). Therefore, the GHGE value for “yellowtail” was determined as the GHGE of “yellowtail” in marine fishery × 0.3 + the GHGE of “yellowtail” in marine aquaculture × 0.7. Adjustments were made for horse mackerel, ayu, carp, eel, salmon, flounder, pufferfish, yellowtail, bora, scallops, other shellfish, prawn, kelp, wakame seaweed, and other seaweed.
In addition to the GLIO model, the emission intensity of 3EID (Embodied Energy and Emission Intensity Data for Japan Using Input–Output Tables) is available. The most recent update of the GLIO model was in 2005, which is older than the 3EID model, which was updated in 2015. However, the 3EID assumes that all food is produced domestically, whereas the GLIO model can account for food production systems outside Japan in its calculations. Because Japan relies on imports for food (Japanese Ministry of Agriculture, Forestry and Fisheries, 2021) and it has been reported that the GHGE load of food varies widely by country of production (Clune et al., 2017), the emission intensity of the GLIO model was used in this study.
Although the STFCJ was revised in 2020 in Japan, this study used the revised STFCJ in 2015. This is because the healthy meals used in this study were nutritionally calculated and certified under the STFCJ revised in 2015. Supplementary Table S3 shows the number of foods in the completed database and the representative values of the GHGE by food group.
2.6. Data analysis
All statistical analyses were performed using SPSS ver. 27.0. Categorical variables were described as distribution and continuous variables were described as mean ± standard deviation. The amount of food in and the GHGE from the meals was adjusted to 650 kcal. Analysis of the GHGE and the amount of food of meals with different protein sources was performed only for the meal that had the greatest number of combinations of the number of main ingredients in each of the SMS dishes.
3. Results
Of the 602 meals for which dietary data were received, meals with missing data on the amount of ingredients and meals with overlapping menus among retailers were excluded; therefore, data on 509 meals were included in the analysis (analysis coverage, 84.6%).
3.1. Basic characteristics of the meals
The basic characteristics of the meals are listed in Table 1. The meals in this study were healthy and met the certification criteria. The criteria values for energy, fat, protein, and carbohydrate are presented as ranges in Supplementary Table 1. The nutritional quantity of meals in this study was approximately equal to the midpoint values of the criteria.
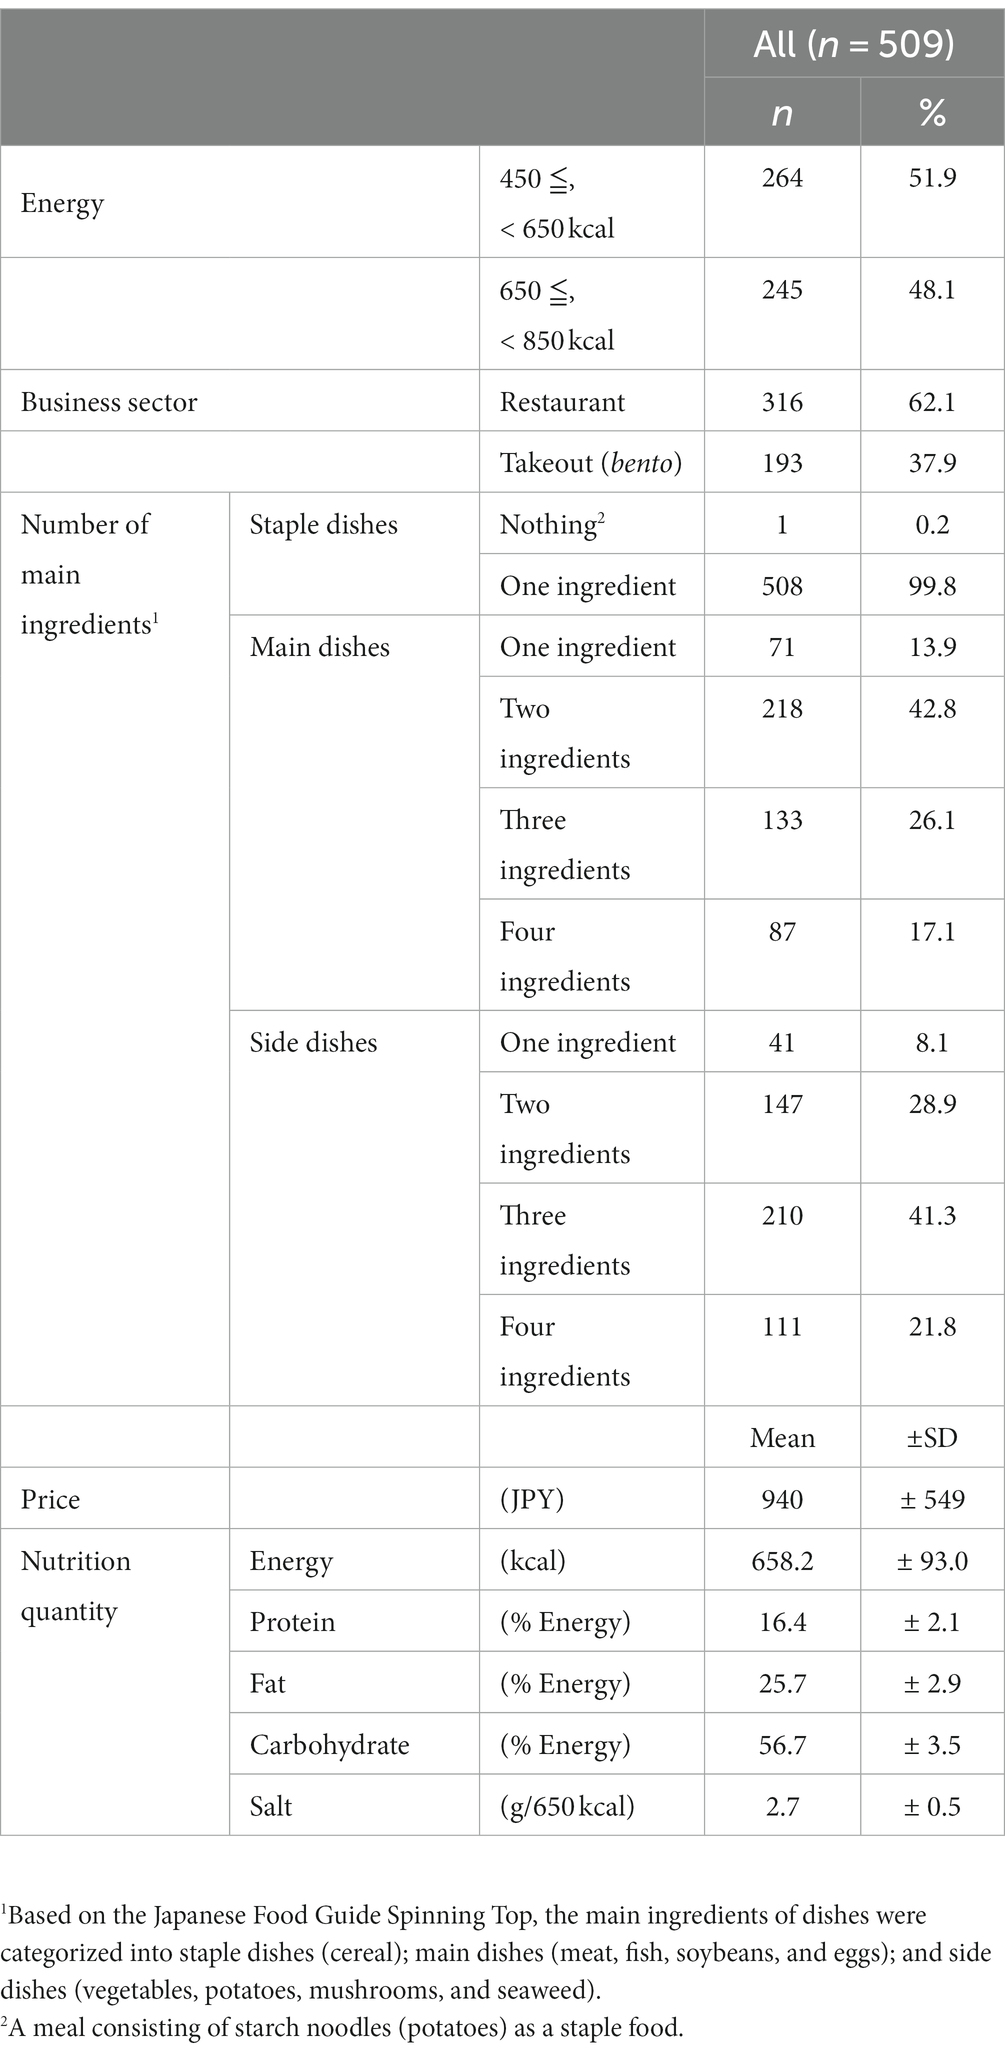
Table 1. Basic characteristics of diets included in this study (n = 509).
3.2. The number of main ingredients of the SMS dishes
The meals used in this study included SMS dishes and could be used as a model for healthy meals. We examined the number of main ingredient foods used in each of the SMS dishes in the meals. The results are shown in Table 1. There were 508 (99.8%) meals with one main ingredient as the staple food. Meals with one, two, three, or four main ingredients in the main dishes numbered 71 (13.9%), 218 (42.8%), 133 (26.1%), and 87 (17.1%), respectively. Meals with one, two, three, or four main ingredients in the side dishes numbered 41 (8.1%), 147 (28.9%), 210 (41.3%), and 111 (21.8%), respectively.
3.3. Mean, minimum, and maximum value of GHGE in all meals in the analysis
In this study, we estimated the GHGE of meals by developing a database of production price-based GLIO models, using a method similar to that of Sugimoto et al. (2021). The mean dietary GHGE in this study was 1044.7 g-CO2 eq/650 kcal. The minimum and maximum values were 412.5 and 4268.5 g-CO2 eq/650 kcal, respectively. The protein sources of the meals with the minimum GHGE were “fish, meat (chicken), soybeans” (GHGE: 129.3, 15.8, and 5.7 g-CO2 eq/650 kcal, respectively). The protein sources of the meals with the maximum GHGE were “meat (beef), fish, eggs” (GHGE: 1833.5, 1159.1, and 10.9 g-CO2 eq/650 kcal, respectively). Other meals with low GHGE used more chicken, while those with high GHGE used more beef.
3.4. GHGE of meals with different protein sources
Table 2 shows the differences in GHGE among meals with different protein sources. Table 2 lists the number of protein source ingredients in descending order; the GHGE of meals with more than 10% of combinations is shown first, and the GHGE of meals with less combinations is shown below in each number of protein source ingredients group.
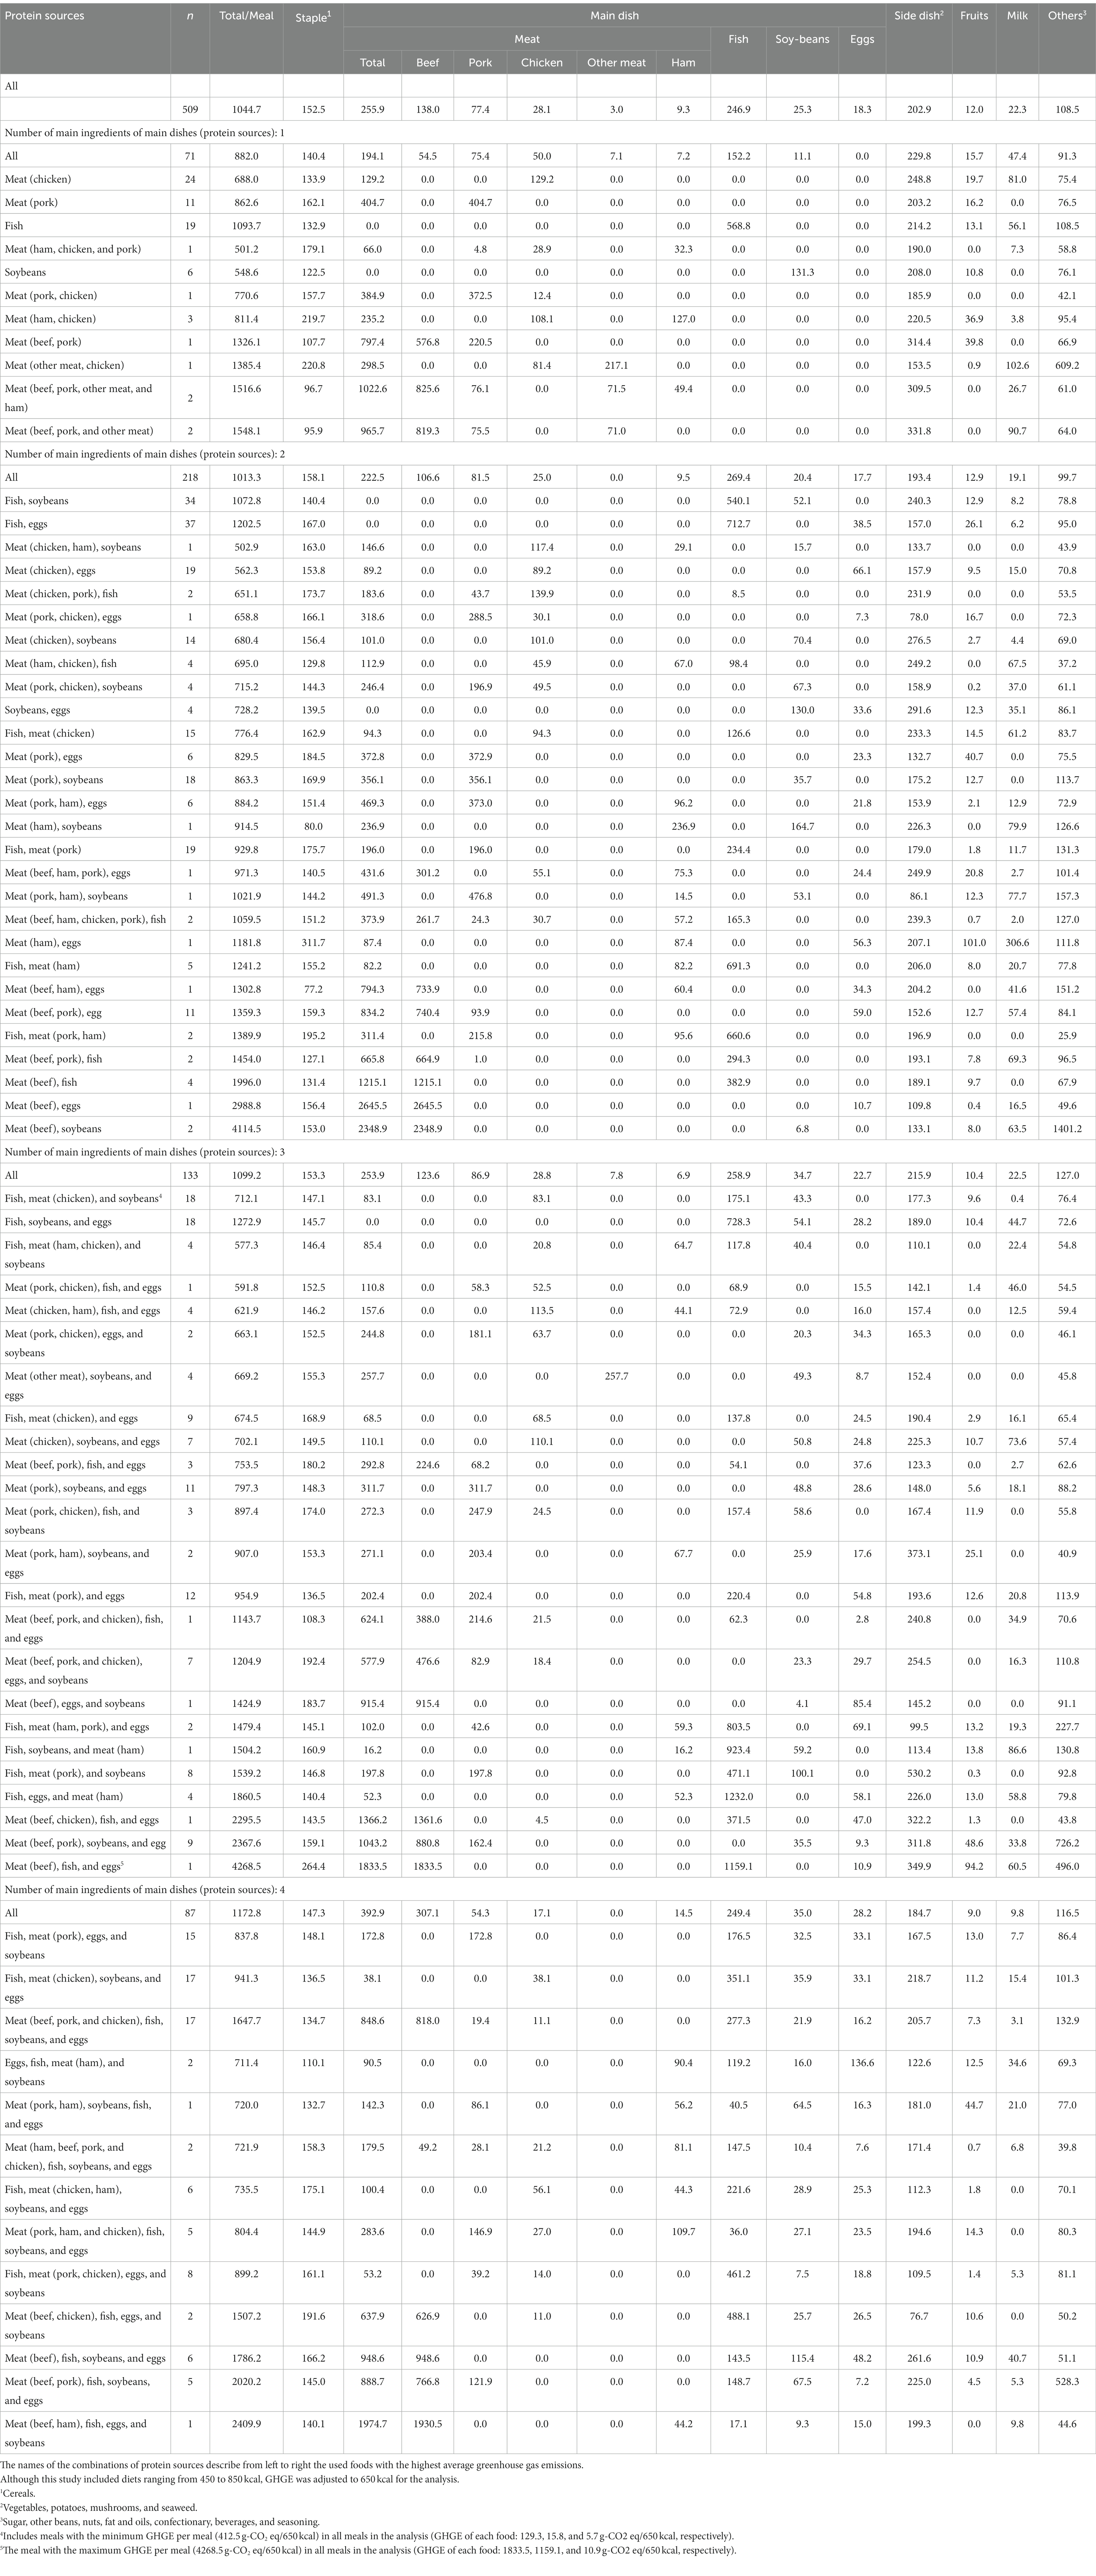
Table 2. Greenhouse gas emissions (g-CO2 eq/650 kcal) according to protein sources among Japanese healthy meals (n = 509).
The mean GHGE for one, two, three, or four protein sources were 882.0, 1013.3, 1099.2, and 1172.8 g-CO2 eq/650 kcal, respectively, and the GHGE tended to increase as the number of protein sources increased. Among the most common (more than 10% of each number of protein source ingredients group) meals with one protein source, the protein source was “meat (chicken),” “meat (pork),” and “fish” (GHGE [g-CO2 eq/650 kcal]: 688.0, 862.6, and 1093.7, respectively), in order from lowest to highest GHGE. In meals with two protein sources, the protein sources were “fish, soybeans” and “fish, eggs” (GHGE: 1072.8 and 1202.5, respectively). In meals with three protein sources, the protein sources were “fish, meat (chicken), soybeans” and “fish, soybeans, eggs” (GHGE: 712.1 and 1272.9, respectively). In meals with four protein sources, the protein sources were “fish, meat (pork), eggs, soybeans” “fish, meat (chicken), soybeans, eggs” and “meat (beef, pork, chicken), fish, soybeans, eggs” (GHGE: 837.8, 941.3, and 1647.7, respectively).
Supplementary Table 4 shows the GHGE for each main ingredient of side dishes, with the mean GHGE for vegetables, potatoes, mushrooms, and seaweed being 145.2, 11.1, 33.7, and 12.8 g-CO2 eq/650 kcal, respectively.
3.5. Amount of food of meals with different protein sources
Table 3 shows the amount of food used in the same meal as in Table 2: the items are arranged in the same order as those in Table 2.
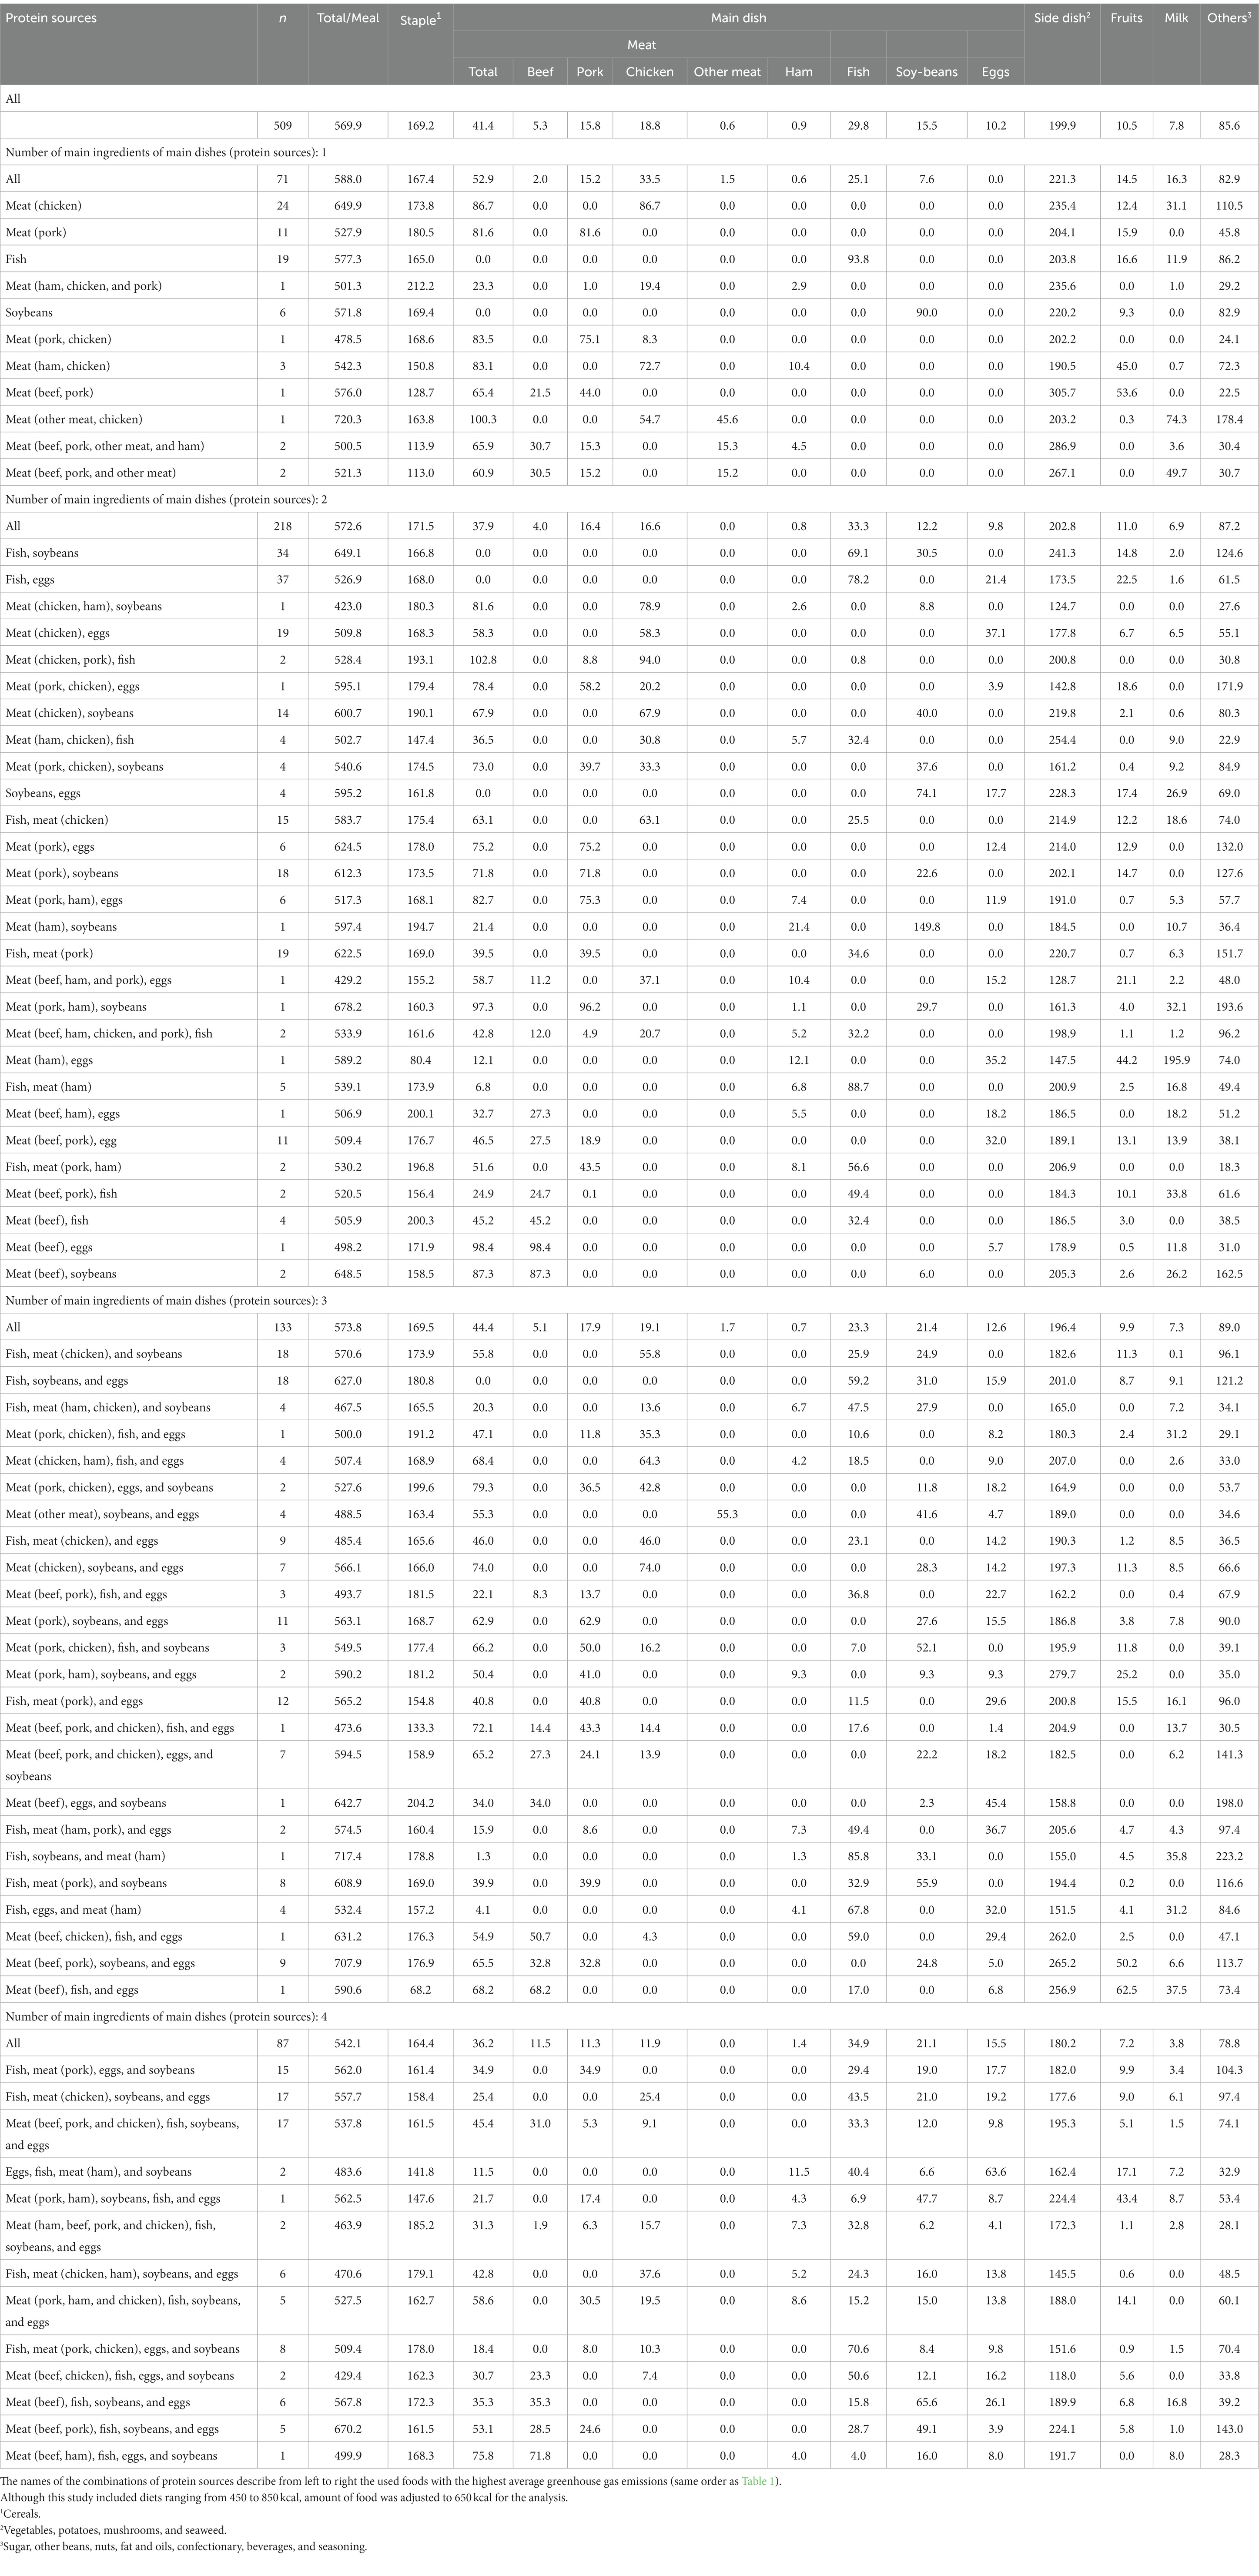
Table 3. Amount of food (g/650 kcal) according to protein sources among Japanese healthy meals (n = 509).
The mean amount of meat, fish, soybeans, and eggs were 41.4, 29.8, 15.5, and 10.2 g/650 kcal, respectively. “Meat (chicken)” was the meal with the lowest GHGE with one protein source, and the amount of chicken was 86.7 g/650 kcal. “Fish, soybeans” had the lowest GHGE of the meals with two protein sources, with 69.1 and 30.5 g/650 kcal of fish and soybeans used, respectively. “Fish, meat (chicken), soybeans” had the lowest GHGE among the meals with three protein sources, with 25.9, 55.8, and 24.9 g/650 kcal of fish, chicken, and soybeans, respectively. “Fish, meat (pork), eggs, soybeans” had the lowest GHGE among the meals with four protein sources, with fish, pork, eggs, and soybeans used at 29.4, 34.9, 17.7 and 19.0 g/650 kcal, respectively.
As for the main ingredients other than protein sources, the mean amount of cereals was 169.2 g/650 kcal (steamed weight for rice, boiled weight for noodles). Cereals included rice and wheat: 466 meals (91.6%) used rice, and 287 meals (56.4%) used wheat. Vegetables were used in all meals, and the mean amount was 167.1 g/650 kcal (Supplementary Table 5).
4. Discussion
This study aimed to examine desirable meals from two perspectives, namely, people’s health and the global environment, to develop food guidelines for sustainable diets in Japan. In particular, this study aimed to quantitatively demonstrate the differences in GHGE among different food choices in healthy meals. The results showed that despite using the same nutritional certification criteria, the GHGE of healthy meals varied greatly, depending on food choices. This study indicated that meals containing chicken may be desirable as a healthy meal that contributes to GHGE reduction.
In the present study, the minimum and maximum GHGE of a meal were 412.5 and 4268.5 g-CO2 eq/650 kcal, respectively, and a wide range of GHGE was observed among the meals. In previous studies, GHGE was compared between model meals of the general population (Ita et al., 2011; Ernstoff et al., 2019; Nakamura and Itsubo, 2022). In these previous studies, the maximum difference in GHGE between meals was about three times (the GHGE of a meatless meal showed a 77% reduction of GHGE compared with a meat-containing meal; Ernstoff et al., 2019). The present study showed a larger difference in GHGE between meals than previous studies. This difference may have been influenced by the fact that the meals used in this study were healthy meals, or due to differences in the comparison conditions (i.e., presence or absence of meat or combinations of protein sources). The type of meat was subdivided as a comparison condition in this study. This study implies that dietary GHGE may be more strongly influenced by the type of meat than by the occurrence of meat.
This study is possibly the first to estimate GHGEs for healthy meals in Japan, and the meals with the lowest GHGE in this study might be recommended for solving climate change; the previous study (Akenji et al., 2019) that examined the target amount of GHGE reduction to achieve the 1.5 degree goal for climate change reported that 67% GHGE reduction is needed for Japanese people from 2017 to 2030. Based on this previous study, the dietary GHGE as of 2017 was 1,400 kg-CO2 eq/capita/year, then we cloud estimate that Japanese people need to aim for about 462 kg-CO2 eq/capita/year, 1.3 kg-CO2 eq/person/day, and 422 g-CO2 eq/capita/meal. The minimum GHGE value in our study was 412.5 g-CO2 eq/meal, and approximately equal to the reduction target value. Therefore, the target value could be achieved by changing the food selection of protein sources.
In this study, chicken was found in meals with low GHGE, pork in meals with moderate GHGE, and beef and fish in meals with high GHGE. The results are consistent with previous studies that showed that meat and fish are the major sources of GHGE in the Japanese diet (Akenji et al., 2019; Sugimoto et al., 2021). The results were also consistent with previous studies that reported the GHGE load by food group (Sugimoto et al., 2021). Therefore, this study strengthened the evidence of recommendation of chicken-based meals for GHGE reduction, by the finding that they had the GHGE value that reaches the 1.5 degrees target for climate change. In addition, in this study, fish also appeared in some meals with low GHGE. Previous study has reported that different species of fish have different GHGE loads, for example, bluefish had a relatively low GHGE load (Clune et al., 2017). This may have influenced the result of this study. This study followed the food classification of Sugimoto et al. (2021) and therefore did not subdivide the species of fish, and few previous studies at meal-level have examined fish types separately and there were few references to fish species in existing food guides from other countries (Japanese Ministry of Agriculture, Forestry, and Fisheries, 2022). Future studies should examine fish species separately.
In this study, the GHGE of a meal tended to increase as the number of protein sources increased. This means that GHGE increased even when soybeans and eggs, which have a low GHGE load, were combined with meat and fish, which have a high GHGE load. Therefore, it may be possible to reduce the GHGE of a meal by reducing the number of protein sources.
The results that show the number of main ingredients in the SMS dishes may be used to support the preparation of healthy meals. For example, the use of three or more main ingredients for side dishes may have contributed to meeting the certification criterion which was used for the meals examined in this study (at least 140 g of vegetables including potatoes, mushrooms, and seaweed). In previous studies, although potatoes, mushrooms, and seaweed were excluded, young children with a high vegetable intake consumed five or more types of vegetables in one meal, indicating that the number of foods may be used as an indicator of high vegetable intake (Yoshii et al., 2021).
This study created a database of GHGE and calculated dietary GHGE in roughly the same manner as Sugimoto et al. (2021). As a result, the GHGE of meals in our study was lower than the daily GHGE of healthy Japanese adults reported by Sugimoto et al. (2021, 2022). The difference in the GHGE values may have been influenced by differences in the completed databases. Also, compared to the average food intake of the Japanese population reported in the National Health and Nutrition Survey (Japanese Ministry of Health, Labour and Welfare, 2019), the meals in this study had more cereals and vegetables. For example, the percentage of the weight of cereals in the total weight of one meal was 29.7% in this study and 20.1% for Japanese aged 20 years and older (Japanese Ministry of Health, Labour and Welfare, 2019). So, it is assumed that the meals considered in this study were more plant-based than those of the general household, and this may have caused the difference between the GHGE values.
In conclusion, the healthy meals with the lowest GHGE in this study reached the target value for solving climate change. Meals with low GHGE were characterized by the use of chicken, consistent with previous studies. Since the study suggested that fish may contribute to GHGE reduction depending on the species, future studies of meals with low GHGE should subdivide the species of fish.
4.1. Limitations
Despite the importance of its findings, this study has some limitations. First, the number of meals of some combinations of protein sources was small. Therefore, only common combinations were focused on, and the number of combinations treated was limited. Moreover, the meals were served by restaurants and takeout (bento) retailers. Therefore, the results of this study may not be generalizable to meals of the general public. In addition, only one environmental indicator, GHGE, was used in this study. However, this study used an indicator of climate change, which is a typical environmental issue. Moreover, in previous studies using nitrogen footprints, healthy meals with a high nitrogen footprint used more pork and beef (Sameshima et al., 2022), which was consistent with the characteristics of meals with high GHGE obtained in this study. Importantly, this study quantitatively showed that GHGE differed considerably among meals with different protein sources to include environmental perspectives in the food guidelines. Future studies should undertake similar investigations with larger sample sizes, consider food use in average households, and examine other environmental indicators.
Data availability statement
The raw data supporting the conclusions of this article will be made available by the authors, without undue reservation.
Author contributions
RA and HS: research conception and design and writing of the manuscript. HS: statistical analysis of the data. HS, RA, FH, and YT: interpretation of the data and manuscript review and revision. All authors contributed to the article and approved the submitted version.
Funding
This study was funded by the Health and Labor Sciences Research Grants (Ministry of Health, Labour, and Welfare, Japan, grant number 20FA1009).
Acknowledgments
The authors thank all the retailers who provided data for this study.
Conflict of interest
The authors declare that the research was conducted in the absence of any commercial or financial relationships that could be construed as a potential conflict of interest.
Publisher’s note
All claims expressed in this article are solely those of the authors and do not necessarily represent those of their affiliated organizations, or those of the publisher, the editors and the reviewers. Any product that may be evaluated in this article, or claim that may be made by its manufacturer, is not guaranteed or endorsed by the publisher.
Supplementary material
The Supplementary material for this article can be found online at: https://www.frontiersin.org/articles/10.3389/fsufs.2023.1232198/full#supplementary-material
References
Akenji, L., Lettenmeier, M., Koide, R., Toivio, V., and Amellina, A. (2019). 1.5-Degree Lifestyles: Targets and Options for Reducing Lifestyle Carbon Footprints. Kanagawa: Institute for Global Environmental Strategies
Clune, S., Crossin, E., and Verghese, K. (2017). Systematic review of greenhouse gas emissions for different fresh food categories. J. Clean. Prod. 140, 766–783. doi: 10.1016/j.jclepro.2016.04.082
Ernstoff, A., Tu, Q., Faist, M., Del Duce, A., Mandlebaum, S., and Dettling, J. (2019). Comparing the environmental impacts of meatless and meat-containing meals in the United States. Sustain. For. 11:6235. doi: 10.3390/su11226235
Hallström, E., Carlsson-Kanyama, A., and Börjesson, P. (2015). Environmental impact of dietary change: a systematic review. J. Clean. Prod. 91, 1–11. doi: 10.1016/j.jclepro.2014.12.008
“Healthy Meal and Food Environment” Certification System (2023a). What is the “healthy eating and eating environment” certification system? Available at: https://smartmeal.jp/ninshoseido.html (Accessed May 26, 2023).
“Healthy Meal and Food Environment” Certification System (2023b). What is smart meal? Available at: https://smartmeal.jp/smartmealkijun.html (Accessed May 26, 2023).
Heller, M. C., Keoleian, G. A., and Willett, W. C. (2013). Toward a life cycle-based, diet-level framework for food environmental impact and nutritional quality assessment: a critical review. Environ. Sci. Technol. 47, 12632–12647. doi: 10.1021/es4025113
Ita, S., Tsuda, T., and Washizu, A. (2011). The environmental impacts of the household menu selection and its effect on dietary habits. Int. J. Life Cycle Assess. 7, 164–174. doi: 10.3370/lca.7.164
Japanese Ministry of Agriculture, Forestry and Fisheries (2005a). Agricultural, forestry and fishery products import/export information 2005. Available at: https://www.maff.go.jp/j/tokei/kouhyou/kokusai/index.html (Accessed May 26, 2023).
Japanese Ministry of Agriculture, Forestry and Fisheries (2005b). Crop survey 2005. Available at: https://www.maff.go.jp/j/tokei/kouhyou/sakumotu/index.html (Accessed May 26, 2023).
Japanese Ministry of Agriculture, Forestry and Fisheries. (2005c). Fishery production survey 2005, Gyogyo sanshutsugaku. https://www.maff.go.jp/j/tokei/kouhyou/gyogyou_seigaku/index.html (Accessed May 26, 2023).
Japanese Ministry of Agriculture, Forestry and Fisheries (2005d). Fishery production survey 2005, Kaimengyogyo Seisan Tokei. Available at: https://www.maff.go.jp/j/tokei/kouhyou/kaimen_gyosei/#y (Accessed May 26, 2023).
Japanese Ministry of Agriculture, Forestry and Fisheries (2005e). Forestry products survey 2005. Available at: https://www.maff.go.jp/j/tokei/kouhyou/tokuyo_rinsan/index.html (Accessed May 26, 2023).
Japanese Ministry of Agriculture, Forestry and Fisheries (2005f). Livestock census 2005. Available at: https://www.maff.go.jp/j/tokei/kouhyou/tikusan_ryutu/index.html (Accessed May 26, 2023).
Japanese Ministry of Agriculture, Forestry and Fisheries (2021). Food balance sheet 2021. Available at: https://www.maff.go.jp/j/zyukyu/fbs/ (Accessed May 26, 2023).
Japanese Ministry of Agriculture, Forestry, and Fisheries (2022). Report on a discussion on the development of a food guide that includes an environmental perspective. Available at: https://www.maff.go.jp/j/syokuiku/kankyo.html (Accessed May 26, 2023).
Japanese Ministry of Education, Culture, Sports, Science and Technology. (2015). Standard Tables of Food Composition in Japan. Nagano: Tsutatomo Printing
Japanese Ministry of Health, Labour and Welfare. (2019). The National Health and Nutrition Survey Japan. Tokyo: Daiichi-Shuppan
Japanese Ministry of Health Labour and Welfare, and Ministry of Agriculture, Forestry, and Fisheries. (2005). Japanese Food Guide Spinning Top.
Japanese Ministry of Internal Affairs and Communications (2005b). Census of manufacturers 2005. Available at: https://www.meti.go.jp/statistics/tyo/kougyo/index.html (Accessed May 26, 2023).
Japanese Ministry of Internal Affairs and Communications (2005a). Table of domestic products by sector and commodity 2005. Available at: https://www.soumu.go.jp/toukei_toukatsu/data/io/ (Accessed May 26, 2023).
Koide, R., Lettenmeier, M., Kojima, S., Toivio, V., Amellina, A., and Akenji, L. (2019). Carbon footprints and consumer lifestyles: an analysis of lifestyle factors and gap analysis by consumer segment in Japan. Sustain. For. 11:5983. doi: 10.3390/su11215983
Kurotani, K., Akter, S., Kashino, I., Goto, A., Mizoue, T., Noda, M., et al. (2016). Quality of diet and mortality among Japanese men and women: Japan public health center based prospective study. BMJ Jpn. J. Nutr. Diet. 352:i1209. doi: 10.1136/bmj.i1209
Kurotani, K., Nakade, M., and Takimoto, H. (2018). Consumption of meals consisting of grain, fish and meat, and vegetable dishes and the relation with nutritional or health status among the Japanese population: a systematic review. Jpn. J. Nutr. Diet. 76, 77–88. doi: 10.5264/eiyogakuzashi.76.77
Li, X., Ouyang, Z., Zhang, Q., Shang, W. L., Huang, L., Wu, Y., et al. (2022). Evaluating food supply chain emissions from Japanese household consumption. Appl. Energy 306:118080. doi: 10.1016/j.apenergy.2021.118080
Nakamura, K., and Itsubo, N. (2022). Environmental and health-related lifecycle impact assessment of reduced-salt meals in Japan. Sustain. For. 14:8265. doi: 10.3390/su14148265
Nansai, K., Kondo, Y., Kagawa, S., Suh, S., Nakajima, K., Inaba, R., et al. (2012). Estimates of embodied global energy and air-emission intensities of Japanese products for building a Japanese input-output life cycle assessment database with a global system boundary. Environ. Sci. Technol. 46, 9146–9154. doi: 10.1021/es2043257
National Institute for Environmental Studies (2012). Embodied energy and emission intensity data for Japan using input-output tables. Available at: https://www.cger.nies.go.jp/publications/report/d031/jpn/page/global.htm (Accessed May 26, 2023).
Oba, S., Nagata, C., Nakamura, K., Fujii, K., Kawachi, T., Takatsuka, N., et al. (2009). Diet based on the Japanese food guide spinning top and subsequent mortality among men and women in a general Japanese population. J. Am. Diet. Assoc. 109, 1540–1547. doi: 10.1016/j.jada.2009.06.367
Sameshima, H., Akamatsu, R., Hayashi, F., and Takemi, Y. (2022). Amount of food groups in a healthy diet with low environmental impact: an analysis using nitrogen footprint. Jpn. J. Nutr. Diet. 80, 307–316. doi: 10.5264/eiyogakuzashi.80.307
Sugimoto, M., Murakami, K., Asakura, K., Masayasu, S., and Sasaki, S. (2021). Diet-related greenhouse gas emissions and major food contributors among Japanese adults: comparison of different calculation methods. Public Health Nutr. 24, 973–983. doi: 10.1017/S1368980019004750
Sugimoto, M., Temme, E. H. M., Biesbroek, S., Kanellopoulos, A., Okubo, H., Fujiwara, A., et al. (2022). Exploring culturally acceptable, nutritious, affordable and low climatic impact diet for Japanese diets: proof of concept of applying a new modelling approach using data envelopment analysis. Br. J. Nutr. 128, 2438–2452. doi: 10.1017/S0007114522000095
Torheim, L. E., Barikmo, I., Parr, C. L., Hatløy, A., Ouattara, F., and Oshaug, A. (2003). Validation of food variety as an indicator of diet quality assessed with a food frequency questionnaire for Western Mali. Eur. J. Clin. Nutr. 57, 1283–1291. doi: 10.1038/sj.ejcn.1601686
Willett, W., Rockström, J., Loken, B., Springmann, M., Lang, T., Vermeulen, S., et al. (2019). Food in the Anthropocene: the EAT-lancet commission on healthy diets from sustainable food systems. Lancet. 393, 447–492. doi: 10.1016/S0140-6736(18)31788-4
Yoshii, E., Fukasawa, H., Ainuki, T., Akamatsu, R., and Hasegawa, T. (2021). Characteristics of dinner among preschoolers by vegetable intake. Jpn. J. Nutr. Diet. 79, 345–354. doi: 10.5264/eiyogakuzashi.79.345
Keywords: climate, sustainable diet, healthy diet, greenhouse gas emission, food group
Citation: Sameshima H, Akamatsu R, Hayashi F and Takemi Y (2023) Estimation of greenhouse gas emissions from Japanese healthy meals with different protein sources. Front. Sustain. Food Syst. 7:1232198. doi: 10.3389/fsufs.2023.1232198
Edited by:
Amar Razzaq, Huanggang Normal University, ChinaReviewed by:
Iqbal Javed, University of Lahore, PakistanMuhammad Faisal Ali, Pakistan Institute of Development Economics, Pakistan
Copyright © 2023 Sameshima, Akamatsu, Hayashi and Takemi. This is an open-access article distributed under the terms of the Creative Commons Attribution License (CC BY). The use, distribution or reproduction in other forums is permitted, provided the original author(s) and the copyright owner(s) are credited and that the original publication in this journal is cited, in accordance with accepted academic practice. No use, distribution or reproduction is permitted which does not comply with these terms.
*Correspondence: Rie Akamatsu, YWthbWF0c3UucmllQG9jaGEuYWMuanA=