 Tess Blom
 Andy Jenkins
 Andy van den Dobbelsteen
- Delft University of Technology, Delft, Netherlands
Vertical farms use some resources very efficiently. However, their electricity use is considerable, and a significant amount of waste heat is produced. This paper investigates how the integration of vertical farms in buildings could reduce the use of energy, water, and nutrients collectively across both entities by leveraging potential resource synergies. The paper considered the integration of vertical farms in apartments, offices, restaurants, swimming pools, and supermarkets located in the Netherlands. For each typology, the floor area heated and the amount of building users fed by one m2 of one production layer within the vertical farm was calculated, along with required outputs of water and nutrients from the building to sustain the vertical farm. The energy savings of different integration strategies were calculated for each building typology in comparison to a non-integrated approach. Results showed that the synergetic integration of vertical farms with buildings reduced the year-round energy use of the climate systems of both entities collectively by between 12 and 51%. The integration of vertical farms with buildings decreases the use of energy, water, and nutrients from external sources and offers great potentials to reduce the environmental impacts of both entities, whilst producing food in urban environments.
1. Introduction
In 2021, the energy used for building heating purposes represented 23% of the global energy consumption (IEA, 2022). The total energy use by buildings is responsible of 28% of the global greenhouse gas (GHG) emissions (World Green Building Council, 2019), creating the need to drastically reduce building energy use to curtail these GHG emissions. The ‘New Stepped Strategy’ can be applied to achieve this aim, which adds an intermediate step between reducing demands and using renewable sources to the well-known Trias Energetica strategy. This step includes the use of available waste flows (van den Dobbelsteen et al., 2011). The integration of urban agriculture in cities can help to better close resource cycles of energy, water, materials (Vernay et al., 2010), and nutrients (Jurgilevich et al., 2016) by creating synergies between the farm and other urban functions, i.e., reusing the waste streams of urban agriculture as a resource for the city and vice versa. Examples of these synergies include nutrient recovery from the sewage system (Wielemaker et al., 2018), and the use of carbon dioxide (CO2) from production processes to increase crop yields (Marchi et al., 2018). At the building scale, bidirectional synergies between a rooftop greenhouse and an office building with laboratories have been identified and quantified by Muñoz-Liesa et al. (2020, 2022). The greenhouse functioned as a heat and cold sink by reusing the building’s exhaust air for heating during colder months and cooling during warmer months, and as a solar collector that supplied excess heat to the building. Furthermore, this greenhouse reduced heat losses through the building’s roof (Muñoz-Liesa et al., 2020), and the CO2-concentration of the greenhouse was increased using the building’s exhaust air (Sanjuan-Delmás et al., 2018). Using these principles, urban agriculture can increase the sustainability of cities, buildings, and food systems (Kozai and Niu, 2020).
An recent typological addition to urban agriculture is vertical farming (VF); a food production system within a controlled environment that uses vertically stacked hydroponic systems and artificial light (Kalantari et al., 2017) to achieve year-round production of crops with maximum density and high yields (Graamans et al., 2018). VFs use water, pesticides, herbicides (Kalantari et al., 2017), CO2 (Kozai et al., 2006), and fertilisers (Germer et al., 2011) highly efficiently. The electricity use for artificial light and climate systems is, however, substantial and outweighs the aforementioned benefits altogether when comparing the carbon footprint of a VF to that of conventional agriculture systems in the Netherlands (Blom et al., 2022). Furthermore, the electricity use represents the highest share of the operational costs (Pesch and Louw, 2023), especially when considering recent high energy prices. The artificial lights within a VF produce excess heat, which has been identified as a potential low-temperature heat source for district heat networks by various researchers (Thomaier et al., 2014; Gentry, 2019; Martin et al., 2019). VFs may also contribute to a balanced renewable energy system by producing food and residual heat when there is excess electricity production during sunny or wind days. The heat produced by VFs can be stored in seasonal thermal energy storage systems to bridge energy imbalances (Graamans, 2021). Martin et al. (2022) explored a bidirectional energy synergy between a VF and a residential building. This synergy exchanged waste heat produced by the VF with the cold produced when heating the building to reduce the total energy use of the building. One other study identified a synergy between VFs and buildings through the direct integration of VFs in office spaces to reduce indoor CO2 levels, and the energy used by ventilation systems (Shao et al., 2021).
Although the potential to minimise resource use in cities through the integration of urban agriculture had been recognized by literature, little research had been done on creating synergies between urban agriculture and buildings, and even less on the integration of VFs. The goal of this study is to investigate how the integration of VFs into the energy and resource systems of a building can reduce the energy and resource use of both entities collectively. The paper focuses on the integration of VFs within apartments, offices, restaurants, supermarkets, and swimming pools. The baseline conditions of the VF and building typologies are discussed first in sections 2.1 and 2.2. As energy represents the largest share of the carbon footprint of VFs (Blom et al., 2022), the main focus is to exchange residual energy between the VF and the building, creating bidirectional synergies. To explore the potential to enlarge these synergies through the use of seasonal energy storage, the paper investigates the integration of VF within buildings with and without seasonal storage (section 2.3). Unidirectional flows are also studied, including the potential to reuse water and nutrients outputs from the building within the VF, and the production of crops for the building users (section 2.4). The results present the ratios required between the cultivation area of the VF and floor area of the building to supply the thermal energy demands using bidirectional synergies, including the calculated energy savings (section 3.1). Section 3.2 discusses the unidirectional flows of water and nutrient outputs from the building to the VF. This section also calculates the number of building users that can be fed by the crops produced within the VF. Finally, the results and assumptions are discussed in greater detail in section 4, including the identification of future research opportunities, leading to the final conclusions of the research in section 5.
2. Methods
This research investigates the potential for bidirectional energy exchange between VFs and buildings. Furthermore, three unidirectional flows are studied: the production of crops for consumption by the building users (1), the reuse of treated grey water outputs from the building for crop irrigation (2), and the recovery of nutrients from urine to replace synthetic fertilisers (3). The research method is separated into three subsections (Figure 1). Section 2.1 describes the baseline conditions of the VF, including the climate setpoints, cooling and dehumidification strategy, and the inputs and outputs of crops, water, and nutrients. Section 2.2 defines the baseline heating and cooling systems of the buildings, and the inputs and outputs of vegetables, water, and nutrients. The potential strategies to enable bidirection exchange of energy are defined in sections 2.3.1 and 2.3.2. Finally, the performance of these strategies are assessed and the potential energy savings are calculated (section 2.2.3).
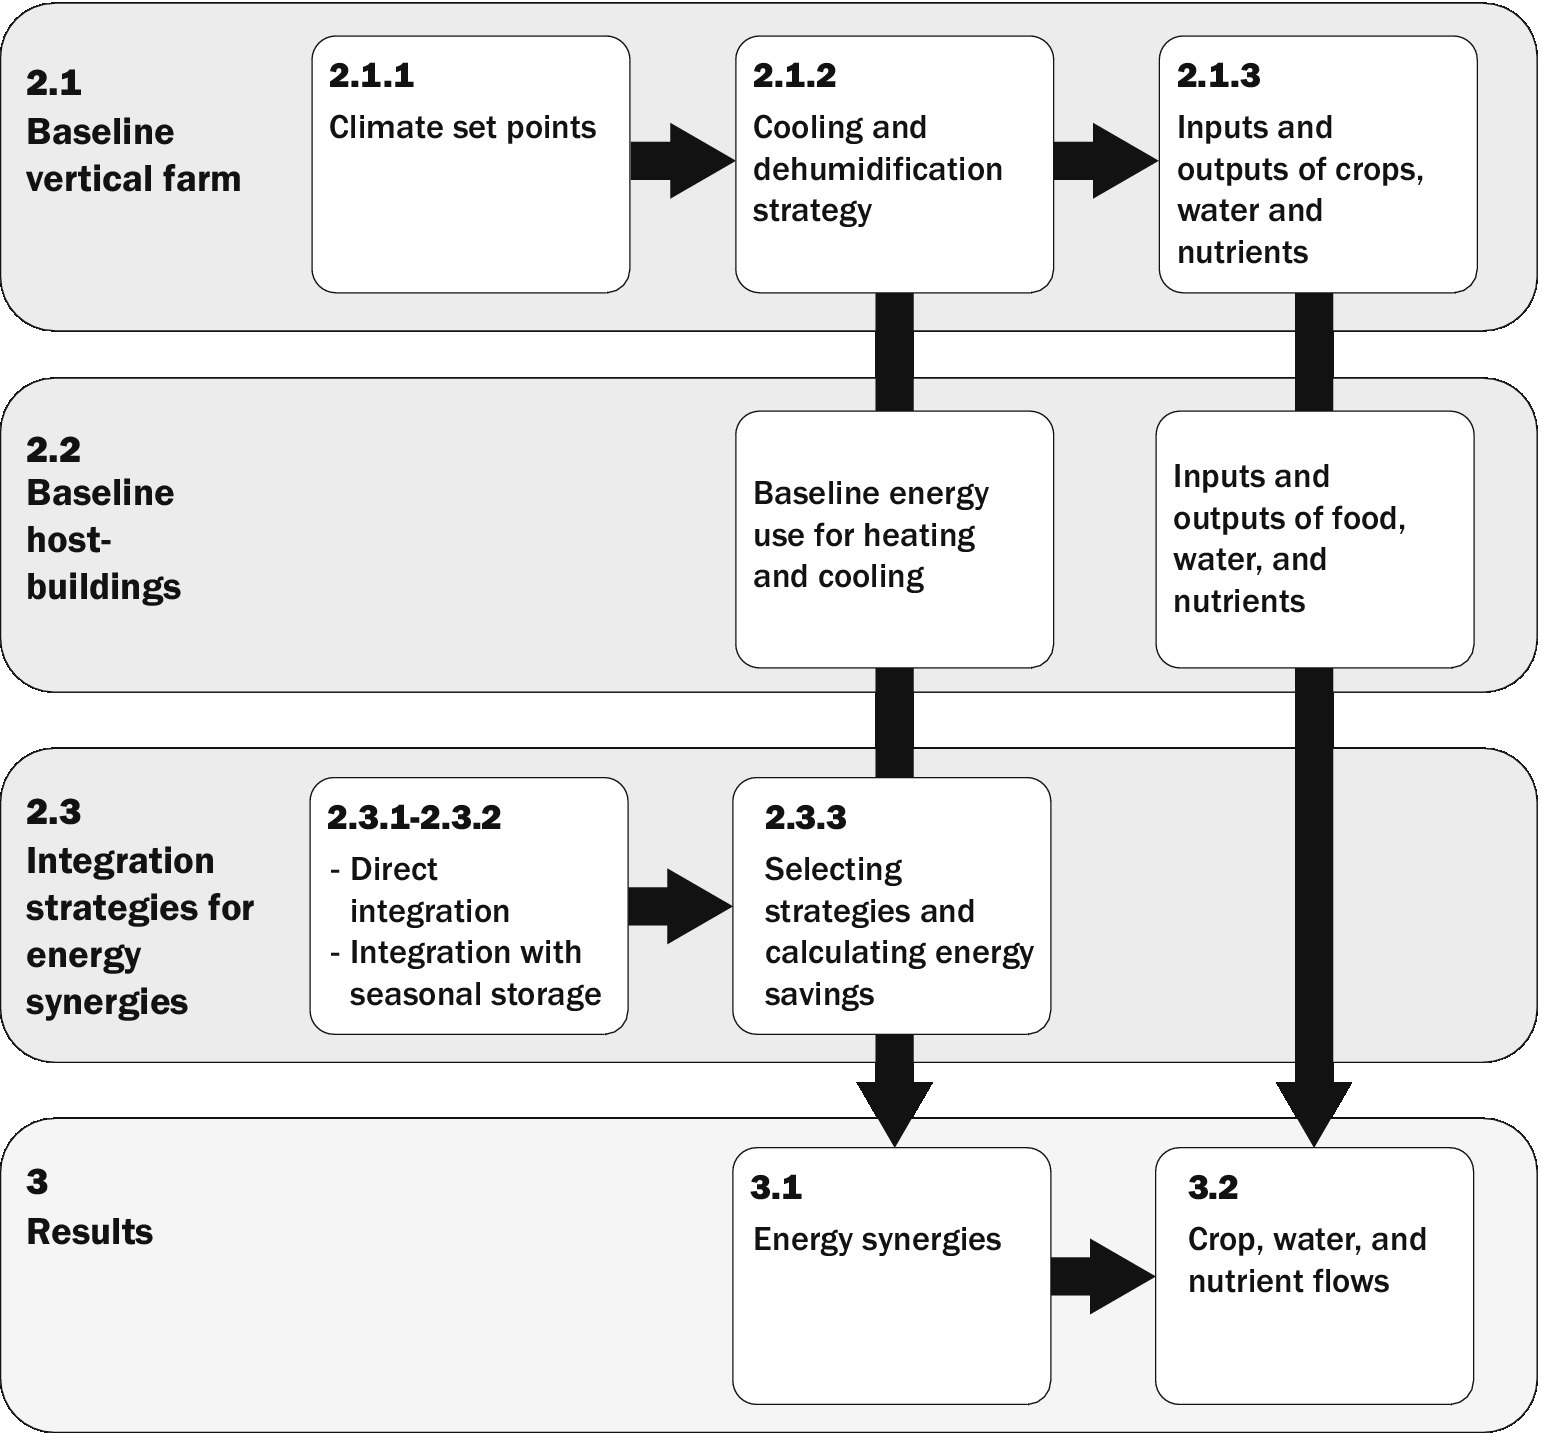
Figure 1. Structure of the methods (Sections 2.1–2.3) and that of the results (Sections 3.1–3.2).
2.1. Baseline vertical farm
This study focuses on a hypothetical VF located in the Netherlands. This VF can be defined as a closed-box VF, which is hermetically sealed to create uniform growth conditions that are independent from the outdoor climate (Van Delden et al., 2021). This includes uniform lighting, temperature, CO2 levels, and relative humidity (Graamans, 2021). To maintain these constant conditions, air is reconditioned and recirculated, and the infiltration of outdoor air is avoided as much as possible. In the baseline VF, hydroponic nutrient film technique is used to produce butterhead lettuce. To date, there are many different approaches to growing food in VFs, e.g., the growth method, the number of growth layers, cultivation height, and automation. This makes it impossible to define a typical VF layout (Blom et al., 2022). To maximise the transferability of the results, we focused on the outputs and inputs per m2 cultivation area within the VF. When we refer to the one m2 cultivation area in this research, this means one m2 of one production layer of the VF.
2.1.1. Climate set points
The climate set points of the hypothetical VF studied in this paper were based on that of a commercial VF located in The Netherlands. This VF produces a mix of leafy greens within multiple container sized closed-box growth environments. During the photoperiod (16 h), the exhaust air of the VF has a temperature of 26°C, and a relative humidity (RH) of 72%. The return air, after cooling and dehumidification is 24°C and 76% RH. To produce butterhead lettuce, the VF studied uses a Photosynthetic Photon Flux Density (PPFD) of 200 μmol m−2 s−1 and a photoperiod of 16 h d−1, resulting in a Day Light Integral of 11.5 mol m−2 d−1. With a LED molar efficacy of 3.5 μmol J−1 (Weidner et al., 2021), the electricity use of the LEDs is 334 kWh m−2 y−1 and the cooling demand is 300 kWh m−2 y−1. During the dark period (8 h), the temperature was approximately 2°C lower, and the RH about 10% higher (Graamans et al., 2017). For simplification, this research only includes the photoperiod.
The cooling demands in a closed-box VF are the result of the heat dissipated by fans, pumps, auxiliary equipment, and most significantly, the LED lights. Currently, LEDs have a wall-plug-efficiency of 60–65%, meaning that 60–65% of the energy input is emitted as optical energy and 35–40% as sensible heat (Personal communication Signify). Crops only convert a few percent of the optical energy into chemical energy, i.e., biomass. As a result, most optical energy in converted into sensible and latent heat. Therefore, approximately 95–98% of the electrical energy consumed by LEDs has to be cooled away (Personal communication Signify). When assuming some heat losses through the thermal envelope of the VF, approximately 90% of the LEDs’ electricity input needs to be dissipated by dehumidification and cooling systems. This number was confirmed by the commercial vertical farmer that provided the climate set points.
2.1.2. Cooling and dehumidification strategy
Current cooling and dehumidification systems for VFs were discussed with five VF companies in the Netherlands. A cooling and dehumidification system was selected for the baseline VF that uses one water-to-water heat pump (HP1) for cooling, dehumidification, and reheating (Figure 2). The evaporator of HP1 is used to cool the exhaust air of the VF below its dew point temperature in heat exchanger 1 (HE1) to reject moisture from the air. The condenser of HP1 reheats the air in heat exchanger 2 (HE2) to obtain the required return temperature of 24°C. The condenser produces more heat than is required by HE2, this abundance of heat is rejected to the atmosphere via a water-to-air heat exchanger (HE3). A cold and warm buffer tank are included together with mixing values to allow temperature variations within the system whilst maintaining uniform VF conditions. More details are presented in Supplementary material section 2.1.
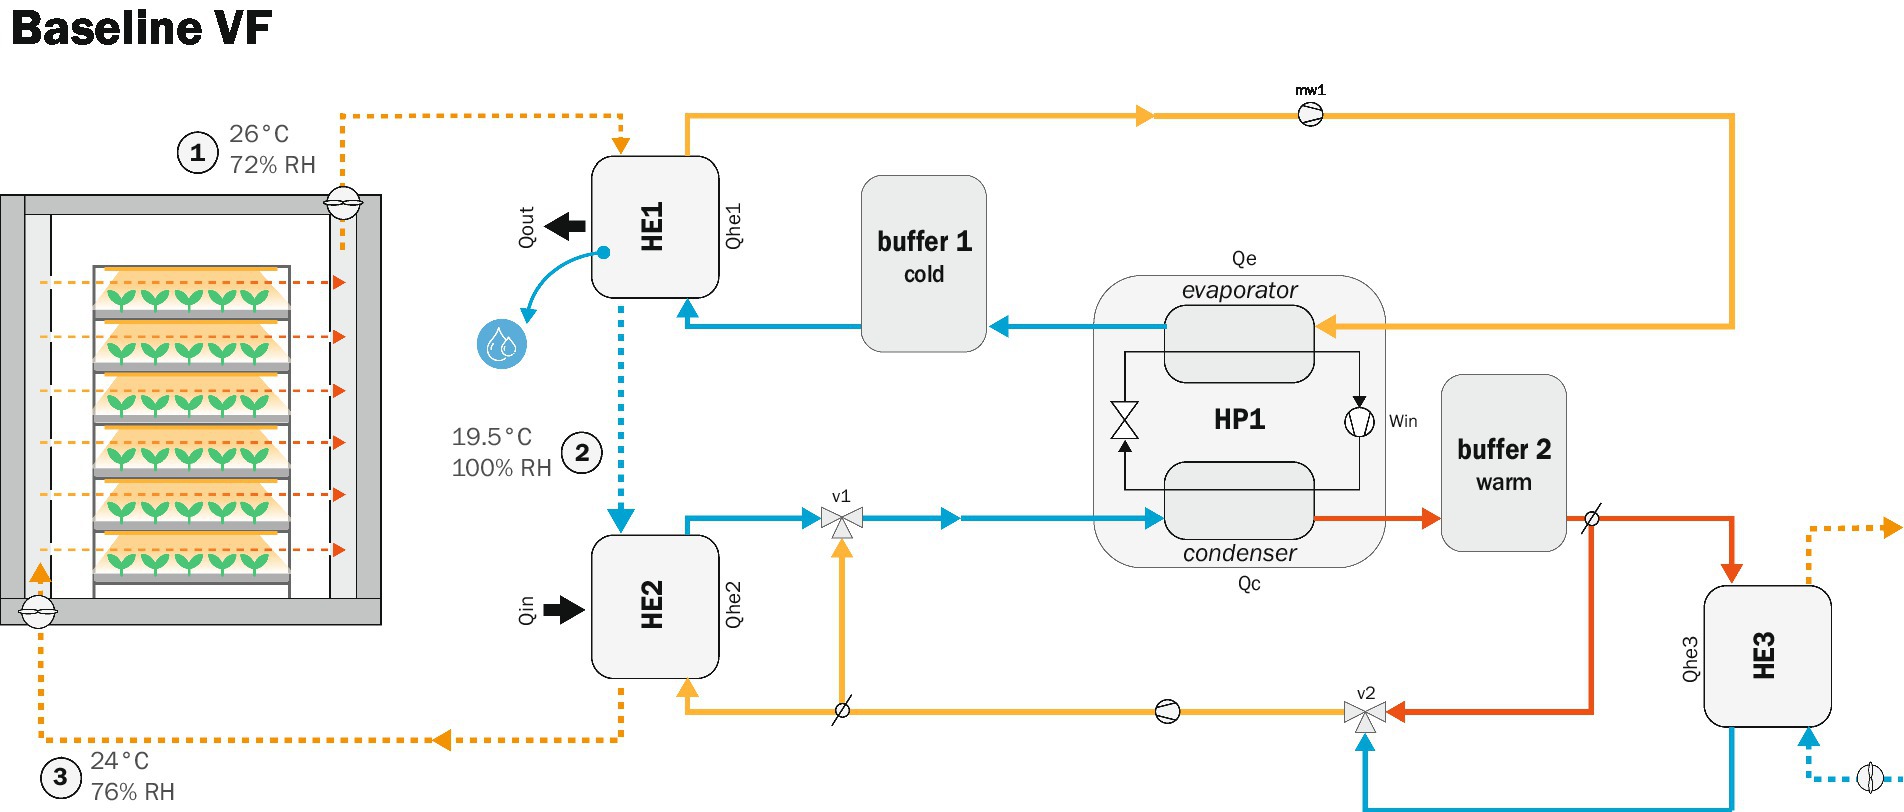
Figure 2. The selected cooling and dehumidification strategy for the VF in which HP1 is used to provide cooling below the dew point temperature in HE1, and re-heating in HE2. HE3 removes the abundance of heat produced by the condenser.
The total energy use of the cooling and dehumidification system (Figure 2), and the residual heat removed by HE3 were calculated using mathematical simulations. The total heat produced by the VF is specified in Supplementary material section 2.2. The HP calculations are discussed step-by-step in Supplementary material section 3, together with the energy calculations of the heat exchangers, mixing valves, fans, and pumps within the climate system. In additional to the electricity use of 334 kWh m−2 y−1 for LEDs, the cooling and dehumidification system of the VF used 84 kWh m−2 y−1. As the total cooling demands of the VF were 300 kWhth m−2 y−1, this resulted in an overall efficiency of the climate systems of 360%, i.e., a coefficient of system performance (COSP) of 3.6. In total, 353 kWhth m−2 y−1 residual heat of 25°C on average is removed by HE3.
2.1.3. Input and outputs of crops, water, and nutrients
The VF described by Blom et al. (2022) was used as reference for nutrient consumption and crop production. This VF produces butterhead lettuce with a light use efficiency of 0.75 g dry weight lettuce per mol incident light (Blom et al., 2022). When the light recipe presented, this results in an annual lettuce production of 78.8 kg fresh weight per m2 cultivation area. The quantity of water vapour removed by dehumidification in HE1 was calculated with the following formula:
where ṁw is the water removal in kg s−1, ṁa is the total air flow rate in the VF in kg s−1, and ∆w the difference in humidity ratio across HE1 (Supplementary material section 2). The water demand of the VF is the sum of the water vapour removed by dehumidification (Eq. 1), and the water content of the crop. Using a dry matter content of 4% for lettuce (Jin et al., 2021), the total water demand is 309 L y−1 per m2 of cultivation area. The hypothetical VF will reuse the water vapour recovered by dehumidification, where we assumed an overall loss of 5%. This results in an actual water usage of 87 L m−2 y−1. The nutrient use is 2.1 kg per m2 cultivation area annually, including the uptake of 26 g synthetic fertiliser per kg of lettuce produced (Blom et al., 2022), and a 5% loss during nutrient circulation.
2.2. Baseline conditions of buildings
This research considers apartments, offices, restaurants, indoor and outdoor swimming pools, and supermarkets located in the Netherlands. To obtain a high density of heating demand, single-family housing were excluded from this research. For each building typology, data was collected on the average heating and cooling demands (Supplementary material 4.1) and the inputs and outputs of food, water, and nutrients (Supplementary material 4.3–4.5). The energy demands of the apartments are based on the average energy use of 75 to 100 m2 apartments in the Netherlands. Office energy demands are included for smaller (250–2,500 m2) and larger (2,500–5,000 m2) offices. Three energy labels are considered for apartment and offices: BENG-label (nearly zero-energy building code) to represent new apartments, and A- and C-labels for renovations. Energy labels inform potential buyers or renters about the energy efficiency of the building (Van Den Brom et al., 2018). After the BENG-label, A-labels represent the highest energy efficiency and G-labels the lowest. Energy labels lower than C were not included as we assumed that the integration of VFs within buildings would require deep renovations. In 2021, 64% of the apartments in the Netherlands had an energy label, of which 68% was a labelled as C or higher (RVO, 2022). Lower energy labels can still be renovated to improve the energy label. All office buildings in the Netherlands need to have an energy label of C or higher since January 2023 (RVO, 2023). There was no data available about the energy labels of restaurants, swimming pools, and supermarkets, therefore, we used the average energy use of these typologies (CBS, 2018; Stimular, 2022).
A reversible air-source HP system was assumed as the baseline heating and cooling system across the building typologies (Supplementary material 4.2). BENG and A-labelled apartments and offices, the restaurant, and supermarket were heated with low-temperature floor heating of 40°C supply, and C-labels with mid-temperature radiators of 70°C. The return temperature of floor heating was 10°C lower than the supply temperature, and the return temperature of radiators decreased by 20°C (Maivel and Kurnitski, 2015). The coefficient of performance (COP) of these HPs were 4.4 for low-temperature heating, and 2.4 for mid-temperature heating. To avoid condensation, we used floor cooling with a supply temperature of 18°C and a return temperature of 23°C for all building typologies. Domestic hot water (DHW) was excluded from this study. The average water temperature of the swimming pools was 23°C (Koppejan, 2016). The indoor swimming pool was heated year-round, whilst the outdoor pool was opened and heated between May and September. This resulted in a COP of 4.8 for the indoor pool, and 5.5 for the outdoor pool. Besides the electricity use of the HP, the overall energy use of the heating and cooling system included the electricity used by the outdoor fan. The energy use of the pumps that distribute the heat and cold through the building strongly depends on the head difference between the HP and heat delivery system, i.e., the design of the building. The distribution pump of the floor heating system studied by Hwang and Jeong (2021), used less than 1% of the total electricity used by the air-sourced HP system. The distribution energy of the heating system was, therefore, excluded from this research. This also applies to the performance calculations of the integration strategies.
2.3. Integration strategies for energy synergies
2.3.1. Direct integration
In the baseline non-integrated approach, residual heat was removed from the VF by HE3 (Figure 2). To enable bidirectional energy exchange between the VF and building, HE3 was replaced by one or two components that connect the VF to the building’s heating system (Figure 3). These components included a HE (A1), a HP (B1), a HE combined with a HP at the building-side (C1), a HP connected to a HE at the building-side (D1), and two HPs (E1). These five strategies supply the heat produced by the VF to the building where it was used directly for space heating, or stored within a storage vessel for short periods of 1–3 days. Outside of the building’s heating season the VF switches back to the baseline cooling and dehumidification system and the residual heat is dissipated via HE3, and the building is cooled by the air-source HP (section 2.2).
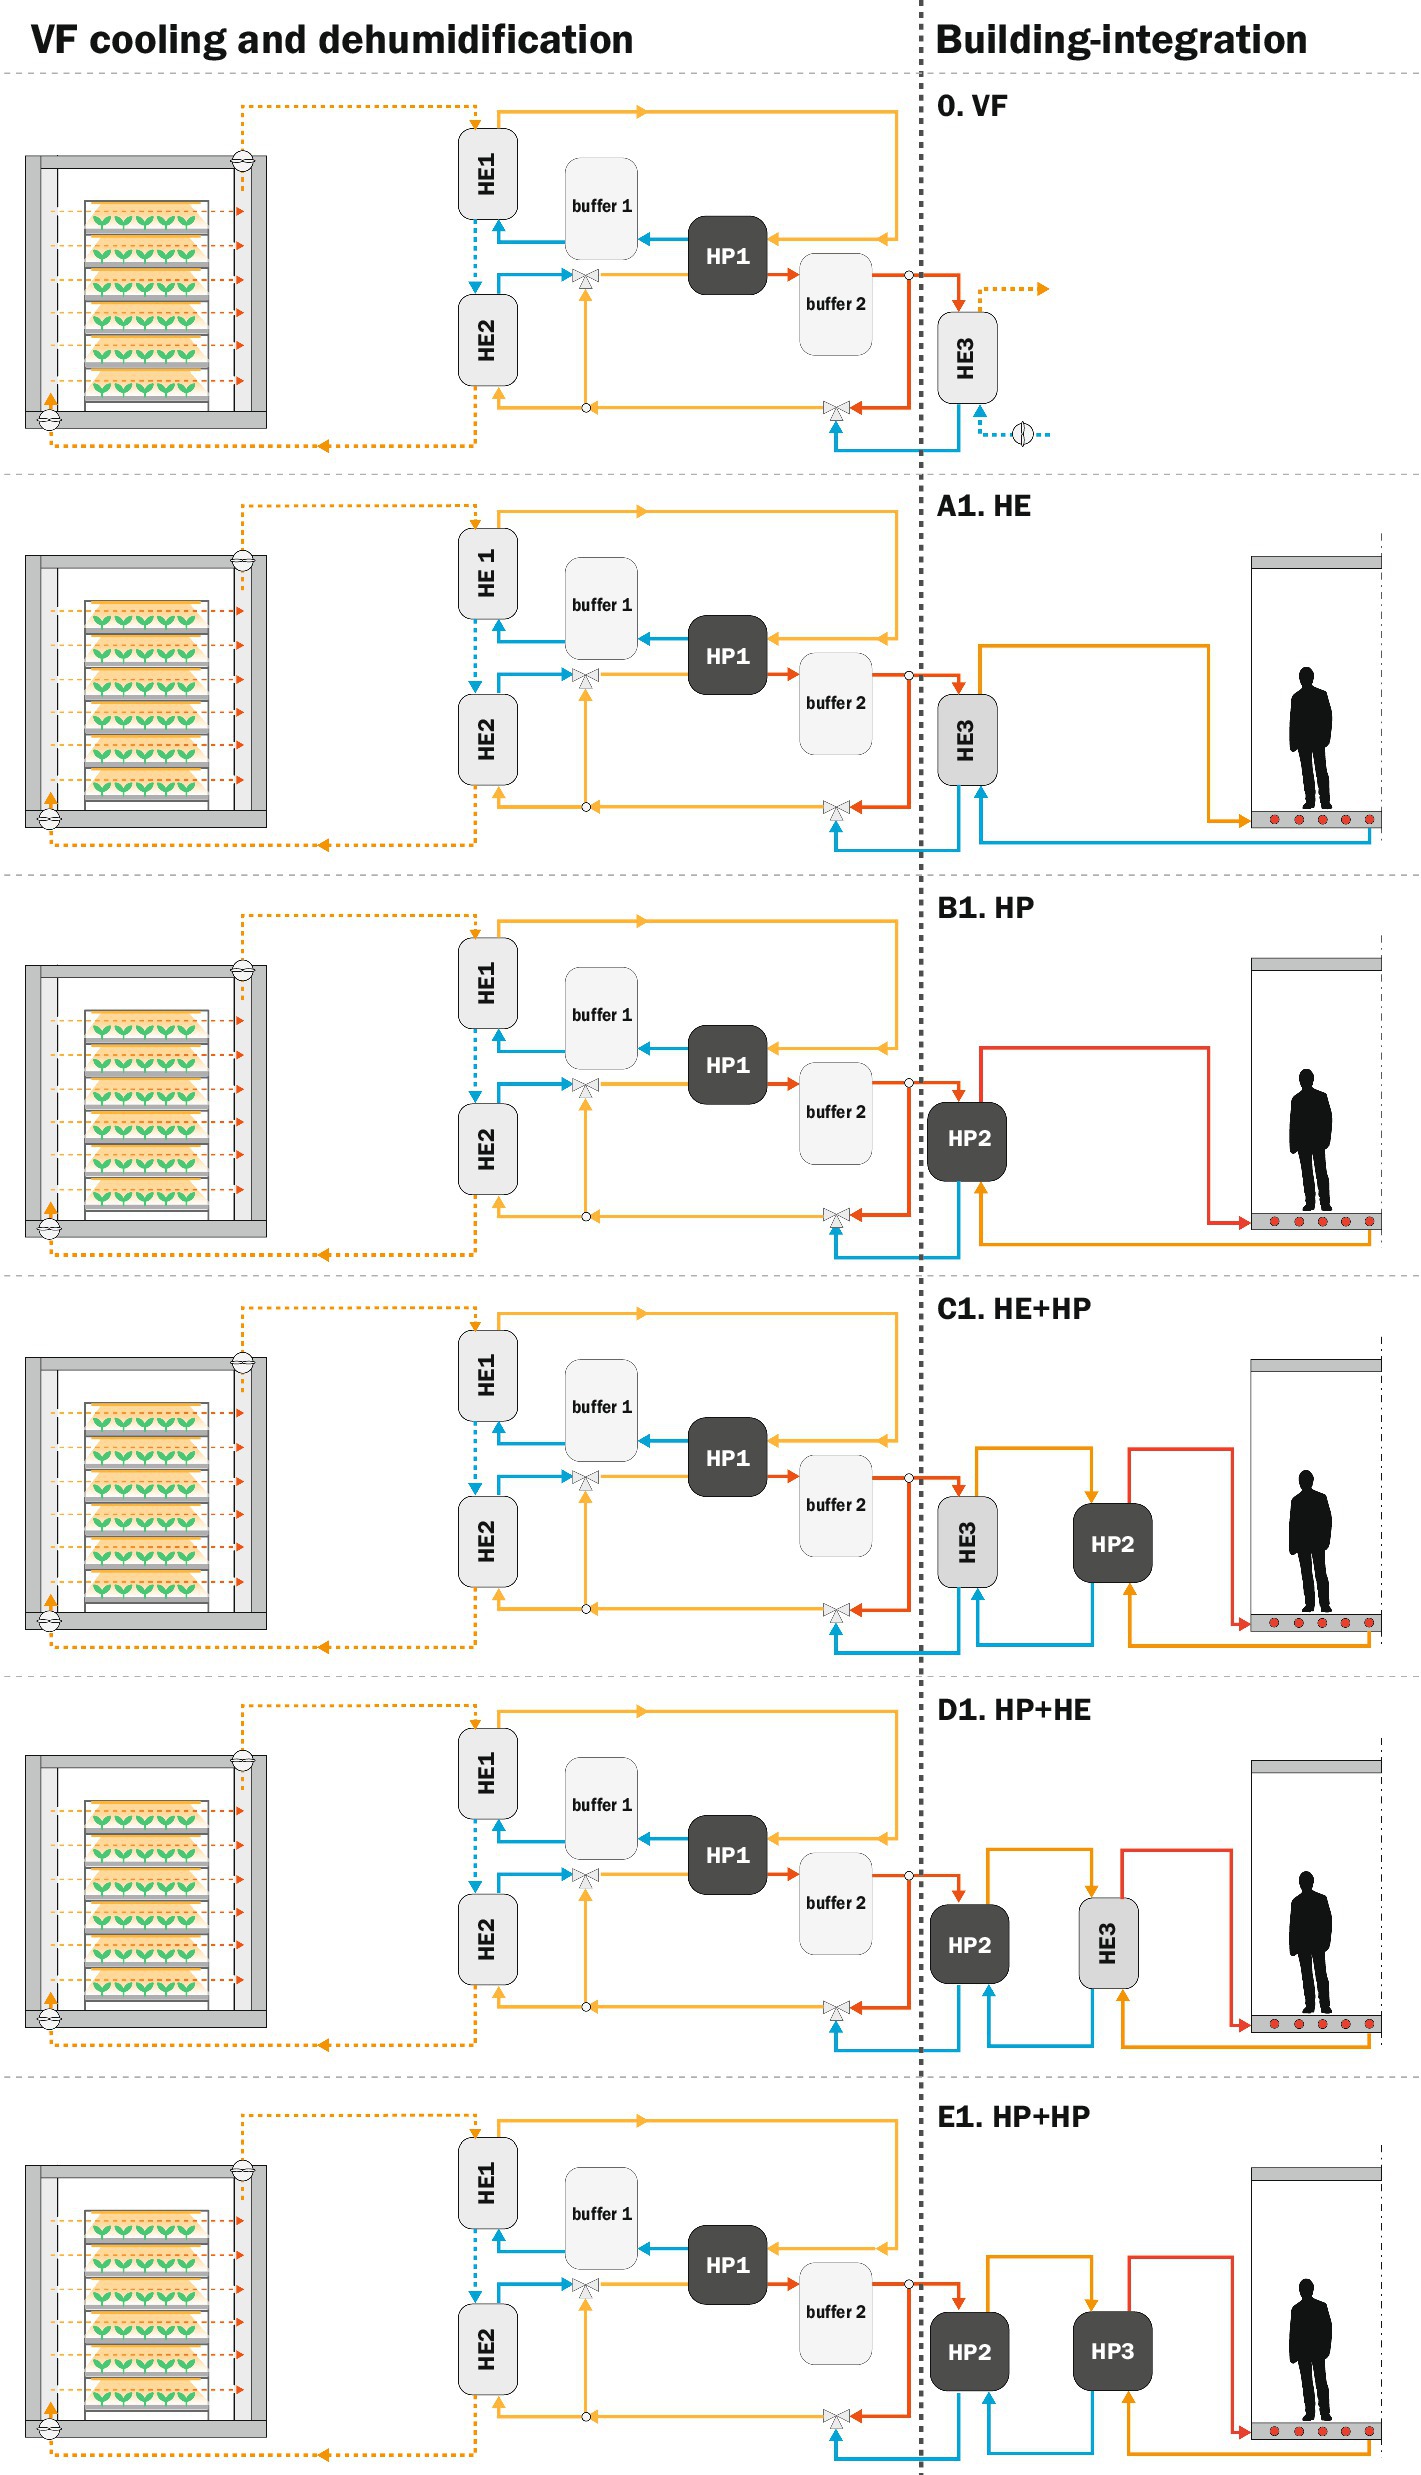
Figure 3. The baseline scenario (0) and 5 different direct integration strategies to enable bidirectional exchange of energy between the VF and building (A1-E1). Dashed lines represent air flows, and solid lines represent water flows.
2.3.2. Integration with seasonal energy storage
To further enhance the symbiosis between the VF and the building, the potential to include an aquifer thermal energy storage (ATES) system as part of the integration strategies A1-E1 was explored. The Netherlands has a high potential for ATES systems (Bloemendal et al., 2018). ATES systems can overcome the discrepancy between times of heat surplus and heat shortage by seasonally storing and recovering heat (Bloemendal et al., 2018) underground, at a depth of 100–250 m. ATES systems store heat at a maximum of 25°C, and a minimum of 5°C (IF Technology, 2019). As such, heat produced by the VF during summer can be stored, and extracted during winter.
This year-round bidirectional energy exchange would require the simultaneous cooling of both VF and the building during summer, which is not possible for strategies HE (A1) and HP (B1) even when integrating an ATES system. Figure 4 schematically presents strategies C2, D2 and E2 with ATES during the winter months when heating is required by the building. Here, direct heat from the VF and the heat stored in the ATES system during summer are supplied to the building. While the cold produced by heating the building is supplied to the VF or stored in the ATES system. In summer, cold is extracted from the ATES system to cool the VF and the building, and the heat produced by the cooling systems is stored. To avoid exhaustion of the aquifers, thermal energy extraction and storage should be balanced over the year (Bloemendal et al., 2018).
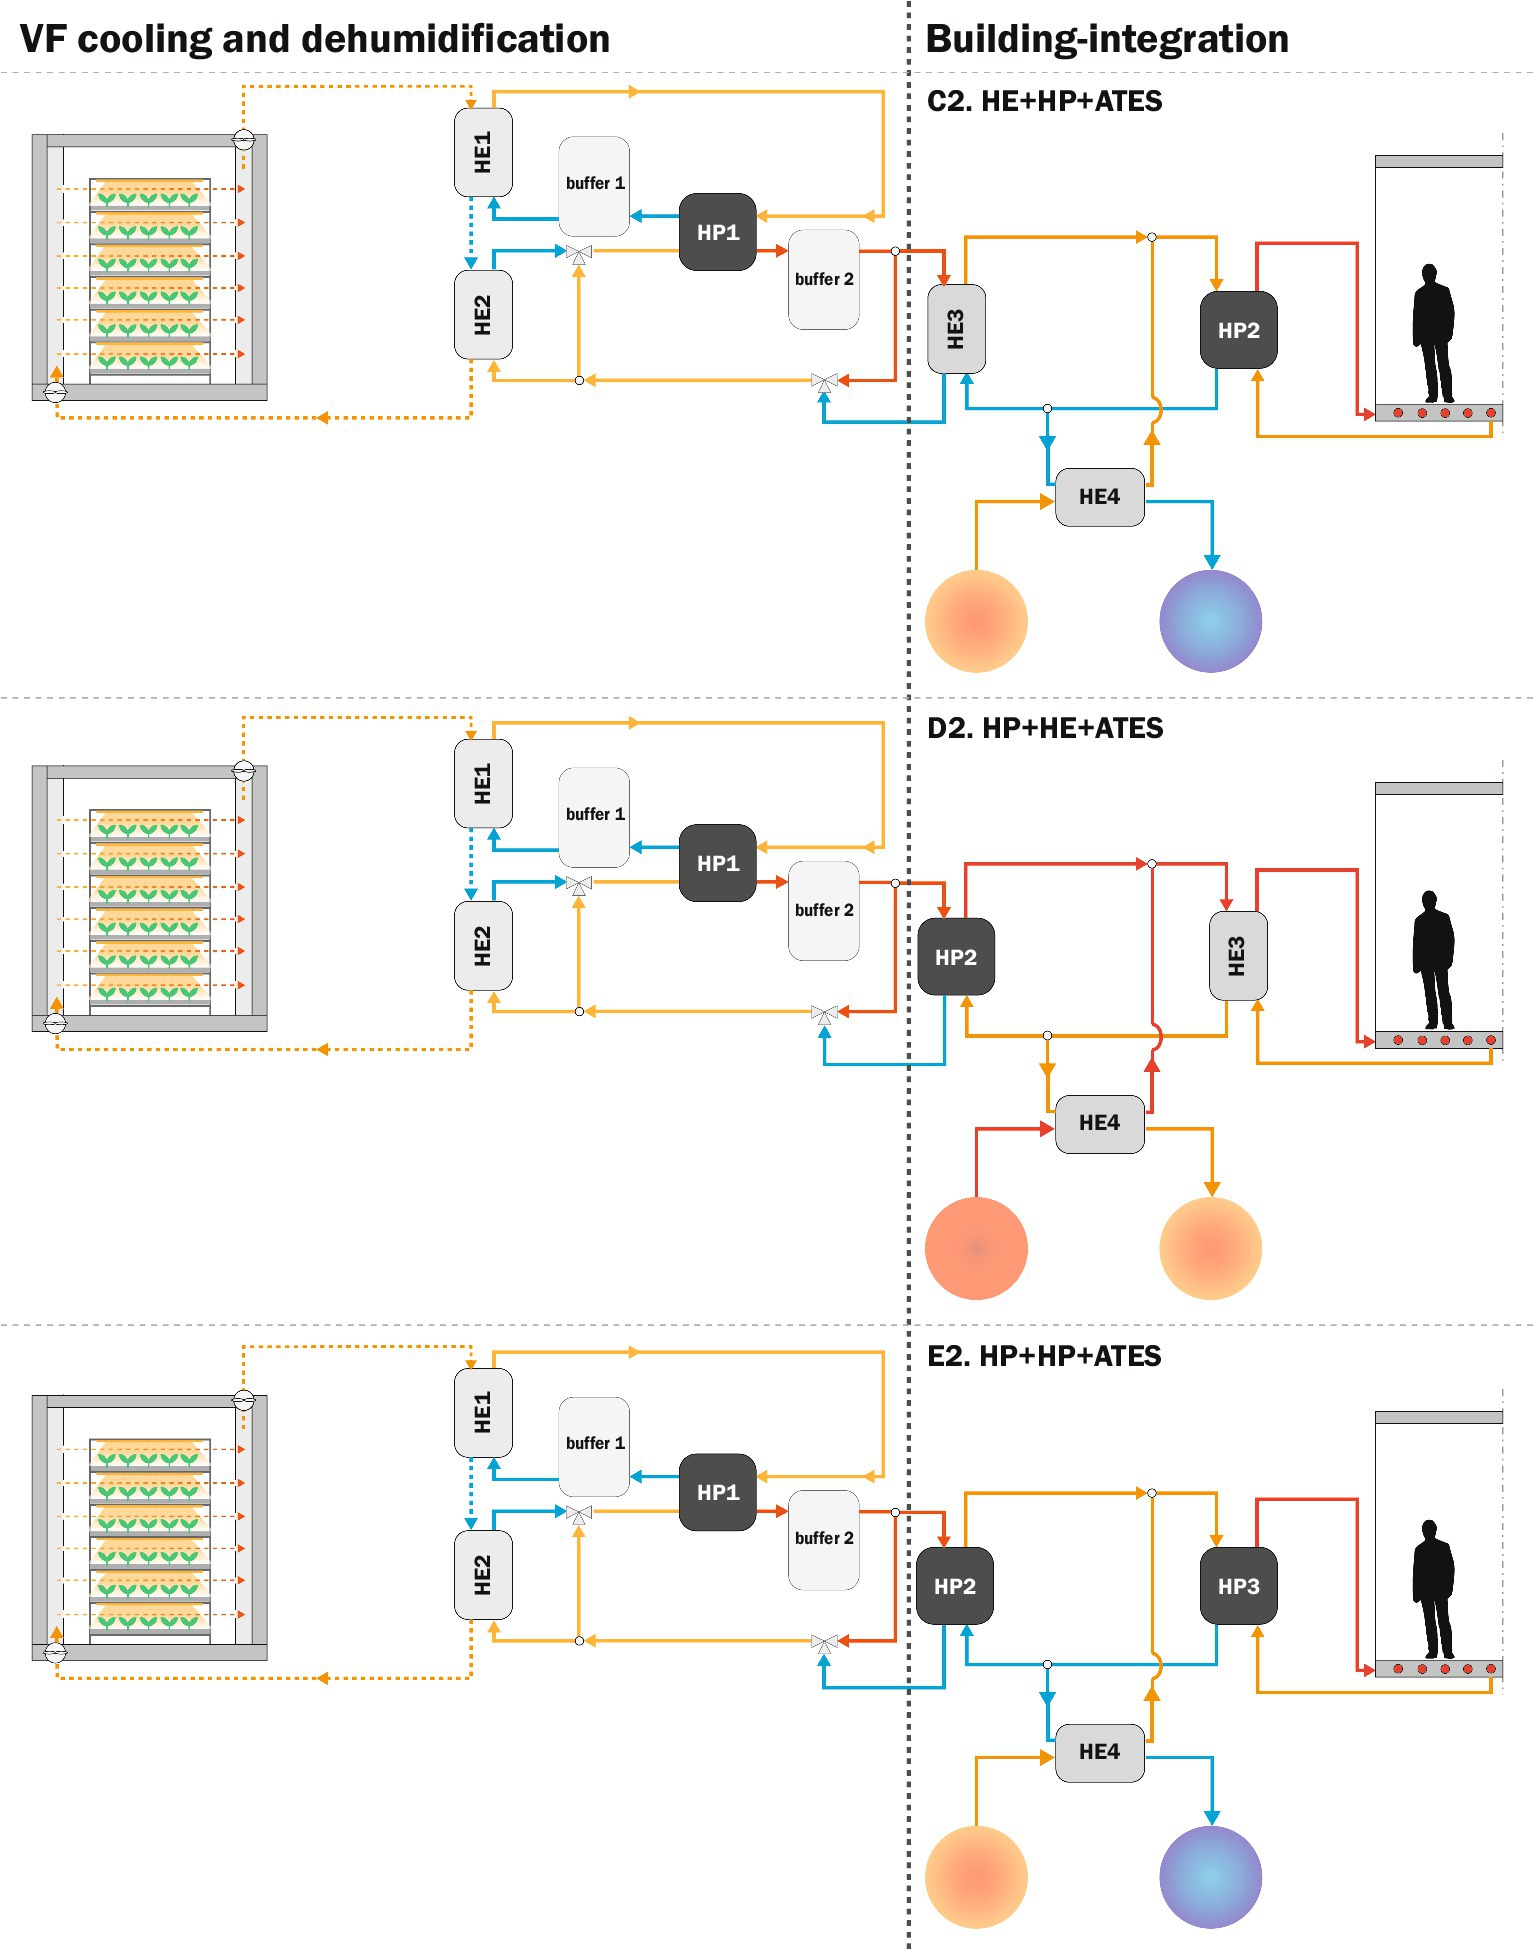
Figure 4. Three different strategies to enable year-round bidirectional exchange of thermal energy between a VF and building using aquifer thermal energy storage (C2-E2). The figure represents the winter season. Dashed lines represent air flows, and solid lines represent water flows.
2.3.3. Selecting integration strategies and calculating the energy savings
To define the potential energy savings as a result of the bidirectional exchange of energy between the VF and the different building typologies, applicable energy strategies had to be selected first. The integration strategies were selected on three criteria. The ability to produce the required heating temperatures (1), i.e., 23°C heating of swimming pools, 40°C low-temperature heating, and mid-temperature heating of 70°C (Section 2.2). The potential to comply with storage temperature restrictions of 25°C maximum, and 5°C minimum when using ATES (2). Finally, the energy efficiency of the applicable strategies was calculated (3).
The energy efficiency of the strategies was calculated for the integration with low-temperature heating. This energy efficiency indicates the quantity of 40°C heat (kWhth) that can be produced per kWh of electricity used by the climate systems of the integration. The electricity use of the climate systems that enable the bidirectional exchange of thermal energy between the VF and building include: the energy used by the HP, fans and pumps of the VF’s cooling and dehumidification system (Figure 2), the energy used by the HP(s) and pump(s) that supply the VF heat to the building’s heating system at the right temperature, and where applicable the energy used by the ATES pump. The energy use of these components was calculated according to the methods described in Supplementary material 2. The energy used by the distribution pumps of the building’s heating system were excluded (Section 2.2.).
Finally, we calculated the energy savings achieved as a result of the bidirectional thermal energy exchange between the VF and the different host building typologies, and the floor area of the building that could be heated via this exchange. The energy savings are presented in kWh per m2 cultivation area and for the floor area of the building that was heated with this synergy. The energy savings compare the energy use of the climate systems of the integration with that of the baseline VF and building in isolation. The baseline scenario adds together the energy used for cooling and dehumidification of one m2 cultivation area, and the baseline energy used to heat and cool the building’s floor area defined for the integration. For these calculations Microsoft Excel was used as a way to create dynamic relationships between changing conditions of building typologies, the VF, and the different integration strategies. The dataset can be downloaded via the Data Availability Statement, a step-by-step description of these calculations is found the Supplementary material.
3. Results
The following sections describe the results of this study. The selected energy strategies to facilitate the bidirectional exchange of heat and cold between the VF and the different buildings are described first, including direct integration (section 3.1.1) and integration with ATES (section 3.1.2). These sections also present the floor area of each building typology that can be heated with one square meter cultivation area in the VF, and the energy savings. Section 3.2 discusses the unidirectional flows of crops, water, and nutrients. All results are presented per one m2 of one production layer within the vertical farm, i.e., one m2 cultivation area.
3.1. Energy synergies
This section describes the energy savings obtained by creating bidirectional synergies between the VF and various building typologies. These savings include the baseline energy use of the cooling and dehumidification system of one m2 cultivation area of VF in isolation and that of the heating and cooling system of the building for the area heated by the synergy, in comparison to the total energy use of the integrated energy system cooling one m2 cultivation area and heating the specified area of the connected building. The elements included within the total energy use of the integrated climate system were specified in section 2.3.3. The total energy use of these climate systems is presented in kWh per m2 cultivation area of the VF. This also includes for the floor area of the building heated by this synergy.
3.1.1. Direct integration
Two strategies were selected for direct integration without seasonal energy storage: HE (A1), and HP (B1). Strategy A1 was most efficient for heating of 20–30°C as no additional HPs was needed, i.e., heating was done passively. The limitation of 20–30°C heating in strategy A1 was the result of the fixed temperatures required by HE2 to reheat the VF air to 24°C. This temperature could not be obtained when supplying 40°C heat to the host building. Therefore, strategy HE (A1) was only applicable for integration with swimming pools, using temperatures of 30°C supply and 23°C return. One m2 VF supplied the heat demands of an indoor swimming pool with a water surface of 0.17 m2, and an outdoor pool of 1.04 m2 (Table 1; Figure 5). The annual savings obtained by the climate systems of the synergy between the VF and the outdoor pool are 27%, which is significantly smaller than the savings of 51% when integrating the VF with an indoor pool. The outdoor pool is in winter, the VF will switch to the baseline strategy; dissipating excess heat to the environment.
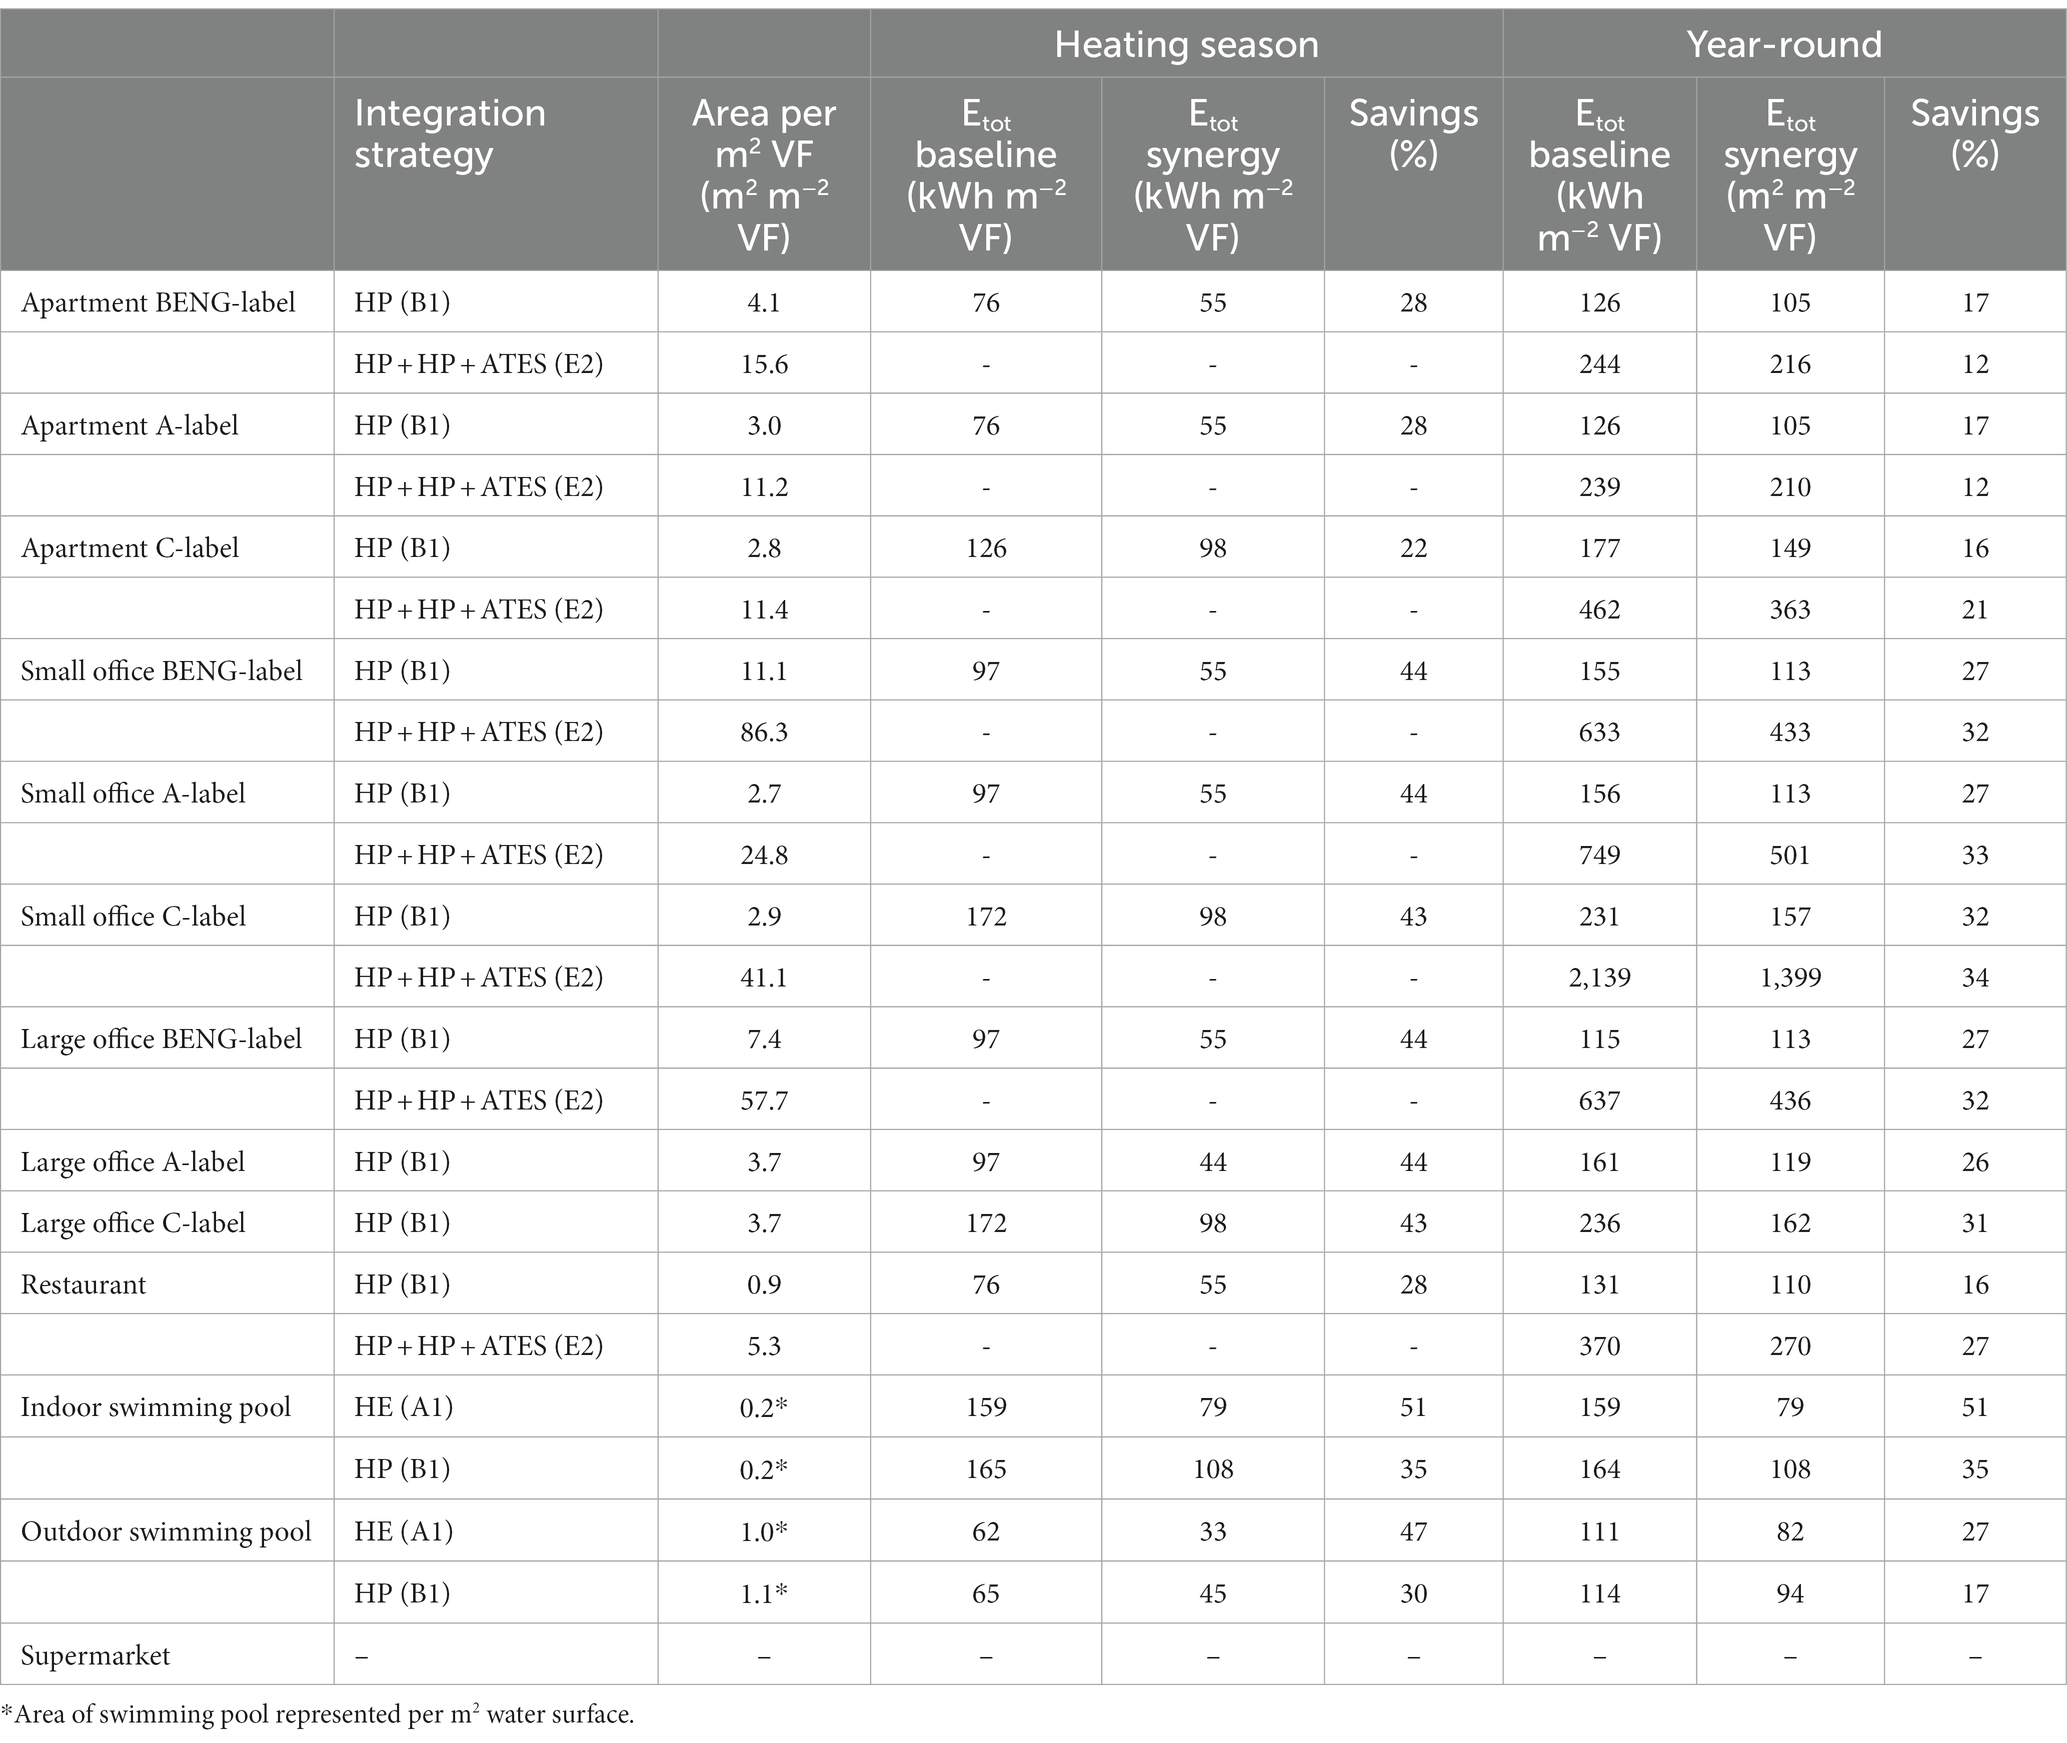
Table 1. Total energy use by the climate systems of one m2 of one production layer of the VF and the thereby heated areas of the different building typologies when using integration strategies A1, B1, or E2.
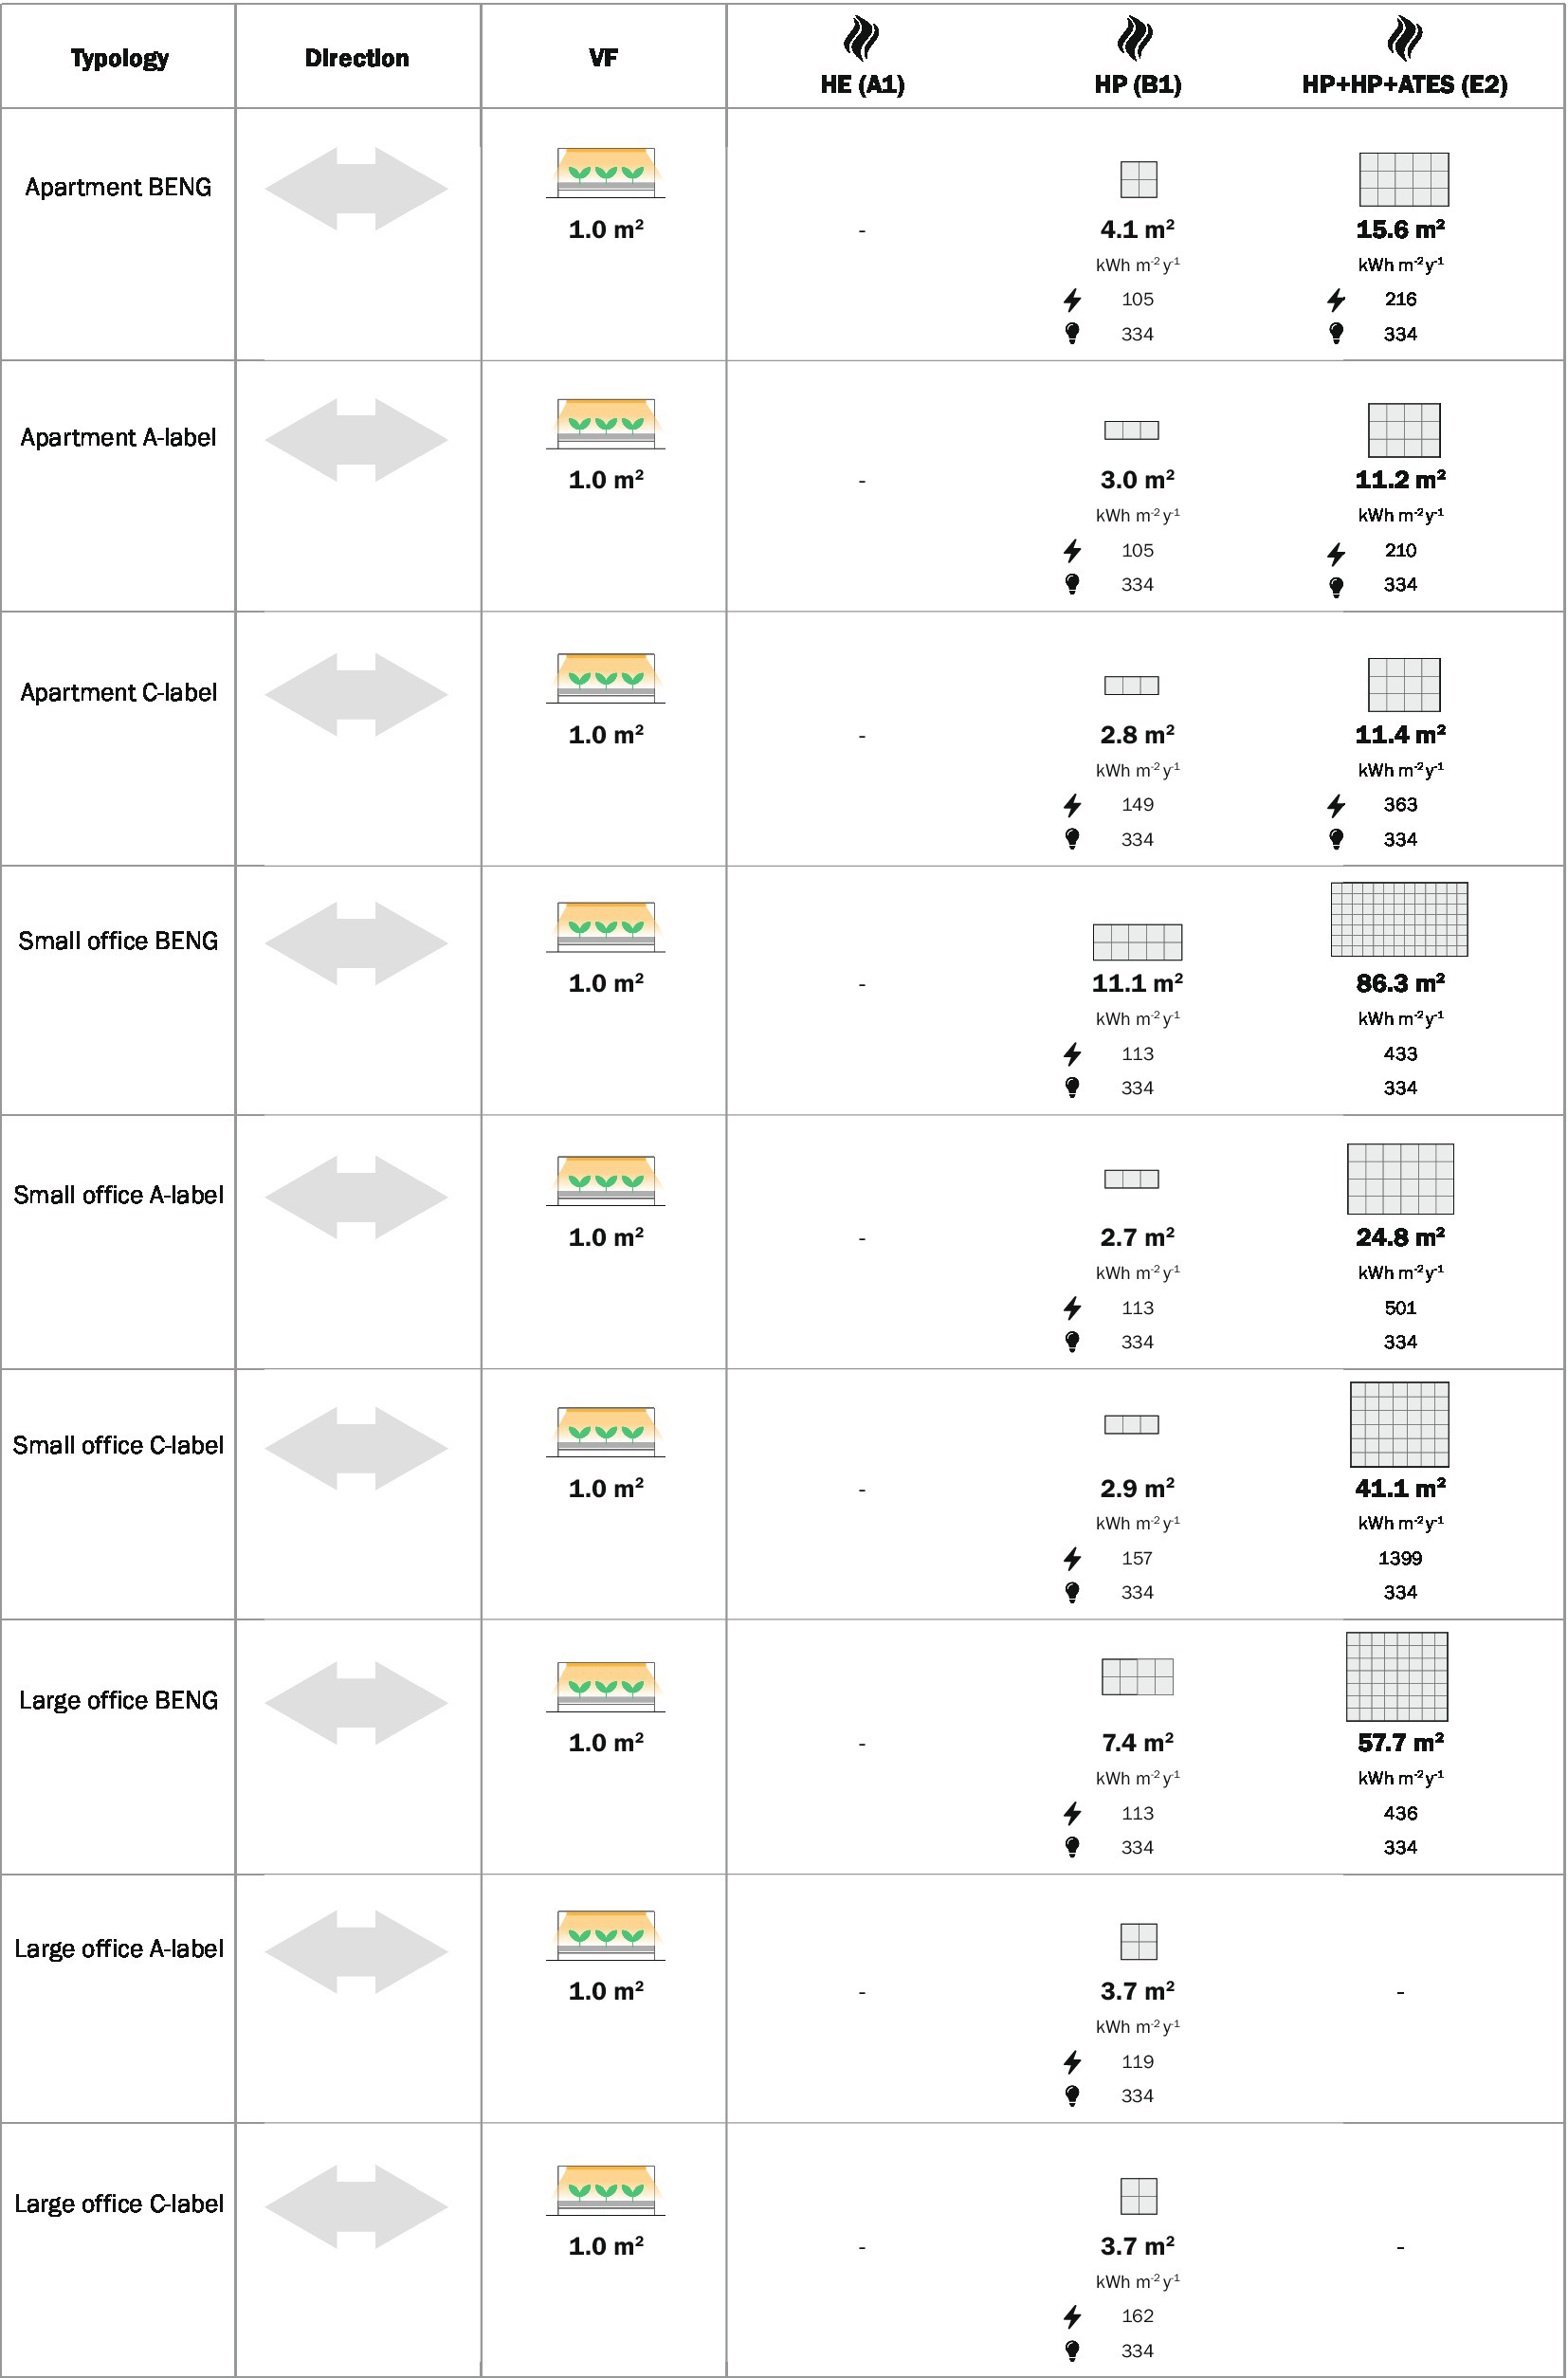
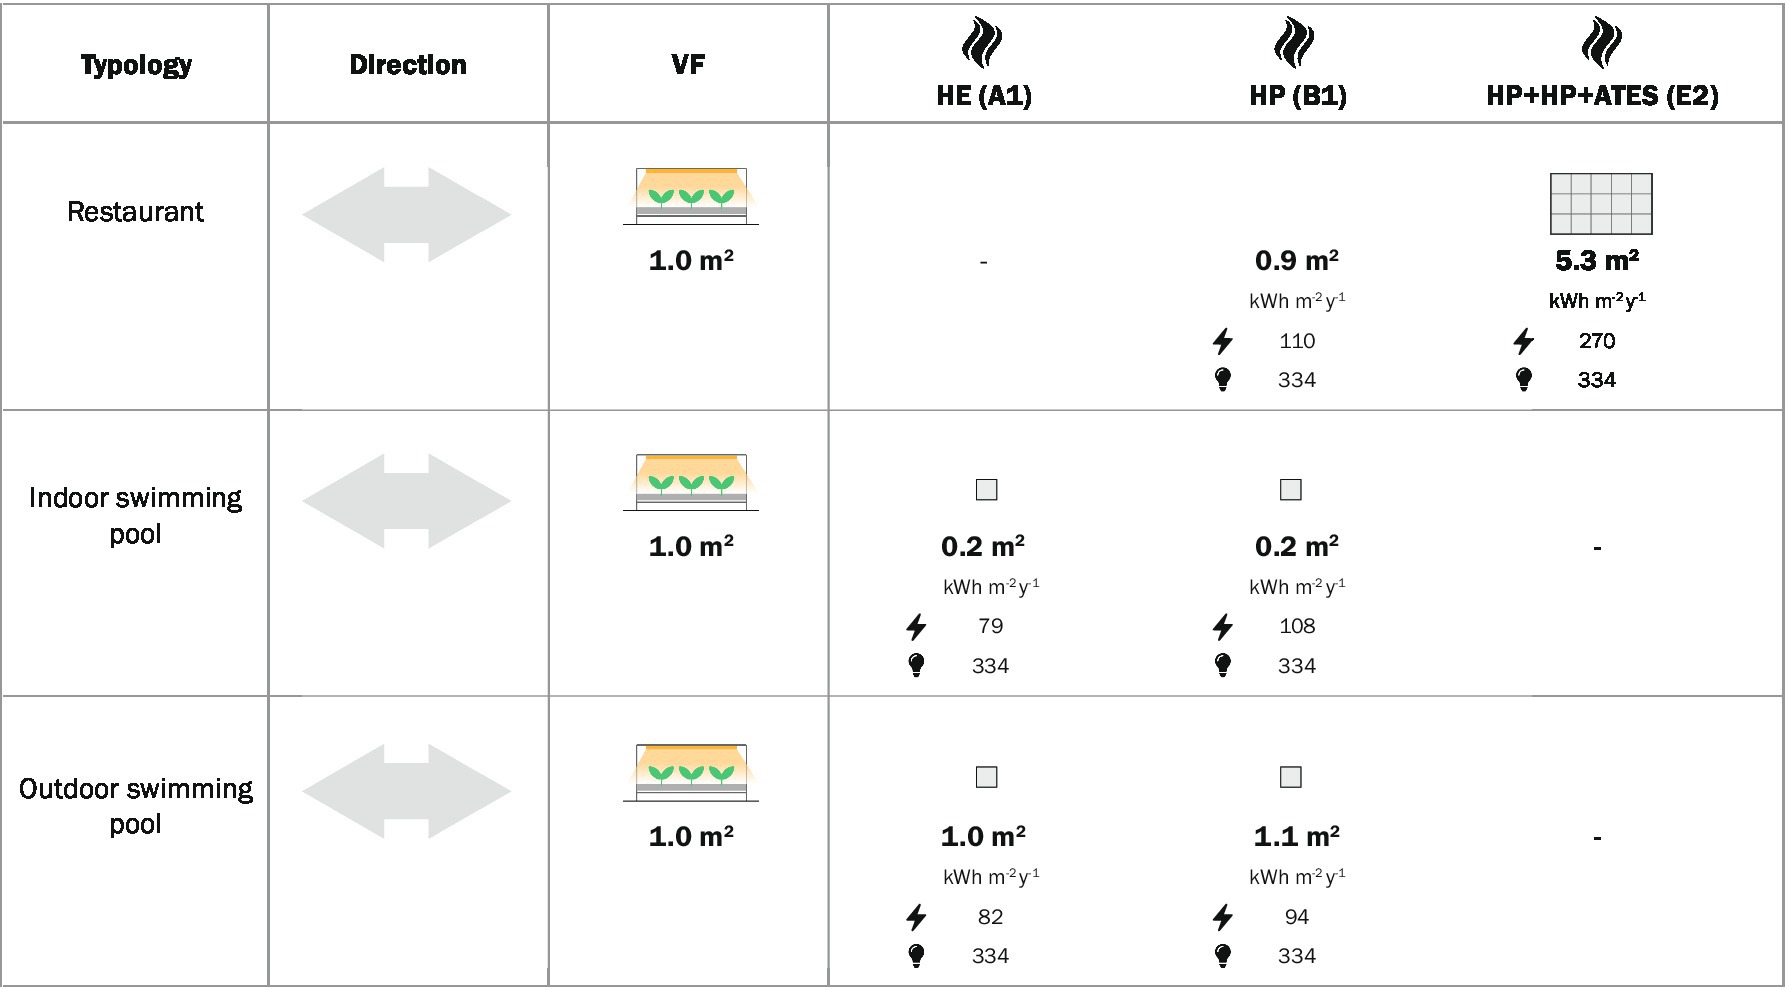
Figure 5. (A) Floor areas of different typologies that can be heated by creating a bidirection synergy with a vertical farm of one m2 cultivation area, i.e., one m2 of one production layer in the VF. Including the total annual energy use of the climate systems, and the LED systems of the vertical farm in kWh per m2 cultivation area. (B) Floor areas of different typologies that can be heated by creating a bidirectional synergy with a vertical farm of one m2 cultivation area, i.e., one m2 of one production layer in the VF. Including the total annual energy use of the climate systems, and the LED systems of the vertical farm in kWh per m2 cultivation area.
Direct integration strategies B1 through to E1 can supply heating of 40°C and higher, as active systems can upgrade the heat produced by the VF. The COSP represents the ratio between the amount of heat supplied to the host building’s heating system, and the total energy use of the system (as specified in section 2.3.3). When connected to a building with a floor heating system of 40°C, the COSP of strategies B1, C1, D1, and E1 were respectively, 7.4, 7.1, 7.2, and 6.8. Therefore, strategy B1 (HP) was selected as the most efficient active direct integration strategy in this study. Integration strategy B1 (HP) was used to heat the building. When there was no heating demand, the VF and building were cooled independently according to their baseline systems. By using strategy B1 (HP), each m2 cultivation area of the VF could supply the heating demands of between 2.8 m2 and 4.1 m2 of an apartment (C-, A-, BENG-label), between 2.7 and 11.1 m2 of an office (A-, C-, BENG-label), 0.9 m2 of a restaurant, 0.2 m2 water of an indoor swimming pool, or 1.1 m2 water of an outdoor swimming pool (Table 1; Figure 5). The year-round energy savings varied between 16 and 35%, and savings within the heating season between 22 and 44%. The savings within the heating season refer to the period when the synergetic exchange of heat and cold between the VF and building are active. Within the annual savings we also include the energy used by the baseline systems during periods without heat demands of the host building, i.e., when no synergy occurred. The synergy between a VF and a supermarket was not beneficial from an energy perspective as the cooling demands of the supermarket were significantly higher than its heating demands (Supplementary material 3.1). If the supermarket and VF would be integrated an abundance of heat would be produced as both functions require cooling throughout the year.
3.1.2. Integration with seasonal energy storage
Integration strategies C1, D1, and E1 could be combined with an ATES system (Section 2.3.2). HE4 connects the ATES system to the water circuit between HE3 and HP2 (C2), HP2 and HE3 (D2), and HP2 and HP3 (E2; Figure 4). In the Netherlands, ATES temperatures are restricted to 25°C maximum, and 5°C minimum. To produce supply air with a temperature of 24°C and RH of 76% for the VF, the water temperature leaving HE3 (C2) or HP2 (D2/E2) towards HE2 should be higher than 27.3°C. Due to the maximum temperature of 25°C in the ATES hot source, this cannot be achieved when using integration strategy C2. The floor heating supply and return temperatures were at least 40 and 30°C. The connection of HE3 to the floor heating system in strategy D2, therefore, resulted too high temperatures for storage in the ATES system. Integration strategy E2 (HP + HP) overcomes both difficulties of C2 and D2, as the temperatures produced by HP2 and HP3 were adjustable. Integration strategy HP + HP (E2) was, therefore, selected when using ATES.
In contrast to the direct integration strategies not using ATES, bidirectional synergies between the VF and host building occur year-round due to the integration with seasonal storage. During the building’s heating season, the amount of heat supplied to the building was the sum of the heat produced by the VF, the amount of heat extracted from the ATES hot source, and the electricity input of HP3. By heating the building, HP3 produces cold that was used for VF cooling by HP2, and the remainder was stored in the ATES cold source (Figure 4). Outside of the building’s heating system (Figure 6), this cold is extracted from the ATES cold source and used to remove heat from the VF whilst simultaneously cooling the building. The heat generated by HP2 and HP3 was stored within the ATES hot source for later usage. The amount of heat extracted and stored within both hot and cold source of the ATES system was balanced over the year.
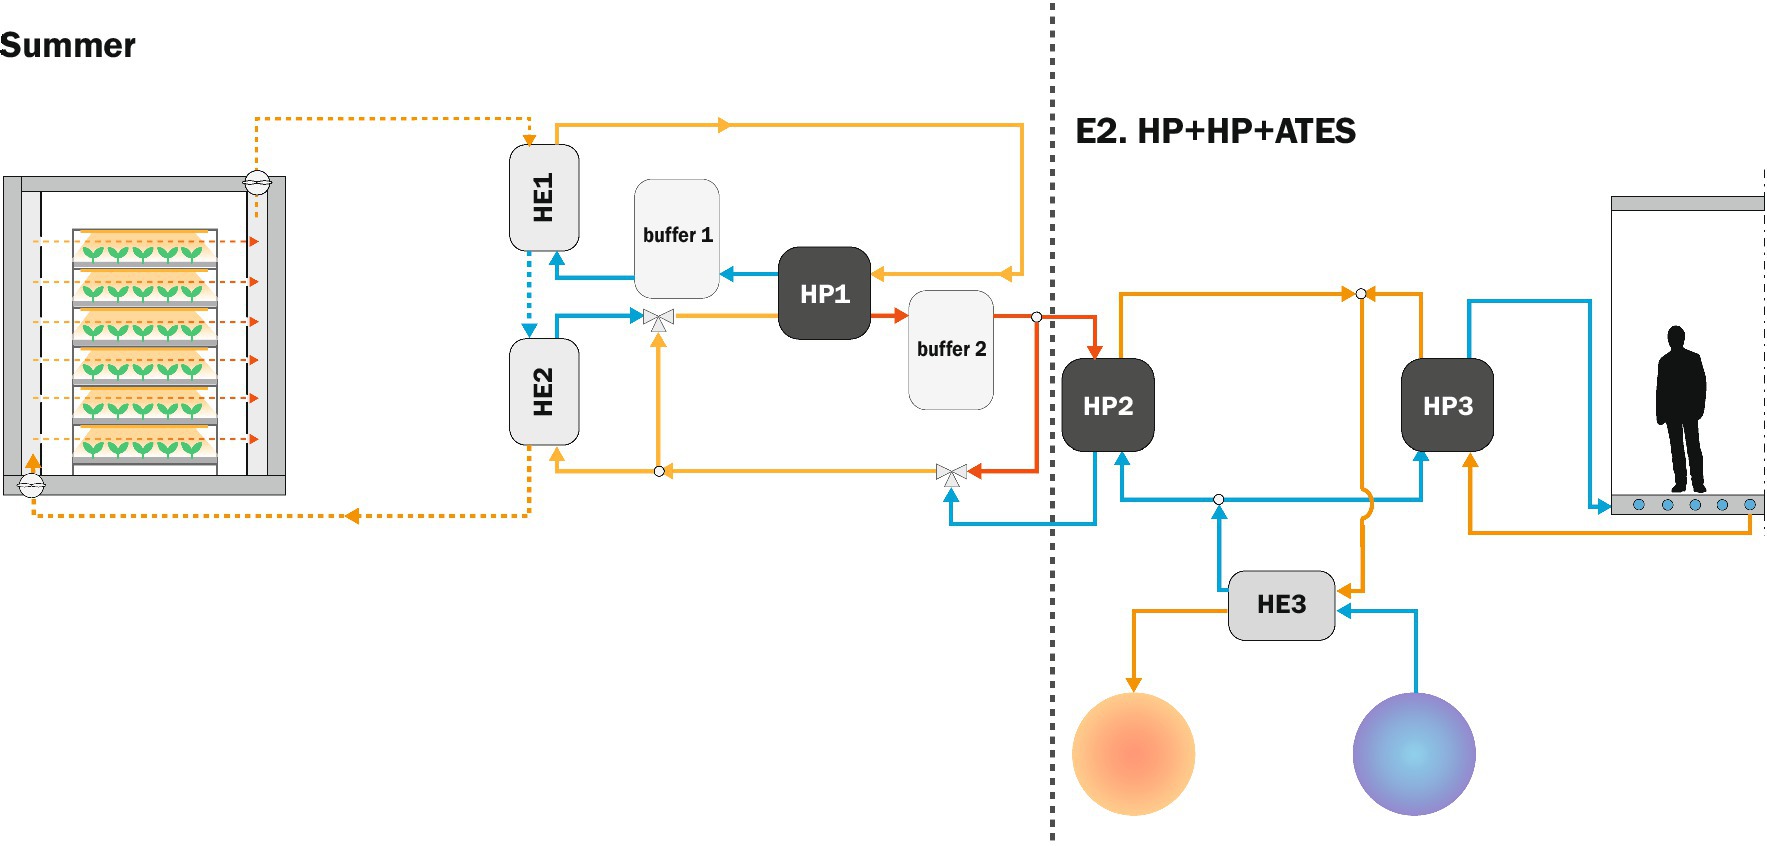
Figure 6. Schematic representation of integration strategy HP + HP (E2) with ATES in summer.
To achieve the thermal balance described above by using strategy E2 (HP + HP + ATES), each m2 of VF should be combined with between 11.2 and 15.6 m2 of an apartment (A, C-, or BENG-label), between 24.8 and 86.3 m2 of a small office (A, C-, or BENG-label), 57.7 m2 of a large BENG-labelled office, or 5.3 m2 of a restaurant (Table 1; Figure 5). These synergies resulted in total annual energy savings of between 12 and 35%. Large, A- and C-labelled offices were not suitable for integration with VFs when using ATES. When cooling large offices with ATES systems, enough heat is generated during the summer months to supply the heating demands during the colder and intermediate months without the need for additional VF heat. The indoor swimming pool would not benefit from the ATES system either as it uses the heat produced by the VF year-round. The outdoor pool had a heat demand in summer, when other functions had no heat demand, e.g., apartments and restaurants. In the heating season of these buildings, the outdoor pool is closed. Therefore, the integration of a VF with an outdoor pool and an apartment or restaurant could create year-round symbiosis without the need for ATES. Finally, as described in Section 3.1.1 the synergy between the VF and supermarket was not beneficial due to the high cooling demands by the supermarket.
The results indicate that one m2 cultivation area of the VF can heat a larger floor area of small C-label offices, and C-label apartments with ATES than A-labels (Figure 5). This was not expected due to the higher heating demands of C-labels (Supplementary material section 4.1). The COP value for mid-temperature heating was lower than for low-temperature heating, thus the HP of C-labels used more electricity and the condenser produced more heat. The ratios between the heating demands of these A- and C-label offices and apartments were smaller than the ratios between the electricity inputs of these HPs. Therefore, the C-labelled offices and apartments with ATES required less cultivation area than the A-labels.
3.2. Crop, water, and nutrient flows
Besides the bidirectional exchange of heat and cold using integration strategies A1, B1, or E2, unidirectional flows between the VF and the building could be established. These include the production of lettuce in the VF for consumption by the building users, and the reuse of grey water and nutrients from the building in the VF.
3.2.1. Crop production
We assumed that each person consumed 250 g of vegetables per day, and for simplification of the study all vegetables consumed were lettuce. The lettuce demands per person for each building typology are described in Supplementary material 3.3. One m2 of cultivation area produces enough lettuce annually to feed 0.9 person living in the apartment, to provide the lunch of 1.4 full time employees working in an office, or to produce the vegetables for 315 meals in the restaurant (Figure 7). Furthermore, each m2 of cultivation area could produce 79 kg of lettuce for a supermarket annually. We assumed swimming pool visitors consume minimal quantities of vegetables, and this flow was thus excluded for this typology.
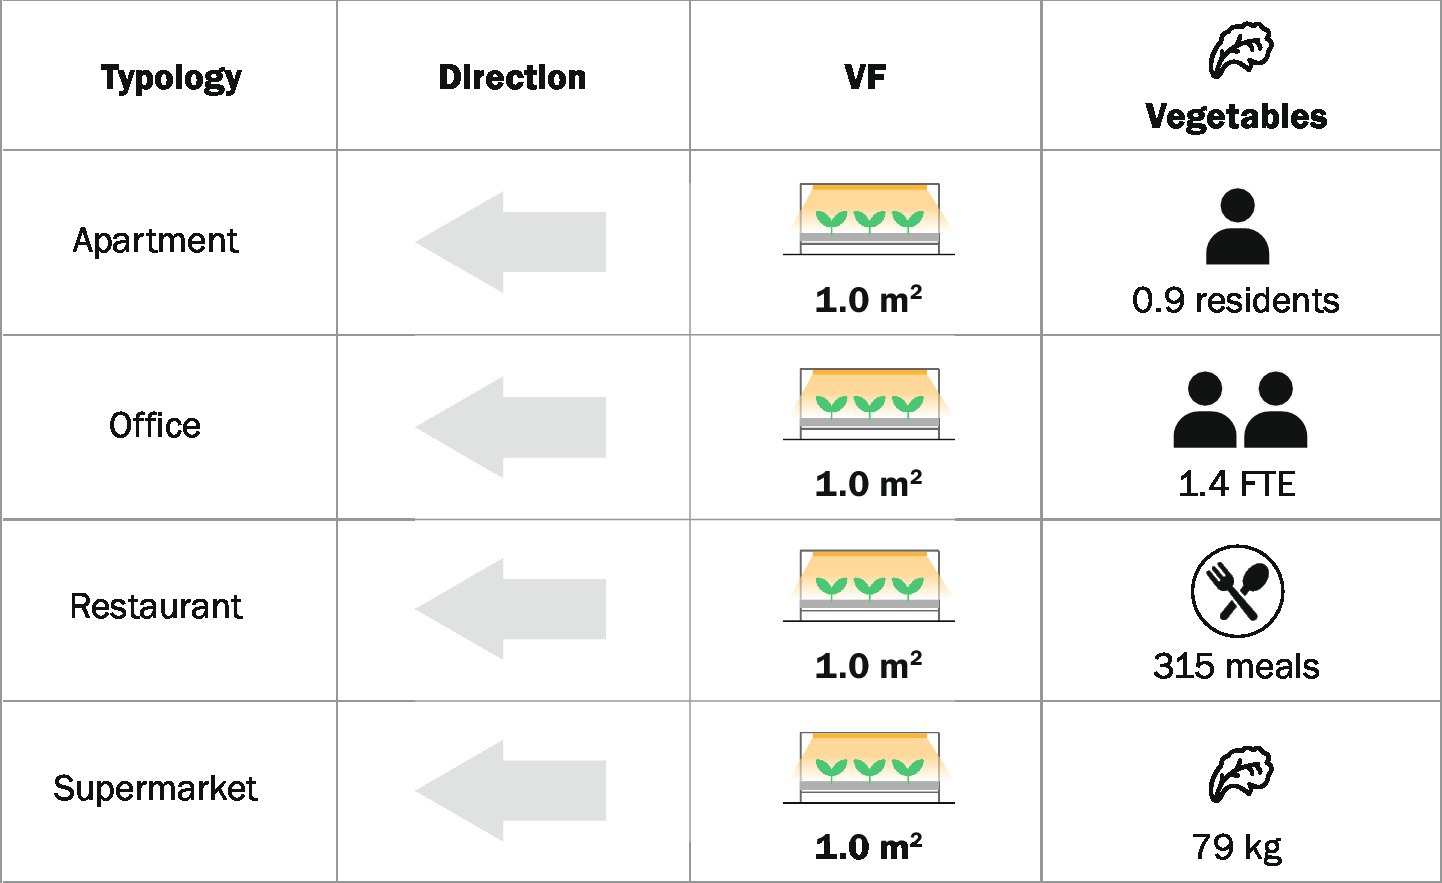
Figure 7. The unidirectional flow of lettuce produced by one m2 of one production layer in the VF, that can theoretically be used to supply the annual vegetable consumption of the apartment’s residents, the lunches of office employees, or the meals produced in the restaurant.
3.2.2. Grey water reuse
Grey water output of host building can be filtered and reused for toilet flushing or to water the crops of the VF. The reuse of grey water for toilet flushing was prioritized, the remaining grey water was supplied to the VF. As the grey water production of the offices was smaller than the water used for toilet flushing, no grey water was supplied to the VF (Supplementary material 4.4). The grey water production of apartments, restaurants, and swimming pools was higher than the water required for toilet flushing, and therefore the remaining grey water could be reused for crop watering in the VF. Each m2 of cultivation area annually consumes the grey water outputs produced by 0.004 residents in the apartments. One m2 of cultivation area could also be watered by the grey water output of 10 visitors to the restaurant or one visitors to the swimming pool assuming each visitor uses the toilet once. There was no data available on the water consumption of the supermarket, thus the supply of grey water to the VF was excluded in Figure 8.
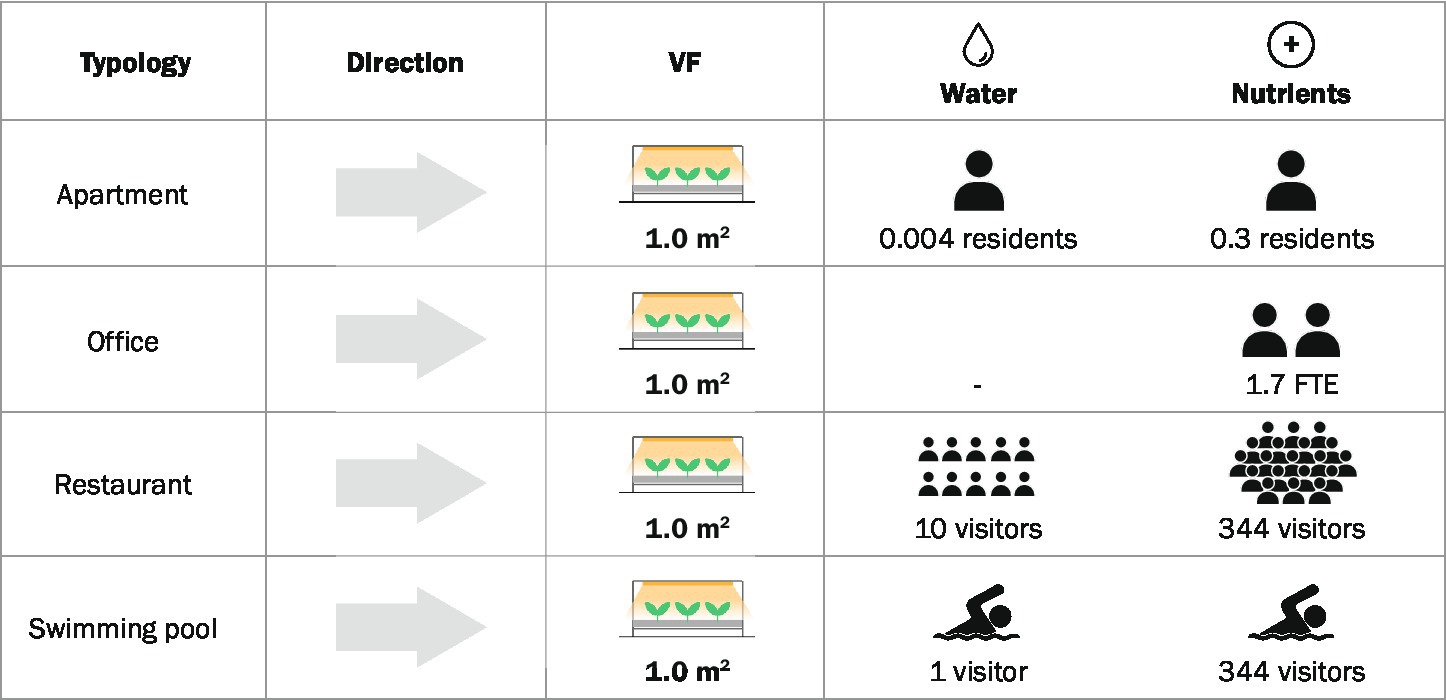
Figure 8. The unidirectional flows of grey water and nutrient outputs of the host building, that can be used to supply the water and nutrient demands of one m2 of one layer of cultivation area of the vertical farm. The required water and nutrient production is expressed in the amount of residents of the apartments, employees of the office, or visitors of the restaurant or swimming pool.
3.2.3. Nutrient recovery
Nutrients recovered from human urine could be used to replace synthetic fertilisers in the VF (Supplementary material 4.5). The annual nutrient demands of one m2 cultivation area in the VF could be supplied with the nutrients recovered from urine of 0.3 residents in the apartments, 1.7 full time employees, or 344 visitors of the restaurant or swimming pool (Figure 8). For the latter, we assumed each visitors uses the toilet once.
4. Discussion
Section 4.1 discusses the results related to the bidirectional energy synergies in more detail and in relation to other studies, identifies some of the research limitations, and makes suggestions for further study. Section 4.2 provides further discussion on the unidirectional flows of crops, water, and nutrients and makes suggestions for further studies on resource flows other than energy.
4.1. Energy synergies
4.1.1. Residual heat production by vertical farms
Within existing literature, two studies calculated the residual heat production by VFs. Graamans (2021) defined the annual residual heat production of a non-integrated VF of 1,037 kWh per m2 cultivation area during the 16 h photoperiod, and 64 kWh m−2 y−1 during the 8 h dark period. The LEDs used 973 kWh m−2 y−1, with a PPFD of 500 μmol m−2 s−1, a DLI of 28.8 mol m−2 d−1, and a molar efficacy of 3.0 μmol J−1. The non-integrated (baseline) VF studied in this paper produced 353 kWh m−2 y−1 of residual heat. The LEDs had a DLI of 11.5 mol m−2 d−1, and a molar efficacy of 3.5 μmol J−1. The electricity used for artificial light per m2 cultivation area is thereby 34% of the electricity used by LEDs in Graamans (2021). This explains the significant difference in heat production between both studies. According to Matysiak et al. (2022), the best performance in terms of quality and yield for lettuce production is achieved with a DLI of approximately 13.8 mol m−2 d−1, which is closer to that used in the current study. This study excluded the dark period from the research. The results of Graamans (2021), indicate a minimal increase of heat production when including dark period in the calculations. Martin et al. (2022) studied the direct integration of VFs within the energy system of an apartment building in Sweden, i.e., without seasonal energy storage. In total, 107 MWhth of heat was supplied to this apartment by a VF that uses 130 MWh y−1 for LED (DLI of 12.46 mol m−2 d−1), and 45 MWh y−1 for climate systems. This results in a heat production of 0.82 kWhth per kWh of electricity for LEDs in comparison to 1.2 kWhth per kWh of LED in this paper using strategy B1 (HP). Both VFs used a different baseline strategy for cooling and dehumidification. A study of different cooling and dehumidification strategies for VFs including energy use and residual heat production is needed to further increase the energy efficiency of VF integration with building energy systems. Such a study could also include water-cooled LEDs that diminishes heat dissipation into the VF by cooling the LEDs directly with water (Xiaoying et al., 2015). As the removal of latent heat requires air-cooled systems (Graamans, 2021) such a strategy would require both water- and air-cooled systems.
4.1.2. Building-integration energy savings
The results suggest that the bidirectional exchange of energy between a VF and a building can decrease total annual energy use of the climate systems collectively by between 12 and 51% when compared to the cumulative baseline approaches of both functions. This positive effect of energy synergies between urban agriculture and buildings was also found in previous studies that investigated energy exchange between rooftop greenhouses and buildings (Muñoz-Liesa et al., 2020, 2022; Jans-Singh et al., 2021; Ledesma et al., 2022). The energy synergy in this research was most effective when the building contrasted the VF in terms of energy demand. Therefore, the highest annual savings of 51% were achieved when creating synergy between the VF and the indoor swimming pool that requires heating year-round. For the same reason, supermarkets with year-round cooling demand and minimal heating demand did not benefit from this synergy (Section 3.1.1). This suggest that the use of residual heat from a VF within the energy systems of buildings offers most benefits within cold and temperate climates, and less for warm climates where buildings have minimal heating demands. This thought was confirmed by Graamans (2021) stating that the integration of VFs in urban energy systems has little value for locations dominated by cooling demands. This finding did not apply to the broader perspective of Muñoz-Liesa et al. (2022) and urban agriculture, which concluded that bidirectional energy exchanges between a rooftop greenhouse and office building in a warmer Mediterranean climate resulted in energy savings for heating and cooling both entities.
Buildings without continuous heating demands obtained year-round energy symbiosis with the VF by including an ATES system for seasonal heat and cold storage. The synergy between a VF and a BENG-label office, or a small A- or C-label office resulted in annual energy savings from the climate systems of 32, 33, and 34%, respectively, when using strategy E2 (HP + HP + ATES). For these functions, strategy E2 resulted in higher savings than for the direct integration with strategy B1 (HP), which reduced the energy for climate systems by between 27 and 32%. In addition to the energy used for climate systems, each m2 cultivation area of the VF used 334 kWh of electricity for LEDs. The floor areas of these offices heated by one m2 cultivation area were between 7.8 and 14.2 times larger for the integration of offices with ATES than without, resulting in relatively low electricity use for artificial light per m2 of office space for strategy E2. Integration strategy E2 also reduced the electricity use of the climate systems of the C-label apartments and restaurants by 21 and 27% respectively, in comparison to 16% for both functions when using strategy B1. Furthermore, one m2 cultivation area could heat 4.1 and 5.9 times more floor area of the C-label apartment and restaurant for E2 in comparison to B1.
Direct integration without seasonal storage also resulted in energy savings although the VF and building switched to their baseline strategies when there was no demand for heat; i.e., during warmer months. The year-round energy savings by the climate systems when using strategy B1 (HP) were 16–17% for the apartments, 26–27% for BENG- and A-label offices, 31–32% for C-label offices, and 16% for restaurants. The year-round savings were higher for BENG and A-label apartments when using integration strategy B1 than for strategy E2. However, the floor areas heated per one m2 cultivation area of the VF were about 3.7 times larger for strategy E2 than for B1.
4.1.3. Research limitations and suggestions for further study
The energy savings in this paper were calculated in comparison to the baseline energy use of the VF and building typologies: the sum of the energy used by the cooling and dehumidification systems of one m2 cultivation area of a VF, and the energy used by the baseline heating and cooling systems of the building’s floor area heated by of one layer cultivation area of the VF. These savings are sensitive to the choice of the replaced energy system (Martin et al., 2022). In this research, the baseline buildings used air-sourced HPs, while most existing buildings in the Netherlands are heated with natural gas. Such comparison would result in higher energy savings than calculated. The study did not include the energy used by the distribution pumps of the building’s heating system, and the production of DHW. The production of DHW would require an additional HP to produce water of 60°C, and would decrease the floor area of the building that can be heated with one m2 cultivation area. The symbiosis between the VF and building would, however, be improved as the residual heat could partly be used for DHW production in summer (Martin et al., 2022).
The floor areas of BENG-label apartments and offices that could be heated with one m2 cultivation area were significantly larger than that of the A-label equivalents (Figure 6). The energy demands of the BENG-labels were based on simulated data, whilst the A- and C-labels used empirical data from a real-world setting. The difference between actual and simulated energy is the energy-performance gap. In the Netherlands, the actual energy use is significantly higher than the simulated energy use for heating energy efficient residential buildings (Van Den Brom et al., 2018) and heating and cooling energy efficient office buildings (Sipma, 2019). This suggests that the indicated cultivation areas to heat BENG-labelled apartments and offices would be higher in a real-world setting.
The results indicated that the integration of a VF and ATES system (E2) was not possible for larger A- and C-label offices as their HPs produced enough heat for winter by cooling the office in summer. The integration of a VF would thus result in an abundance of heat in the ATES system. However, no specific data were available on the cooling demands of offices in the Netherlands, and they were approximated by appointing 17% of the electricity use to the cooling installations with a COP of 4 (KWA, 2016). This indicates that the appropriateness to integrate VFs with offices and ATES should be considered for each office specifically. Besides building energy patterns, the integration with ATES may not be possible as a result of underground characteristics or project budgets.
To maximise transferability of the results, we focused on the inputs and outputs of one m2 cultivation area of a VF, i.e., one m2 of one production layer of the VF. To date, it is not possible to define a typical VF layout as many different approaches of food production exist, e.g., growth method, number of growth layers, cultivation height, and automation. If a certain food production system within the VF is selected this will have a big impact on the overall floor areas required within the building as a result of production efficiency and the overall number of cultivation layers. To increase replicability of the research for other VF configurations, the Supplementary material provide a step-by-step description of the different calculations made to support the dataset provided in the data availability statement.
4.2. Crop, water, and nutrient flows
The results presented that each m2 cultivation area of the VF can produce sufficient lettuce to fulfil the vegetable demands of 0.9 residents, 1.4 office employees, or 315 restaurant visitors (Figure 7). This indicates that an abundance of crops may be produced when sizing the VF to according to the building’s heat demands. The yields were calculated using a light use efficiency of 19 g fresh weight lettuce per mol of incident light. Carotti et al. (2021) noted a light use efficiency of 44 g fresh weight per mol within a lettuce producing VF. This light use efficiency increases the yields from 78.8 to 185 kg fresh weight m−2 y−1 and reduces cultivation area to produce 1 kg fresh weight lettuce by 43%. In that case, food should partially be sold when the goal is to supply the building with heat from the VF. In this study, the VF only produces lettuce, whilst an assorted range of vegetables is required to provide a healthy diet. The production of various vegetables would affect the quantity of fresh weight and heat produced as each crop has its specific requirements, e.g., temperature, RH, PPFD, photoperiod, and growth density.
The VF used water highly efficiently due to the reuse of water vapour from dehumidification. This could be further improved by replacing tap water inputs with the filtered grey water outputs of apartments, restaurants and swimming pools. Figure 8 indicates that the annual grey water outputs of 0.004 residents, or the water outputs of 10 restaurants visitors or 1 swimming pool visitor collectively are sufficient to supply the water demands of the VF. This suggest that when sizing a VF according to the heat or vegetable demands of the building, large quantities of grey water will remain unused. Evapotranspiration of crops could be used to purify grey water or rainwater (Kalantari et al., 2017). Reusing this filtered water within the building could reduce tap water inputs and grey water outputs of the building. Nutrient recovery from urine to replace synthetic fertilisers in the VF is less effective than water reuse, but offers a significant potential to reduce inputs from external sources in the VF.
Other resource flows might be explored to further increase symbiosis between the VF and building. Human respiration is the main source of indoor CO2. CO2-levels can reach up to 2,500 ppm in office building depending on the ventilation rate (Shao et al., 2021). Studies presented that the CO2-levels of rooftop greenhouses can be increased by reusing the ventilation exhaust air of offices (Sanjuan-Delmás et al., 2018) or classrooms (Ledesma et al., 2022). This could effectively replace the need for pressurised CO2 in VFs in a sustainable matter. However, the closed-box environment of the VF adds another level of complexity as the growth conditions should remain uniform and independent from the building and outdoor climate. Furthermore, the integration of VFs within urban areas will unlock an array of future synergies as a wider range of resources in higher quantities will be available. Finally, further research is required to better understand the potential of bidirectional energy flows, and unidirectional water and nutrient flows, to reduce the environmental impacts of VFs and buildings. Besides the resource savings, this study should include the impacts related to the technical systems and infrastructure required for these resource exchanges.
5. Conclusion
This research showed that the bidirectional exchange of thermal energy between VFs and buildings can reduce the total combined energy use of both entities. Furthermore, it indicates that the VF’s inputs of water and nutrients from external sources can be diminished by using waste flows from the building, whilst the crops produced within the VF can provide vegetables to the building users. If the goal of the integration is to provide all heating demands of the building by the residual heat produced within the VF, the energy used by the climate systems of both entities could be reduced by between 12 and 51%. When sizing the VF to produce all heating demands of an apartment with a floor area of between 75 and 100 m2, the water and nutrient requirements of the VF can be fully supplied by the waste outputs of one or more resident(s). The VF will produce all vegetables consumed by these residents. These findings apply to energy labels BENG, A, and C when using a HP as direct integration strategy, or two HPs in combination with seasonal thermal energy storage. The cultivation area required to heat a certain size office (of any energy label) using the integration strategy with two HPs and ATES is too small to provide all vegetables for the lunches of the employees, but ample nutrients will be produced to sustain the VF. When using a HP for direct integration, sufficient food will be produced, however, too little employees will be available to produce for the nutrient inputs, and the electricity use for the climate systems and LEDs will increase significantly. In all situations, not enough grey water is produced by the offices to sustain the VF. The restaurant and swimming pool will supply the water inputs of the VF, when the latter is sized to according to the building’s heat demands. Replacing all synthetic fertilisers will be challenging for these integrations. Finally, the exchange of resources between the VF and supermarket is limited to the production of lettuce for the supermarket.
The results of this study provide a first step in quantifying the potential energy savings and resource synergies between VFs and buildings. Further research is required to investigate the influences of other baseline strategies to heat, cool, and dehumidify the VF, inclusion of DHW demands, the production of an assorted range of vegetables, and to study other potential synergies between VF and buildings. Although there are many variables and potential implications of the different strategies and approaches that have been investigated, this research shows that the integration of VF in an array of different buildings with different functions offers a great potential to reduce the environmental impacts of both VFs and buildings, whilst producing food within cities.
Data availability statement
The datasets presented in this study can be found in online repositories. The names of the repository/repositories and accession number(s) can be found at: https://doi.org/10.4121/adca348c-49a6-4e2f-a1c7-6f2b3d40c16b.
Author contributions
TB, AJ, and AD developed the concept for this study. TB developed the methodology, generated the data and made the visualisations. All authors contributed to the article and approved the submitted version.
Funding
This work was supported by TTW Perspectief programme “Sky High” (P18-07).
Acknowledgments
The authors wish to thank the operational vertical farm for providing their activity data. This research is part of the TTW Perspectief programme “Sky High,” which is supported by AMS Institute, Bayer, Bosman van Zaal, Certhon, Fresh Forward, Grodan, Growy, Own Greens/Vitroplus, Priva, Signify, Solynta, Unilever, van Bergen Kolpa Architects, and the Dutch Research Council (NWO).
Conflict of interest
The authors declare that the research was conducted in the absence of any commercial or financial relationships that could be construed as a potential conflict of interest.
Publisher’s note
All claims expressed in this article are solely those of the authors and do not necessarily represent those of their affiliated organizations, or those of the publisher, the editors and the reviewers. Any product that may be evaluated in this article, or claim that may be made by its manufacturer, is not guaranteed or endorsed by the publisher.
Supplementary material
The Supplementary material for this article can be found online at: https://www.frontiersin.org/articles/10.3389/fsufs.2023.1227672/full#supplementary-material
References
Bloemendal, M., Jaxa-Rozen, M., and Olsthoorn, T. (2018). Methods for planning of ATES systems. Appl. Energy 216, 534–557. doi: 10.1016/j.apenergy.2018.02.068
Blom, T., Jenkins, A., Pulselli, R. M., and van den Dobbelsteen, A. A. J. F. (2022). The embodied carbon emissions of lettuce production in vertical farming systems, greenhouse horticulture, and open-field farming in the Netherlands. J. Clean. Prod. 377:134443. doi: 10.1016/j.jclepro.2022.134443
Carotti, L., Graamans, L., Puksic, F., Butturini, M., Meinen, E., Heuvelink, E., et al. (2021). Plant factories are heating up: hunting for the best combination of light intensity, air temperature and root-zone temperature in lettuce production. Front. Plant Sci. 11:592171. doi: 10.3389/fpls.2020.592171
CBS (2018). Energiekentallen utiliteitsbouw dienstensector: oppervlakte klasse. Available at: https://opendata.cbs.nl/statline/#/CBS/nl/dataset/83374NED/table?ts=1642090250137 (Accessed June 20, 2023).
Gentry, M. (2019). Local heat, local food: integration vertical hydroponic farming with district heating in Sweden. Energy 174, 191–197. doi: 10.1016/j.energy.2019.02.119
Germer, J., Sauerborn, J., Asch, F., de Boer, J., Schreiber, J., Weber, G., et al. (2011). Skyfarming an ecological innovation to enhance global food security. J. Verbr. Lebensm. 6, 237–251. doi: 10.1007/s00003-011-0691-6
Graamans, L. J. A. (2021). Stacked: the building design, systems engineering and performance analysis of plant factories for urban food production [doctoral dissertation, Delft University of Technology]. A+BE | architecture and the built environment.
Graamans, L., Baeza, E., van den Dobbelsteen, A., Tsafaras, I., and Stanghellini, C. (2018). Plant factories versus greenhouses: comparison of resource use efficiency. Agric. Syst. 160, 31–43. doi: 10.1016/j.agsy.2017.11.003
Graamans, L., van den Dobbelsteen, M., Meinen, E., and Stanghellini, C. (2017). Plant factories; crop transpiration and energy balance. Agric. Syst. 153, 138–147. doi: 10.1016/j.agsy.2017.01.003
Hwang, Y. J., and Jeong, J. W. (2021). Energy saving potential of radiant floor heating assisted by an air source heat pump in residential buildings. Energies 14:132. doi: 10.3390/en14051321
IEA (2022). Heating. Available at: https://www.iea.org/reports/heating (Accessed March 21, 2023).
IF Technology (2019). Hamerkwartier Amsterdam: bodemenergieplan. Available at: https://openresearch.amsterdam/nl/page/81174/hamerkwartier-interferentiegebied (Accessed March 14, 2023).
Jans-Singh, M., Ward, R., and Choudhary, R. (2021). Co-simulating a greenhouse in a building to quantify co-benefits of different coupled configurations. J. Build. Perform. Simul. 14, 247–276. doi: 10.1080/19401493.2021.1908426
Jin, W., Lopez, D. F., Heuvelink, E., and Marcelis, L. F. M. (2021). Light use efficiency of lettuce cultivation in vertical farms compared with greenhouse and field. Food Energy Secur. 12, 1–10. doi: 10.1002/fes3.391
Jurgilevich, A., Birge, T., Kentala-Lehtonen, J., Korhonen-Kurki, K., Pietikäinen, J., Saikku, L., et al. (2016). Transition towards circular economy in the food system. Sustainability 8, 1–14. doi: 10.3390.su8010069
Kalantari, F., Tahir, O. M., Joni, R. A., and Fatemi, E. (2017). Opportunities and challenges in sustainability of vertical farming: a review. J. Landsc. Ecol. 11, 35–60. doi: 10.1515/jlecol-2017-0016
Koppejan, J. (2016). Inventarisatie van markttoepassingen van biomassaketels en bio-wkk. Available at: https://www.rvo.nl/sites/default/files/2017/04/Rapportage-Marktkansen-bioketels.pdf (Accessed September 23, 2022).
Kozai, T., and Niu, G. (2020). “Role of the plant factory with artificial light (PFAL) in urban areas” in Plant factory: An indoor vertical farming system for efficient quality food production. eds. T. Kozia, M. Takagaki, and G. Niu (London: Academic Press), 129–140.
Kozai, T., Ohyama, K., and Chun, C. (2006). Commercialized closed systems with artificial lighting for plant production. Acta Hortic. 711, 61–70. doi: 10.17660/actahortic.2006.711.5
KWA (2016). Het elektrisch energieverbruik en het warmteaanbod van koelinstallaties voor een veertigtal bedrijfssectoren. RVO, The Hague.
Ledesma, G., Nikolic, J., and Pons-Valladares, O. (2022). Co-simulation for thermodynamic coupling of crops in buildings. Case study of free-running schools in Quito, Ecuador. Buid. Environ. 207:108407. doi: 10.1016/j.buildenv.2021.108407
Maivel, M., and Kurnitski, J. (2015). Heating system return temperature efficiency effect on heat pump performance. Energy Build. 94, 71–79. doi: 10.1016/j.enbuild.2015.02.048
Marchi, B., Zanoni, S., and Pasetti, M. (2018). Industrial symbiosis for greener horticulture practices: the CO2 enrichment from energy intensive industrial processes. Procedia CIRP 2018, 562–567. doi: 10.1016/j.procir.2017.11.117
Martin, M., Poulikidou, S., and Molin, E. (2019). Exploring the environmental performance of urban symbiosis for vertical hydroponic farming. Sustainability 11:6724. doi: 10.3390/su11236724
Martin, M., Weidner, T., and Gullström, C. (2022). Estimating the potential of building integration and regional synergies to improve the environmental performance of urban vertical farming. Front. Sustain. Food Sys. 6:849304. doi: 10.3389/fsufs.2022.849304
Matysiak, B., Ropelewska, E., Wrzodak, A., Kowalski, A., and Kaniszewski, S. (2022). Yield and quality of romaine lettuce at different daily light integral in an indoor controlled environment. Agronomy 12:1026. doi: 10.3390/agronomy12051026
Muñoz-Liesa, J., Royapoor, M., Cuerva, E., Gassó-Domingo, S., Gabarrell, X., and Josa, A. (2022). Building-integrated greenhouses raise energy co-benefits through active ventilation systems. Build. Environ. 208:108585. doi: 10.1016/j.buildenv.2021.108585
Muñoz-Liesa, J., Royapoor, M., López-Capel, E., Cuerva, E., Rufí-Salís, M., Gassó-Domingo, S., et al. (2020). Quantifying energy symbiosis of building-integrated agriculture in a mediterranean rooftop greenhouse. Renew. Energy 156, 696–709. doi: 10.1016/j.renene.2020.04.098
Pesch, H., and Louw, L. (2023). Evaluating the economic feasibility of plant factory scenarios that produce biomass for biorefining processes. Sustainability 15:1324. doi: 10.3390/su15021324
RVO (2022). Energielabel woningen naar woningtype, 1 januari 2020. Available at: www.clo.nl/nl055608 (Accessed July 18, 2023).
RVO (2023). Energielabel C kantoren. Available at: https://www.rvo.nl/onderwerpen/wetten-en-regels-gebouwen/energielabel-c-kantoren (Accessed July 18, 2023).
Sanjuan-Delmás, D., Llorach-Massana, P., Nadal, A., Ercilla-Montserrat, M., Munoz, P., Montero, J. I., et al. (2018). Environmental assessment of an integrated rooftop greenhouse for food production in cities. J. Clean. Prod. 177, 326–337. doi: 10.1016/j.jclepro.2017.12.147
Shao, Y., Li, J., Zhou, Z., Hu, Z., Zhang, F., and Cui, Y. (2021). The effects of vertical farming on indoor carbon dioxide concentration and fresh air energy consumption in office buildings. Build. Environ. 195:107766. doi: 10.1016/j.buildenv.2021.107766
Sipma, J. M. (2019). Het daadwerkelijk energieverbruik van gelabelde en niet-gelabelde restaurants. Available at: www.tno.nl (Accessed February 28, 2022).
Stimular (2022). Gemiddelde milieubelasting zwembaden. Available at: www.milieubarometer.nl (Accessed March 02, 2023).
Thomaier, S., Specht, K., Henckel, D., Dierich, A., Siebert, R., Freisinger, U., et al. (2014). Farming in and on urban buildings: present practice and specific novelties of zero-acreage farming (ZFarming). Renew. Agric. Food Syst. 30, 43–54. doi: 10.1017/S1742170514000143
van Delden, S. H., SharathKumar, M., Butturini, M., Graamans, L. J. A., Heuvelink, E., Kacira, M., et al. (2021). Current status and future challenges in implementing and upscaling vertical farming systems. Nat. Food. 2, 944–956. doi: 10.1038/s43016-021-00402-w
van den Brom, P., Meijer, A., and Visscher, H. (2018). Performance gaps in energy consumption: household groups and building characteristics. Build. Res. Inf. 46, 54–70. doi: 10.1080/09613218.2017.1312897
van den Dobbelsteen, A., Tillie, N., Kürschner, J., Mantel, B., and Hakvoort, L. (2011). The Amsterdam guide to energetic urban planning. Management and innovation for a sustainable built environment; MISBE 2011, (June 20-23) CIB international conference, Amsterdam.
Vernay, A. L., Salcedo Rahola, T. B., and Ravesteijn, W. (2010). Growing food, feeding change: towards a holistic and dynamic approach of eco-city planning. Next generation infrastructure systems for eco-cities, Shenzhen. 1-6. doi: 10.1109/INFRA.2010.5679234
Weidner, T., Yang, A., and Hamm, M. W. (2021). Energy optimisation of plant factories and greenhouses for different climatic conditions. Energy Convers. Manag. 243:114336. doi: 10.1016/j.enconman.2021.114336
Wielemaker, R. C., Weijma, J., and Zeeman, G. (2018). Harvest to harvest: recovering nutrients with new sanitation systems for reuse in urban agriculture. Resour. Conv. Recycl. 128, 426–437. doi: 10.1016/j.resconrec.2016.09.015
World Green Building Council (2019). Bringin embodied carbon upfront: coordinated action for building and construction sector to tackle embodied carbon. Available at: www.worldgbc.org (Accessed July 06, 2023).
Keywords: controlled environment agriculture, building-integrated agriculture, resource synergies, symbiosis, urban agriculture
Citation: Blom T, Jenkins A and van den Dobbelsteen A (2023) Synergetic integration of vertical farms and buildings: reducing the use of energy, water, and nutrients. Front. Sustain. Food Syst. 7:1227672. doi: 10.3389/fsufs.2023.1227672
Edited by:
Michael Martin, Swedish Environmental Research Institute (IVL), SwedenReviewed by:
Joan Muñoz-Liesa, Autonomous University of Barcelona, SpainSusana Toboso-Chavero, Autonomous University of Barcelona, Spain
Copyright © 2023 Blom, Jenkins and van den Dobbelsteen. This is an open-access article distributed under the terms of the Creative Commons Attribution License (CC BY). The use, distribution or reproduction in other forums is permitted, provided the original author(s) and the copyright owner(s) are credited and that the original publication in this journal is cited, in accordance with accepted academic practice. No use, distribution or reproduction is permitted which does not comply with these terms.
*Correspondence: Tess Blom, dC5ibG9tQHR1ZGVsZnQubmw=