- 1Wageningen Economic Research, Wageningen University & Research, Wageningen, Netherlands
- 2Animal Sciences Department, Emerging Pathogens Institute, Global Food Systems Institute, University of Florida, Gainesville, FL, United States
Introduction: Foodborne diseases (FBD) are a significant problem in low- and middle-income countries, especially in Africa. Country-specific estimates of the economic costs related to FBD caused by different hazards in different food products can inform decision makers about this problem’s magnitude. This aids policy makers in prioritising actions to mitigate risks and prevent illness. Although estimates exist for many high-income countries, they are lacking for African countries.
Methods: This study estimates economic cost in Burkina Faso and Ethiopia related to FBD caused by non-typhoidal Salmonella enterica (NTS), Campylobacter spp. (CAMP) and enterotoxigenic Escherichia coli (ETEC) in all foods, chicken meat and tomatoes. The World Health Organization’s estimates of FBD burden, updated from 2010 to 2017, were used as a basis. Economic cost estimates were the sum of estimates of willingness-to-pay (WTP) to reduce risk of death and of pain and suffering, and lost productivity. WTP was based on value of statistical life (VSL) and value of statistical life year (VSLY), extrapolated from USA data. We used sensitivity options to account for uncertainty in these values.
Results: Mean economic costs related to FBD caused by NTS, CAMP and ETEC in 2017 were estimated at 391 million constant 2017 international dollars in Burkina Faso and 723 million in Ethiopia. These represent 3.0% of gross national income in Burkina Faso and 0.9% in Ethiopia. Lost productivity contributed 70%, WTP to reduce risk of death 30%, and WTP to reduce risk of pain and suffering 1-2%. NTS caused the highest costs, followed by ETEC and CAMP. Chicken meat caused 9-12 times higher costs than tomatoes. Children under five years (14.6-17.1% of populations) bore 20-75% of the costs. Due to uncertainty in disease burden and economic data, costs could be four times higher than mean estimates.
Discussion: Policies to control FBD likely result in substantial benefits, especially efforts aiming at this study’s hazards in chicken meat and children under 5 years. Efforts to reduce uncertainty in VSL, VSLY and disease burden estimates, estimate costs for other countries, attribute costs to other food products and hazards, further standardise estimation methodologies, and estimate treatment costs and illness prevention expenditures are recommended.
1. Introduction
Globally, foodborne diseases (FBD) result in a significant public health impact with an estimated 600 million cases of FBD and 420,000 deaths in 2010 (Havelaar et al., 2015). Low- and middle-income countries (LMIC) were affected relatively more than high-income countries with 230,000 deaths due to foodborne hazards causing diarrheal disease (Havelaar et al., 2015). The World Bank estimated annual costs due to productivity losses associated with FBD in LMICs at 95.2 billion United States Dollars (USD) in 2018 (Jaffee et al., 2019). The high public health burden and costs associated with FBD in LMIC suggest that even modest food safety improvements can be attractive from a public policy perspective. The greatest per capita costs of FBD occurred in Africa (Havelaar et al., 2015). The World Bank estimated costs due to productivity losses related to FBD in Sub-Saharan Africa countries at 16.7 billion USD, between 1.5% and 6.0% of the food expenditure depending on the country (Jaffee et al., 2019). The public health burden differs between foodborne hazards, food products and countries because of differences in consumption and food preparation practices (Havelaar et al., 2015). Country-specific estimates of the economic costs related FBD due to different foodborne hazards in different food products can inform decision makers in African countries about the magnitude of the problem. This can aid policy makers in their decision making about priorities in policies to mitigate risks and prevent illness in their country.
Only a few studies, almost all published in not peer-reviewed journals, provided estimates of the economic costs related to FBD on the African continent. Most addressed all hazards and all foods and did not attribute to a hazard or food product. Examples include the studies by Jaffee et al. (2019) in all Sub-Saharan countries, by Hoffmann and Baral (2019) in Kenya, and by Grace et al. (2018) in Burkina Faso, Nigeria, Ethiopia, and Sub-Saharan Africa. The study by ILRI (2011) estimated productivity losses in Nigeria due to foodborne diarrhoea attributed to all foods and also separately to beef. The study by Van Wagenberg et al. (2022) estimated costs related to FBD due to Campylobacter spp. (CAMP), enterotoxigenic Escherichia coli (ETEC) and non-typhoidal Salmonella enterica (NTS) in Ethiopia, but only included patient-related medical treatment costs and (in)direct non-medical costs. Thus, data about the economic costs related to FBD due to specific foodborne hazards in specific food products is lacking for African countries. Furthermore, different studies used different methods to value morbidity and mortality, hampering comparison of results. This study aims to help fill this gap by providing estimates of the economic costs related to different FBD hazards in specific food products. Hazards and food products were selected by the project “Urban Food Markets in Africa – incentivizing food safety (Pull-Push Project)” in Burkina Faso and Ethiopia1: CAMP and NTS in chicken meat and ETEC and NTS in tomatoes. These countries represent two subregions in Africa as defined by the World Health Organization (WHO) Foodborne Disease Burden Epidemiology Reference Group (FERG) based on infant and adult mortality (Devleesschauwer et al., 2015): Burkina Faso was assigned to the AFRD subregion (high child and high adult mortality) and Ethiopia to the AFRE subregion (high child and very high adult mortality). The project partners selected the foods and hazards while designing the study based on the results from Havelaar et al. (2015) and specific concerns in the target countries [for details, see Sapp et al. (2022)].
2. Materials and methods
2.1. Approach for estimating economic costs of FBD
Estimates of the economic costs of FBD consist of the sum of estimates of: (1) willingness to pay (WTP) to reduce risk of death, (2) WTP to reduce risk of pain and suffering, (3) productivity losses, (4) medical treatment costs, and (5) individual expenditures on illness prevention (Harrington and Portney, 1987). In our study, we estimated the economic costs associated with WTP to reduce risk of death, WTP to reduce risk of pain and suffering, and productivity losses. Economic cost estimates are for 2017, because we used disease burden data of 2017. Cost estimates are presented in constant 2017 international dollars (Int$2017), using purchasing power parity (PPP) exchange rates.
2.2. Willingness to pay to reduce risk of death
Following the guidelines in Robinson et al. (2019a) and the application in Robinson et al. (2019b), we estimated WTP to reduce the risk of death (WTP_death) by multiplying the number of deaths per year (Mortality) with the value of a statistical life (VSL):
The VSL is an individual’s marginal rate of substitution between wealth and the risk of dying in a defined time period based on WTP (Robinson et al., 2019b). Because no reliable estimates of the VSL related to FBD were available for Burkina Faso and Ethiopia, we estimated the VSL in these countries using the benefit transfer methodology (Hammitt and Robinson, 2011; Robinson et al., 2019b):
VSLtarget is the VSL in a target country (Burkina Faso, Ethiopia) and VSLbase is the VSL in a base country in which the VSL is known (the USA in our study). GNI per capita in PPPtarget and GNI per capita in PPPbase are gross national income (GNI) per capita in PPP in the target and base country, respectively. Finally, elasticity is the income elasticity of the WTP to reduce the risk of death with respect to income in the target country compared to the base country. In 2017, GNI per capita in PPP in Burkina Faso, Ethiopia and the USA were 1,967.63, 2,009.56 and 61,186.46 Int$2017, respectively. The income elasticity represents the share in income an individual in the target country is willing to pay to reduce the risk of death compared to this share in the base country. At an income elasticity of 0.0, an individual in the target country is willing to spend an equal amount of his/her income as an individual in the base country to create a similar reduction in risk. At an income elasticity of 1.0, an individual in the target country is willing to pay an equal fraction of his/her income as an individual in the base country. An income elasticity of greater than 1.0 implies a willingness to spend a lower fraction of the income in the target country than in the base country. This last may be reasonable in extrapolations from high-income countries, such as the USA, to low-income countries (Robinson et al., 2019b). For Burkina Faso and Ethiopia, we could not find an accurate value of income elasticity. In such a case, Robinson et al. (2019b) suggested to use scenario analysis with an elasticity of 1.5 in a baseline scenario and of 1.0 in a sensitivity analysis. We added an option with an elasticity of 1.2 in a sensitivity analysis to accommodate for the gap between elasticities of 1.0 and 1.5. Robinson et al. (2019b) also suggested to use a VSL to GNI per capita ratio of 160, as used in the USA, to estimate the value of VSLbase in the baseline scenario, and a VSL to GNI per capita ratio of 100, as applied by the OECD, in a sensitivity analysis. A ratio of 160 resulted in a value of VSLUSA in 2017 of 6.1 million Int$2017 and a ratio of 100 in 9.3 million Int$2017. Based on this, we applied three sensitivity options in our analysis in addition to the baseline scenario (income elasticity of 1.5 and a VSLUSA to GNI per capita in PPPUSA ratio of 160):
• Sensitivity option (a): Income elasticity of 1.2 and a VSLUSA to GNI per capita in PPPUSA ratio of 160,
• Sensitivity option (b): Income elasticity of 1.0 and a VSLUSA to GNI per capita in PPPUSA ratio of 160,
• Sensitivity option (c): Income elasticity of 1.0 and a VSLUSA to GNI per capita in PPPUSA ratio of 100.
Table 1 provides the VSL estimates in Burkina Faso and Ethiopia for the baseline scenario and three sensitivity options.

Table 1. Estimates of value of a statistical life (VSL) and value of a statistical life year (VSLY) for Burkina Faso and Ethiopia for 2017 for the baseline scenario and three sensitivity options (in Int$2017).
2.3. Willingness to pay to reduce risk of pain and suffering
The basic concepts to value nonfatal (morbidity) risk reductions are the same as for mortality risk reductions. To estimate the economic costs related to WTP to reduce the risk of pain and suffering we used the number of years of healthy life lost due to disability (YLD) per year (Robinson et al., 2019a). We are not aware of studies with sound estimates of the WTP to reduce the risk of pain and suffering due to FBD. In such a case, Robinson et al. (2019a) suggested to use a constant value of a statistical life year (VSLY) to approximate the WTP to reduce the risk of pain and suffering. Using VSLY to value morbidity means we value morbidity the same as mortality. In studies on economic costs of the health burden from air pollution, the value of morbidity ranged from 10 to 100% of the value of mortality (Narain and Sall, 2016). We argue that using VSLY is acceptable in our case, because the metric YLD is the equivalent of one full year of healthy life lost due to disability or ill-health and includes a disability weight. This weight scales each disability or ill-health outcome between 0 and 1, where 0 is perfect health and 1 is a disability considered as bad as dying. We therefore estimated the WTP to reduce the risk of pain and suffering (WTP_pain/suffering) as:
The VSLY was estimated by dividing the VSL by the age equal to half of the life expectancy at birth (Robinson et al., 2019b). Because VSLY is based on VSL, we distinguished a baseline scenario and three sensitivity options for the estimates of a VSLY for Burkina Faso and Ethiopia (Table 1).
2.4. Productivity losses
Productivity losses were estimated with the so-called human capital approach. Because we wanted to reflect the real value of money to people in LMIC, we used the GNI per capita in PPP, as used by Grace et al. (2018), rather than the nominal GNI per capita used by The World Bank (Jaffee et al., 2019). We estimated the productivity losses (Prod_loss) by multiplying disability-adjusted life years (DALY) by the GNI per capita in PPP (GNI per capita in PPP):
In 2017, GNI per capita in PPP was 1,967.63 Int$2017 in Burkina Faso and 2,009.56 Int$2017 in Ethiopia (The World Bank database indicator code NY.GNP.PCAP.PP.KD).
2.5. Economic costs calculation method
The economic costs were estimated for each metric (WTP to reduce risk of death, WTP to reduce risk of pain and suffering, and productivity losses) using the mean, median and 95% uncertainty interval (UI) of the disease burden estimates (see section 2.6). This was done for each scenario (baseline, sensitivity options) using the scenario specific values of VSL, VSLY, and GNI per capita in PPP in 2017. Aggregated economic costs in a scenario were the sum of the economic cost estimates of the three metrics in that scenario. The ranges presented in the figures and tables in this study reflect the uncertainty in disease burden. The ranges in the scenario outcomes provide the uncertainty in economic parameters. Calculations were performed in MS Excel.
2.6. Disease burden
Table 2 shows mortality, DALY and YLD data of the total population, persons under five years, and persons of five years or older for Burkina Faso and Ethiopia in 2017 as obtained from Havelaar et al. (2022). These data were updated from the FERG 2010 burden of disease data (Havelaar et al., 2015) using changes in the population size and the trends in incidence and mortality data. The trends in incidence and mortality data were retrieved from the Global Burden of Disease (GBD) study by the Institute for Health Metrics and Evaluation, Seattle, WA, United States. The 95% UI includes the uncertainty in the 2010 FERG data as well as uncertainties in the extrapolation factors from the GBD study. In both countries, NTS resulted in the highest disease burden for the total population in terms of mortality and DALY, followed by ETEC and CAMP. CAMP resulted in the highest YLD, followed by NTS and ETEC. For NTS, in both countries the disease burden in the population of five years or older exceeded that in children under five years, whereas for ETEC this was reverse. For CAMP, in both countries mortality and DALY in the population of five years or older exceeded that in children under five years, but this was reverse for YLD.
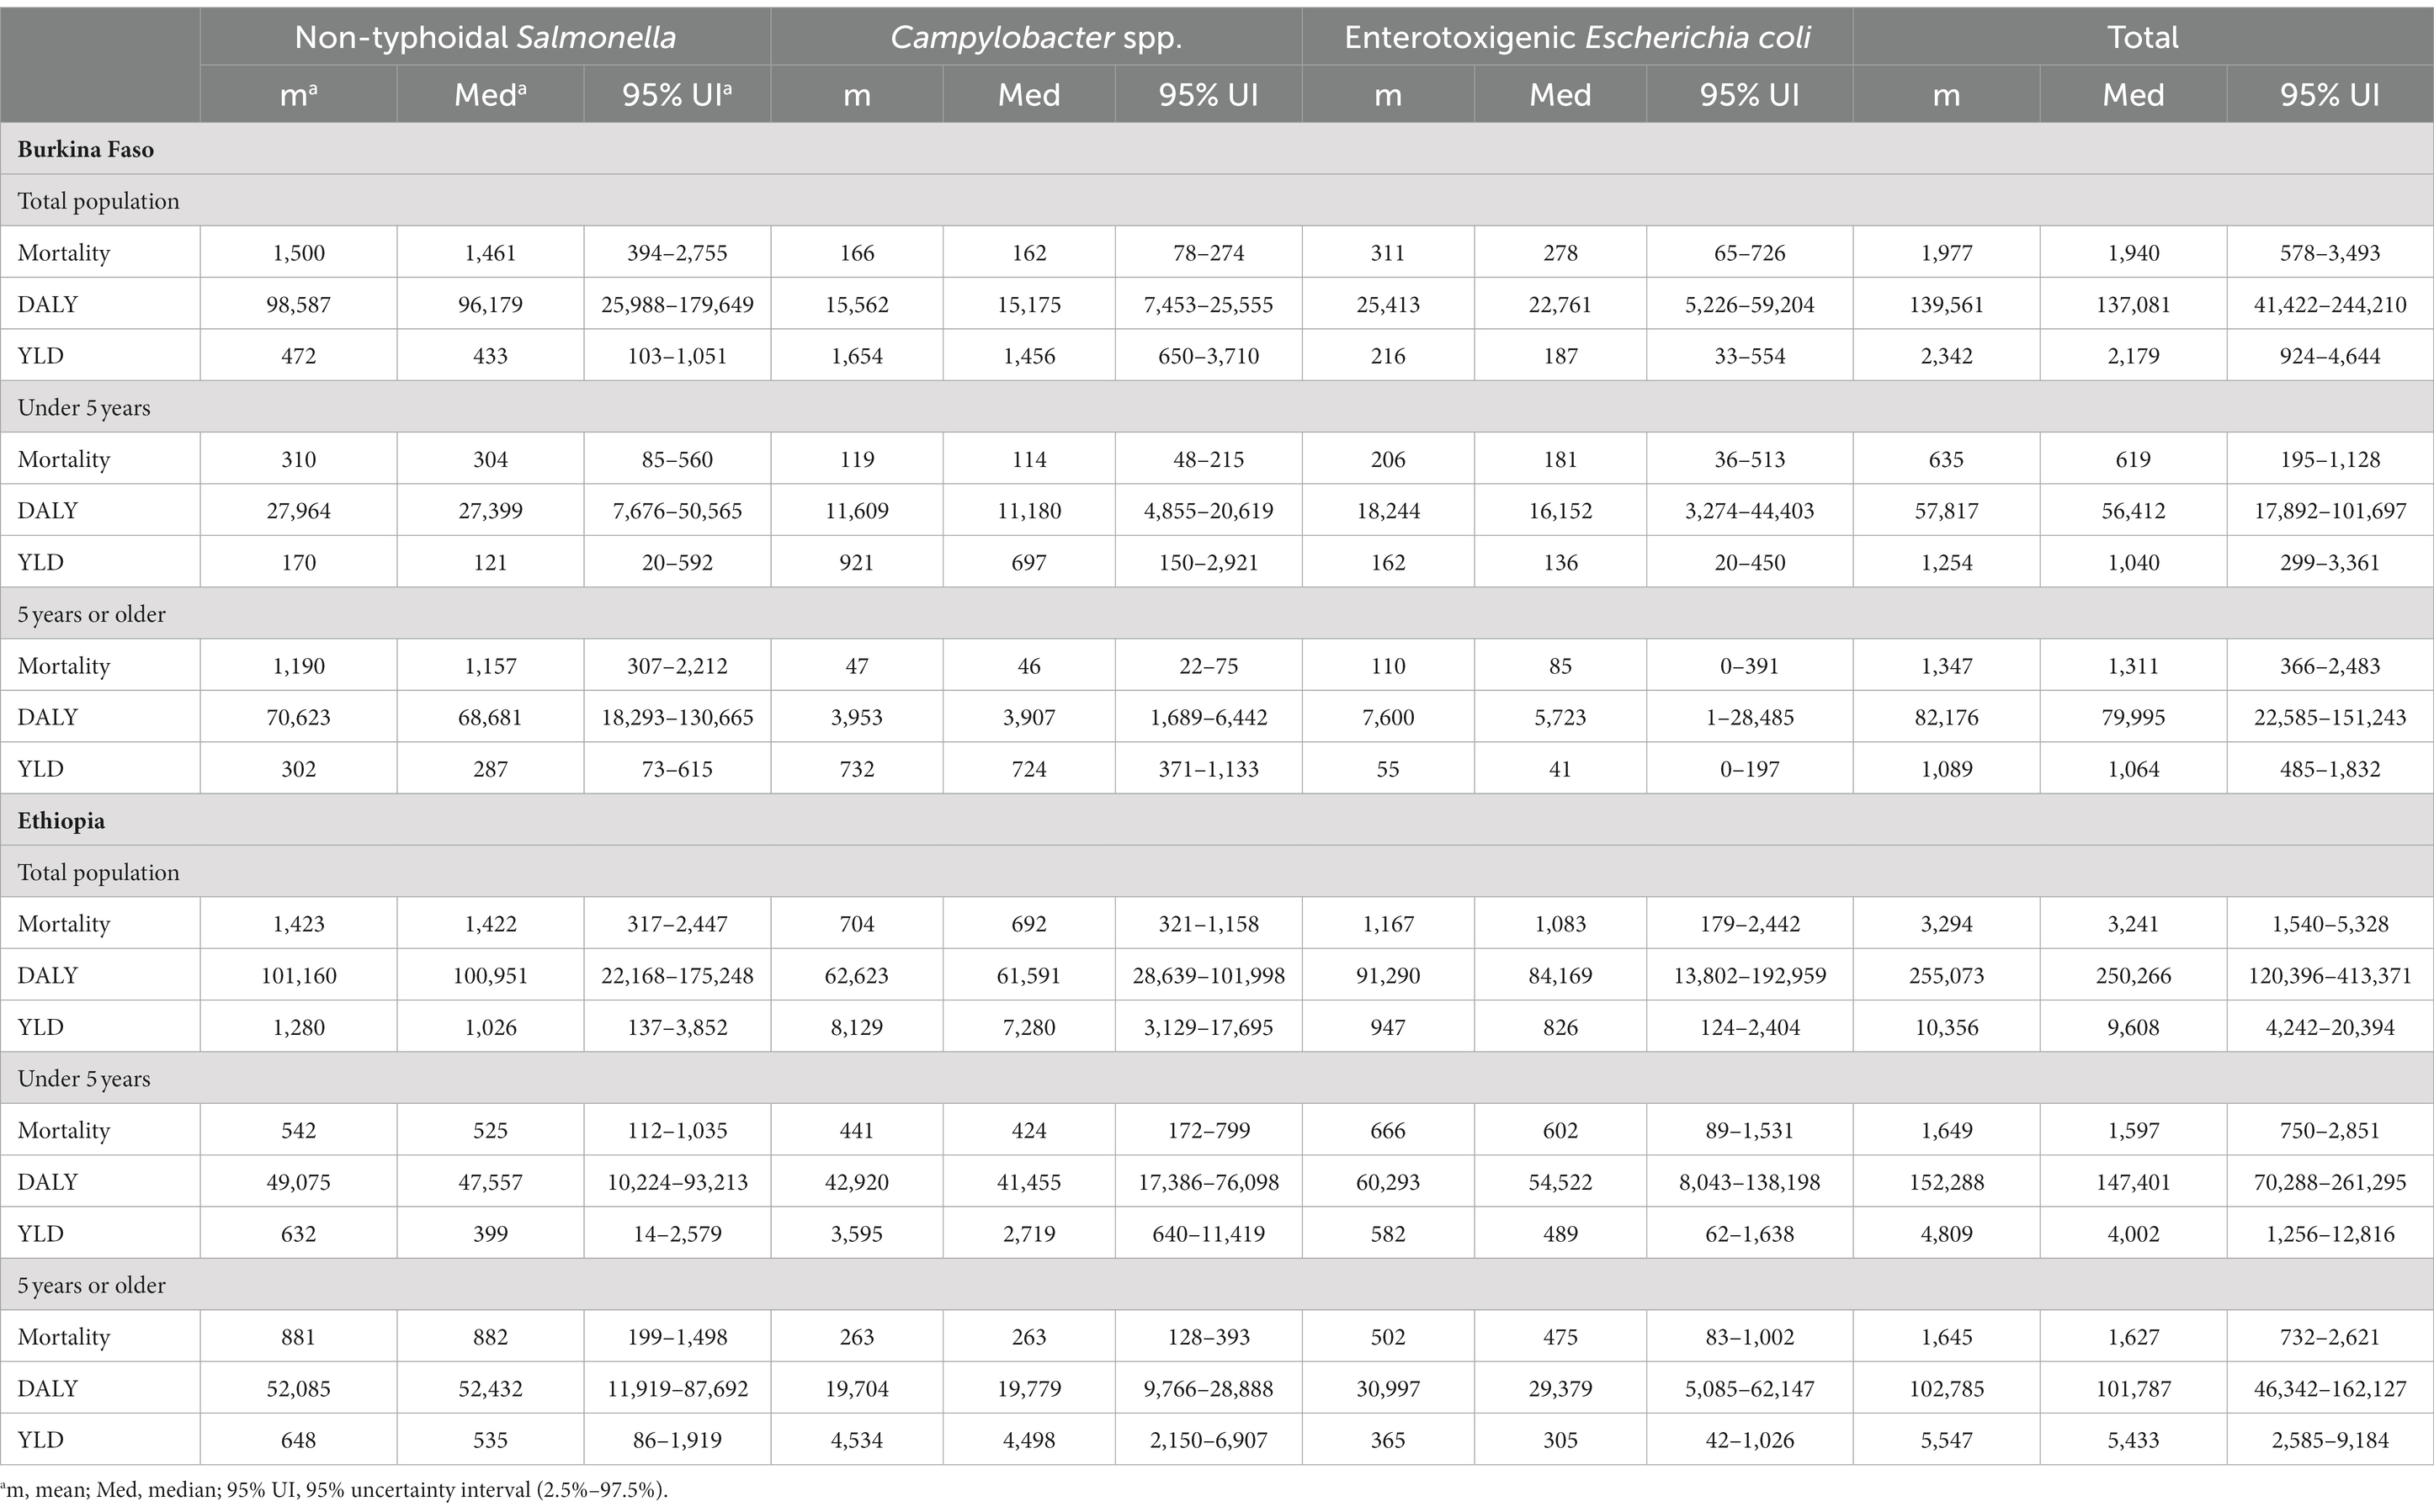
Table 2. Mortality, disability-adjusted life years (DALY) and years of healthy life lost due to disability (YLD) estimates related to foodborne diseases caused by non-typhoidal Salmonella enterica, Campylobacter spp. and enterotoxigenic Escherichia coli in all foods for the total population, persons under five years and persons of five years or older in Burkina Faso and Ethiopia for 2017 (Havelaar et al., 2022).
Table 3 shows the part of the disease burden in Table 2 that was attributed to consumption of chicken meat and of tomatoes. These data were obtained from the WHO and a dedicated Structured Expert Judgement study (Havelaar et al., 2022; Sapp et al., 2022). In Burkina Faso, the disease burden caused by NTS in tomatoes exceeded the disease burden caused by ETEC in tomatoes, whereas in Ethiopia this was reverse. For NTS in chicken meat and tomatoes, in both countries the disease burden in the population of five years or older exceeded the disease burden in children under five years. For CAMP in chicken meat, in both countries the disease burden was higher for children under five years, except for YLD in Ethiopia. For ETEC, in Burkina Faso the disease burden was higher for the population of five years or older, whereas in Ethiopia this was reverse.
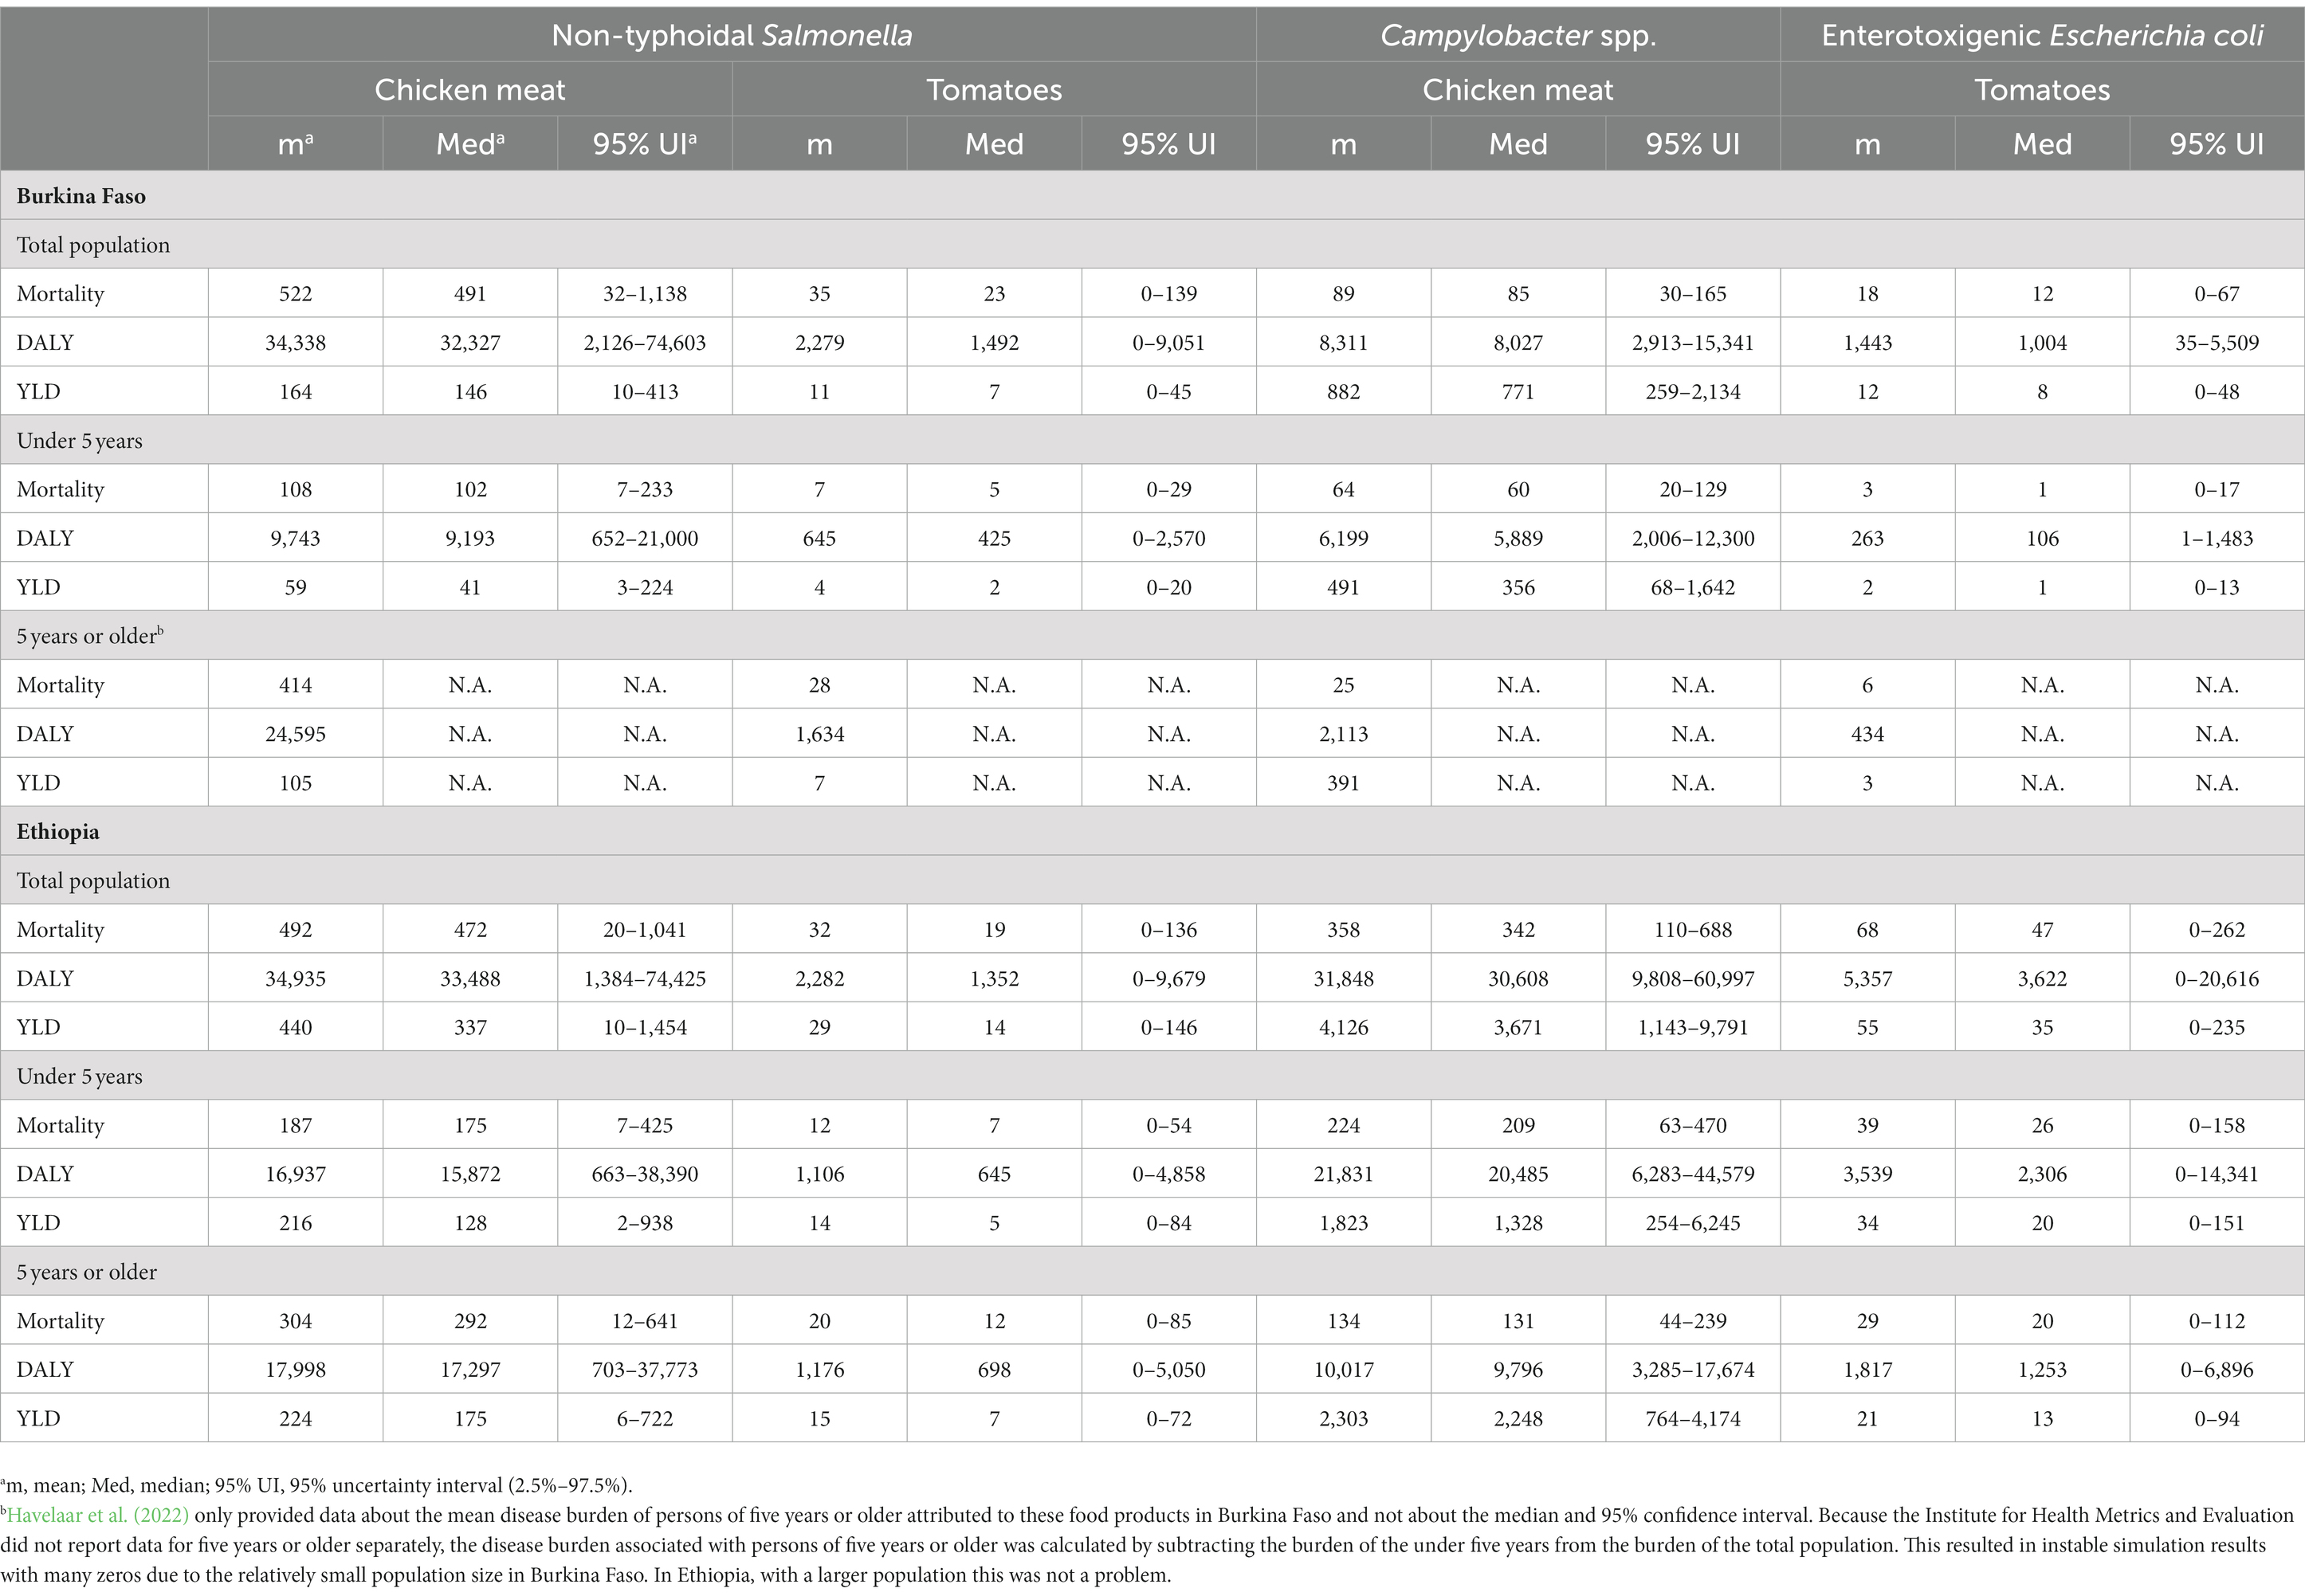
Table 3. Mortality, disability-adjusted life years (DALY) and years of healthy life lost due to disability (YLD) estimates for the total population, persons under five years and persons of five years or older related to foodborne disease caused by non-typhoidal Salmonella enterica, Campylobacter spp. and enterotoxigenic Escherichia coli in chicken meat and tomatoes in Burkina Faso and Ethiopia for 2017 (Havelaar et al., 2022).
3. Results
3.1. Aggregated economic cost estimates over the three hazards
For Burkina Faso in the baseline scenario, aggregated mean economic costs related to FBD caused by NTS, CAMP and ETEC together in all foods in 2017 were estimated at 391 million Int$2017 (Figure 1; Supplementary Table S1 in Supplementary material). These costs were equal to 3.0% of the GNI of 12,948 million Int$2017 in 2017. Productivity losses were 275 million (70%), WTP to reduce risk of death 112 million (29%), and WTP to reduce risk of pain and suffering 4 million (1%). For Ethiopia, aggregated mean economic costs were estimated at 723 million Int$2017. These costs were equal to 0.9% of GNI of 78,378 million Int$2017 in 2017. Productivity losses were 513 million (71%), WTP to reduce risk of death 192 million (27%), and WTP to reduce risk of pain and suffering 18 million (2%). In both countries, the aggregated economic costs were substantial relative to the size of the national economy. Lost productivity contributed approximately 70% to the cost estimates, WTP to reduce risk of death approximately 30%, and WTP to reduce risk of pain and suffering 1%–2%. Median economic costs estimates were similar to the mean estimates (Supplementary material).
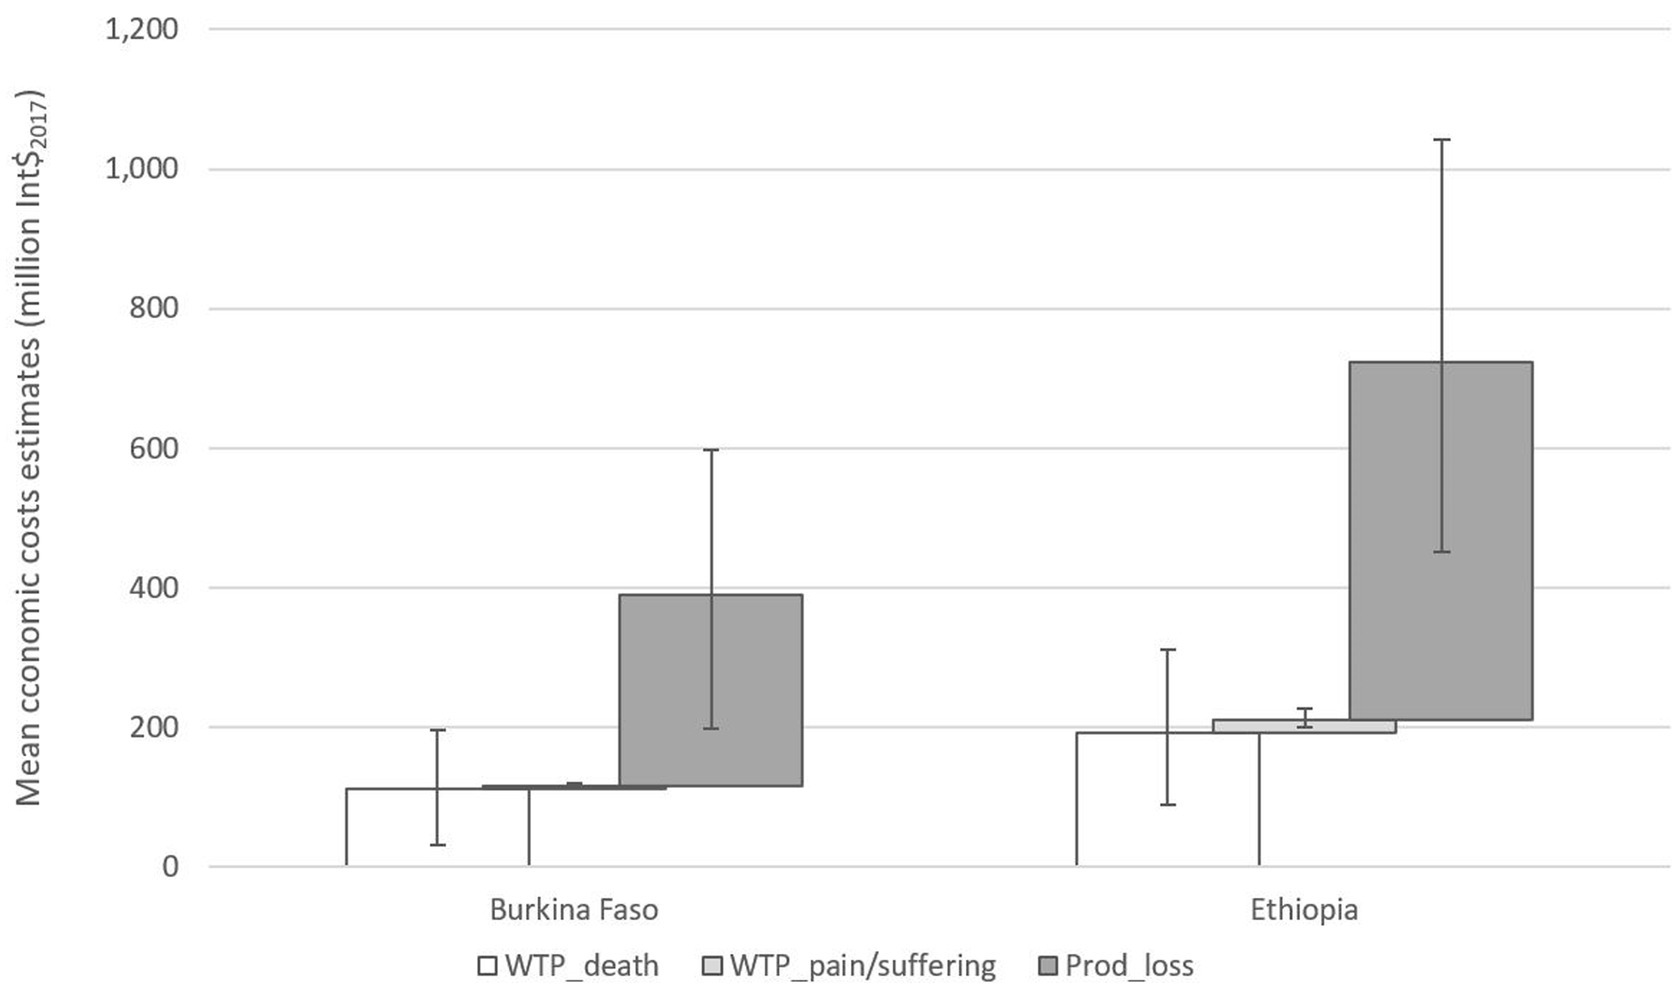
Figure 1. Mean and 95% uncertainty interval (uncertainty in disease burden) of aggregated economic cost estimates (million Int$2017) related to foodborne diseases caused by non-typhoidal Salmonella enterica, Campylobacter spp. and enterotoxigenic Escherichia coli together in all foods for the total population in Burkina Faso and Ethiopia for 2017.
3.2. Economic cost estimates by hazard
In Burkina Faso, NTS caused costs of 280 million Int$2017 (72% of aggregated costs), ETEC 68 million (17%), and CAMP 43 million (11%) (Figure 2; Supplementary Table S1 in Supplementary material). In Ethiopia, NTS caused costs of 288 million Int$2017 (40%), ETEC 253 million (35%), and CAMP 181 million (25%). Cost estimates at the 97.5% percentile of the UI related to uncertainty in the disease burden were approximately 75% higher than the mean estimates in Burkina Faso and 65% higher in Ethiopia.
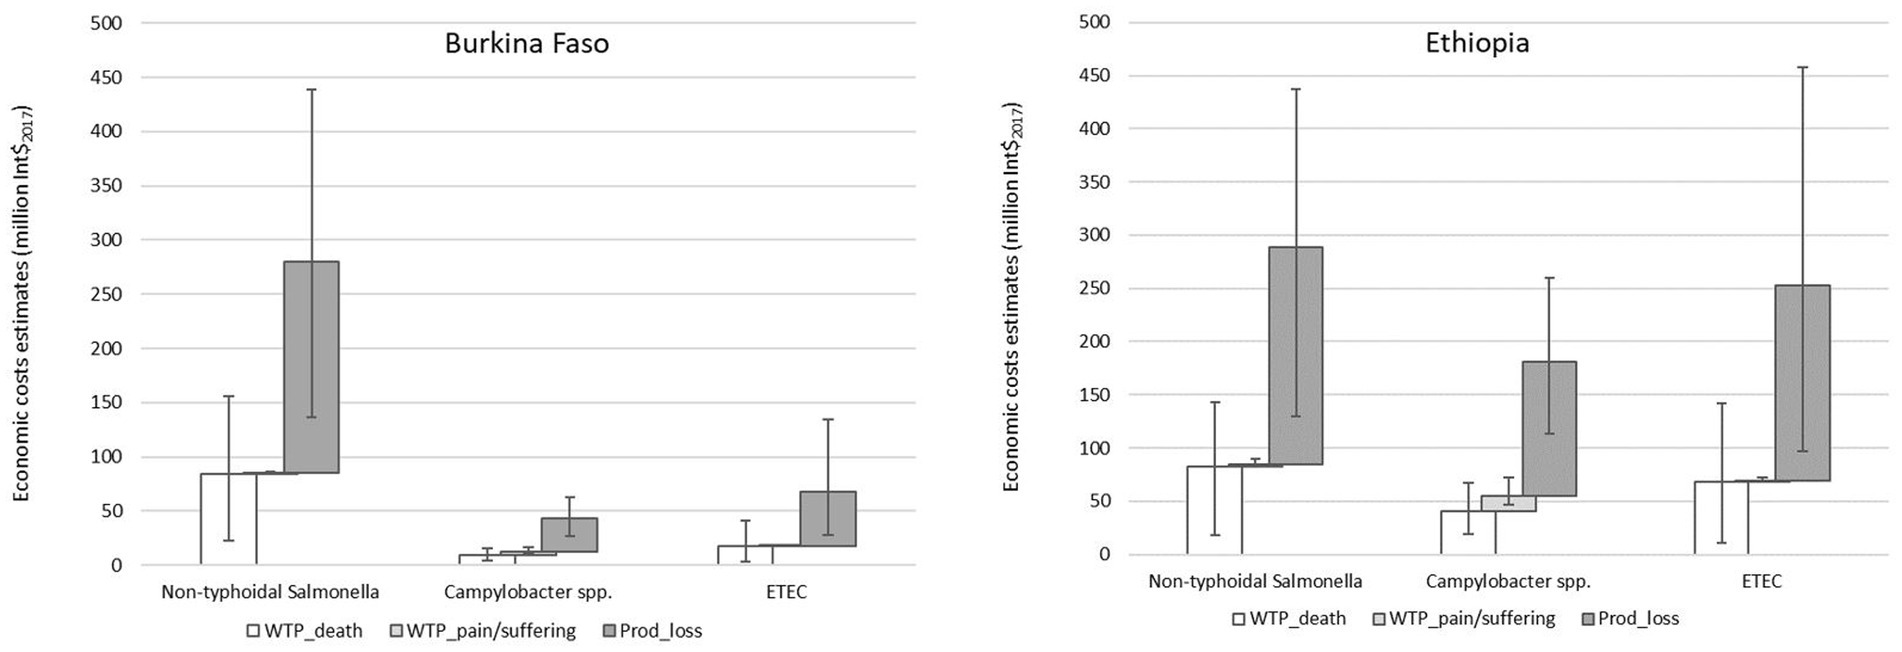
Figure 2. Mean and 95% uncertainty interval (uncertainty in disease burden) of economic cost estimates (million Int$2017) related to foodborne diseases caused by non-typhoidal Salmonella enterica, Campylobacter spp. and enterotoxigenic Escherichia coli (ETEC) in all foods for the total population in Burkina Faso and Ethiopia for 2017.
3.3. Economic cost estimates for chicken meat and tomatoes
In Burkina Faso, mean economic costs related to FBD caused by NTS and CAMP in chicken meat (120 million Int$2017) were twelve times higher than those caused by NTS and ETEC in tomatoes (10 million) (Figure 3; Supplementary Table S2 in Supplementary material). In Ethiopia, costs caused by NTS and CAMP in chicken meat (192 million) were nine times higher than those caused by NTS and ETEC in tomatoes (21 million). Economic costs of chicken meat and tomatoes together were approximately 33% of the economic costs of all foods in Burkina Faso and 29% of those in Ethiopia.
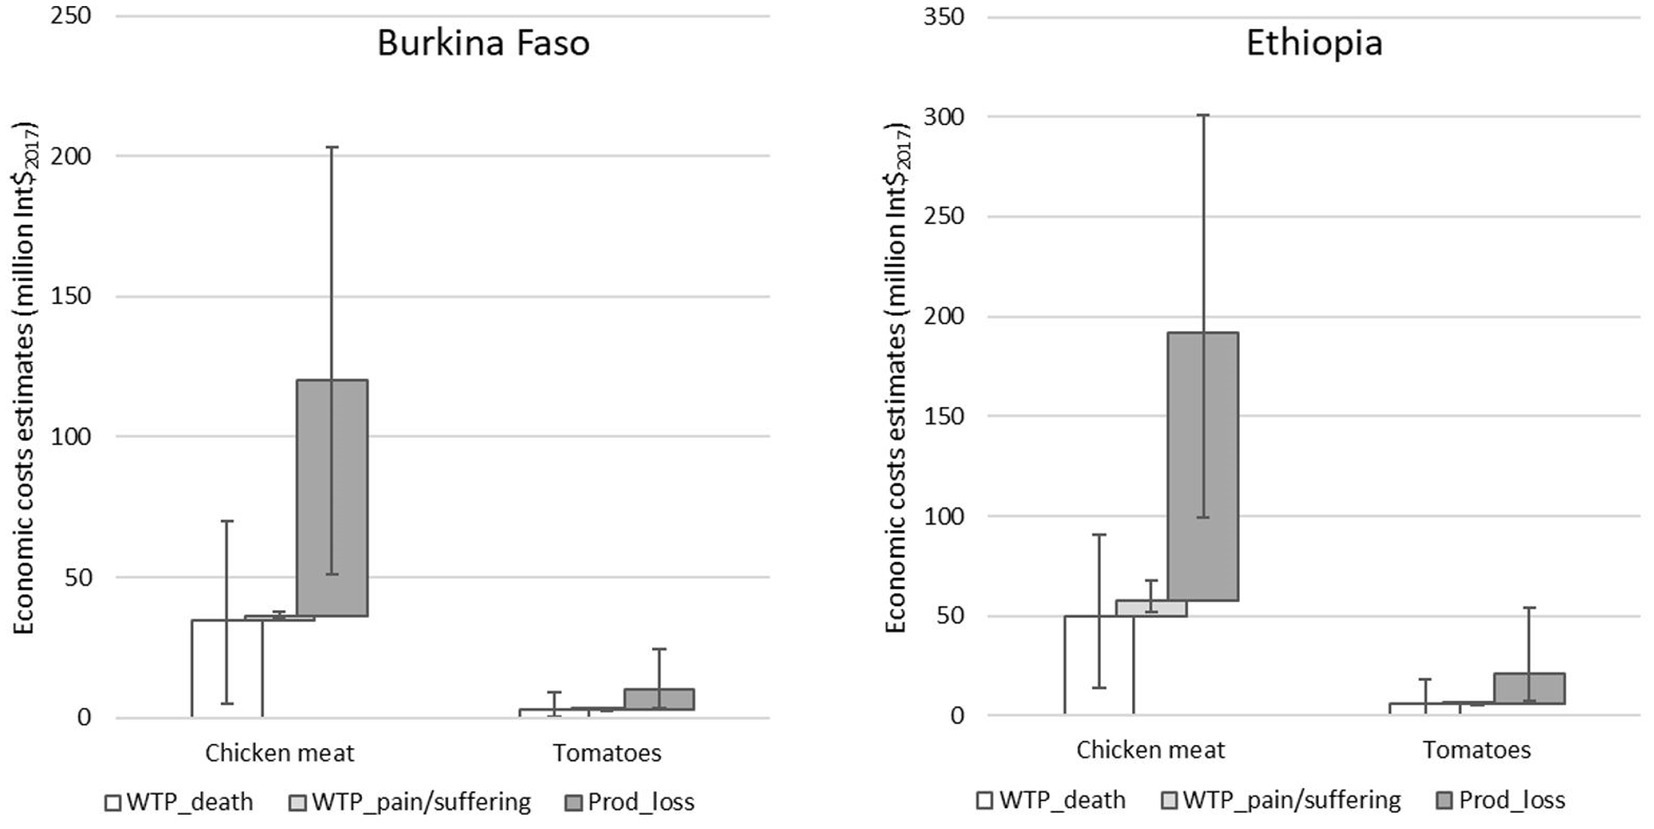
Figure 3. Mean and 95% uncertainty interval (uncertainty in disease burden) of economic cost estimates (million Int$2017) related to foodborne diseases caused by non-typhoidal Salmonella enterica and Campylobacter spp. in chicken meat and non-typhoidal Salmonella enterica and enterotoxigenic Escherichia coli in tomatoes for Burkina Faso and Ethiopia for the total population for 2017.
In Burkina Faso, mean economic costs caused by NTS in chicken meat were 97 million Int$2017, four times the costs of 23 million caused by CAMP in chicken meat (Figure 4; Supplementary Table S2 in Supplementary material). In Ethiopia, the costs caused by NTS in chicken meat were just under 10% higher than the costs caused by CAMP in chicken meat. In both countries, productivity losses contributed most to the costs, followed by the WTP to reduce risk of death. For tomatoes, costs caused by NTS in Burkina Faso were 50% higher than the cost caused by ETEC. In contrast, in Ethiopia these were approximately half of the costs caused by ETEC. In both countries, costs caused by NTS in chicken meat (Figure 4) were 35% of the costs caused by NTS in all foods (Figure 2). For CAMP in chicken meat, this was 53% in Burkina Faso and 51% in Ethiopia. For NTS and ETEC in tomatoes, this was 2% and 6%, respectively, in both countries.
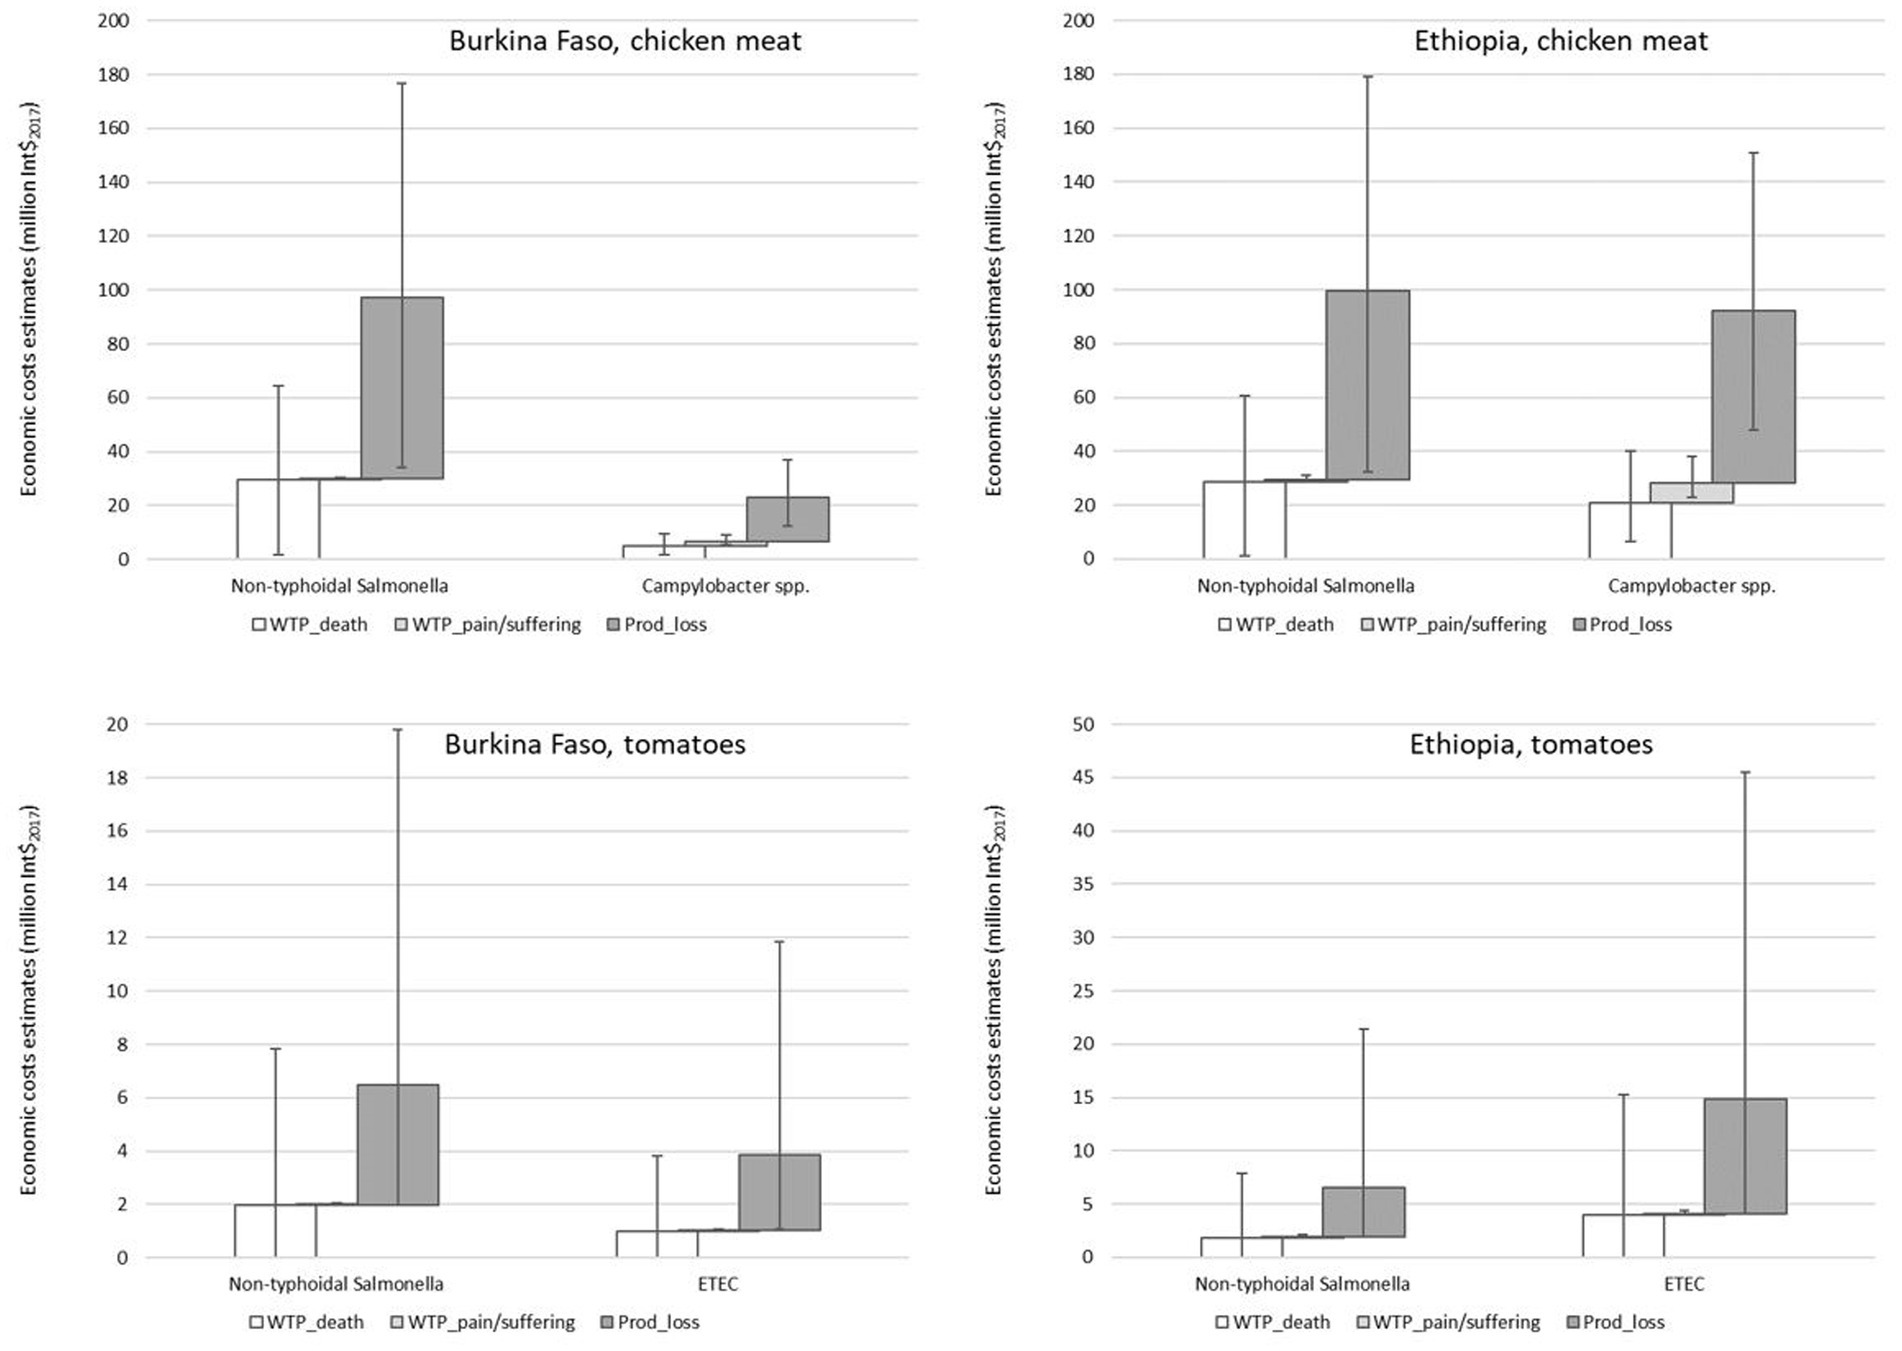
Figure 4. Mean and 95% uncertainty interval (uncertainty in disease burden) of economic cost estimates (million Int$2017) related to foodborne diseases caused by non-typhoidal Salmonella enterica and Campylobacter spp. in chicken meat and non-typhoidal Salmonella enterica and enterotoxigenic Escherichia coli (ETEC) in tomatoes for Burkina Faso and Ethiopia for the total population for 2017.
3.4. Economic cost estimates by age group
Figure 5 (Supplementary Table S3 in Supplementary material) shows that in both countries 20%–75% of the mean economic costs related to FBD caused by CAMP, ETEC and NTS in all foods could be attributed to children under five years. Considering that in 2017 in Burkina Faso 17.1% and in Ethiopia 14.6% of the population was under five years (The World Bank Health nutrition and population statistics), they bore a disproportionally large part of the economic costs.
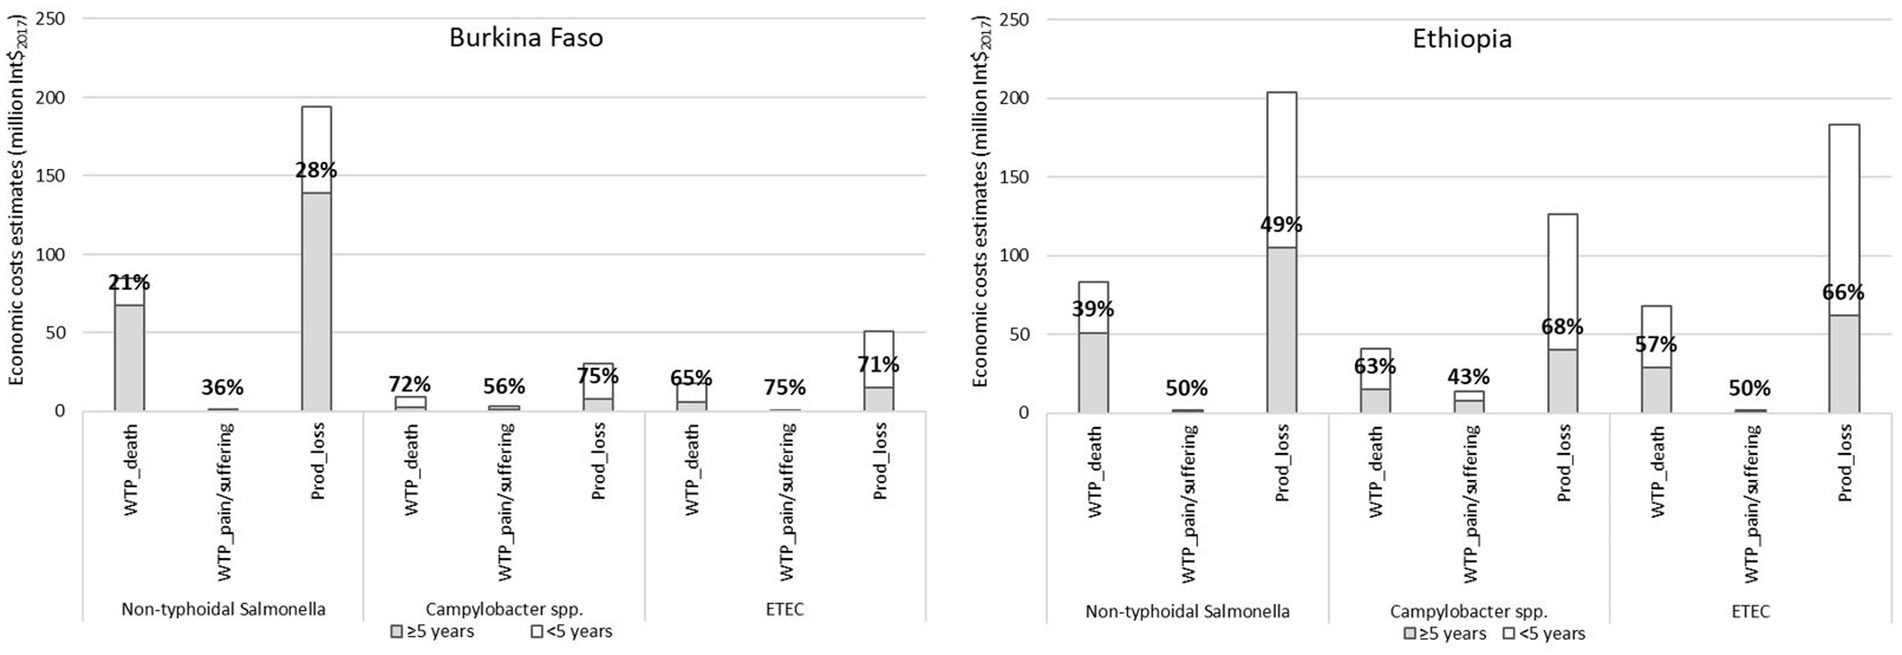
Figure 5. Mean economic cost estimates by age group (<5 years, ≥5 years) in million Int$2017 related to foodborne diseases caused by non-typhoidal Salmonella enterica, Campylobacter spp. and enterotoxigenic Escherichia coli (ETEC) in all foods in Burkina Faso and Ethiopia for 2017 and percentage attributed to under five years.
3.5. Sensitivity analysis
Figure 6 shows that in all sensitivity options the mean aggregated economic cost estimates related to FBD caused by NTS, CAMP, and ETEC together in all foods were higher than in the baseline scenario. Sensitivity option b (income elasticity of 1.0, VSLUSA to GNI per capita in PPPUSA ratio of 160) resulted in the highest costs, approximately 130% higher than the costs in the baseline scenario. Costs in sensitivity option c (income elasticity of 1.0, VSLUSA to GNI per capita in PPPUSA ratio of 100) were 70% higher than in the baseline scenario and those in sensitivity option a (income elasticity of 1.2, VSLUSA to GNI per capita in PPPUSA ratio of 160) 50% higher. The estimates in the sensitivity options were higher, mainly because the estimates for the WTP to reduce the risk of death were higher. Note that productivity losses were the same in all sensitivity options, because these did not depend on VSL or VSLY. The highest cost estimates (sensitivity option b) of 921 million Int$2017 in Burkina Faso and 1,673 million Int$2017 in Ethiopia were equal to 7.1% and 2.1% of the respective 2017 national GNIs. The mean costs related to FBD caused by NTS, CAMP and ETEC in all foods (Figure 7) and by NTS and CAMP in chicken meat and NTS and ETEC in tomatoes (Figure 8) were approximately 50%, 130%, and 70% higher in sensitivity options a, b, and c than in the baseline scenario, respectively. Note that the cost estimates in the sensitivity analysis were based on the mean estimated disease burden. Cost estimates would be higher if the disease burden would be higher than the mean.

Figure 6. Mean aggregated economic cost estimates (million Int$2017) related to foodborne diseases caused by non-typhoidal Salmonella enterica, Campylobacter spp. and enterotoxigenic Escherichia coli together in all foods for the total population in Burkina Faso and Ethiopia for 2017 in the different sensitivity options (baseline: income elasticity = 1.5 and VSLUSA to GNI per capita in PPPUSA ratio = 160; sensitivity option a: income elasticity = 1.2 and VSLUSA to GNI per capita in PPPUSA ratio = 160; sensitivity option b: income elasticity = 1.0 and VSLUSA to GNI per capita in PPPUSA ratio = 160; sensitivity option c: income elasticity = 1.0 and VSLUSA to GNI per capita in PPPUSA ratio = 100. The ECDALY,GNI approach does not have sensitivity options, because it does not use VSL or VSLY).

Figure 7. Mean economic cost estimates (million Int$2017) related to foodborne diseases by non-typhoidal Salmonella enterica, Campylobacter spp. and enterotoxigenic Escherichia coli (ETEC) in all foods for the total population in Burkina Faso and Ethiopia for 2017 in the different sensitivity options (baseline: income elasticity = 1.5 and VSLUSA to GNI per capita in PPPUSA ratio = 160; sensitivity option a: income elasticity = 1.2 and VSLUSA to GNI per capita in PPPUSA ratio = 160; sensitivity option b: income elasticity = 1.0 and VSLUSA to GNI per capita in PPPUSA ratio = 160; sensitivity option c: income elasticity = 1.0 and VSLUSA to GNI per capita in PPPUSA ratio = 100. The ECDALY,GNI approach does not have sensitivity options, because it does not use VSL or VSLY).

Figure 8. Mean economic cost estimates (million Int$2017) related to foodborne diseases caused by non-typhoidal Salmonella enterica, Campylobacter spp. and enterotoxigenic Escherichia coli in chicken meat and tomatoes for the total population in Burkina Faso and Ethiopia for 2017 in the different sensitivity options (baseline: income elasticity = 1.5 and VSLUSA to GNI per capita in PPPUSA ratio = 160; sensitivity option a: income elasticity = 1.2 and VSLUSA to GNI per capita in PPPUSA ratio = 160; sensitivity option b: income elasticity = 1.0 and VSLUSA to GNI per capita in PPPUSA ratio = 160; sensitivity option c: income elasticity = 1.0 and VSLUSA to GNI per capita in PPPUSA ratio = 100. The ECDALY,GNI approach does not have sensitivity options, because it does not use VSL or VSLY).
4. Discussion
We estimated the economic costs (sum of estimates of WTP to reduce risk of death, WTP to reduce risk of pain and suffering, and productivity losses) related to FBD caused by NTS, CAMP and ETEC together in 2017 at 391 million Int$2017 (3.0% of GNI) in Burkina Faso and 723 million (0.9% of GNI) in Ethiopia. Comparison of these results with those of other studies is hampered by differences in the base year, food product, hazard, elements included in the economic costs (e.g., nominal GNI or GNI in PPP), and metrics to estimate the cost (Table 4). To assess whether results of our study have the same order of magnitude as other studies, correction factors might be used for such differences. For example, correcting for development in disease burden and economy between two years can make results of different base years comparable. A correction factor based on the disease burden caused by the hazards included in a study could make the results of our study, in which we only accounted for three hazards, comparable to results of other studies that considered all hazards causing FBD relevant for the country/region. Based on results from FERG for 2010 [Table 4 in Havelaar et al. (2015)], the disease burden caused by our study’s three hazards in the AFRD subregion (which includes Burkina Faso) was 2.08 million DALY, approximately 40% of the total burden of 5.11 million DALY. In the AFRE subregion (which includes Ethiopia), this was approximately 30% (1.64 out of 5.26 million DALY). Hence, multiplying our estimates with a factor of 2.5 (1/0.4) for Burkina Faso and 3.3 (1/0.3) for Ethiopia would provide an approximate estimate of the costs of all hazards causing FBD in these countries. If applied methodologies, such as the elements and metrics used to estimate the costs, differ between studies, application of this alternative methodology can be used to compare the results. However, differences in results between the methodologies will remain. Therefore, we recommend efforts to further standardise methodologies. Table 4 compares the results of our study with those of other studies estimating economic costs related to FBD in Burkina Faso and Ethiopia. Estimated productivity losses in the study of Jaffee et al. (2019) were lower than our estimate in Burkina Faso and slightly higher than our estimate in Ethiopia. This was mainly because we used GNI in PPP rather than nominal GNI to reflect the real value of money to people in LMIC. With 2017 nominal GNI per capita (The World Bank database indicator code NY.GNP.PCAP.CD) our estimates of productivity losses would be 60%–70% lower at 94 million USD in Burkina Faso and 189 million USD in Ethiopia. Also taking differences in disease burden base year (2010 vs. 2017) and number of hazards (all vs. NTS, CAMP and ETEC) into account, estimates of productivity losses were in the same order of magnitude. Estimated productivity losses in the study of Grace et al. (2018) were in the same order of magnitude as our estimates in both countries, even though they included all hazards. Correcting for the number of included hazards, our estimates are higher. This can mostly be explained by differences in the disease burden between 2010 and 2017 and the economic growth in this period. The estimates of the WTP to reduce risk of death in the study of Grace et al. (2018) were higher than our estimates. This is mainly because they used a larger value of a VSL in Burkina Faso (640,000 USD compared to this study 56,456 Int$2017) and included all hazards in both countries. For each hazard in our study, the study of Van Wagenberg et al. (2022) estimated lower productivity losses than in our study. This is because they only included part of the (in)direct non-medical costs (for example, lost income was only included for diarrhoea and not for more severe sequalae).
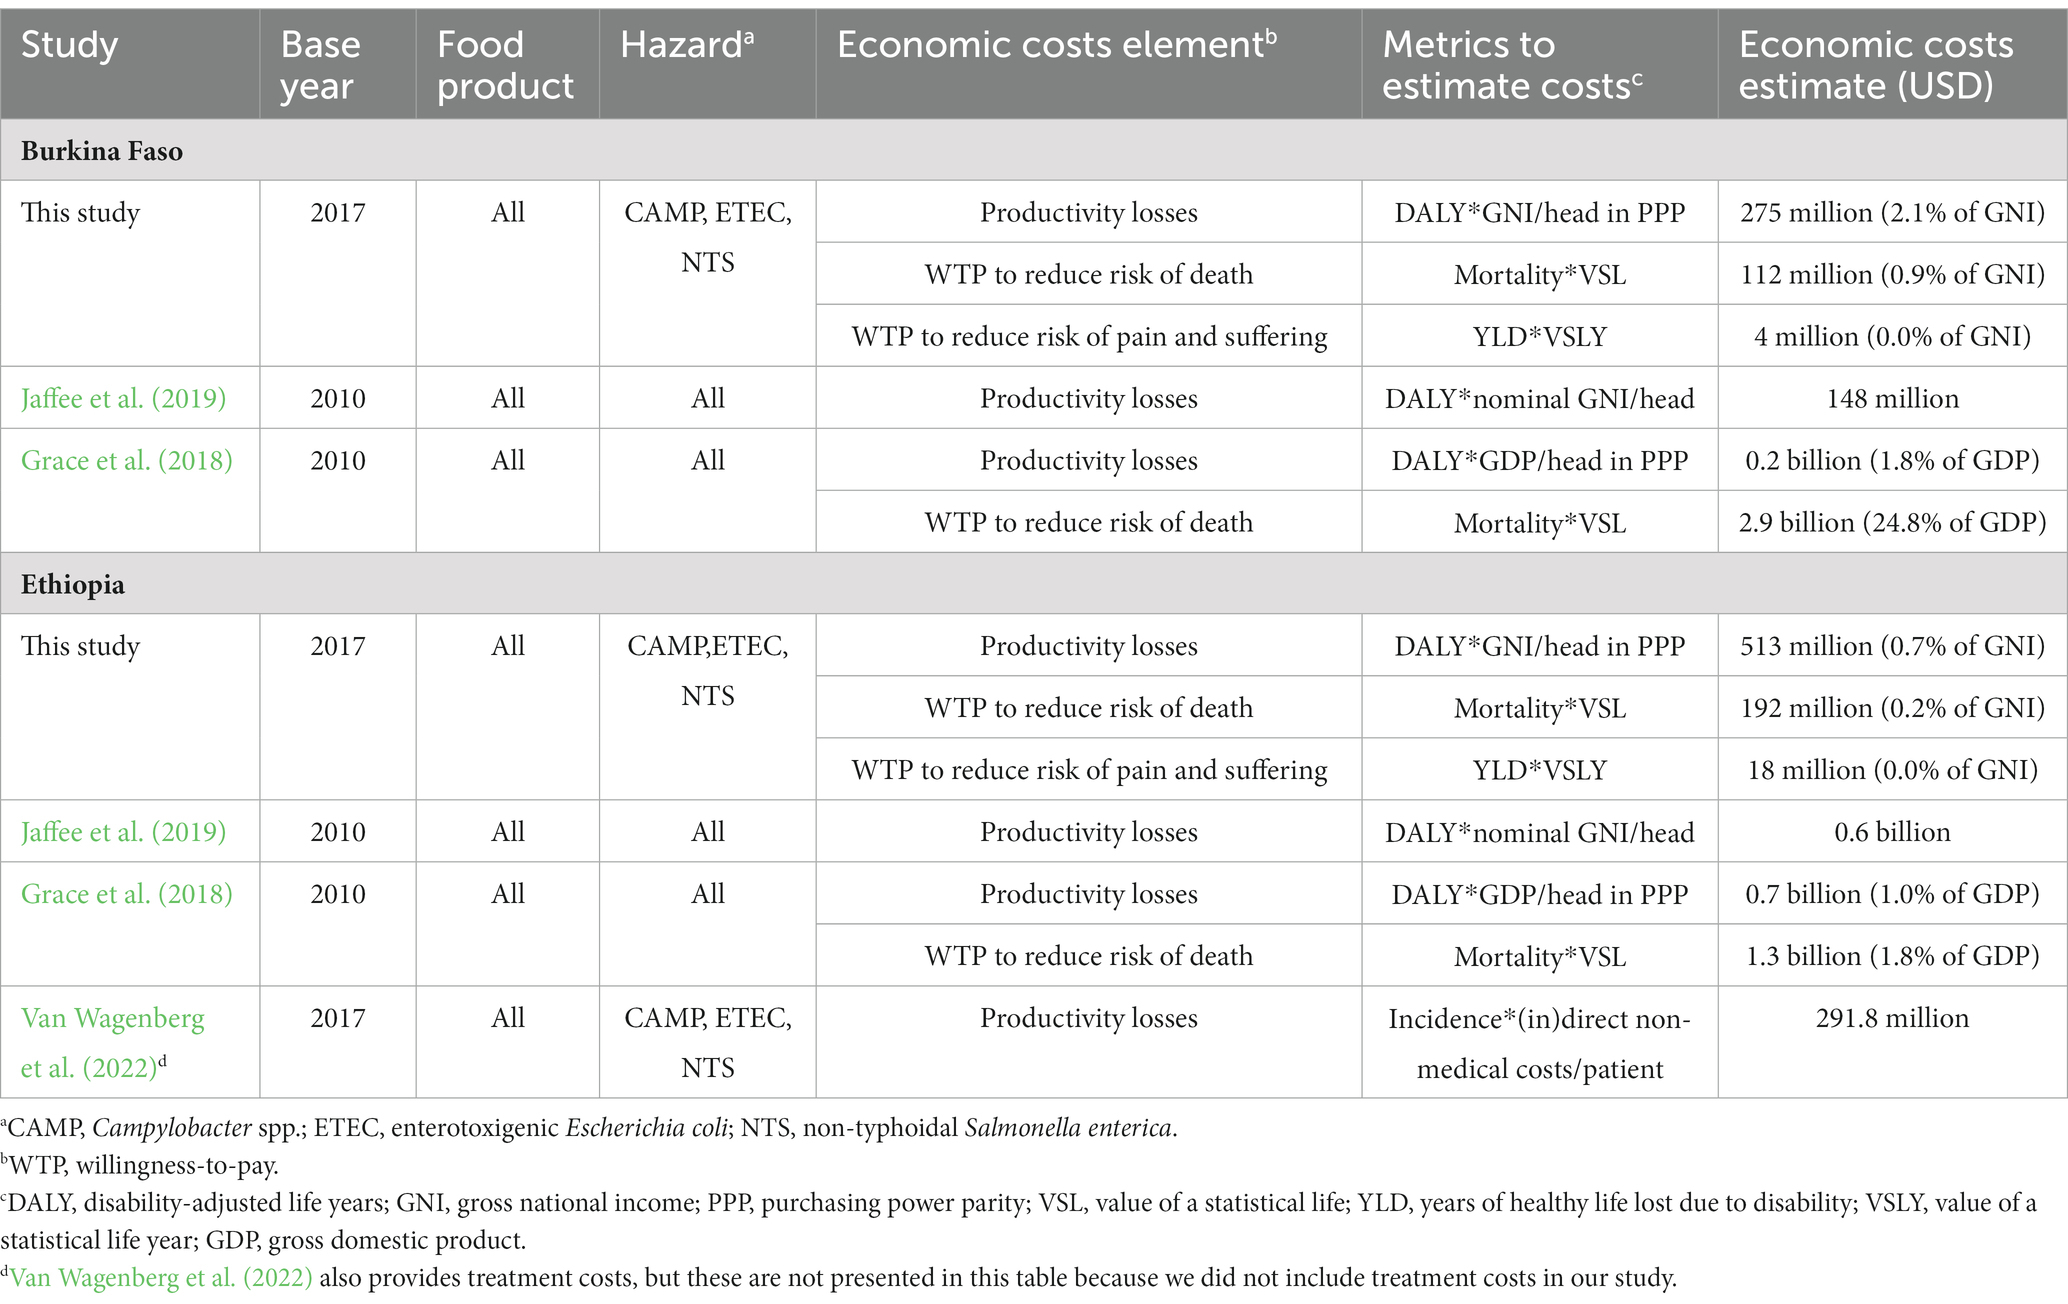
Table 4. Results of this study compared to results of other studies with economic cost estimates related to foodborne diseases in Burkina Faso and Ethiopia.
In our study, we estimated the economic costs related to WTP to reduce risk of death, WTP to reduce risk of pain and suffering, and productivity losses. Total economic costs related to FBD also include medical treatment costs and expenditures on illness prevention (Harrington and Portney, 1987). For Ethiopia, Van Wagenberg et al. (2022) estimated patient-related medical treatment costs in 2017 related to FBD caused by CAMP, ETEC and NTS at 51.5 million USD, based on data from a health centre, a private specialty clinic, and a referral hospital. These costs are less than 10% of our estimated economic costs of 723 million Int$2017. However, treatment costs might be higher, because the estimates of Van Wagenberg et al. (2022) did not include direct medical costs paid for by direct healthcare funding by the government, health insurance or other organizations, nor costs in other types of public and private healthcare facilities. Other studies also provided estimates of medical treatment costs in Ethiopia and Burkina Faso (Grace et al., 2018; Jaffee et al., 2019), but a sound comparison with our estimates is not possible, because their estimates are for FBD related to all hazards. We are not aware of any studies that estimated the expenditures on illness prevention in Burkina Faso or Ethiopia, so we cannot indicate the contribution to total economic costs. Further efforts are required to assess treatment costs and prevention expenditures and their contribution to total economic costs.
The economic cost estimates related to FBD in Burkina Faso (3.0% of national GNI) and Ethiopia (0.9%) were substantial relative to the national economies even though we only included three hazards. This is higher than available estimates in high-income countries, further underlining the disproportionate impact of FBD on the health and economies of LMIC. For example, average economic costs related to FBD in the USA in 2013 were estimated at 55.5 billion USD or 93.2 billion USD, depending on the model used (Scharff, 2015). This corresponded with 0.3% and 0.5% of the 2013 national GNI of 17,061 billion USD (The World Bank database indicator code NY.GNP.ATLS.CD). In the Netherlands, average economic costs related to FBD were estimated at €282 million in 2020 (Benincà et al., 2021). These costs comprised 0.04% of the national GNI of €783,747 million in 2020 [890,621 million USD (The World Bank database indicator code NY.GNP.ATLS.CD) and exchange rate of €0.88 per USD (The World Bank database indicator code PA.NUS.FCRF)]. The difference with the fraction of GNI in the USA can be attributed to a different method to value death in the Netherlands, using the friction cost method rather than WTP (Brouwer and Koopmanschap, 2005). It should be noted that the 2020 estimate for the Netherlands was approximately €140 million lower than the average of the estimates over the previous four years (2016 to 2019) of €420 million, because FBD incidence was lower due to the COVID-19 pandemic. In these previous years, economic costs comprised approximately 0.05% of the national GNI.
In the baseline, economic costs at the 97.5% percentile of the disease burden estimates were 65% to 75% higher than the mean estimates, depending on the country. Furthermore, results in sensitivity option b showed that economic cost estimates could be 130% higher than the baseline estimates. Thus, if both economic and disease burden uncertainty are at upper values, economic costs could be up to four times higher than the mean baseline estimate. This large uncertainty complicates use of the economic cost estimates in policy making. More accurate values of VSL, VSLY and disease burden estimates can reduce the uncertainty in economic cost estimates and improve usability in policy making.
Although widely used, the concept of VSL is not without controversy, because the term life can easily be interpreted as life rather than risk (Banzhaf, 2014). Furthermore, applying it is not straightforward (Van Wee and Rietveld, 2013): (1) VSL assumes no relationship between the VSL and level of risk, (2) it assumes a correct perception of risk, (3) it includes the valuation of the statistical lives of people involved but not their descendants, and (4) an inconsistency could occur between the income independent VSL and income dependent values of time. Nevertheless, we used this concept in our study, because Robinson et al. (2019b) recommended to use VSL to value mortality risk reductions of public health and environmental policies and Van Wee and Rietveld (2013) concluded that VSL is a useful concept for ex-ante evaluations of safety impacts of transport policy options.
When estimating the WTP to reduce risk of pain and suffering, we valued YLD with VSLY. In their study on economic costs of the health burden from air pollution, Narain and Sall (2016) also used VSLY to value morbidity, be it as the upper value. Furthermore, the metric YLD is the equivalent of one full year of healthy life lost due to disability or ill-health. It includes a disability weight, scaling it between 0 and 1, where 0 is perfect health and 1 is a disability considered as bad as dying. Less than 2% of our cost estimates were related to WTP to reduce risk of pain and suffering. Thus, valuing YLD less than with VSLY would lower the WTP to reduce risk of pain and suffering, but impact on aggregated economic cost estimates would be limited.
For policy makers to design and implement effective policies to improve food safety, not only knowing the size and importance of the problem is relevant. It is also important to address why the problem exists, where in the value chain hazards manifest themselves, who is responsible or accountable, what solutions are possible, and how solutions can be applied in a particular context. Such questions were beyond the scope of our study and further studies are needed. However, based on our results we can make several policy recommendations for control of NTS, CAMP and ETEC in chicken meat and tomatoes in Burkina Faso and Ethiopia. First, efforts should be increased to control FBD caused by these hazards. This will likely result in substantial societal benefits given the substantial size of the economic costs compared to the countries’ national economies. Second, efforts should focus on children under five years, because a disproportionally large part of the economic costs could be attributed to them. This suggests that efforts to control FBD in children under five years could potentially have a larger economic effect than efforts to control FBD in older people. Potential policies could focus on interventions aiming to induce parents to purchase safer foods for young children and to prepare these foods at home safely. Further efforts are needed to design effective policies to reduce FBD in young children in the local contexts. Third, efforts to control NTS in chicken meat and tomatoes could potentially have a larger economic impact than those focussing on ETEC or CAMP, because NTS caused the highest costs. Although food safety control measures in the supply chain and households often target multiple hazards, policies could stimulate those measures that are especially effective for NTS. Fourth, efforts should focus more on chicken meat than on tomatoes, because the economic costs associated with chicken meat were nine to twelve times higher than those associated with tomatoes, depending on the sensitivity option. This suggests that policies inducing the use of control measures in the chicken meat supply chain could potentially have a larger economic impact than those inducing the use of control measures in the tomato supply chain. These recommendations are only based on the results of this study about NTS, CAMP, and ETEC in chicken meat and tomatoes. Policies and policy interventions to improve food safety should also consider all other hazards and food products to avoid underestimating the public health benefits.
We estimated the economic costs related to FBD caused by NTS, CAMP and ETEC in chicken meat and tomatoes in Burkina Faso and Ethiopia. For other hazards that could contaminate chicken meat and tomatoes, for example other E. coli pathotypes, norovirus, diarrheagenic bacteria and protozoa, total economic costs and the parts attributed to WTP to reduce risk of death, WTP to reduce risk of pain and suffering, and productivity losses, and to different age groups might be different. The economic costs due to NTS, ETEC and CAMP in chicken meat and tomatoes were approximately 30% of the economic costs of NTS, ETEC and CAMP in all foods in both countries. Attribution of the remaining 70% to other food products could inform the relative importance of those other products. Extrapolation of our results to other African countries is complicated by the substantial differences in estimates between the two countries. Therefore, we recommend studies to estimate the economic costs related to FBD in other African countries. Further efforts on other hazards, other food products, other African countries, as well as on attribution to more detailed age groups are needed. An overview of the economic costs of all hazards in all food products in all countries is needed for decision makers to design targeted effective and efficient policies and policy interventions to control FBD in LMIC in Africa.
5. Conclusion
Mean aggregated economic costs related to FBD caused by NTS, CAMP, and ETEC together in 2017 were estimated at 391 million Int$2017 in Burkina Faso and 723 million in Ethiopia. With 3.0% of GNI in Burkina Faso and 0.9% of GNI in Ethiopia, these costs were substantial relative to the size of the national economies. Lost productivity contributed 70% to the costs, WTP to reduce risk of death 30%, and WTP to reduce risk of pain and suffering 1%–2%. Economic costs related to FBD caused by these hazards in chicken meat were nine to twelve times larger than those caused by these hazards in tomatoes. A disproportionally large part of the economic costs was attributed to children under five years. Due to uncertainty in` disease burden and economic data, economic costs for these three hazards could be up to four times higher than the mean. Policy efforts to control FBD will likely result in substantial societal benefits. More accurate values of VSL, VSLY and disease burden can reduce the uncertainty in economic cost estimates and improve their usability for policy making. Efforts to estimate costs for other countries, to attribute costs to other food products and hazards, to further standardise estimation methodologies, and to estimate treatment costs and expenditures on illness prevention are recommended.
Data availability statement
The raw data supporting the conclusions of this article will be made available by the authors, without undue reservation.
Author contributions
CW and AH contributed to conception and design of the study, to interpretation of findings, and to writing and reviewing of the manuscript. CW collected the economic cost data, performed the calculations, and wrote the first draft of the manuscript. AH provided the disease burden data. All authors contributed to the article and approved the submitted version.
Funding
This work was funded by the UK Foreign, Commonwealth & Development Office (FCDO) and the Bill & Melinda Gates Foundation through a project entitled “Urban food markets in Africa: Incentivizing food safety using a pull-push approach” [Investment ID INV-008430 (formerly OPP1195588), the Pull-Push Project]. Under the grant conditions of the Bill & Melinda Gates Foundation, a Creative Commons Attribution 4.0 Generic License has already been assigned to the Author Accepted Manuscript version that might arise from this submission. The funders had no role in the design of the study, collection, analyses, or interpretation of data, nor in writing of the manuscript.
Acknowledgments
The authors like to thank Theo Knight-Jones, Steve Jaffee, Sandra Hoffman, and Delia Grace for reading and commenting on draft versions of the manuscript.
Conflict of interest
The authors declare that the research was conducted in the absence of any commercial or financial relationships that could be construed as a potential conflict of interest.
Publisher’s note
All claims expressed in this article are solely those of the authors and do not necessarily represent those of their affiliated organizations, or those of the publisher, the editors and the reviewers. Any product that may be evaluated in this article, or claim that may be made by its manufacturer, is not guaranteed or endorsed by the publisher.
Supplementary material
The Supplementary material for this article can be found online at: https://www.frontiersin.org/articles/10.3389/fsufs.2023.1227430/full#supplementary-material
Footnotes
1. ^https://www.ilri.org/research/projects/urban-food-markets-africa-incentivizing-food-safety-using-pull-push-approach
References
Banzhaf, H. S. (2014). Retrospectives: the cold-war origins of the value of statistical life. J. Econ. Perspect. 28, 213–226. doi: 10.1257/jep.28.4.213
Benincà, E. G. R., Lagerweij, R., Pijnacker, I. H. M., Friesema, M., Kretzschmar, E. Franz, and Gras, L. Mughini (2021). Disease burden of food-related pathogens in the Netherlands, 2020. Bilthoven, the Netherlands: National Institute for Public Health and the Environment
Brouwer, W. B., and Koopmanschap, M. A. (2005). The friction-cost method: replacement for nothing and leisure for free? PharmacoEconomics 23, 105–111. doi: 10.2165/00019053-200523020-00002
Devleesschauwer, B., Haagsma, J. A., Angulo, F. J., Bellinger, D. C., Cole, D., Döpfer, D., et al. (2015). Methodological framework for World Health Organization estimates of the global burden of foodborne disease. PLoS One 10:e0142498. doi: 10.1371/journal.pone.0142498
Grace, D., Alonso, S., Mutua, F., Roesel, K., Lindahl, J., and Amenu, K. (2018). Food safety investment expert advice: Burkina Faso, Ethiopia, Nigeria. Nairobi, Kenya: International Livestock Research Institute
Hammitt, J. K., and Robinson, L. A. (2011). The income elasticity of the value per statistical life: transferring estimates between high and low income populations. J. Benefit-Cost Anal. 2, 1–29. doi: 10.2202/2152-2812.1009
Harrington, W., and Portney, P. R. (1987). Valuing the benefits of health and safety regulation. J. Urban Econ. 22, 101–112. doi: 10.1016/0094-1190(87)90052-0
Havelaar, A. H., Kirk, M. D., Torgerson, P. R., Gibb, H. J., Hald, T., Lake, R. J., et al. (2015). World Health Organization global estimates and regional comparisons of the burden of foodborne disease in 2010. PLoS Med. 12:e1001923. doi: 10.1371/journal.pmed.1001923
Havelaar, A. H., Sapp, A., Amaya, M. P., Nane, G. F., Morgan, K. M., Devleesschauwer, B., et al. (2022). Burden of foodborne disease due to bacterial hazards associated with beef, dairy, poultry meat and vegetables in Ethiopia and Burkina Faso. Front. Sustain. Food Syst. 6:1024560. doi: 10.3389/fsufs.2022.1024560
Hoffmann, V., and Baral, S. (2019). Foodborne disease in Kenya: country-level cost estimates and the case for greater public investment. Washington DC, USA: International Food Policy Research Institute (IFPRI)
ILRI (2011). Assessment of risks to human health associated with meat from different value chains in Nigeria: using the example of the beef value chain. Nairobi, Kenya: International Livestock Research Institute
Jaffee, S., Henson, S., Unnevehr, L., Grace, D., and Cassou, E. (2019). The safe food imperative: accelerating progress in low and middle-income countries. Washington DC, USA: The World Bank
Narain, U., and Sall, C. (2016). Methodology for valuing the health impacts of air pollution: Discussion of challenges and proposed solutions. Washington DC, USA: The World Bank
Robinson, L. A., Hammitt, J. K., Cecchini, M., Chalkidou, K., Claxton, K., Cropper, M., et al. (2019a). Reference case guidelines for benefit-cost analysis in global health and development. Available at: https://papers.ssrn.com/sol3/papers.cfm?abstract_id=4015886 (Accessed February 1, 2023)
Robinson, L. A., Hammitt, J. K., and O’Keeffe, L. (2019b). Valuing mortality risk reductions in global benefit-cost analysis. J. Benefit-Cost Anal. 10, 15–50. doi: 10.1017/bca.2018.26
Sapp, A. C., Amaya, M. P., Havelaar, A. H., and Nane, G. F. (2022). Attribution of country level foodborne disease to food group and food types in three African countries: conclusions from a structured expert judgment study. PLoS Neglect. Trop. D. 16:e0010663. doi: 10.1371/journal.pntd.0010663
Scharff, R. L. (2015). State estimates for the annual cost of foodborne illness. J. Food Protect. 78, 1064–1071. doi: 10.4315/0362-028X.JFP-14-505
Van Wagenberg, C. P. A., Guadu Delele, T., and Havelaar, A. H. (2022). Patient-related healthcare costs for diarrhoea, Guillain Barré syndrome and invasive non-typhoidal salmonellosis in Gondar, Ethiopia, 2020. BMC Public Health 22:2091. doi: 10.1186/s12889-022-14539-1
Keywords: cost-of-illness, disease burden, tomato, Salmonella , Campylobacter , ETEC, chicken meat, Africa
Citation: van Wagenberg CPA and Havelaar AH (2023) Economic costs related to foodborne disease in Burkina Faso and Ethiopia in 2017. Front. Sustain. Food Syst. 7:1227430. doi: 10.3389/fsufs.2023.1227430
Edited by:
Célia Quintas, University of Algarve, PortugalReviewed by:
Clare Narrod, University of Maryland, College Park, United StatesIsabel Ratão, University of Algarve, Portugal
Copyright © 2023 van Wagenberg and Havelaar. This is an open-access article distributed under the terms of the Creative Commons Attribution License (CC BY). The use, distribution or reproduction in other forums is permitted, provided the original author(s) and the copyright owner(s) are credited and that the original publication in this journal is cited, in accordance with accepted academic practice. No use, distribution or reproduction is permitted which does not comply with these terms.
*Correspondence: Coen P. A. van Wagenberg, Q29lbi52YW53YWdlbmJlcmdAd3VyLm5s
 Coen P. A. van Wagenberg
 Arie H. Havelaar