 Anibal Cerrudo
 Jill Miller-Garvin1
 Seth L. Naeve
- 1Department of Agronomy and Plant Genetics, University of Minnesota, Saint Paul, MN, United States
- 2Ecofisiología de cultivos, Unidad Integrada Balcarce (INTA-FCA), Balcarce, Argentina
Soybean’s protein concentration and amino acid profile vary geographically due to genotype and environment. We used 1817 on-farm grain samples from the United States, Brazil, and the Southern Cone to assess soybean protein variability in the Western Hemisphere, which accounts for 85% of global production. Our analysis found consistent spatial patterns for protein concentration and amino acid composition, with differences in protein concentration of up to 5.4% among regions. While there was a negative correlation between protein concentration and the abundance of critical amino acids (lysine, cysteine, threonine, methionine, and tryptophane), their amount per ton of grain increased with protein concentration. Our findings can guide market and industry in benchmarking soybean protein quality across the Western Hemisphere, which according to our projection could supply close to 120 million metric tons of protein and 17 million metric tons of the most critical amino acids annually by 2030.
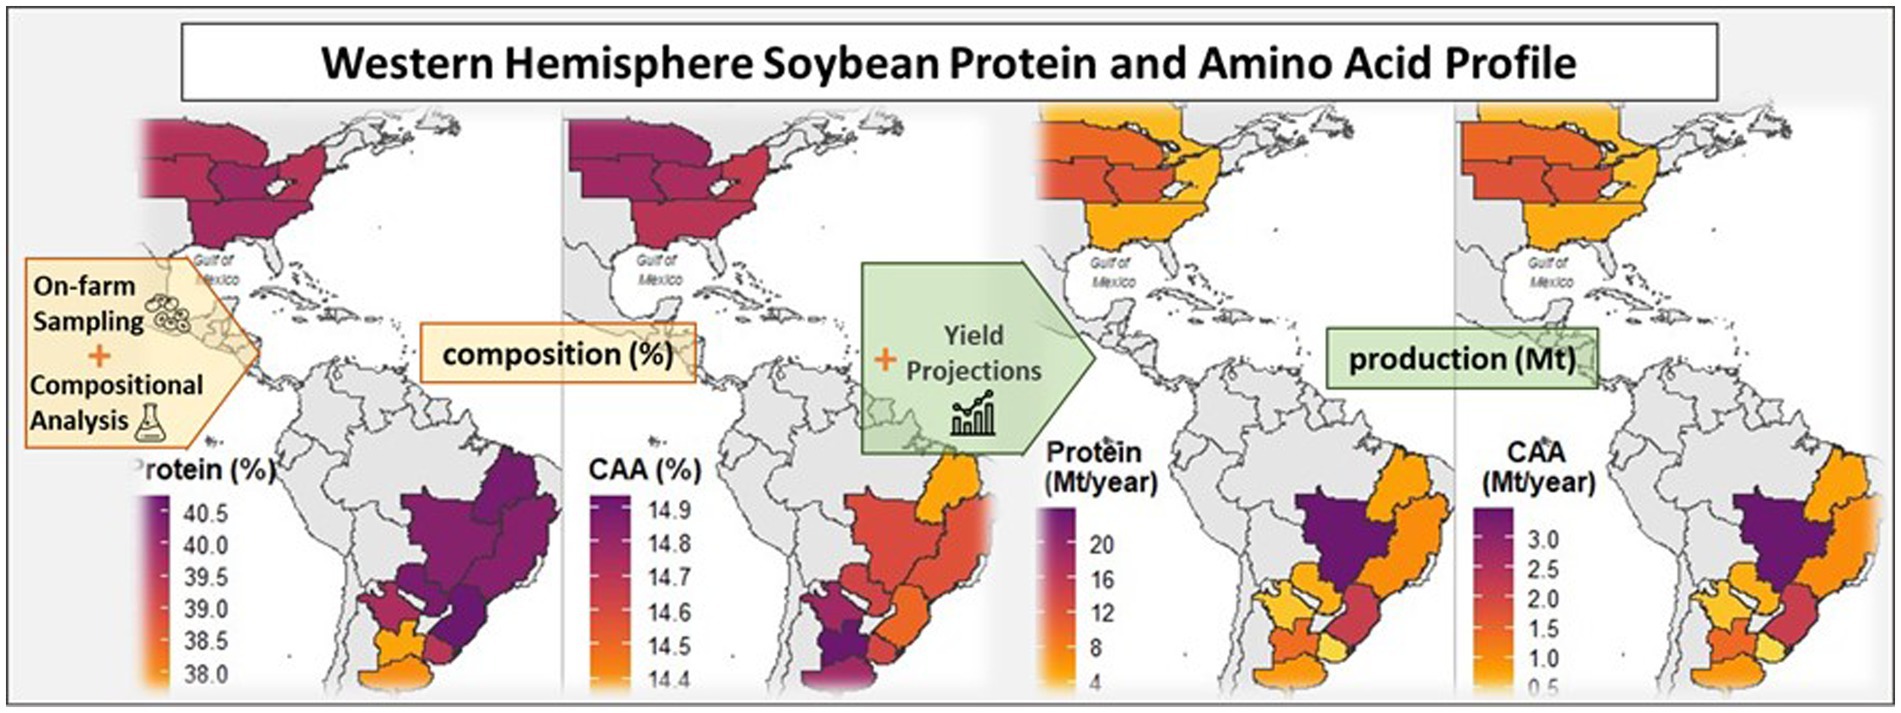
Graphical Abstract.
1. Introduction
Soybean [Glycine max (L.) Merr.] is a major protein source for monogastric livestock and comprises 70% of the world’s protein-meal consumption (FAO Faostat, 2022). Surprisingly, only 2% of soybean protein is consumed directly as human food, with the remaining 98% used for animal feed (Goldsmith et al., 2004). Driven by the growing demand for oil and animal protein (Godfray and Garnett, 2014), soybean production in the Americas has doubled in the last two decades, mainly through an expansion in the cropping area (Zalles et al., 2019; Song et al., 2021; Marin et al., 2022). Currently, the United States, Brazil, and the Southern Cone (Argentina, Paraguay, and Uruguay) account for 95% of soybean production in the continent. It is worth noting that almost one-third of the arable land in the Western Hemisphere (95 million ha) is used to produce over 85% of the world’s soybean grain (OECD and FAO, 2022).
According to the relevance of the feed end-use of soybean and because modern monogastric rations are oriented to maximize feed conversion efficiency, the market demands high-protein concentration soybeans (Hertsgaard et al., 2019; Pope et al., 2023). In addition, the ultimate nutritional value of soybean protein is determined by the proportion of each amino acid in total protein, the amino acid profile (Osborne et al., 1914; Tessari et al., 2016). Optimizing the amino acid profile can lead to less excess amino acid deamination and excretion of nitrogen, resulting in increased conversion efficiency of vegetable into animal protein (Waguespack et al., 2009; Attia et al., 2020). Soybean protein analysis typically reports 18 amino acids (Kovalenko et al., 2006), with lysine, threonine, tryptophan, cysteine, and methionine considered the most critical amino acids as they frequently limit the conversion efficiency of soybean meal in monogastric animal products (Thakur and Hurburgh, 2007; Ravindran et al., 2014).
Soybean grain composition is determined by a combination of environmental resources such as radiation, water, and nutrients, as well as regulators like temperature, all of which interact with the genotype (Piper and Boote, 1999; Carrera et al., 2009, 2022; Rotundo and Westgate, 2009; Anthony et al., 2012; Pfarr et al., 2018; Bosaz et al., 2019). The spatial structure of these factors varies due to differences in soil fertility, precipitation, temperature, cultivar adoption, and other factors. As a result of these combined effects, soybean grain protein concentration exhibits geographical variability. Moreover, year-to-year variability also exists due to weather-determined environmental factors (Rotundo et al., 2016).
There is some limited evidence that suggest that changes in the amino acid profile are linked to variations in protein concentration, and thus may be also influenced by the environment (Park and Hurburgh, 2002; Song et al., 2016; Assefa et al., 2018). Controlled experiments have shown that as grain protein concentration increases, the abundance of critical amino acids decreases (Pfarr et al., 2018). This is particularly relevant because regions with lower protein concentration may produce soybean meal of better quality (William et al., 2020).
Knowledge about the occurrence of spatial patterns in grain composition across the Western Hemisphere would be relevant for the market, trading, and the industry (Hertsgaard et al., 2019). Defining spatial patterns would help in the segregation of production according to protein concentration or amino acid profile, which would allow for the optimization of quality for different end-uses (Pope et al., 2023). Different soybeans could even be combined in a way that the amino acid profile results in a higher protein score (Messina, 2022). Additionally, it is essential to consider spatial variability in the estimation of current and future protein and amino acids production capacities, especially since the future increase in production may not be evenly distributed among regions (OECD and FAO, 2022; Ricard et al., 2022).
Previous studies have demonstrated regional variations in soybean protein concentrations in the U.S., Brazil, and the Southern Cone (Breene et al., 1988; Rotundo et al., 2014; Assefa et al., 2019; Bosaz et al., 2019). While attempts have been made to assess the protein profile of some amino acids in the U.S. (Assefa et al., 2018), there is no comprehensive analysis of the geographical patterns for protein concentration and amino acid profiles across the entire Western Hemisphere. Therefore, in this study, we aim to (i) investigate the spatial patterns of soybean protein concentration and amino acid profiles, (ii) explore the interrelationships between amino acids and protein content in soybean grain, and (iii) project the soybean protein and amino acid production capacity of the Western Hemisphere.
2. Materials and methods
2.1. Sites and years
We analyzed a soybean compositional dataset comprising 1817 grain samples collected during the 2012–2014 growing seasons across the United States, Brazil, and the Southern Cone (Argentina, Paraguay, and Uruguay). To capture the agro-climatic and geographic diversity within these regions, we further divided them into subregions (Figure 1). In the United States, the subregions were the Northern Corn Belt, Western Corn Belt, Eastern Corn Belt, East Coast, and South. Brazil’s subregions were North Brazil, Cerrado, Atlantic Forest, and South Brazil. In the Southern Cone, we defined the subregions as Paraguay, Uruguay, Northern Pampas, Central Pampas, and Southern Pampas.
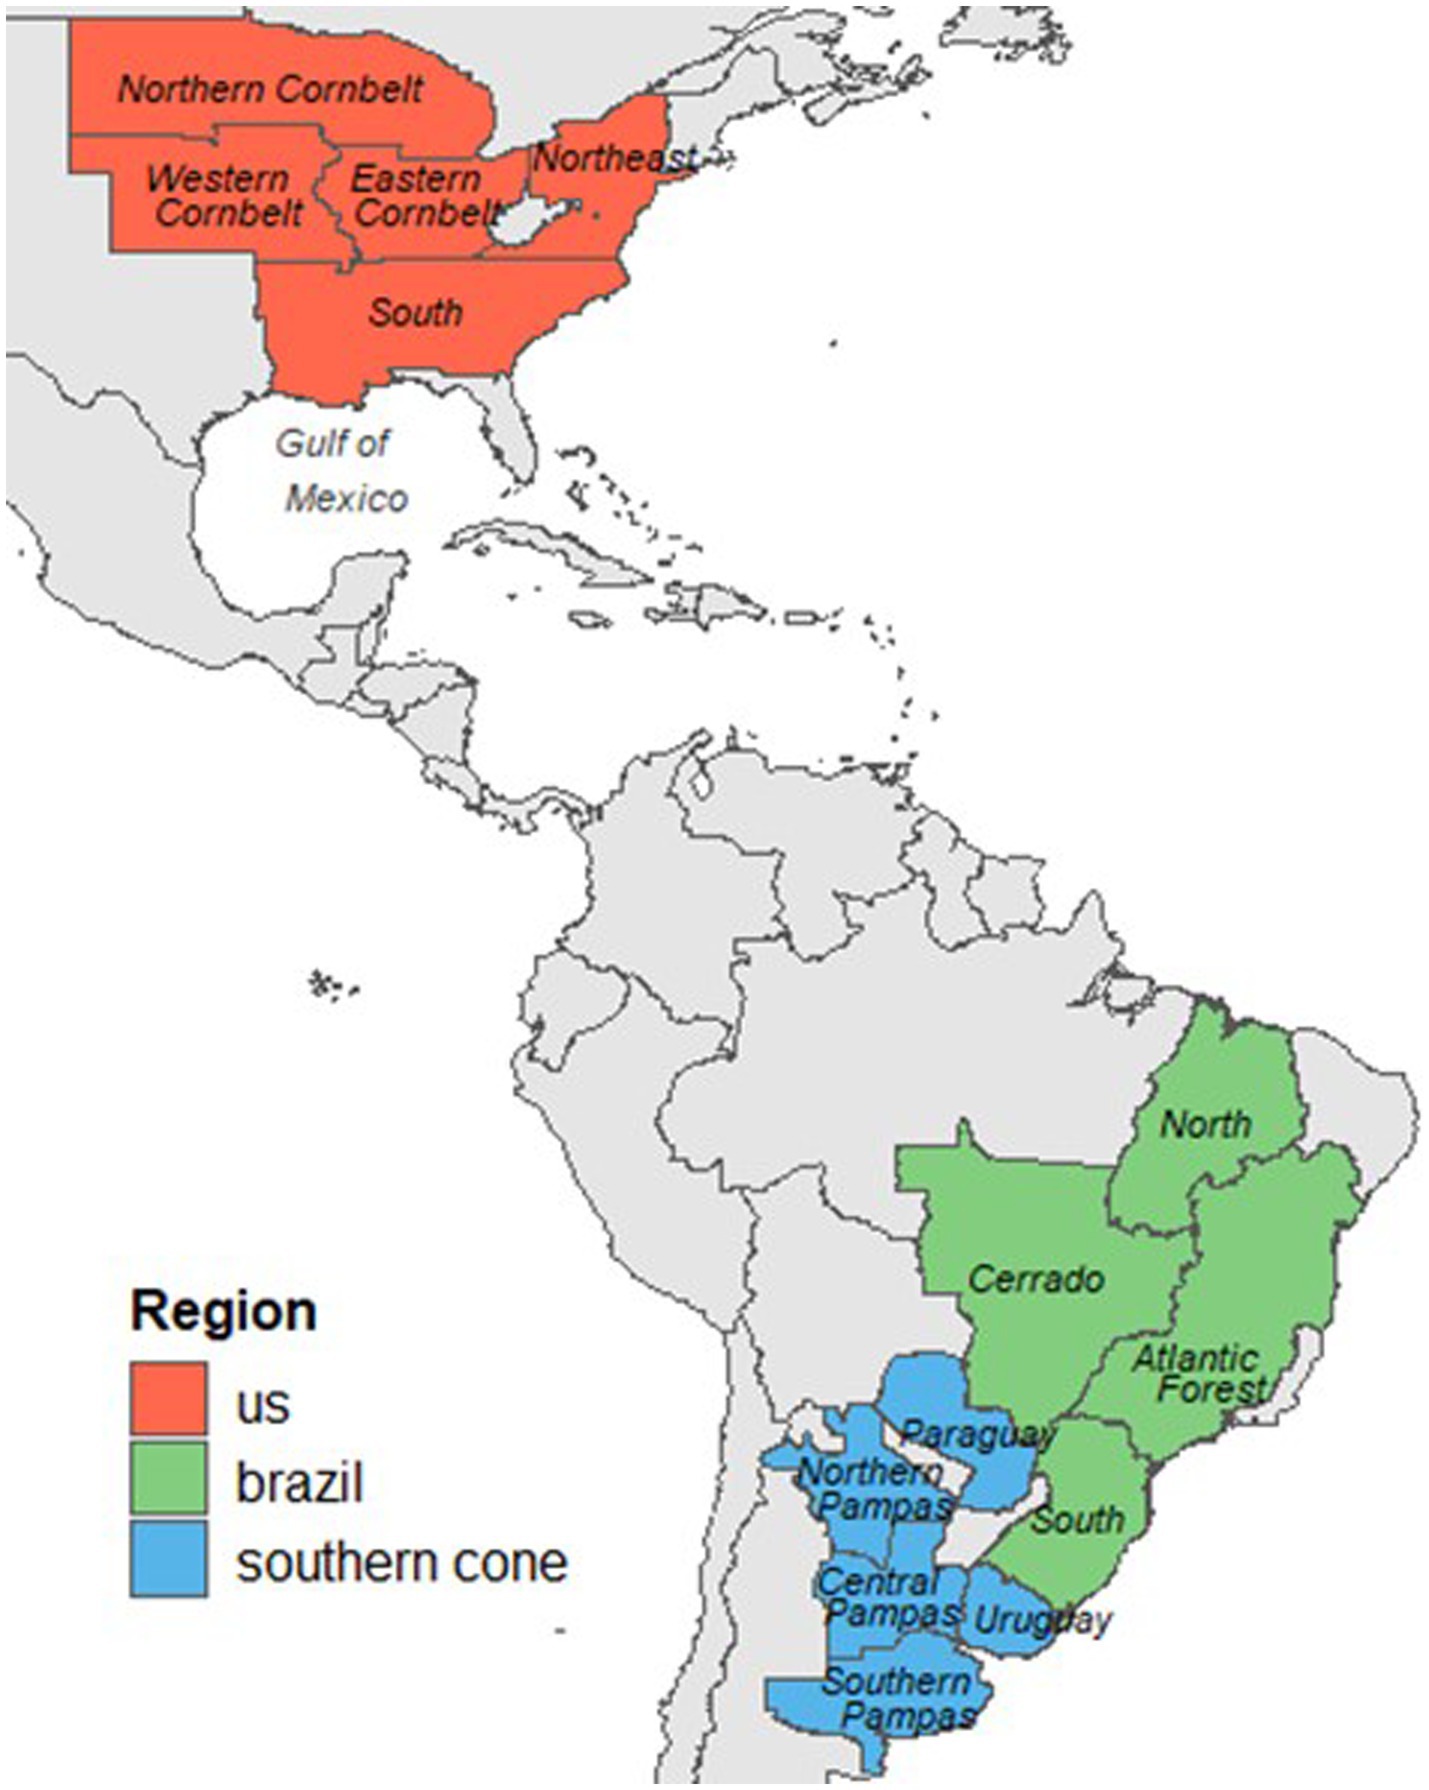
Figure 1. Regions and subregions across the Western Hemisphere where the soybean grain sampling was conducted between 2012 and 2014 growing seasons.
2.2. Sampling, compositional analysis, and derived variables
Soybean grain samples were collected from each region and subregion (Figure 1). Each year, samples were collected by state, province, or department trying to match actual production statistics, so that the resulting data would reflect the regional soybean compositional profile. Sampling varied slightly by country. United States samples were obtained directly from farmers; grain sample kits were mailed to farmers. South American soybean crops were sampled by independent contractors working in each country. Brazilian soybeans were sampled at the farm during harvest, while in the Southern Cone, samples were recovered at discharge locations including processors and ports. Production location was provided by the truck driver directly when samples were pulled. All grain samples were shipped to the University of Minnesota, St. Paul, Minnesota. The resulting dataset comprised 636, 645, and 536 samples from the United States, Brazil, and the Southern Cone, respectively. All samples were sent to the Experiment Station Chemical Laboratories at the University of Missouri-Columbia for analysis. Crude protein concentration was measured by combustion (LECO), crude oil concentration by ether extraction, total carbohydrates and the complete amino acid profile using AOAC Official Methods 990.30, 920.39, and 982.30 and expressed in dry basis. We estimated net protein concentration from the sum of all 18 amino acids and calculated the apparent non-protein N fraction for each sample as the difference between crude protein and net protein. The amount of the most critical amino acids was calculated as the sum of lysine, threonine, tryptophane, methionine, and cysteine (Thakur and Hurburgh, 2007). Finally, we presented sulfur-containing amino acids (methionine and cysteine) together for some analyzes due to their sparing functionality in digestion (Ball et al., 2006).
2.3. Statistical analysis
To assess the seed composition of different regions and subregions, average and percentile descriptors of crude protein, true protein, apparent non-protein N, and the amino acid profile were calculated across 3 years of data. Normal distributions were observed for all seed composition variables. Variance component analysis was conducted using R (R Core Team, 2021) to evaluate the contribution of the year, region, and subregion, as well as their interactions, to the variability registered for the different compositional variables. The statistical model included year as a random factor, region as a fixed factor, and subregion as a fixed factor that was nested within the region (nesting was necessary because subregions belong to only one region). Year by region and year by subregion interactions were considered random factors. The variance component analysis was performed using the VCA R-package (Schuetzenmeister et al., 2022) that allows the extraction of variance components from both random and fixed effects in linear mixed-effects models. We assessed random effects’ significance in our mixed linear model through a likelihood ratio test, comparing the full model (with random effects) to a reduced model (without them) using the anova base R function (Bakare et al., 2022).
Principal component analysis was used to identify any grouping between relevant traits focusing on crude protein, net protein, apparent non-protein N, oil concentration, carbohydrates concentration, and the most limiting amino acids (Ju et al., 2019). Principal component analysis was performed using the FactoMineR package in R (Lê et al., 2008), only dimensions with eigenvalues >1 were considered. Variables that made the greatest contribution to total variation captured by each dimension were identified. Linear regression and correlation analysis were generated using R software. We have thoroughly examined the assumptions of the linear regression model, including the independence of residuals, and found no evidence of violations.
2.4. Protein and amino acids production projection
To project protein and amino acid production by 2030, we combined regional estimations of grain composition from our analysis with the 2030 projection for soybean grain production at a country level (OECD and FAO, 2022). Grain production at a subregion level was then estimated considering the relative contribution of each subregion to each country’s production during the last 5-year period using data retrieved from each country’s national agency (United States Department of Agriculture,1 Brazilian Institute of Geography and Statistics,2 the Argentinean Secretary of Agriculture,3 and the board of exporters and traders of cereals and oilseeds of Paraguay4). Crude protein and most critical amino acids production projections for 2030 are presented in the results section, while the production estimations for all the individual 18 amino acids are presented in Supplementary Table S3.
3. Results
Our analysis of 1817 soybean seed samples revealed an average crude protein concentration of 39.6%, ranging from 36.1 to 42.6% defined by the fifth and 95th percentiles (P5-P95), indicating a 16% variation relative to the average. On average, the sum of the 18 primary amino acids (net protein) accounted for 97.2% of grain crude protein, while the remaining 2.8% was represented by apparent non-protein N. The fraction of the most critical amino acids in protein averaged 14.7%, ranging from 14.1 to 15.2% (P5-P95), indicating only a 7% variation relative to the average. The complete compositional information at a subregion level is presented in Supplementary Tables S1, S2.
3.1. Crude protein, net protein, and non-protein nitrogen concentration
The results of the variance component analysis (Table 1) indicated that for crude and net protein concentrations, the combined effects of region and subregion were the most significant sources of variation, collectively accounting for close to 30 and 33% of the total variation, respectively. Year did not affect crude or true protein concentrations. The interaction between the region and the year did not have a relevant effect on either protein fraction, but it was a significant source of variation for non-protein N concentration. In turn, the interaction between the subregion and the year was in general significant but explained only a small proportion of the total variation for crude protein, net protein, and non-protein N (less than 5% of the total sum of squares; Table 1).
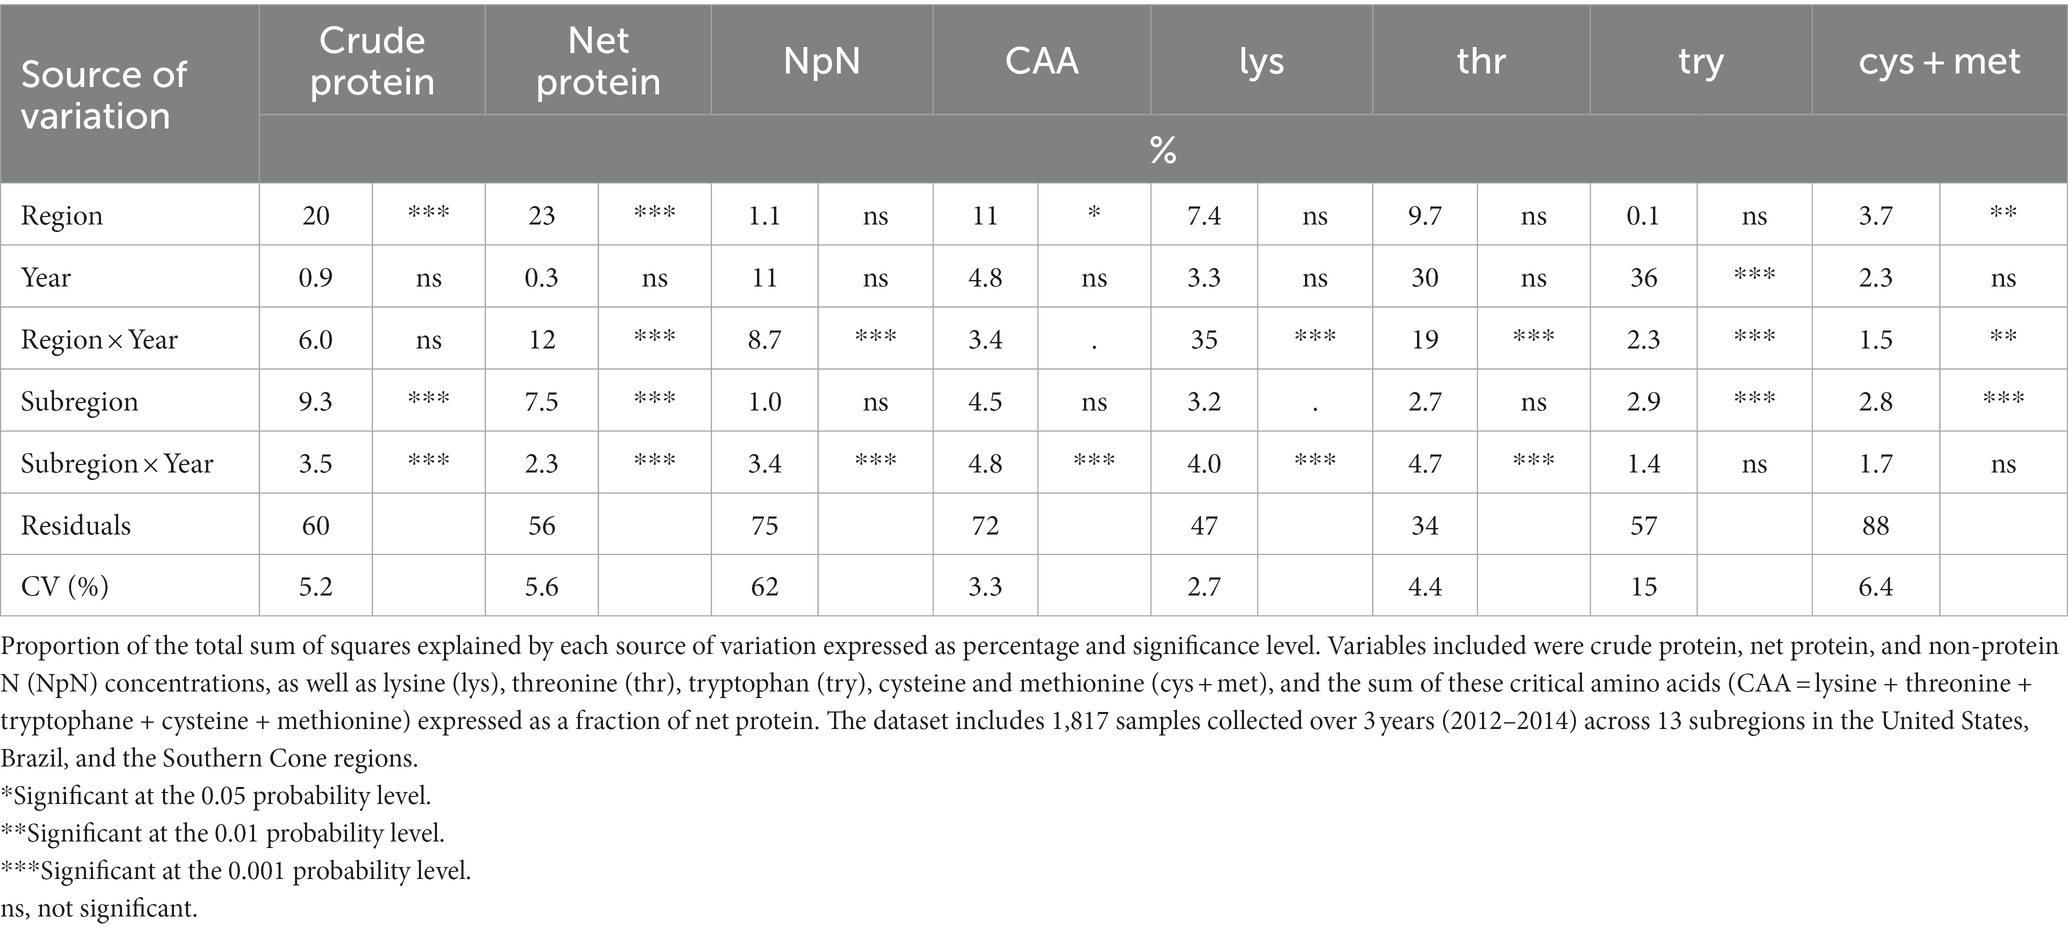
Table 1. Analysis of variance components for soybean grain composition across the Western Hemisphere.
Crude and net protein concentrations in grain, in average, were higher for Brazil, intermediate for the United States, and lower for the Southern Cone (Figure 2). The Southern Cone showed higher variability in both protein fractions compared to the other two regions. Within Brazil and the United States, the protein concentration varied in a narrow range among subregions, while within the Southern Cone, the Southern and Central Pampas subregions had relatively lower grain concentration for these grain constituents compared to Uruguay, the Northern Pampas, or Paraguay (Figure 3). There was no clear regional pattern for non-protein N concentration. We observed a weak positive correlation between non-protein N concentration and crude protein concentration (r = 0.17, p < 0.01).
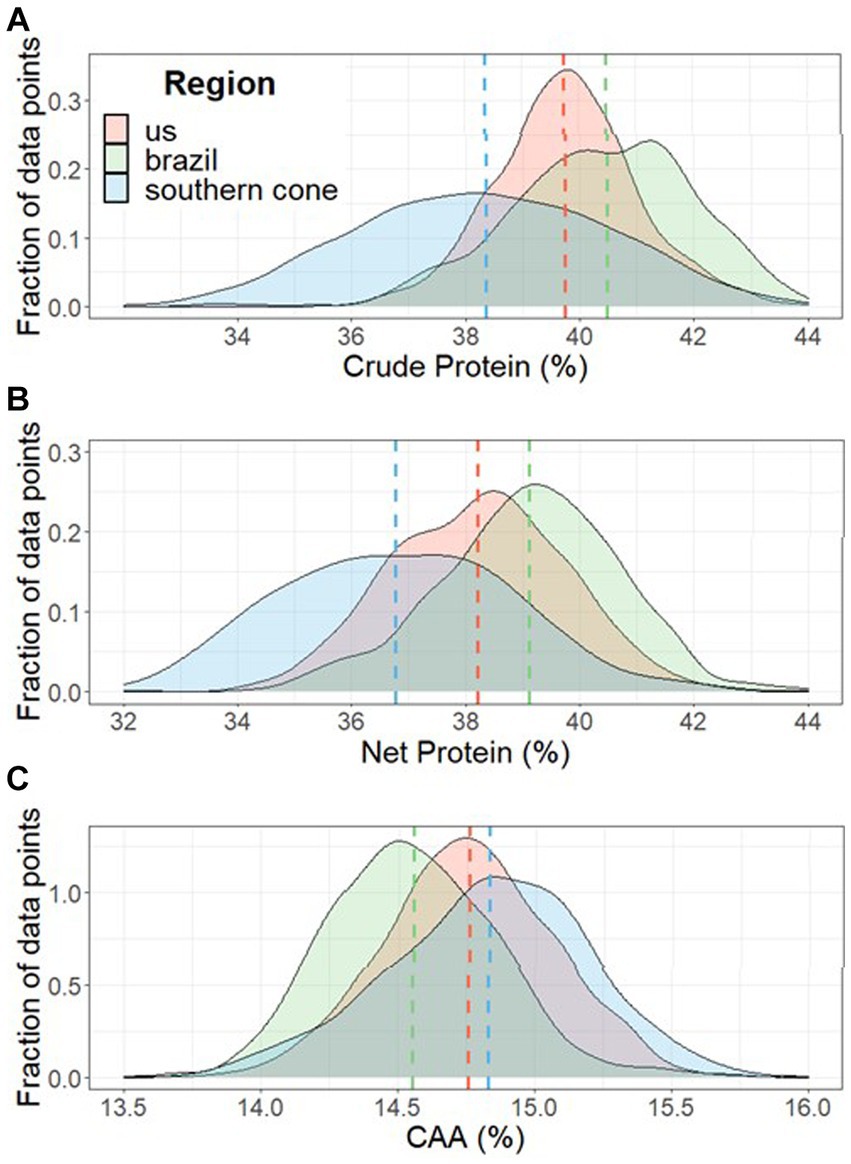
Figure 2. Mean and distribution for soybean crude protein (A) and net protein (B) grain concentration, and the abundance of the most critical amino acids (CAA) in protein (C) for samples collected from the United States, Brazil, and the Southern Cone (Argentina, Paraguay, and Uruguay) regions across the Western Hemisphere. A total of 1817 samples were collected during the 2012, 2013, and 2014 cropping seasons. Abundance of CAA was calculated as [(lysine + threonine + tryptophane + cysteine + methionine)/net protein] x 100.
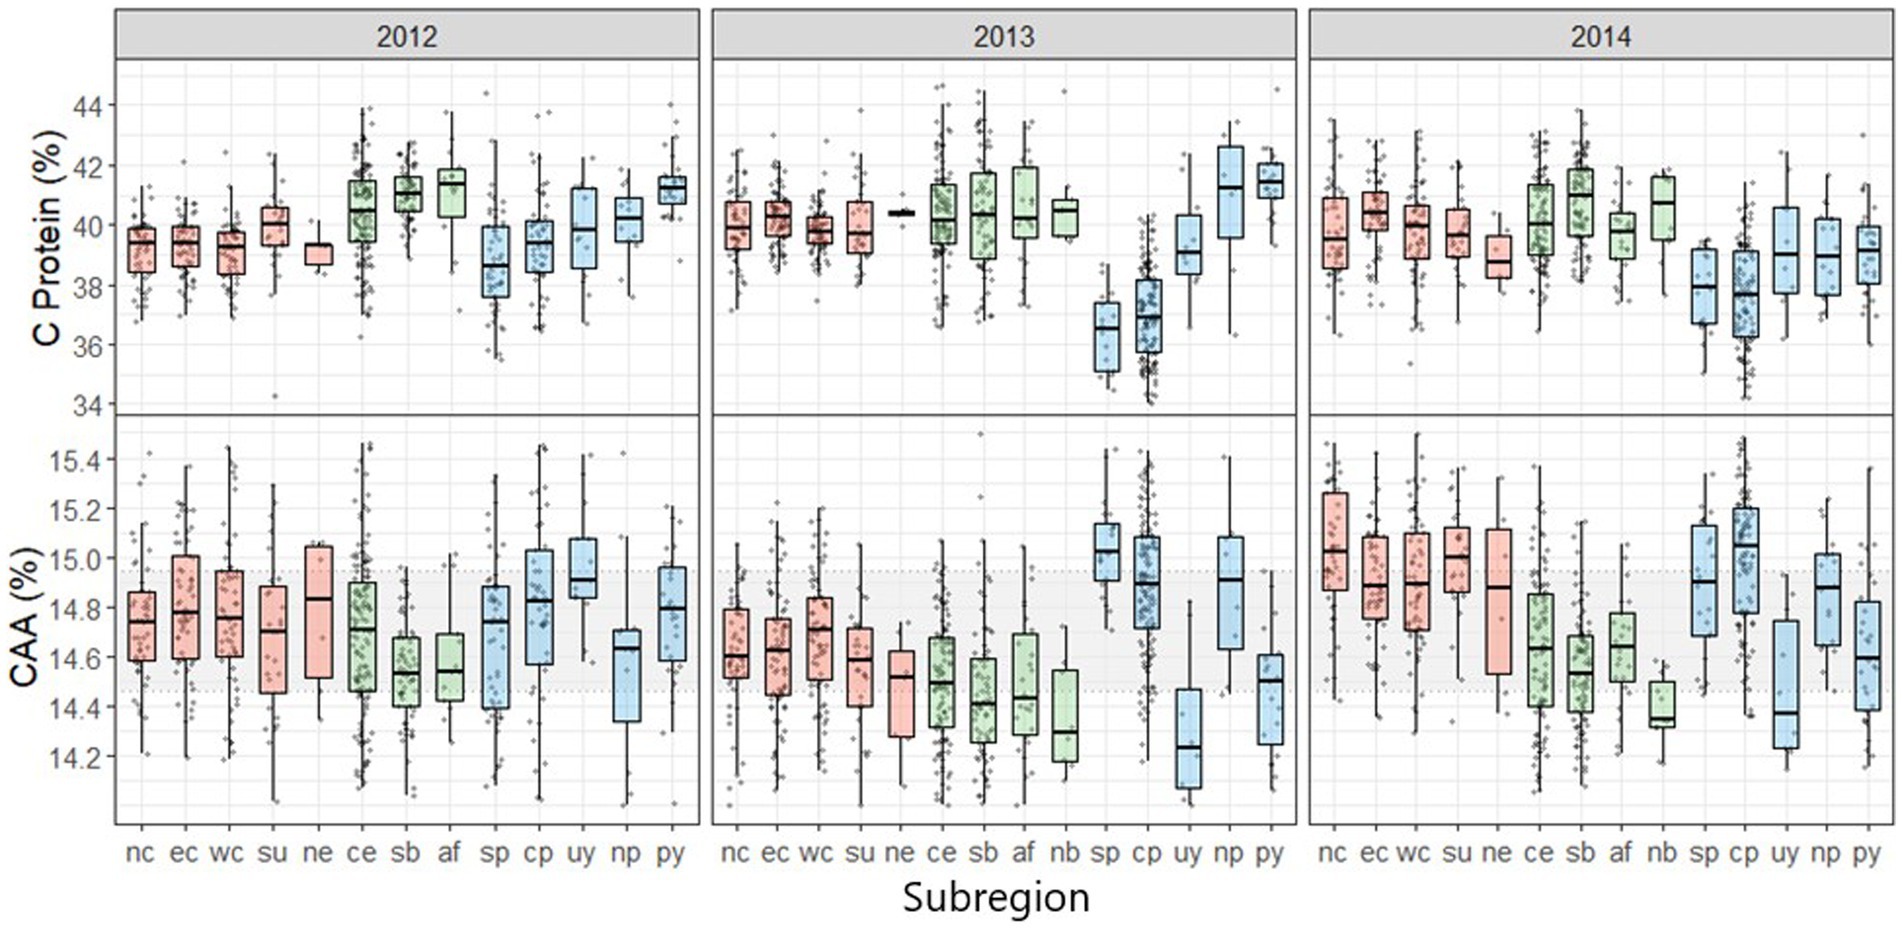
Figure 3. Mean and distribution for soybean crude protein concentration and the abundance of the most critical amino acids (CAA) in protein for different subregions within the United States, Brazil, and the Southern Cone based on on-farm samples collected between 2012 and 2014 cropping seasons. The subregions are as follows: United States (red)- Northern Corn Belt (nc), Eastern Corn Belt (ec), Western Corn Belt (wc), Northeast (ne), and South (su); Brazil (green)- Cerrado (ce), Southern Brazil (sb), Atlantic Forest (af), and Northern Brazil (nb); Southern Cone (blue)- Northern Pampas (np), Central Pampas (cp), Southern Pampas (sp), Paraguay (py), and Uruguay (uy). The gray strip contains the data between the 25th to the 75th quantile (50% of the data). Abundance of CAA was calculated as [(lysine + threonine + tryptophane + cysteine + methionine)/net protein] x 100.
3.2. Amino acid profile – spatial pattern
The relative abundance of the most limiting amino acids in protein was higher for the Southern Cone, intermediate for the United States, and lower for Brazil (Figure 2). The subregion and year interaction effect also affected this fraction, but as with protein concentrations, this effect explained a small proportion (less than 5%) of the total variation (Table 1 and Figure 3). For example, Uruguay in the Southern Cone during the 2012 and 2014 growing seasons showed a clear effect of the subregion and year interaction (Figure 3). When considering the most limiting amino acids individually, their abundance in protein was not consistently affected by the region or the subregion as the variance components for region and subregion generally captured a small proportion of the variation for each amino acid (Table 1). Year was an important source of variation for the relative amount of some relevant amino acids, such as threonine and tryptophane. The interaction between region and year explained almost a third and a fifth of the variation in the abundance of lysine and tryptophane in protein, respectively (Table 1). The effect of the subregion and year interaction on the abundance of individual amino acids in protein was mostly significant, but it explained a small proportion (less than 5%) of the total variation (Table 1).
3.3. Amino acid profile – relationships among grain constituents
Principal component analysis allowed us to explore relationships among amino acid abundance in protein and other grain constituents (Figure 4). From the principal component analysis performed, principal components (PC) 1 and 2 explained 52% of the total variation (Figure 4), and with the inclusion of PC3 and PC4, the explained variability increased to 72% (data not shown). PC1 indicated that the abundance of most critical amino acids in protein was negatively associated with protein concentration. To evaluate this relationship, we performed separate linear regression analyzes for each region, utilizing bootstrapping with reposition to compare slopes and intercepts. Our results indicated overlapping confidence intervals across all three regions (data not shown), thus justifying the use of a unique linear regression analysis to assess the relationship between these grain components (Figure 5). Abundance of most limiting amino acids decreased 0.7% for each percentage point increase in protein (R2 = 0.26, p < 0.001). Principal component analysis also showed that when grouping amino acids by their biosynthetic pathway, alpha-ketoglutarate derived amino acids (arginine, glutamine, proline, histidine) abundance was negatively associated with that for oxaloacetate derived ones (lysine, methionine, threonine, isoleucine), and positively associated with protein concentration (Figure 4). The pool of alpha-ketoglutarate derived amino acids increased proportionally more than the pool of oxaloacetate derived amino acids as crude protein increased (Figure 6). In accordance, lysine and arginine were the most responsive to protein variation in the oxaloacetate and the alpha-ketoglutarate pathways, respectively. Lysine abundance in protein was negatively (r = −0.45, p < 0.001) and arginine was positively (r = 0.58, p < 0.001) correlated with crude protein concentration (data not shown). Accordingly, the ratio lysine/arginine decreased sharply with the increase in protein concentration (Supplementary Figure S1). Oil and carbohydrate concentrations did not help to explain the amino acid profile (Figure 4).
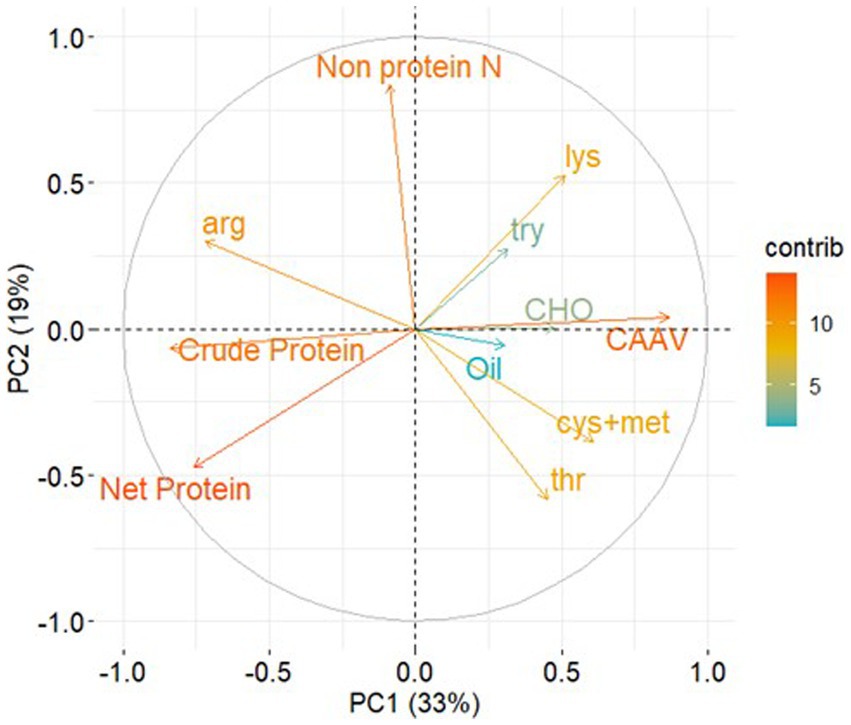
Figure 4. Biplot derived from principal component analysis (PCA) for grain compositional variables for soybean, including crude protein, net protein, oil, carbohydrates (CHO), and non-protein N, expressed as a fraction of the grain. The amino acids lysine, threonine, tryptophane, cysteine + methionine, arginine, and the sum of the most critical amino acid (CAA = lysine + threonine + tryptophane + cysteine + methionine) are expressed as a fraction of net protein, were also included. The color of the arrows indicates the contribution of each variable to the first two dimensions of the PCA. The data used for this biplot analysis consisted of 1,817 samples collected across the Western Hemisphere between 2012 and 2014.

Figure 5. Abundance of the most critical amino acids (CAA) in protein as a function of protein concentration in grain. Abundance of CAA was calculated as [(lysine + threonine + tryptophane + cysteine + methionine)/net protein] x 100. The linear regression is presented by the red dotted line (R2 = 0.27; y = 0.18 – x0.00096; p < 0.001). The black dotted lines connect points on the graph representing equal amounts of CAA per ton of grain.
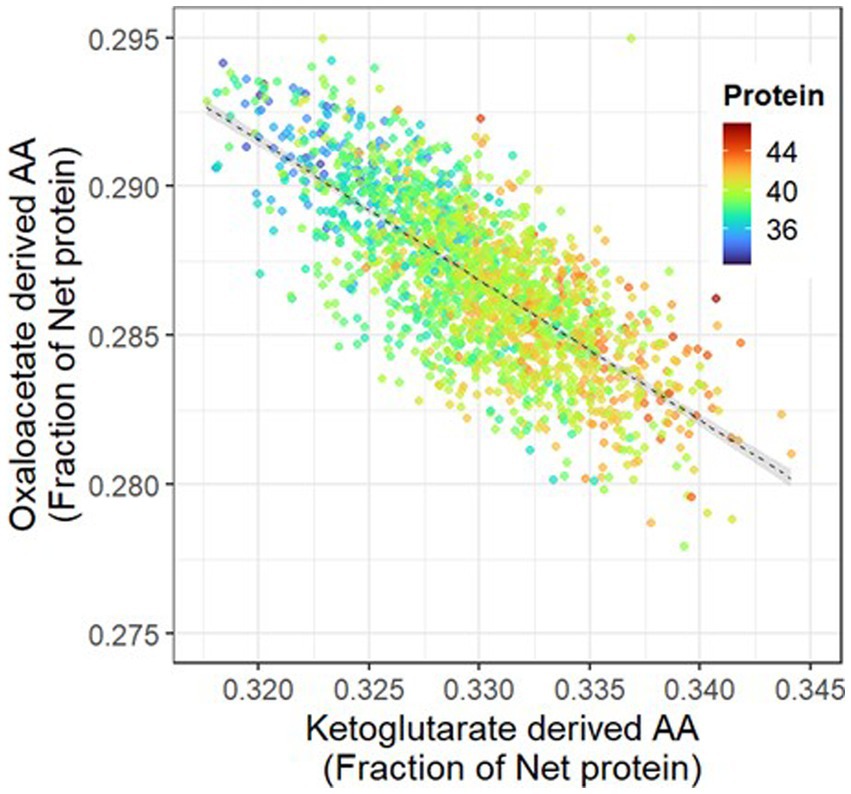
Figure 6. Abundance of oxaloacetate-derived amino acids (lysine, methionine, threonine, isoleucine, asparagine) as a function of the abundance of ketoglutarate-derived amino acids (arginine, glutamate, proline, histidine) in soybean grain protein. Color gradient indicates grain crude protein concentration (%). The linear regression is presented by the dotted line (R2 = 0.55, y = 44–0.47x, p < 0.001), with the 95% confidence interval shaded in gray. The data is based on 1,817 samples collected across the Western Hemisphere between 2012–2014. *Glutamate is glutamate + glutamine.
3.4. Protein and amino acid production capacity
Combining protein concentration and amino acid profile data with the soybean production projected by 2030, we have estimated that the Western Hemisphere’s protein production capacity could reach approximately 120 million metric tons annually. Furthermore, our analysis suggests that the combined production of the most critical amino acids could approach 17 million metric tons per year (Table 2). Projected protein and critical amino acids production was also estimated at region (Table 2) and subregion (Figure 7 and Supplementary Table S3) levels.
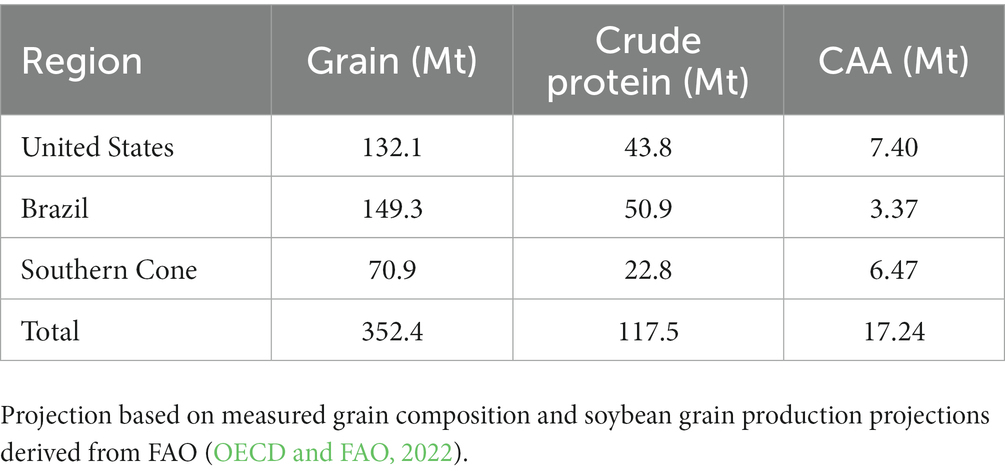
Table 2. Projected annually production of soybean, grain crude protein, and the sum of the most critical amino acids (CAA = lysine + threonine + tryptophan + cysteine + methionine) in the Western Hemisphere by 2030 expressed in megatons (Mt).
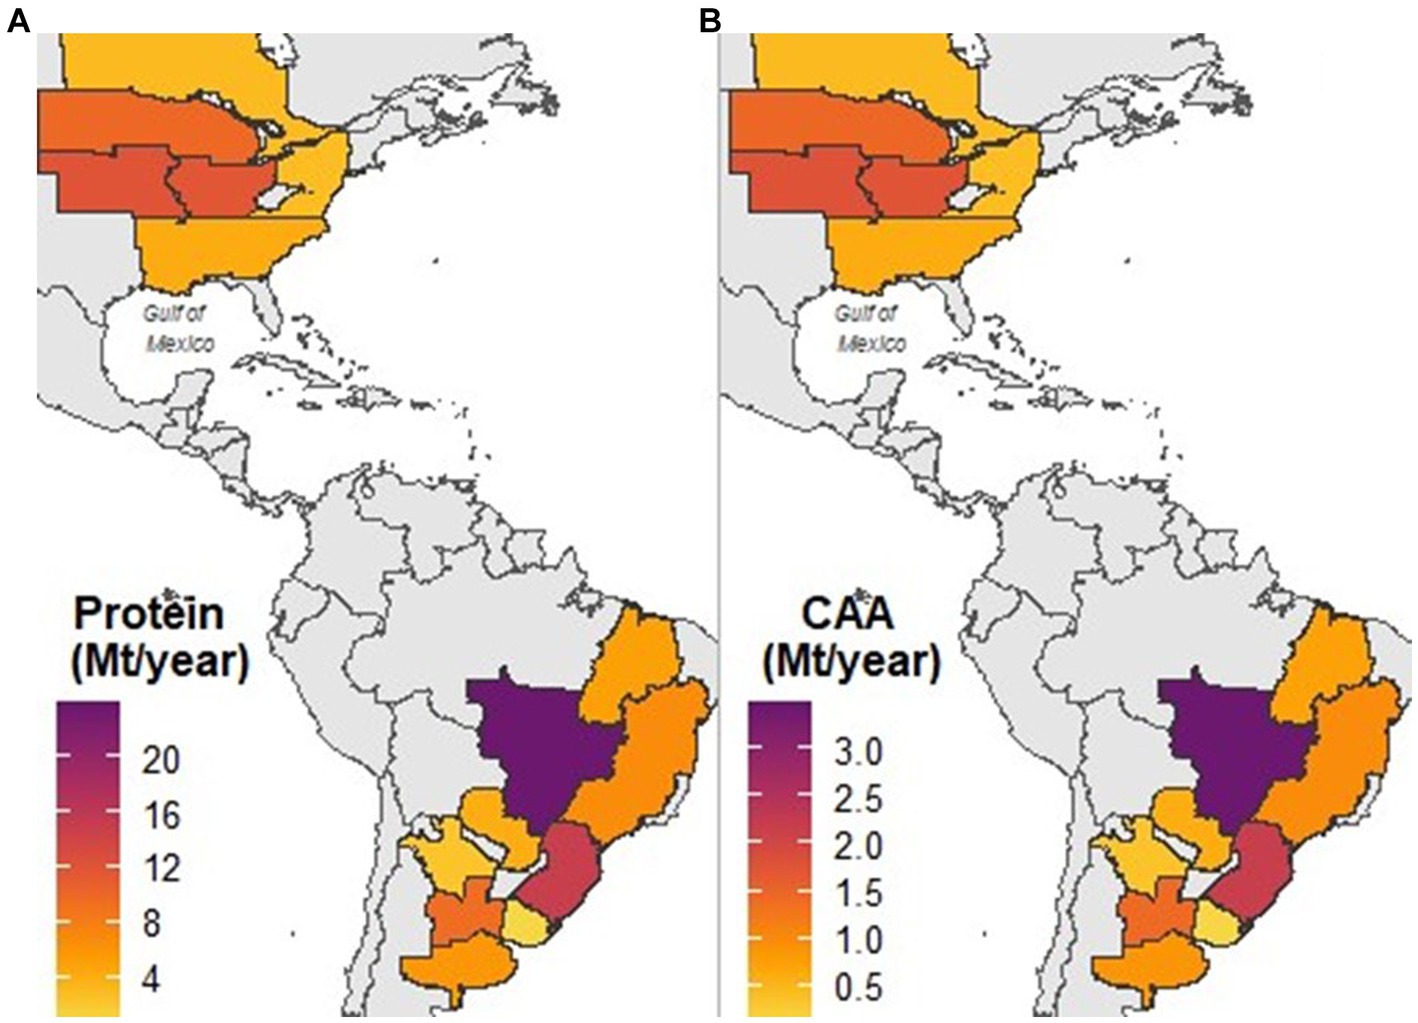
Figure 7. Projected crude protein (A) and most critical amino acids (lysine, threonine, tryptophan, cysteine, and methionine); (B) production for different cropping subregions across the Western Hemisphere by the year 2030. The projections are based on the presented grain composition analysis and projections for soybean grain production at a country level obtained from OECD and FAO (2022).
4. Discussion
Major soybean cropping regions and subregions were sampled according to their contribution to total grain production. This original method allowed us to create realistic comparisons of grain composition. In this way, the study stands out as the first comprehensive examination of protein and amino acid profiles in soybeans across the entire Americas, surpassing previous research that primarily focused on individual country-level analyzes. Furthermore, this research pioneered the exploration of novel relationships among the most relevant amino acids and protein for soybean production systems, shedding new light on their complex interactions. Additionally, our study breaks new ground by providing valuable insights into the continent’s protein production capacity, an essential component of global soybean production, which has not been addressed in prior literature. This crucial perspective offers unique implications for the agricultural industry and food security on a global scale.
Our study revealed a consistent spatial pattern for crude protein concentration in soybeans across the United States, Brazil, and the Southern Cone soybean-producing regions. Brazil produced 2.0 and 5.4% more protein per ton of grain than the United States and the Southern Cone, respectively (Figure 2). Within the Southern Cone, we observed notable differences in protein concentrations among subregions, with a consistently higher crude protein concentration in the Northern Pampas, Paraguay, and Uruguay compared to the Southern and Central Pampas (Figure 3). In contrast, a relatively lower variability among subregions was found within the United States and Brazil.
It’s worth noting that the market perceived soybeans from the U.S. Northern Cornbelt to have lower protein concentrations, leading to trading discounts for soybeans shipped at Pacific Northwest (Hertsgaard et al., 2019; William et al., 2020). This concept is also supported by an older study by Hurburgh et al. (1990) which found that protein for soybean from the northern states were 1.5 to 2 percentage points lower compared to that from central states. However, from our dataset the effect was not consistent across years, and on average, soybeans produced in the Northern Corn Belt region had only 0.5 percentage points lower protein concentration than the other regions examined (Table 1 and Figure 3). This last difference aligns with more recent studies on soybean protein patterns across the United States (Rotundo et al., 2016; Assefa et al., 2019).
Crude protein content of commercial soybeans is typically determined by nitrogen combustion and multiplying the result by a conversion factor of 6.25 (Krul, 2019). Our analysis showed that this method overestimated the net protein content by an average of 3%, due to the presence of non-protein nitrogen fractions (Figure 2 and Supplementary Table S1). This finding is consistent with previous studies that were based on a more limited number of samples (Krober and Gibbons, 1962; Thakur and Hurburgh, 2007). Relaying solely on crude protein content can be misleading when assessing soybean meal quality, especially for monogastric animals that cannot utilize non-protein nitrogen fractions. Additional methods for evaluating the quality of soybean meal should be considered.
The protein amino acid profile in soybean exhibited consistent differences across regions, as shown in Table 1 and Figure 3. Among the assessed samples, the abundance of the most limiting amino acids varied up to 8.5% (Figures 3, 5), with the Southern Cone having the highest abundance. The ranking among subregions was season-dependent, but averaged across years, the Central and Southern Pampas subregions showed the highest limiting amino acids abundance (Figure 3). Limiting amino acids concentration variability was also highest for the Southern Cone (Figures 3, 4), suggesting that soybeans from the United States and Brazil may be more consistent and predictable in their amino acid profile. Understanding and predicting this variability could be relevant to adequate production according to market or industry requirements.
While being aware of the potential correlations between subregions and regions, our initial analysis, as presented in Figure 5, provided a valuable starting point for understanding relevant relationships between grain components. Critical amino acids abundance in protein was reduced when protein content increased. This dilution effect has been previously reported (Thakur and Hurburgh, 2007; Medic et al., 2014; Pfarr et al., 2018) but never using such a wide spectrum of samples. The implications of this dilution process on the nutritional value of the protein (Tessari et al., 2016) are significant and warrant further investigation. A higher abundance of the most limiting amino acids in protein would lead to a higher conversion efficiency of protein in meat (kg meat/kg protein; Selle et al., 2020). Soybean meal made from low protein soybeans produced in the Central and Southern Pampas would likely have a higher efficiency to convert protein in meat than a meal made from high protein soybeans produced in Brazil or the United States, which could be relevant from a sustainability standpoint (Pomar et al., 2021). Conversely our data showed that increasing protein concentration, though more diluted, also increased the amount of the most critical amino acids per ton of grain (Figure 5). Thus, meals made from higher protein concentration soybeans, like those produced in Brazil or the United States, would likely present a higher conversion efficiency of meal in meat (kg meat/kg meal) than meals made from lower protein concentration soybeans like those from the Central and Southern Pampas.
Our data revealed a strong negative association (R2 = −0.55, p < 0.001) between oxaloacetate path-derived amino acids (lysine, methionine, threonine, isoleucine, asparagine) and alpha-ketoglutarate path-derived amino acids (arginine, glutamine, proline, histidine) in protein (Figure 6). Increasing protein concentration resulted in a greater increase in alpha-ketoglutarate pathway-derived amino acids compared to amino acids derived from the aspartate pathway. This association was primarily driven by an increase in arginine abundance and a decrease in lysine (Supplementary Figure S1) and is consistent with results from controlled experiments on soybean seed protein concentration alteration (Pfarr et al., 2018).
Arginine, with the highest N content per mass unit (32%), is a major nitrogen storage and transport molecule in plants (Winter et al., 2015). Conditions of abundant reduced N may promote the synthesis of this amino acid, which can store large quantities of N per unit of protein to support future N requirements of seedling. What is relevant from a feed end-use standpoint is that using the reduced nitrogen to produce a gram of arginine would allow the plant to synthesize almost twice the amount of lysine and tryptophane, three times the threonine and cysteine, and four times more methionine (Tillman, 2019). Understanding the physiological basis, limits, and control of these relationships among amino acids through breeding, genetic engineering, or crop management could provide a via to increase soybean protein value by adapting the amino acid profile according to its end-use.
This study represents a significant step towards a comprehensive understanding of the variation in soybean seed composition at a regional scale in the Western Hemisphere. However, to achieve a more complete and accurate prediction of soybean composition, further research is required to investigate the physiological processes involved. While recent studies have shed light on the factors that impact soybean seed protein concentration (Piper and Boote, 1999; Carrera et al., 2009; Rotundo and Westgate, 2009; Anthony et al., 2012; Pfarr et al., 2018; Bosaz et al., 2019), more research is needed to fully elucidate the control of the amino acid profile. Nonetheless, the extensive and high-quality dataset of grain composition presented in this study (Supplementary Table S2) can be a valuable resource for validating emerging conceptual frameworks and modeling tools in this field.
By 2030, soybean production in the Western Hemisphere is expected to reach 352 Mt, accounting for 86% of global soybean production (OECD and FAO, 2022). Based on this forecast, we projected the protein production capacity of the region to be approximately 120 Mt, containing only 17 Mt. of the most limiting amino acids for monogastric diets. While our estimations are subject to uncertainties, we used the best available data to estimate the protein and amino acid production capacity of the Western Hemisphere. Brazil is projected to be the most important region for soybean protein production (Table 2), driven by high soybean grain production and protein concentration (Figure 3). Notably, the Cerrado subregion alone could produce almost 20% of the soybean protein in the Western Hemisphere. These findings have important implications for addressing global challenges related to producing enough protein for feed and food protein markets (Kim et al., 2019; Guthman et al., 2022).
Finally, while our study focused on analyzing the protein concentration and amino acid profile of soybeans in the Western Hemisphere, it’s important to note that the complete nutritional and economic value of soybean grain includes not only the protein fraction but also the carbohydrate and the oil fractions (Medic et al., 2014). Therefore, to fully assess the value of soybean grain produced in different regions or its potential applications in various industries, it’s essential to consider not only the protein but also the oil and carbohydrates fractions of the grain.
5. Conclusion
This study presented a novel method for assessing soybean grain composition across the Western Hemisphere. Spatial processes played a relevant role in determining protein concentration, which exhibit a consistent pattern across the major soybean-producing regions. The analysis also uncovered differences in the amino acid profile across regions and established relationships among relevant amino acids which could be relevant for markets and industries. The generated dataset should be relevant for researchers seeking to understand processes involved in grain composition determination. Lastly, the study projected global soybean protein and amino acid production capacities for this major region by 2030, which is highly relevant to analyzing the global challenges of producing enough food. Overall, this research provides valuable information for industry, markets, and researchers useful as a benchmark for soybean grain composition across the Western Hemisphere.
Data availability statement
The original contributions presented in the study are included in the article/Supplementary material, further inquiries can be directed to the corresponding author.
Author contributions
AC: conceptualization, data curation, formal analysis, investigation, methodology, visualization, and writing – original draft. JM-G: writing – review & editing. SN: conceptualization, investigation, methodology, funding acquisition, and writing – review & editing. All authors contributed to the article and approved the submitted version.
Funding
The United Soybean Board (USB) provided funding to support the conducted analysis.
Conflict of interest
The authors declare that the research was conducted in the absence of any commercial or financial relationships that could be construed as a potential conflict of interest.
Publisher’s note
All claims expressed in this article are solely those of the authors and do not necessarily represent those of their affiliated organizations, or those of the publisher, the editors and the reviewers. Any product that may be evaluated in this article, or claim that may be made by its manufacturer, is not guaranteed or endorsed by the publisher.
Supplementary material
The Supplementary material for this article can be found online at: https://www.frontiersin.org/articles/10.3389/fsufs.2023.1223921/full#supplementary-material
Footnotes
References
Anthony, P., Malzer, G., Sparrow, S., and Zhang, M. (2012). Soybean yield and quality in relation to soil properties. Agron. J. 104, 1443–1458. doi: 10.2134/agronj2012.0095
Assefa, Y., Bajjalieh, N., Archontoulis, S., Casteel, S., Davidson, D., Kovács, P., et al. (2018). Spatial characterization of soybean yield and quality (amino acids, oil, and protein) for United States. Sci. Rep. 8:14653. doi: 10.1038/s41598-018-32895-0
Assefa, Y., Purcell, L. C., Salmeron, M., Naeve, S., Casteel, S. N., Kovács, P., et al. (2019). Assessing variation in US soybean seed composition (protein and oil). Front. Plant Sci. 10:298. doi: 10.3389/fpls.2019.00298
Attia, Y. A., Bovera, F., Wang, J., Al-Harthi, M. A., and Kim, W. K. (2020). Multiple amino acid supplementations to low-protein diets: effect on performance, carcass yield, meat quality and nitrogen excretion of finishing broilers under hot climate conditions. Animals 10:973. doi: 10.3390/ani10060973
Bakare, M. A., Kayondo, S. I., Aghogho, C. I., Wolfe, M. D., Parkes, E. Y., Kulakow, P., et al. (2022). Exploring genotype by environment interaction on cassava yield and yield related traits using classical statistical methods. PLoS One 17:e0268189. doi: 10.1371/journal.pone.0268189
Ball, R. O., Courtney-Martin, G., and Pencharz, P. B. (2006). The in vivo sparing of methionine by lysteine in sulfur amino acid requirements in animal models and adult humans. J. Nutr. 136, 1682S–1693S. doi: 10.1093/jn/136.6.1682S
Bosaz, L. B., Gerde, J. A., Borrás, L., Cipriotti, P. A., Ascheri, L., Campos, M., et al. (2019). Management and environmental factors explaining soybean seed protein variability in Central Argentina. Field Crop Res. 240, 34–43. doi: 10.1016/j.fcr.2019.05.007
Breene, W. M., Lin, S., Hardman, L., and Orf, J. (1988). Protein and oil content of soybeans from different geographic locations. J. Am. Oil Chem. Soc. 65, 1927–1931. doi: 10.1007/BF02546009
Carrera, C., Martínez, M. J., Dardanelli, J., and Balzarini, M. (2009). Water deficit effect on the relationship between temperature during the seed fill period and soybean seed oil and protein concentrations. Crop Sci. 49, 990–998. doi: 10.2135/cropsci2008.06.0361
Carrera, C. S., Rosas, M. B., Gontijo Mandarino, J. M., Leite, R. S., Raspa, F., Fava, F., et al. (2022). Partial and total defoliation during the filling period affected grain industrial and nutraceutical quality in soybean. J. Sci. Food Agric. 102, 4109–4120. doi: 10.1002/jsfa.11760
FAO Faostat . (2022). Statistics database of the food and agriculture organization of the United Nations. Available at: http://www.fao.org/statistics/databases/en/
Godfray, H. C. J., and Garnett, T. (2014). Food security and sustainable intensification. Philos. Trans. R. Soc. Lond. Ser. B Biol. Sci. 369:20120273. doi: 10.1098/rstb.2012.0273
Goldsmith, P. D., Gunjal, K., and Ndarishikanye, B. (2004). Rural–urban migration and agricultural productivity: the case of Senegal. Agric. Econ. 31, 33–45. doi: 10.1111/j.1574-0862.2004.tb00220.x
Guthman, J., Butler, M., and Martin, S. J. (2022). In the name of protein. Nat. Food 3, 391–393. doi: 10.1038/s43016-022-00532-9
Hertsgaard, D. J., Wilson, W. W., and Dahl, B. (2019). Costs and risks of testing and blending for essential amino acids in soybeans. Agribusiness 35, 265–280. doi: 10.1002/agr.21576
Hurburgh, C. R. Jr., Brumm, T. J., Guinn, J. M., and Hartwig, R. A. (1990). Protein and oil patterns in US and world soybean markets. J. Am. Oil Chem. Soc. 67, 966–973. doi: 10.1007/BF02541859
Ju, J., Banfelder, J., and Skrabanek, L. (2019). Quantitative understanding in biology principal component analysis. Available at: https://physiology.med.cornell.edu/people/banfelder/qbio/lecture_notes/3.4_Principal_component_analysis.pdf
Kim, S. W., Less, J. F., Wang, L., Yan, T., Kiron, V., Kaushik, S. J., et al. (2019). Meeting global feed protein demand: challenge, opportunity, and strategy. Annu. Rev. Anim. Biosci. 7, 221–243. doi: 10.1146/annurev-animal-030117-014838
Kovalenko, I. V., Rippke, G. R., and Hurburgh, C. R. (2006). Determination of amino acid composition of soybeans (Glycine max) by near-infrared spectroscopy. J. Agric. Food Chem. 54, 3485–3491. doi: 10.1021/jf052570u
Krober, O. A., and Gibbons, S. J. (1962). Composition of feedstuffs, nonprotein nitrogen in soybeans. J. Agric. Food Chem. 10, 57–59. doi: 10.1021/jf60119a019
Krul, E. S. (2019). Calculation of nitrogen-to-protein conversion factors: a review with a focus on soy protein. J. Sci. Food Agric. 96, 339–364. doi: 10.1002/aocs.12196
Lê, S., Josse, J., and Husson, F. (2008). FactoMineR: an R package for multivariate analysis. J. Stat. Softw. 25, 1–18. doi: 10.18637/jss.v025.i01
Marin, F. R., Zanon, A. J., Monzon, J. P., Andrade, J. F., Silva, E. H., Richter, G. L., et al. (2022). Protecting the Amazon forest and reducing global warming via agricultural intensification. Nat. Sust. 5, 1018–1026. doi: 10.1038/s41893-022-00968-8
Medic, J., Atkinson, C., and Hurburgh, C. R. (2014). Current knowledge in soybean composition. J. Sci. Food Agric. 91, 363–384. doi: 10.1007/s11746-013-2407-9
Messina, M. (2022). Perspective: soybeans can help address the caloric and protein needs of a growing global population. Front. Nutr. 9:909464. doi: 10.3389/fnut.2022.909464
Osborne, T. B., Mendel, L. B., Ferry, E. L., and Wakeman, A. J. (1914). Amino-acids in nutrition and growth. J. Biol. Chem. 17, 325–349. doi: 10.1016/S0021-9258(18)88398-3
Park, H., and Hurburgh, C. (2002). Improving the US position in world soybean meal trade. Center for Agricultural and Rural Development (CARD) at Iowa State University. Available at: http://lib.dr.iastate.edu/cgi/viewcontent.cgi?article=1006&context=matric_workingpapers
Pfarr, M. D., Kazula, M. J., Miller-Garvin, J. E., and Naeve, S. L. (2018). Amino acid balance is affected by protein concentration in soybean. Crop Sci. 58, 2050–2062. doi: 10.2135/cropsci2017.11.0703
Piper, E. L., and Boote, K. I. (1999). Temperature and cultivar effects on soybean seed oil and protein concentrations. J. Sci. Food Agric. 76, 1233–1241. doi: 10.1007/s11746-999-0099-y
Pomar, C., Andretta, I., and Remus, A. (2021). Feeding strategies to reduce nutrient losses and improve the sustainability of growing pigs. Front. Vet. Sci. 8:742220. doi: 10.3389/fvets.2021.742220
Pope, M., Borg, B., Boyd, R. D., Holzgraefe, D., Rush, C., and Sifri, M. (2023). Quantifying the value of soybean meal in poultry and swine diets. J. Appl. Poult. Res. 32:100337. doi: 10.1016/j.japr.2023.100337
R Core Team (2021). R: A language and environment for statistical computing. Available at: http://r.meteo.uni.wroc.pl/web/packages/dplR/vignettes/intro-dplR.pdf
Ravindran, V., Abdollahi, M., and Bootwalla, S. (2014). Nutrient analysis, apparent metabolisable energy and ileal amino acid digestibility of full fat soybean for broilers. Anim. Feed Sci. Technol. 197, 233–240. doi: 10.1016/j.anifeedsci.2014.08.014
Ricard, M. F., Mayer, M. A., and Viglizzo, E. F. (2022). The impact of beef and soybean protein demand on carbon emissions in Argentina during the first two decades of the twenty-first century. Environ. Sci. Pollut. Res. Int. 29, 20939–20946. doi: 10.1007/s11356-021-16744-8
Rotundo, J. L., and Westgate, M. E. (2009). Meta-analysis of environmental effects on soybean seed composition. Field Crop Res. 110, 147–156. doi: 10.1016/j.fcr.2008.07.012
Rotundo, J. L., Borrás, L., De Bruin, J., and Pedersen, P. (2014). Soybean nitrogen uptake and utilization in Argentina and United States cultivars. Crop Sci. 54, 1153–1165. doi: 10.2135/cropsci2013.09.0618
Rotundo, J. L., Miller-Garvin, J. E., and Naeve, S. L. (2016). Regional and temporal variation in soybean seed protein and oil across the United States. Crop Sci. 56, 797–808. doi: 10.2135/cropsci2015.06.0394
Schuetzenmeister, A., Dufey, F., Schuetzenmeister, M. A., and Suggests, V. F. P., (2022). Package ‘VCA’.
Selle, P. H., Dorigam, J. C. D. P., Lemme, A., Chrystal, P. V., and Liu, S. Y. (2020). Synthetic and crystalline amino acids: alternatives to soybean meal in chicken-meat production. Animals 10:729. doi: 10.3390/ani10040729
Song, W., Yang, R., Wu, T., Wu, C., Sun, S., Zhang, S., et al. (2016). Analyzing the effects of climate factors on soybean protein, oil contents, and composition by extensive and high-density sampling in China. J. Agric. Food Chem. 64, 4121–4130. doi: 10.1021/acs.jafc.6b00008
Song, X. P., Hansen, M. C., Potapov, P., Adusei, B., Pickering, J., Adami, M., et al. (2021). Massive soybean expansion in South America since 2000 and implications for conservation. Nat. Sust. 4, 784–792. doi: 10.1038/s41893-021-00729-z
Tessari, P., Lante, A., and Mosca, G. (2016). Essential amino acids: master regulators of nutrition and environmental footprint? Sci. Rep. 6, 1–13. doi: 10.1038/srep26074
Thakur, M., and Hurburgh, C. R. (2007). Quality of US soybean meal compared to the quality of soybean meal from other origins. J. Sci. Food Agric. 84, 835–843. doi: 10.1007/s11746-007-1107-8
Tillman, P. B. (2019). Determination of nutrient values for commercial amino acids. J. Appl. Poult. Res. 28, 526–530. doi: 10.3382/japr/pfz010
Waguespack, S., Powell, T. D., Bidner, R. L., and Payne, L. L. (2009). Southern, effect of incremental levels of L-lysine and determination of the limiting amino acids in low crude protein corn-soybean meal diets for broilers1. Poult. Sci. 88, 1216–1226. doi: 10.3382/ps.2008-00452
William, W., Dahl, B., and Hertsgaard, D. (2020). Soybean quality differentials, blending, testing and spatial arbitrage. J. Commod. Mark. 18:100095. doi: 10.1016/j.jcomm.2019.100095
Winter, G., Todd, C. D., Trovato, M., Forlani, G., and Funck, D. (2015). Physiological implications of arginine metabolism in plants. Front. Plant Sci. 6:534. doi: 10.3389/fpls.2015.00534
Keywords: grain composition, amino acid profile, essentials amino acids, crude protein, spatial pattern, Western Hemisphere
Citation: Cerrudo A, Miller-Garvin J and Naeve SL (2023) Western Hemisphere quality and production capacity of soybean protein. Front. Sustain. Food Syst. 7:1223921. doi: 10.3389/fsufs.2023.1223921
Edited by:
Krishnanand P. Kulkarni, Delaware State University, United StatesReviewed by:
Sapna Langyan, Indian Council of Agricultural Research (ICAR), IndiaSomak Dutta, Iowa State University, United States
Copyright © 2023 Cerrudo, Miller-Garvin and Naeve. This is an open-access article distributed under the terms of the Creative Commons Attribution License (CC BY). The use, distribution or reproduction in other forums is permitted, provided the original author(s) and the copyright owner(s) are credited and that the original publication in this journal is cited, in accordance with accepted academic practice. No use, distribution or reproduction is permitted which does not comply with these terms.
*Correspondence: Anibal Cerrudo, Y2VycnUwMDZAdW1uLmVkdQ==