 V. N. Mathinya
 A. C. Franke
 G. W. J. van de Ven
 K. E. Giller
- 1Department of Soil, Crop and Climate Sciences, University of the Free State, Bloemfontein, South Africa
- 2Plant Production Systems Group, Wageningen University and Research, Wageningen, Netherlands
Small-scale farming plays a critical role in the food security of Africa. An analysis of households in two former homelands provided critical insights into the future of small-scale farming in South Africa. From a survey of 132 households, 57 from Emmaus in the uKhahlamba local municipality in KwaZulu Natal Province and 75 from Thaba Nchu in the Mangaung Metropolitan municipality of the Free State province, indicators of food and nutrition security, income, and the relative contributions of on-farm versus off-farm sources to household welfare were calculated to determine if small-scale farming could drive the economy of these areas. Results revealed stark differences at household and regional levels and were attributed to the importance of crops vs. livestock toward household welfare and the proximity of the regions to urban centers. This was demonstrated by more reliance on arable farming in Emmaus, unlike Thaba Nchu, where a nearby city allowed diversification of income portfolios. In both regions, labor constraints outweighed land limitations. It is, therefore, unlikely that increasing arable land of small-scale farmers alone will stimulate arable farming. On-farm production and consumption did not guarantee nutrition and food security. Currently, small-scale farming did not serve as an engine for economic growth in the communities and formed a small part of the income of most households. However, sustainable intensification of farm production is a plausible pathway for the small number of households for whom farming forms an important part of their income. These households have the potential to engage in more commercial activities if farming and policies can be aligned. A critical knowledge gap is how, under what context, and which forms of agricultural interventions may complement rural development efforts and contribute to the rural economy.
1. Introduction
Sub-Saharan Africa (SSA) is, second to Asia, home to the largest population of hungry and poor people in the world. In SSA, 40% of the population survives on less than $1.90 a day (Boudet et al., 2021). The predominantly rural nature of poverty in SSA is apparent as approximately 80% of the extremely poor and 76% of the moderately poor live in rural areas, compared to only 44% of the non-poor (Castañeda et al., 2018). In these rural areas, land-based production activities are relied upon by communities to boost economic growth, eradicate poverty, and improve the livelihood quality of the less privileged, with agriculture in a dominant role (Ntsebeza and Hall, 2007). It is therefore not surprising that in most countries in SSA, including South Africa, rural development policies are based on the premise that both Sustainable Development Goals (SGD) 1 (End poverty in all its forms everywhere) and 2 (End hunger, achieve food security and improved nutrition and promote sustainable agriculture) can be achieved by revitalizing small-scale farming (NDP, 2013).
Small-scale farming in rural South Africa is a polarizing subject because of the country’s political history which burdened the agricultural landscape with connotations of race and race issues related to the apartheid segregation laws. As such these areas have continued to attract both political and academic interest. However, scholarly outputs improving our understanding of the dynamics and the role of small-scale farming systems in rural areas seem to have little impact on sound policy formulation and implementation. For example, despite a number of studies that suggest small-scale farming comprises a small part of rural livelihoods (Obi, 2011; D'Haese et al., 2013; Neves and du Toit, 2013), the national development plan (NDP) of South Africa still centralized it to the alleviation of hunger and poverty (NDP, 2013). Therefore, the note by the Voluntary National Review report of 2019 that hunger and poverty alleviation, as well as the creation of thriving rural livelihoods, remain elusive tasks for the country’s development (Matona, 2019), comes as no surprise.
Given the centrality of small-scale farmers to thriving rural livelihoods identified in the country’s NDP, empirical research to better understand the current diversity and context of this sector is important for several reasons. Firstly, it will enable improved program design leading to targeted intervention strategies. Secondly, it will assist with integrating small-scale farmers into the country’s economic activities. Thirdly, it will aid in leveraging resources that are already in place in rural communities for improved rural livelihoods (Larson et al., 2016). To this end, Ragie et al. (2020) documented trends of varied reliance on land-based income streams that demonstrated a relatively small contribution from crop production. Although this was single study in one province of the country, it counters the common perception that rural livelihoods are primarily derived from agriculture and other land-based activities.
While there is a growing literature that documents the constraints of small-scale farming in South Africa, as reviewed by Mathinya et al. (2022), the potential of these farming systems to drive rural development needs to be clarified. Empirical research is needed to understand the diversity of the livelihood strategies of small-scale farmers, how they define their work, how they operate, and what their aspirations are. Mathinya et al. (2022) argue that government investments to facilitate rural economic growth through the development of small-scale farming have failed to deliver the anticipated results due to a “wrong starting point.” They argue that the idea that small-scale farmers should participate in commercial value chains regardless of their context is flawed. Additionally, the assumption that small-scale farmers are a homogeneous group (Okunlola et al., 2016; Chapman et al., 2021) has contributed to the failure of governmental support programs on to deliver improvements in farming and livelihoods.
Against this background, our paper’s central question emerges: can small-scale farming serve as an engine for economic growth in rural areas? We attempt to answer this question by first describing the context and diversity of small-scale farming in terms of agricultural activities, the scale of production, and the dynamics of decision-making; and second, assessing the relative contribution of on-farm vs. off-farm activities to selected household welfare indicators that represent rural economic activity. This paper uses the term small-scale farmer to refer to all farmers with little formal commercial activity (Mathinya et al., 2022).
2. Materials and methods
2.1. Study sites
The study was conducted in two regions in eastern South Africa (Figure 1). These regions, Emmaus in Kwa-Zulu Natal (KZN) province and Thaba Nchu in the Free State (FS) province, are both former homelands and were part of the KwaZulu and Bophuthatswana homelands, respectively (Rogerson and Letsoalo, 1985). The study regions were purposely selected as they developed in a different independent governance context (Rogerson and Letsoalo, 1985), affecting these regions’ socio-economic development. In both regions, households could access land through tribal authorities and acquire an informal “permission to occupy” (PTO) with no individual ownership through title deeds (Bolliger, 2007). However, stands were randomly and unevenly distributed in Emmaus, while the approach was more formal in Thaba Nchu, resulting in equal and evenly distributed stands. The stands in Thaba Nchu were allocated in the Trust lands, which are rural areas in homelands that were formerly white-owned and bought up by the South African Native Trust for expanding and consolidating the “native reserves” (Naumann, 2014). Furthermore, land for communal farming was allocated away from these stands, while in Emmaus, communal farming lands were and still are integrated within allocated stands.
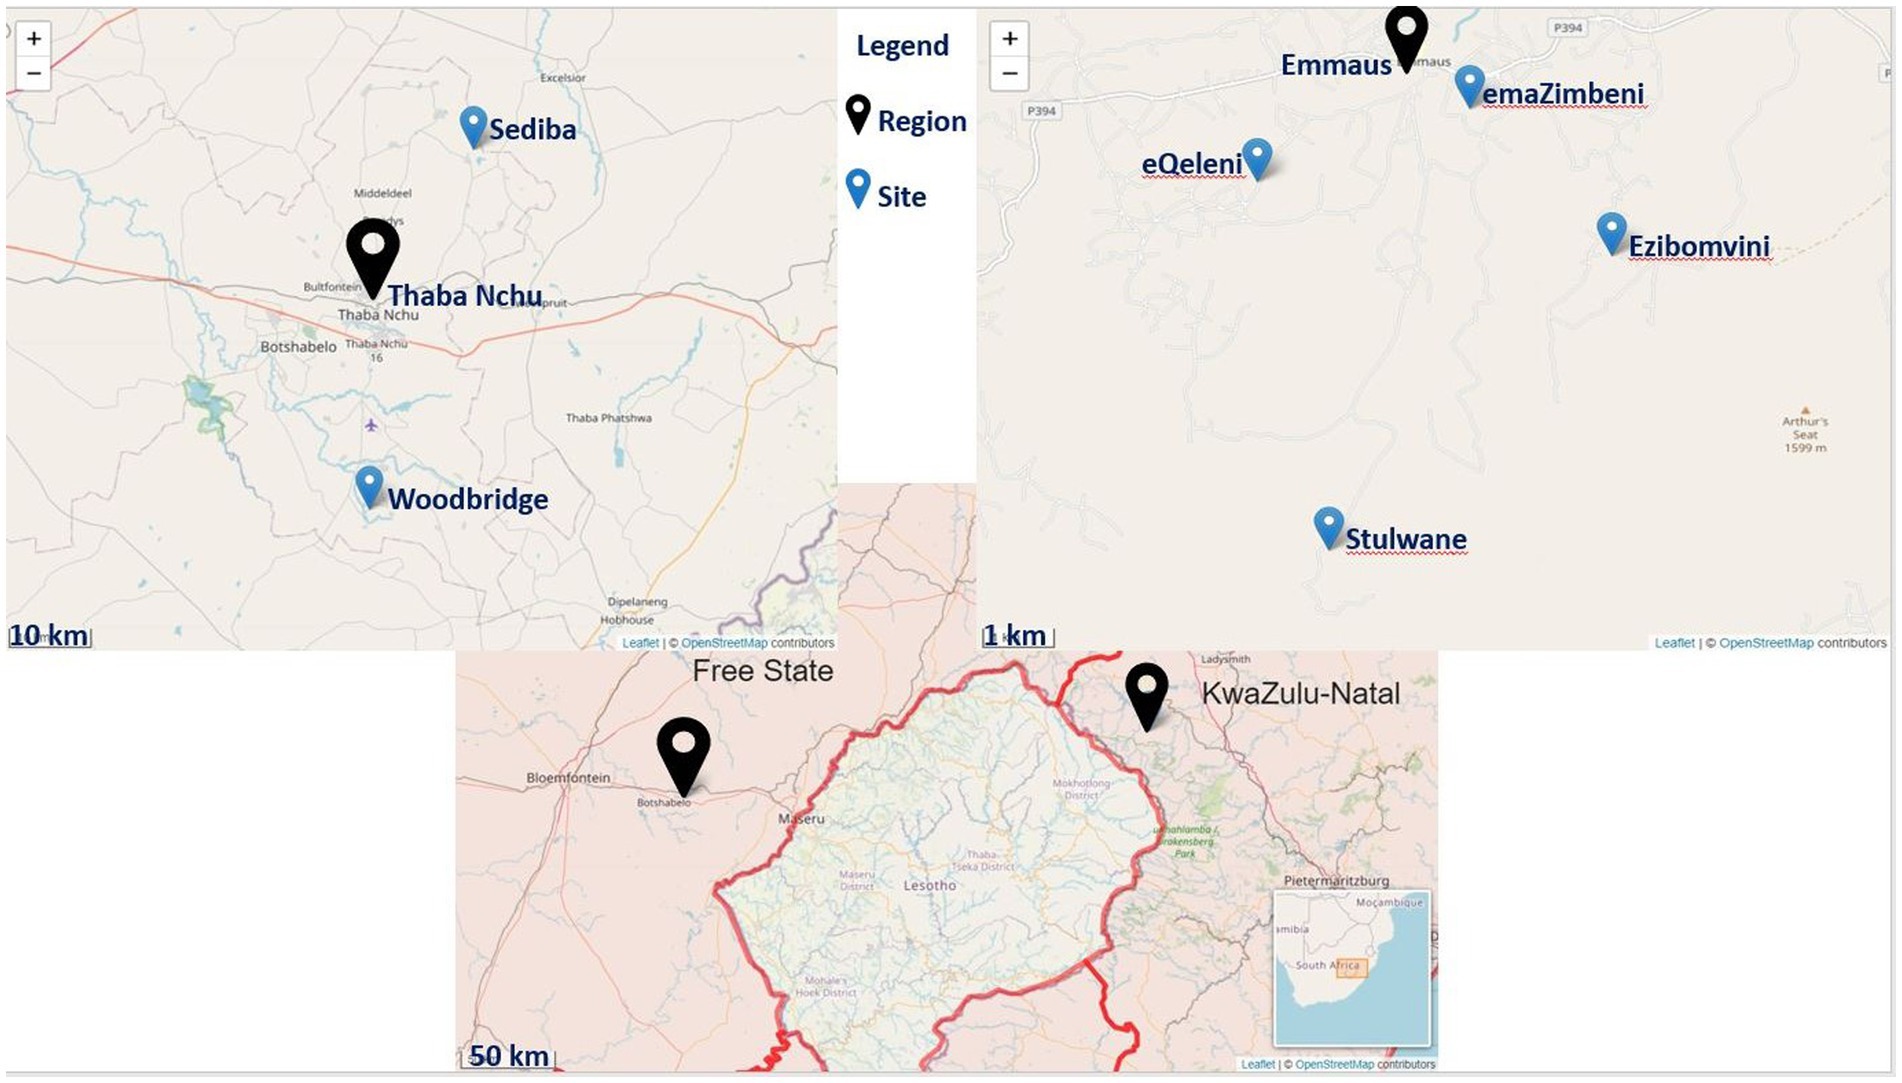
Figure 1. Location of the two study regions in the eastern parts of South Africa (Map was drawn in R Studio using household GPS Coordinates recorded during the survey, base maps with Leaflet JavaScript).
The specific study sites were four villages in the Emmaus region (Table 1), which were selected together with key informants based on easy access to the villages and prior knowledge of farmers’ willingness to participate in research activities. In the Thaba Nchu region, the study sites were two trust lands selected to encompass the range of governmental agricultural interventions introduced in the regions. In all study sites, contact with the first household was arranged by key informants and snowballing was used to identify further households for interview.
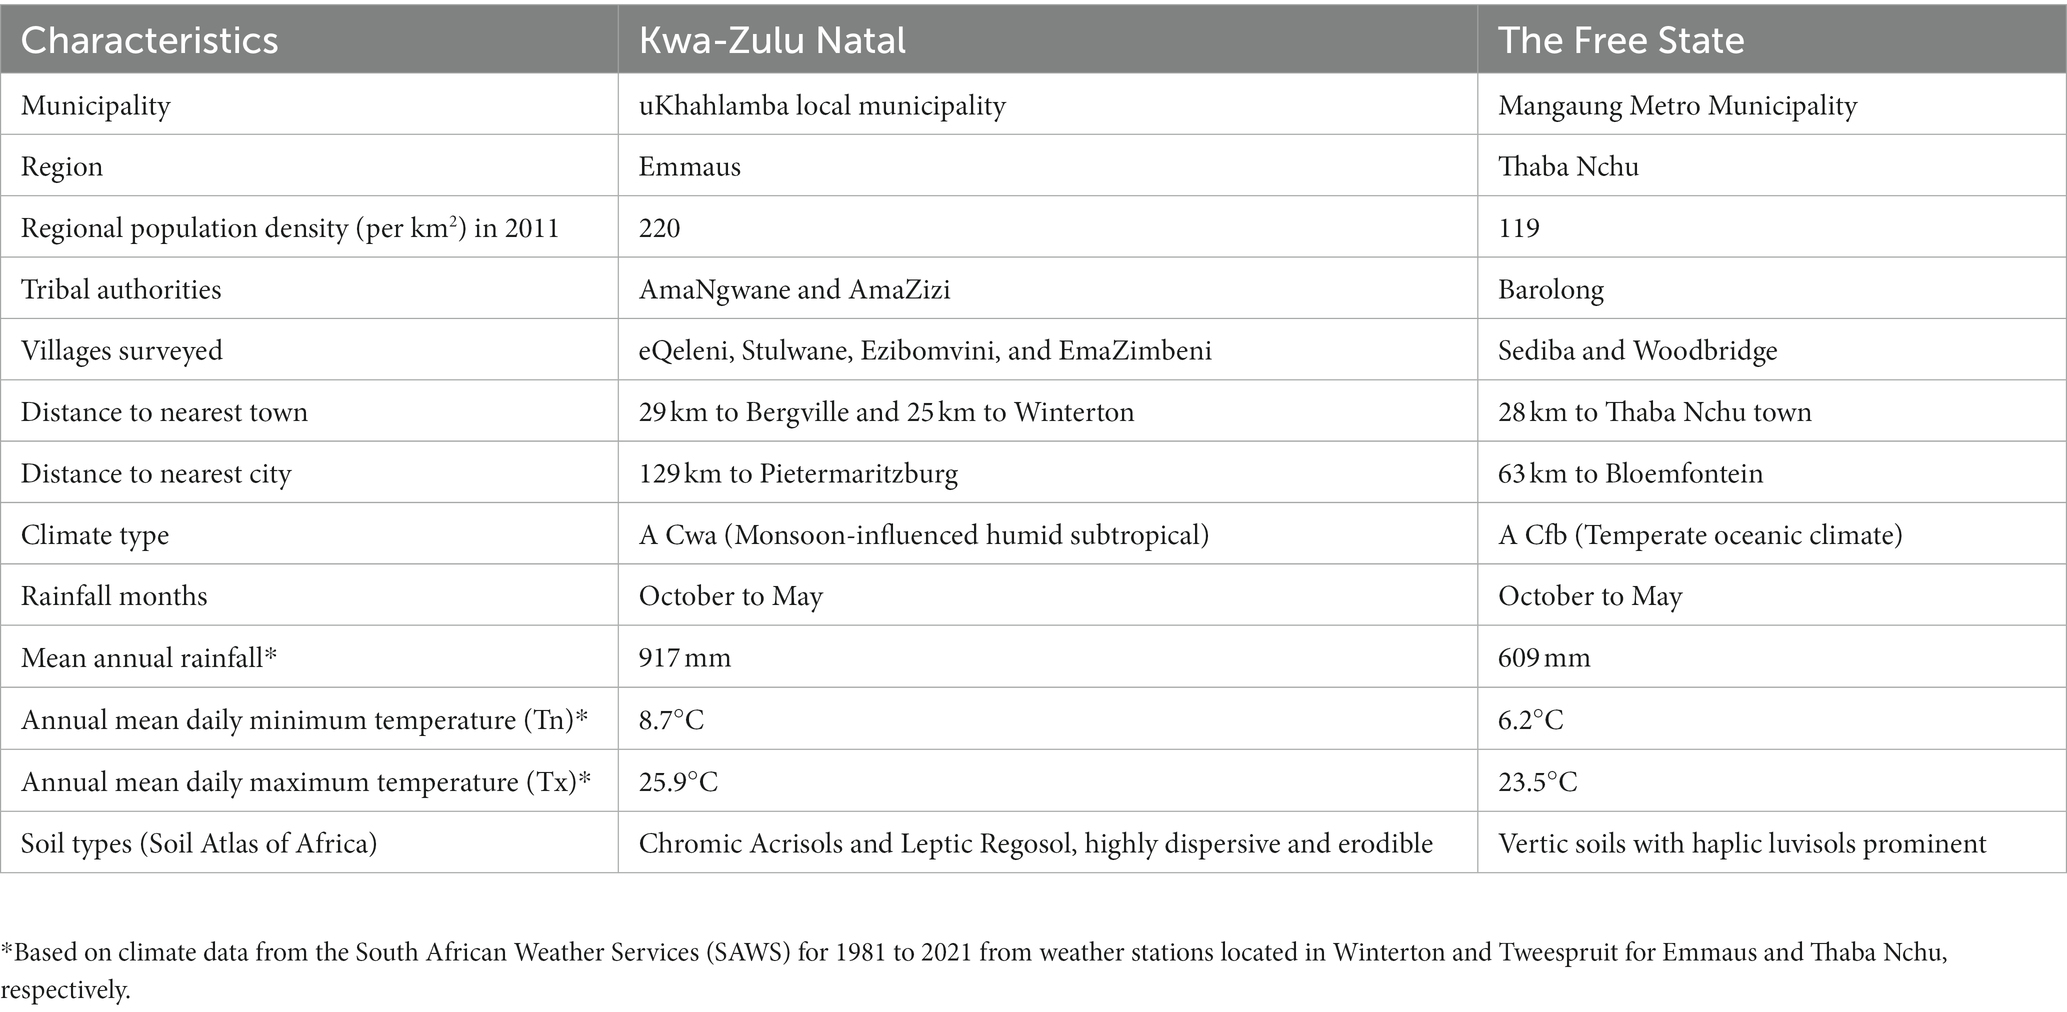
Table 1. Characteristics of the study sites in KZN and FS provinces.
2.2. Data collection and processing
The Rural Household Multiple Indicator Survey (RHoMIS) was chosen for the study as it collects information on a broad range of farm household characteristics, ranging from crop and livestock production and land owned to food security and socio-economic features (Hammond et al., 2017). This RHoMIS tool was used to describe the diversity of small-scale farming in our study regions. Additionally, the data were used to calculate a set of food security, nutrition security, and income indicators related to the welfare of households. These household welfare indicators, often used for analyzing poverty in rural areas (Baulch and Hoddinott, 2000), were then used as the second step toward answering our research question. Data to calculate household welfare indicators were collected through a survey conducted on a digital platform using Android-based mobile phones with a suite of Open Data Kit (ODK; Hartung et al., 2010) software installed. The survey collected general household characteristics, such as demographics and socio-economic activities, agricultural management and production practices, food access, and income and income dynamics.
In Emmaus, data were collected only from households that had planted crops in both the 2018/2019 and the 2019/2020 seasons. All participants worked with Mahlathini—a non-governmental organization (NGO), through which we established access to the communities. In Thaba Nchu, many households had not planted crops or had a minimal harvest in both seasons due to droughts. Therefore, this could not be a criterion for household selection, and answers were based on the most recent production season they could remember. Eventually, 132 households were interviewed, 57 in Emmaus (out of a total of about 200 households for the four villages surveyed) and 75 in Thaba Nchu (out of a total of about 157 for the two trust lands surveyed).
Surveys were conducted from January to March 2020 by trained enumerators with fair fluency in the local languages. The questionnaires were professionally translated into isiZulu in Emmaus and Sesotho and Setswana in Thaba Nchu. Households from all four villages (i.e., nine households in eQeleni; 17 in Stulwane; 16 in Ezibomveni; and 15 in Emazimbeni) of the Emmaus region were clustered due to their similarity in production activities. Furthermore, although they are named separately, the villages are rather contiguous with unclear boundaries of where one ends and where the next starts (as can be seen from the short distance among them in Figure 1). In Thaba Nchu, results were analyzed separately for Sediba (48 households) and Woodbridge (27 households) as they are 40 km apart and due to their apparent differences in production activities and access to agricultural resources provided by the Department of Agriculture, Land Reform and Rural Development (DALRRD). For example, irrigation facilities were functional in Sediba and dysfunctional in Woodbridge. Henceforth, the study consists of two regions—Emmaus and Thaba Nchu—and three study sites—Emmaus, Sediba, and Woodbridge.
Data were uploaded to a web server, and an associated set of analysis tools programed in R were used to calculate indicators. In the early phase of our data analysis, we explored the data through principal component analysis (PCA), stepwise regressions, q-plots, and frequency distributions to highlight indicators with notable differences between the sites and explore relationships among them. An ANOVA was conducted to test whether significant differences existed among study sites. The one-way ANOVA test was followed by the Tukey test for pairwise comparison of the means. R was also used for the graphical representation of the data. The importance of outliers was ascertained in consultation with key informants. Comparisons to assess significant differences between regions were also performed with a one-way ANOVA.
2.3. Household welfare indicators
In RHoMIS, several household welfare indicators are calculated by default. We used the following Food and Nutrition Security (FNS) indicators: Household Dietary Diversity Score (HDDS), Potential Food Availability (PFA), Food Self Sufficiency, and Food Insecurity Experience Scale (FIES) to assess the current situation. These consumption-based measures of household welfare are arguably the most comprehensive indicators of the ability to meet needs and wants (Baulch and Hoddinott, 2000). Using the total income welfare indicator (made up of off-farm and on-farm components), we then assessed the contribution of farming to households’ participation in economic activities.
2.3.1. Household dietary diversity score
Household dietary diversity score (HDDS) indicates the dietary diversity of a household based on the intake of 12 different food groups in the last month prior to the survey. The score ranges from 1 to 12, reflecting the number of food groups consumed. The 12 food groups are cereals, tubers, and roots, vegetables, fruits, meat, eggs, fish and seafood, legumes, nuts, and seeds, milk and milk products, oils and fats and spices, condiments, and beverages. The score is also calculated for a good season (best months for food supply) and a bad season (worst months for food supply) as identified by the households themselves (Ritzema et al., 2019). The HDDS is then used to categorize dietary diversity into low (<3), medium (4–5), and high (6–12; FAO, 2006).
2.3.2. Potential food availability
Potential food availability (PFA) is a supply-based estimate of the potential amount of food that can be generated through on- and off-farm activities by a household and is measured in energy (kcal) per male adult equivalent (MAE) per day (Hammond et al., 2017). The two main components of this indicator are all farm produce and off-farm household income (using local food prices) converted into food. The requirement threshold for food security is 2,500 kcal MAE−1 day−1 (Holden et al., 2001). Households were divided into three PFA categories: i.e., Low: households without enough food available low (PFA < 1,500 kcal MAE−1 day−1); Medium: those with roughly enough food available (PFA between 1,500 and 4,000 kcal MAE−1 day−1); and High: households with more than enough food available (PFA >4,000 kcal MAE−1 day−1; Frelat et al., 2016).
2.3.3. Food self-sufficiency
This represents the energy coming from the actual consumption of on-farm products. The energy consumed is calculated by multiplying the amount of food by the energy content of that product. Energy contents were based on a standard product list developed by the US Department of Agriculture USDA.1
2.3.4. Food insecurity experience scale
Food insecurity experience scale (FIES) estimates the prevalence of food insecurity as denoted by difficulties in accessing food due to resource constraints. The score on the FIES scale ranges between 0 and 8, with high values indicating households that experience more food insecurity (Wambogo et al., 2018). The scale uses a set of eight questions that cover a range of the severity of food insecurity. Questions were answered based on the last 12 months before the survey.
2.3.5. Total income
Total income for the household is calculated by adding the income from farm activities (crops and livestock production) and off-farm activities (any income-generating activity outside the farm) as reported by households in the RHoMIS data. The total income indicator generated by the RHoMIS tool was compared to thresholds such as:
1. The international poverty line: This is the international or extreme poverty line for low-income countries that was set at 2.15 US$ Purchasing Power Parity (PPP) per capita per day in the year 2022 and is based on the national poverty lines of the 15 poorest economies in the world (Jolliffe et al., 2022).
2. The South African food poverty line: the amount of money an individual needs to afford the minimum required daily energy intake (Stats SA, 2020)—given as ZAR 585 per person per month (an equivalent of 2.79 US$ PPP person−1 day−1).
3. The living income is explained by van de Ven et al. (2021) as the income a household would require to afford a decent standard of living for all its members. The living income per adult equivalent (AE) facilitates calculation of the income for individual households in rural areas, explicitly considering household size. Elements of a decent standard of living include food, water, housing, education, healthcare, transport, clothing, and other essential needs including provision for unexpected events. The living income benchmark is based on local surveys (van de Ven et al., 2021). In addition to collected RHoMIS data, the following local data sources were used:
a. Food costs: General household survey (Stats SA, 2019); consumer price index.
b. Housing costs: Quantum for government-subsidized houses, commonly known as RDP houses (45 m2) for KZN and FS from the respective provincial department of Human settlements.
c. Non-food non-housing costs: General household survey (Stats SA, 2019).
In addition to the total income of households, our calculation of the living income took into account other social security grants such as subsidized housing, water, and electricity. The living income for these former homelands was calculated as 11.79 US$ PPP person−1 day−1. To allow comparisons of local thresholds against the international poverty line, we converted ZAR to US$PPP using a conversion factor of 7.0 for 2019/2020.2
3. Results
3.1. The small-scale farming households and farming systems
The average household size was significantly different across the three study sites with the largest households found in Emmaus (Table 2). More than 50% of the household heads in Woodbridge were females, while female-led households were fewer in Emmaus. The age of the household head was comparable across all three locations. The education status of household heads was highest in Woodbridge as all had some form of formal education. In Emmaus, 35% of the household heads had no formal education at all.
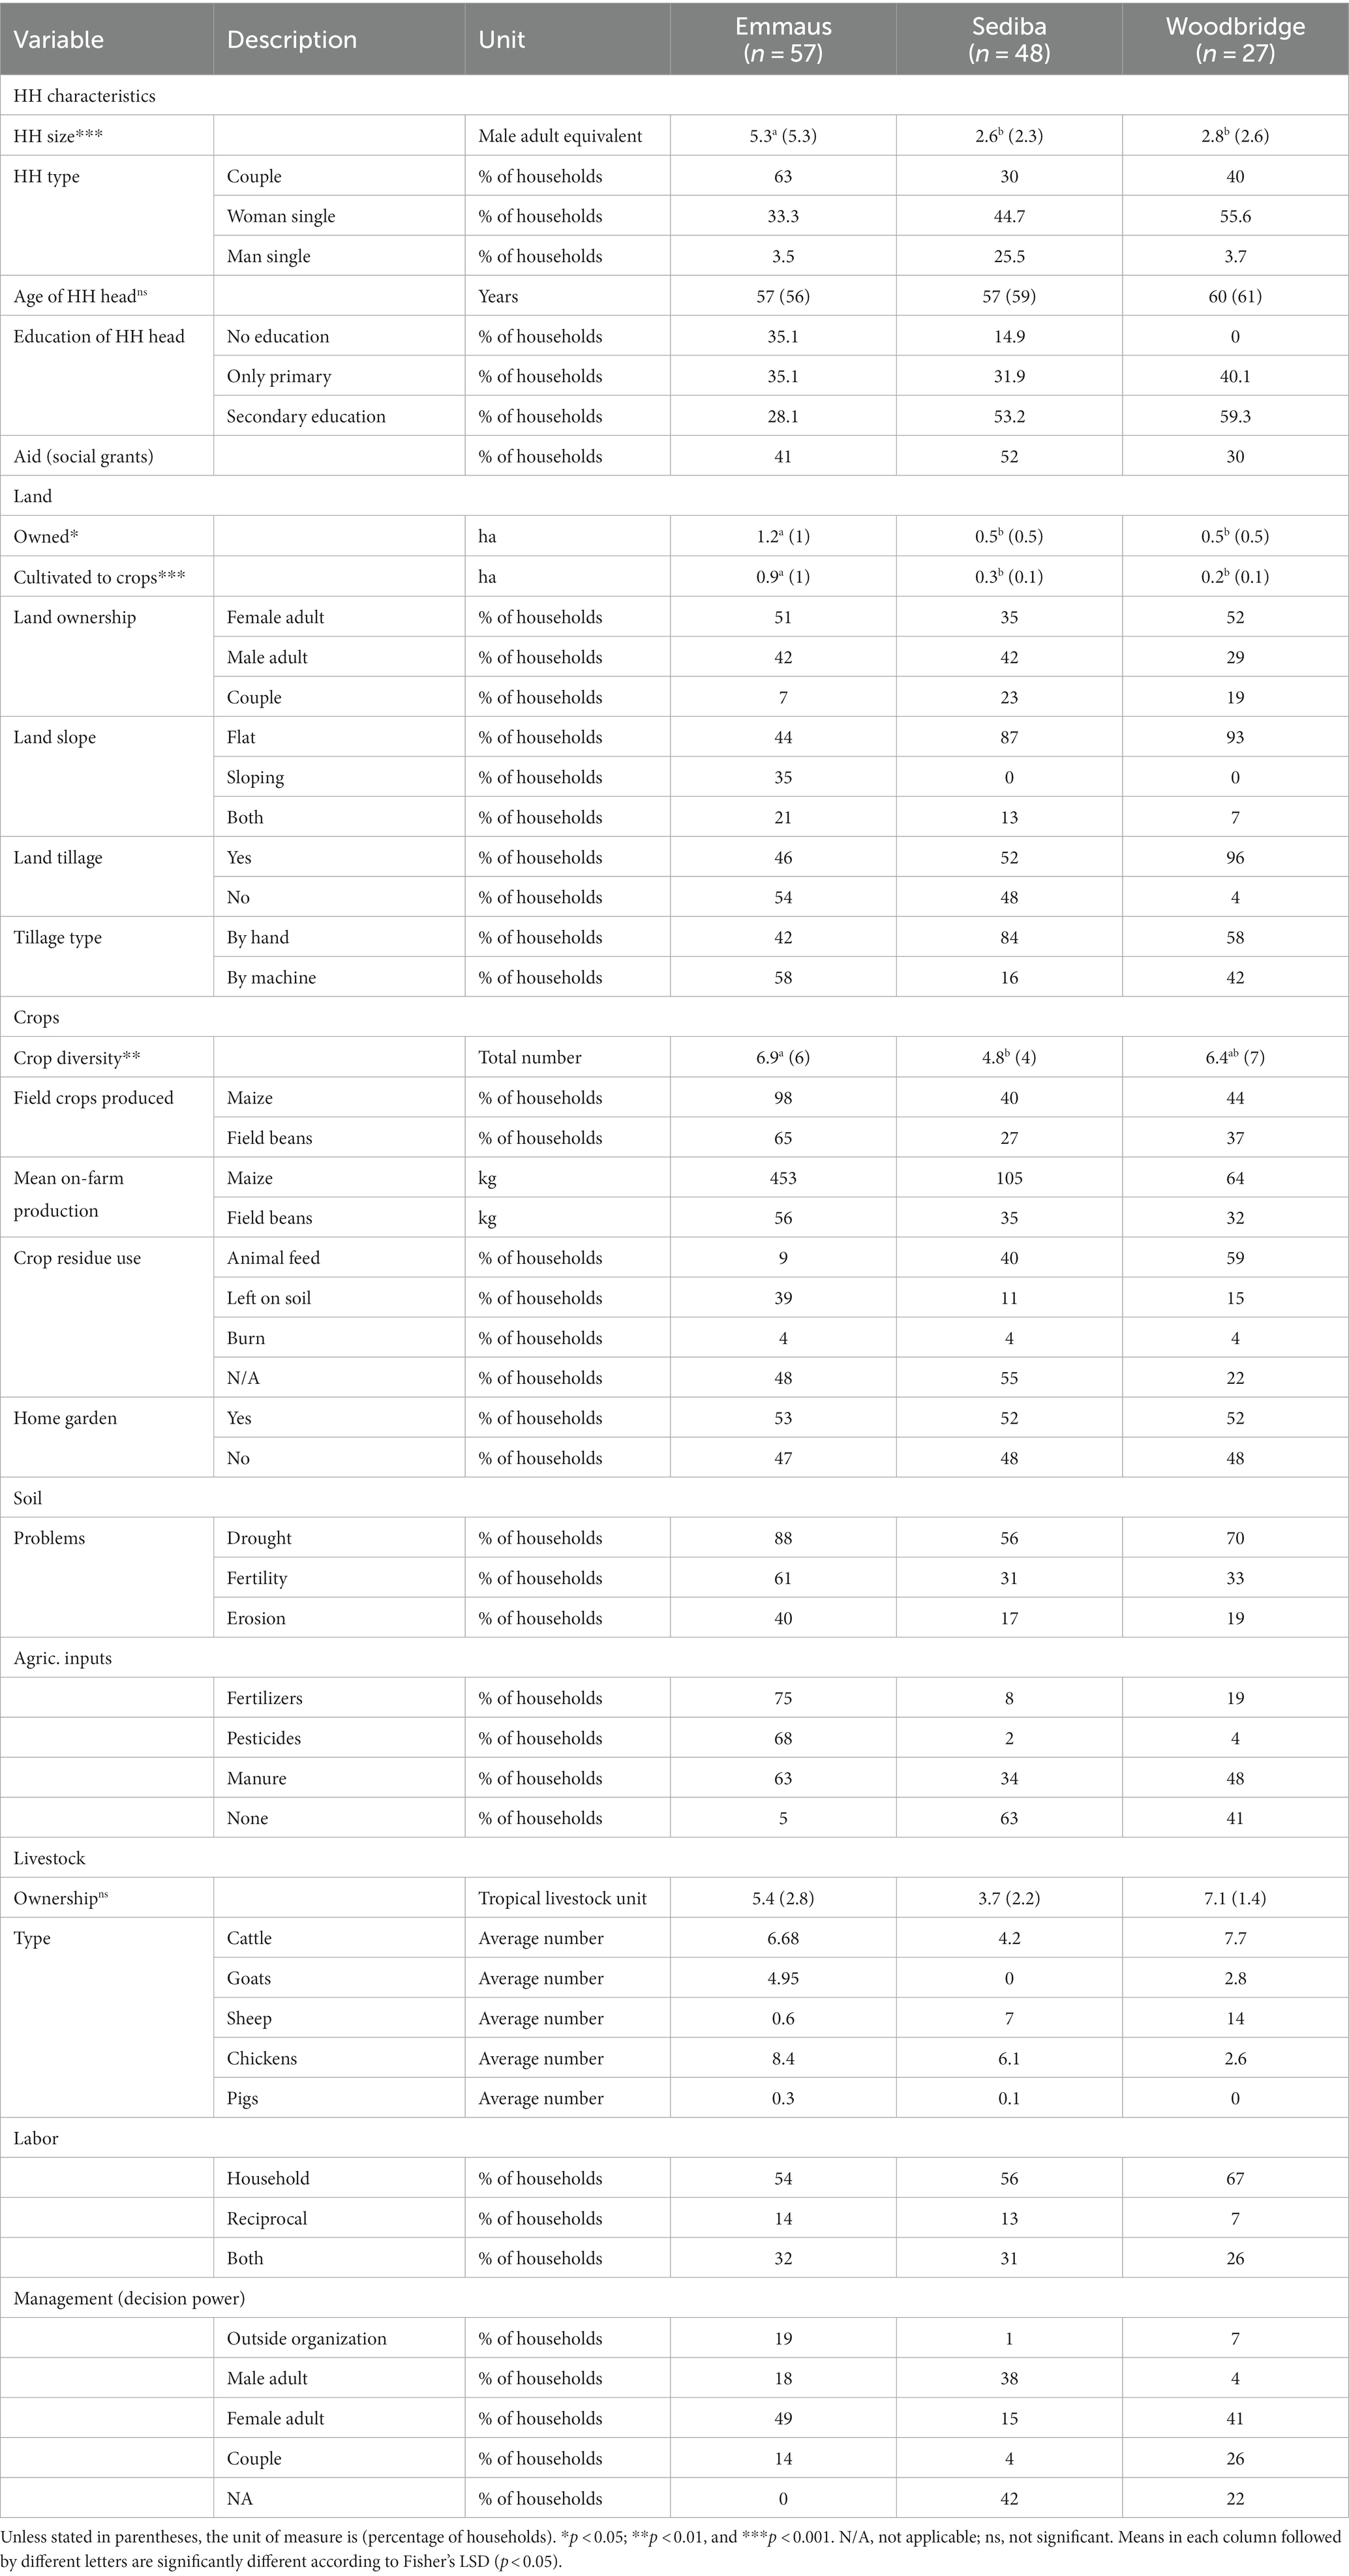
Table 2. Characteristics of the farming households and systems (Where applicable, the mean is accompanied by the median in parentheses).
Households in Emmaus owned on average, 1.2 ha of land of which 0.9 ha were exclusively cultivated to field crops. These lands were mostly owned (in terms of the PTO) by female adults and were mostly flat in topography. While most households did not till their lands (54%), 58% of those who did, used borrowed tractors (from neighboring villages) and the remaining 42% did so manually. On average, households produced seven crops and 63% (Table 2) produced both maize (Zea mays L.) and field beans (Phaseolus vulgaris L.) that were intercropped, following the recommendations of the Mahlathini NGO (Kruger and Gilles, 2014). Crop yield was reported as “number of bags” by the households and converted to kilograms (50 kg per bag) and only the production of maize and beans as the main field crops were reported. Households produced on average, 453 kg of maize and 56 kg of beans (fresh weight) on-farm production. Crop residues were usually left on the fields and eventually grazed on by free-roaming livestock. Home gardens were present in 53% of the households and were irrigated with water carried primarily from nearby streams to produce cabbage (Brassica oleracea L.), spinach (Spinacia oleracea L.), onions (Allium cepa L.), and pumpkin (Cucurbita pepo L.). As reported by 88% of households, drought presented the biggest challenge for crop production. Important to note is that the data were collected during a particularly dry cycle. Thus, drought might not have been such a prominent challenge had the survey been conducted after the three La Niña seasons that followed the 2018/2019 dry spell. In addition, soil fertility decline and soil erosion were challenges noted by 61 and 40% of the households, respectively. Fertilizers were purchased by 75% of the farmers, 68% purchased pesticides, and 63% manure. Maize and beans were fertilized with mono-ammonium phosphate (MAP) and limestone ammonium nitrate (LAN) depending on their affordability. Livestock manure was used as both a fuel source and soil amendment. Only 5% of the households did not use any agricultural inputs. On average, households owned about five TLUs comprised of cattle, goats, pigs, sheep, and chickens. Some households (14%) owned no livestock.
Only a few (9%) households sold livestock, as livestock, especially goats, was primarily reared for cultural purposes such as cleansing rituals and cattle for lobola (“bride price”) proceedings, funerals, and paying fines to the tribal authority when traditional laws were broken. Furthermore, livestock served as a savings account and for social standing in the community. Livestock in Emmaus was usually stabled at night and allowed to graze freely from sunrise to sunset in communal grazing lands. The availability and quality of grazing was only considered in the winter season during which the livestock would be herded higher up into the mountains. The households themselves provided most labor for agricultural activities. Some households (32%) relied on reciprocal labor [non-monetized exchange of group work done by farming households for the benefit of each household in the group, adapted from Gibson (2020)], primarily for time-sensitive activities such as land preparation before planting. Reciprocal labor was done in groups of about 5–7 people. For all households, labor was reported as a constraint delaying other activities such as weeding and harvesting which did not form part of reciprocal labor arrangements. The starting point and subsequent rotation of this reciprocal labor was dictated by which household first secured access to necessary production resources. Mahlathini NGO influenced the long-term production planning and management decisions of households. This implies that the planning of households could have been aligned with the research interest of the NGO such as the conservation agriculture strategies employed.
Also, in Sediba, households cultivated less land than what they owned (Table 2). The average farm size was 0.5 ha of which only 0.3 ha was cultivated. On this 0.3 ha, farmers grew fruit trees, field crops and vegetables. Male adults had ownership (PTO) of the lands in 42% of the households while for 35% of the households, female adults did. Generally, the land in Sediba is flat and only 13% reported to have both flat and sloping land. Lands were tilled by 52% of the households of which 84% did so by hand.
On average, households produced 105 and 35 kg of maize and beans on farm and the residues of these crops were mainly used as animal feed. Vegetables such as spinach and carrots [Daucus carota subsp. sativus (Hoffm.) Schübl. & G. Martens] were cultivated by 52% of the households and irrigated with water from the homestead and fertilized with livestock manure. Drought challenges were reported by 56% of the households while issues of erosion were noted by only 17% of the households. Cultivated crops, mainly maize, were fertilized with MAP and/or LAN by only 8% of the households, while the majority (63%) reported not using any agricultural inputs. Households owned 3.7 TLUs of livestock, mainly cattle and sheep which were primarily sold to neighboring towns for cultural rituals such as appeasing of the ancestors or at auctions when transport arrangements could be made. Crop production was done by 58% of the households while 71% owned at least one type of livestock.
Sole reliance on reciprocal labor for land preparation was uncommon and practiced by only 13% of the households. As many (56%) relied solely on household labor, limiting the manpower for agricultural production activities. Male adults were operational decision-makers for 38% of the households, the highest across the study regions. In communal croplands that were managed through intervention programs such as the “one - hectare - one household” project, mainly sunflower—intended for sale with a grain trader—was grown under dry-land cultivation through the intervention of the Department of Agriculture, Rural Development and Land Reform (DARDLR). All production activities (weeding, fertilizing etc.) were then performed by all households involved in the project. It is not entirely clear what the inclusion or exclusion criteria for the project were. A portion of the communal land (about 50 ha) was dedicated to future orchards to be irrigated through the revitalization of irrigation schemes project. At the time, the community was erecting irrigation lines on this fallow land and were expected to start planting in 2023. It was unclear to the households what type of orchard was to be planted there. Households had no long-term investment or leverage into the planning as they could only participate for as long as the project remained operational, which depended on the DARDLR.
In Woodbridge, households cultivated even a smaller share of their land than in both other regions, only 0.2 of the 0.5 ha. The 0.2 ha was used to grow fruit trees, field crops, and vegetables. Adult female ownership (PTO) was most prominent across all three study sites with 52% of the households and only 29% of the households having male adult ownership, the lowest across all three sites. The lands were described as flat by 93% of the households. Tillage was commonly practiced by 96% of the households. Of those who tilled their lands, 58% did so by hand and the remaining 42% hired a tractor. It was bought for a community project on the communal land that was utilized in the past to produce vegetables under greenhouse tunnels, an initiative of the DARDLR that had since collapsed. Households that produced maize and beans had an average production of 64 and 32 kg per household, respectively and the residues of these crops were used as animal feed by 59% of the households—the highest for all the regions. Although on a smaller scale (fewer households) than in Sediba, vegetables [spinach, beetroot (Beta vulgaris L.), pumpkin, and carrots] were produced and irrigated with water carried from communal taps. Drought conditions were reported by many households (70%) and 33 and 19% of the households also reported experiencing declines in soil fertility as well as challenges of soil erosion, respectively. Manure was the most widely utilized field crop input. On average, households owned seven TLUs comprised mainly of goats and sheep that were kept in stables and allowed to graze in communal fallow grazing lands during the day. Livestock had started to roam the fallow communal croplands since the community project had ended due to poor market access as reported by community members. At the time, there was an initiative of the provincial Department of Agriculture to resuscitate some communal projects in Woodbridge such as the cattle feedlots and irrigation schemes. For most households (67%), labor was provided by the household members and only 7% of the households relied solely on reciprocal labor. As elsewhere, labor availability was reported as limiting farm production. Day-to-day planning and management of production activities was the responsibility of female adults and outside organizations (extension services, for instance) had influence or were acknowledged by only 7% of the households.
3.2. The contributions of farm and off-farm sources to food and nutrition security indicators
From our data explorations in the early phases of the analysis, we found that Food availability and Household Dietary Diversity were the only two indicators that showed notable differences among the sites, hence our focus on them. The general trend across all three study sites was that off-farm sources of income contributed more to nutrition security than on-farm production (Figure 2). HDDS in the bad season significantly differed across the regions with Emmaus scoring the lowest (Table 3). Households in Emmaus had lower dietary diversity scores than the other regions if only the purchased food sources were considered. However, this region performed better than the other two regardless of the food source in both the bad season (limited food supply) and the good season (when food availability is above average) when looking at only farm-based food sources. In Sediba, the median of farm-based contribution to HDDS was zero in both the good and bad seasons; in Woodbridge, it was only one (Figure 2). In all the regions, on farm production contributed little to the dietary diversity for households. The good season in both Sediba and Woodbridge referred to the months of November and December, generally known as the festive season. In Emmaus, the good season was the months of harvest (May to July).
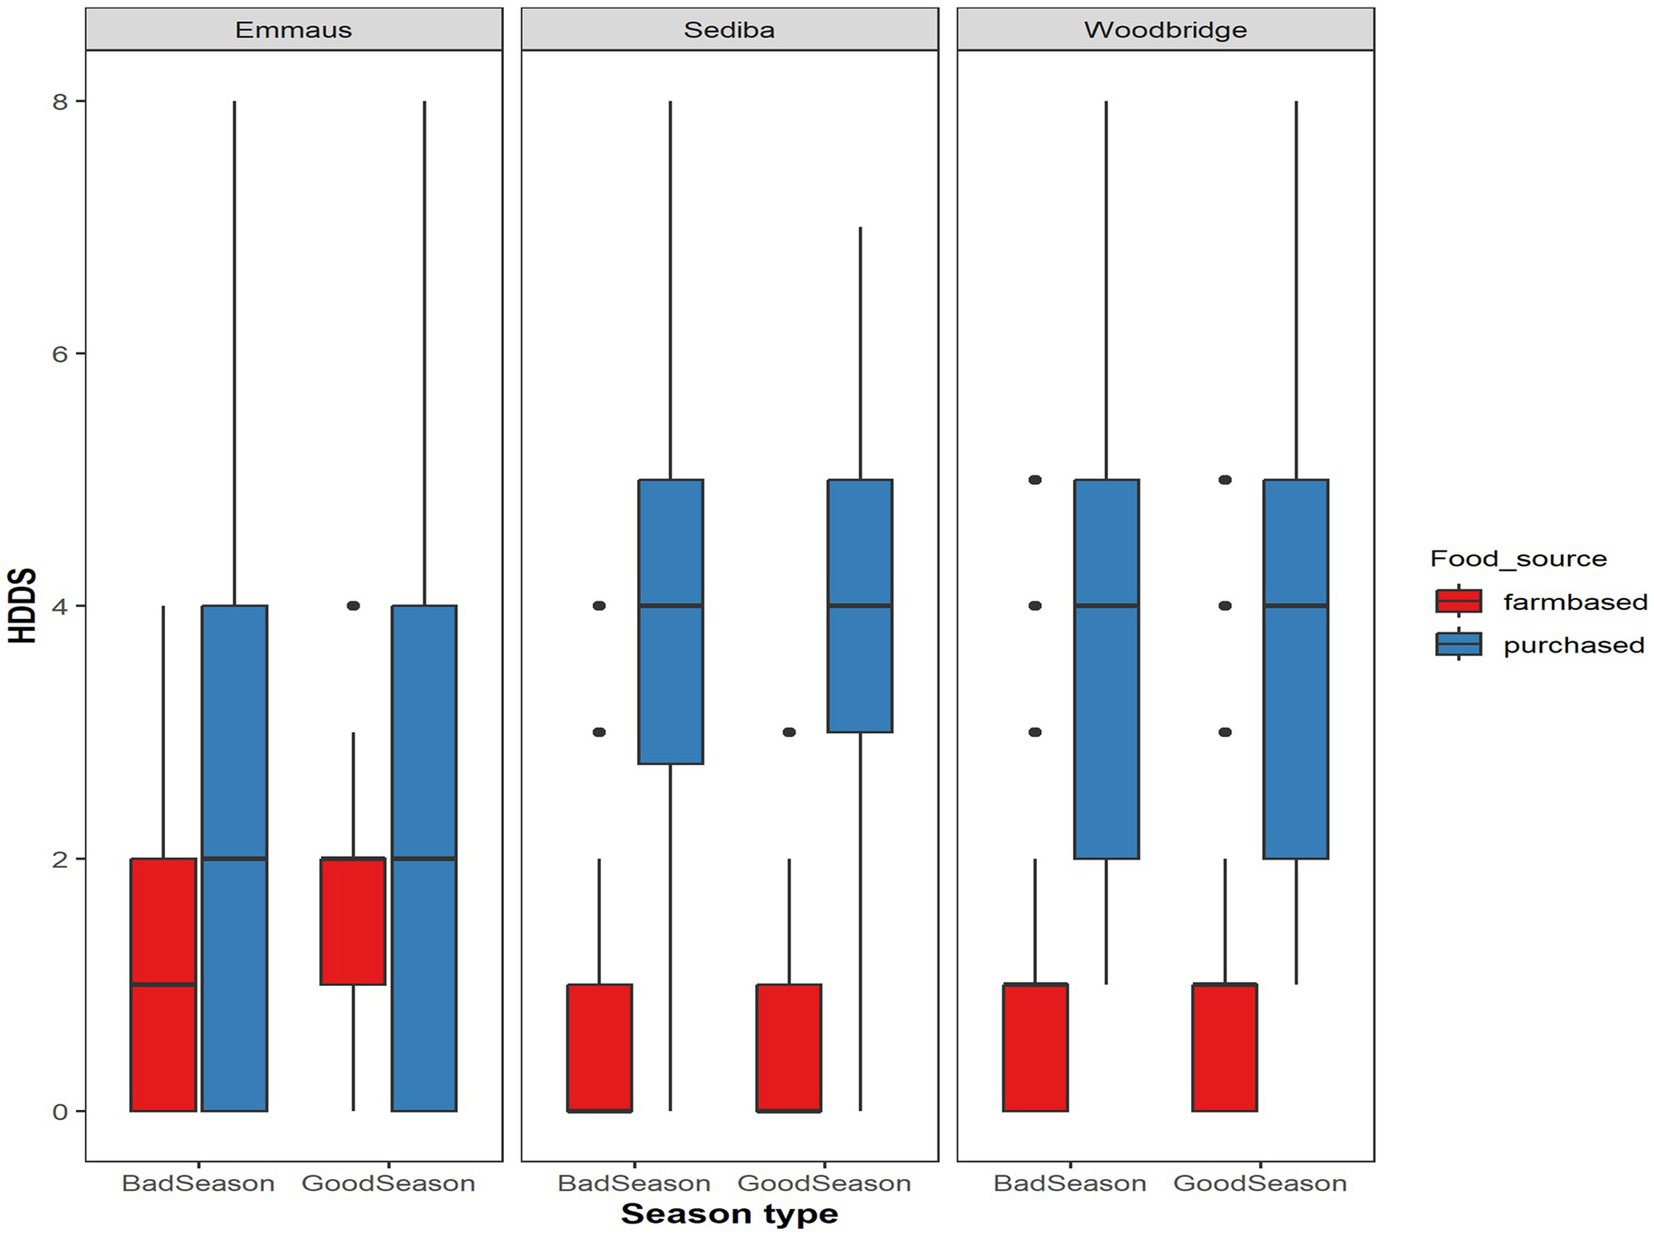
Figure 2. Scores for dietary diversity in both the good and the bad seasons and the contribution of farm-based and purchased (off-farm) food sources. Potential food availability was low and more than 50% of the households had a PFA below 800 kcal MAE−1 day−1 in Emmaus, while the threshold for food security is 2,500. The other two sites performed worse with a median value below 300 kcal MAE−1 day−1. Although PFA was low, higher food self-sufficiency was found in Emmaus. Even so, none of the households in all three sites were food self-sufficient. Generally, food insecurity, as indicated by the FIES score, was a reality in all regions.
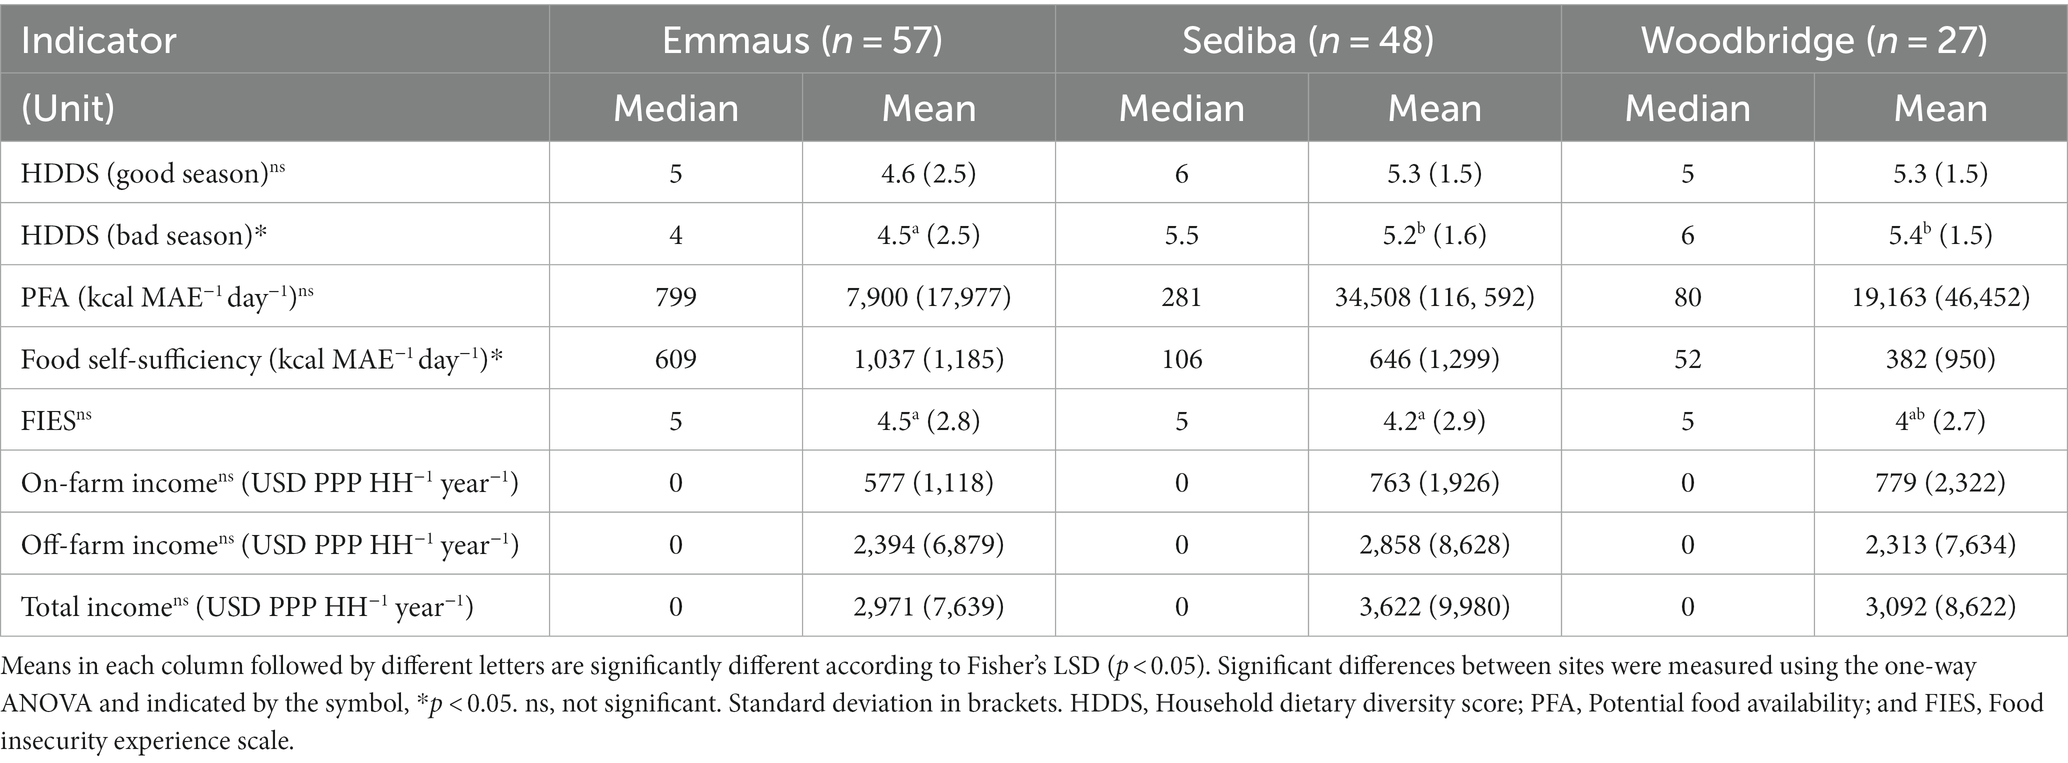
Table 3. Results of the welfare indicators.
Figure 3 illustrates the contribution of off-farm vs. on-farm sources to the potential food availability of households in the different regions. Although households relied on a variety of livelihood activities, a large proportion of them remained below the given thresholds for energy intake even when all major livelihood activities are considered, especially in Emmaus. More than half of the households in all three regions fell in the “low” PFA category. The highest proportion of households with low (<1,500 kcal MAE−1 day−1) PFA were found in Woodbridge. Of the three regions, Sediba had the highest percentage (32%) of households in the high (>4,000 kcal MAE−1 day−1) PFA category. Generally, off-farm sources contributed more to potential household food availability and on-farm production and consumption did not guarantee nutrition and food security. In Emmaus, crop consumption was the main source of food. Crop sales provided minimal contributions in all three regions but for the 11% of the households in Woodbridge, it contributed to crossing the threshold value of 2,500 kcal MAE−1 day−1. For all but three households in Emmaus and one in Woodbridge, off-farm income contributed to PFA values surpassing the threshold requirement. In Sediba and Woodbridge, livestock sales had a more prominent contribution to PFA than in Emmaus. However, livestock consumption provided minimal contributions toward PFA in all three regions.
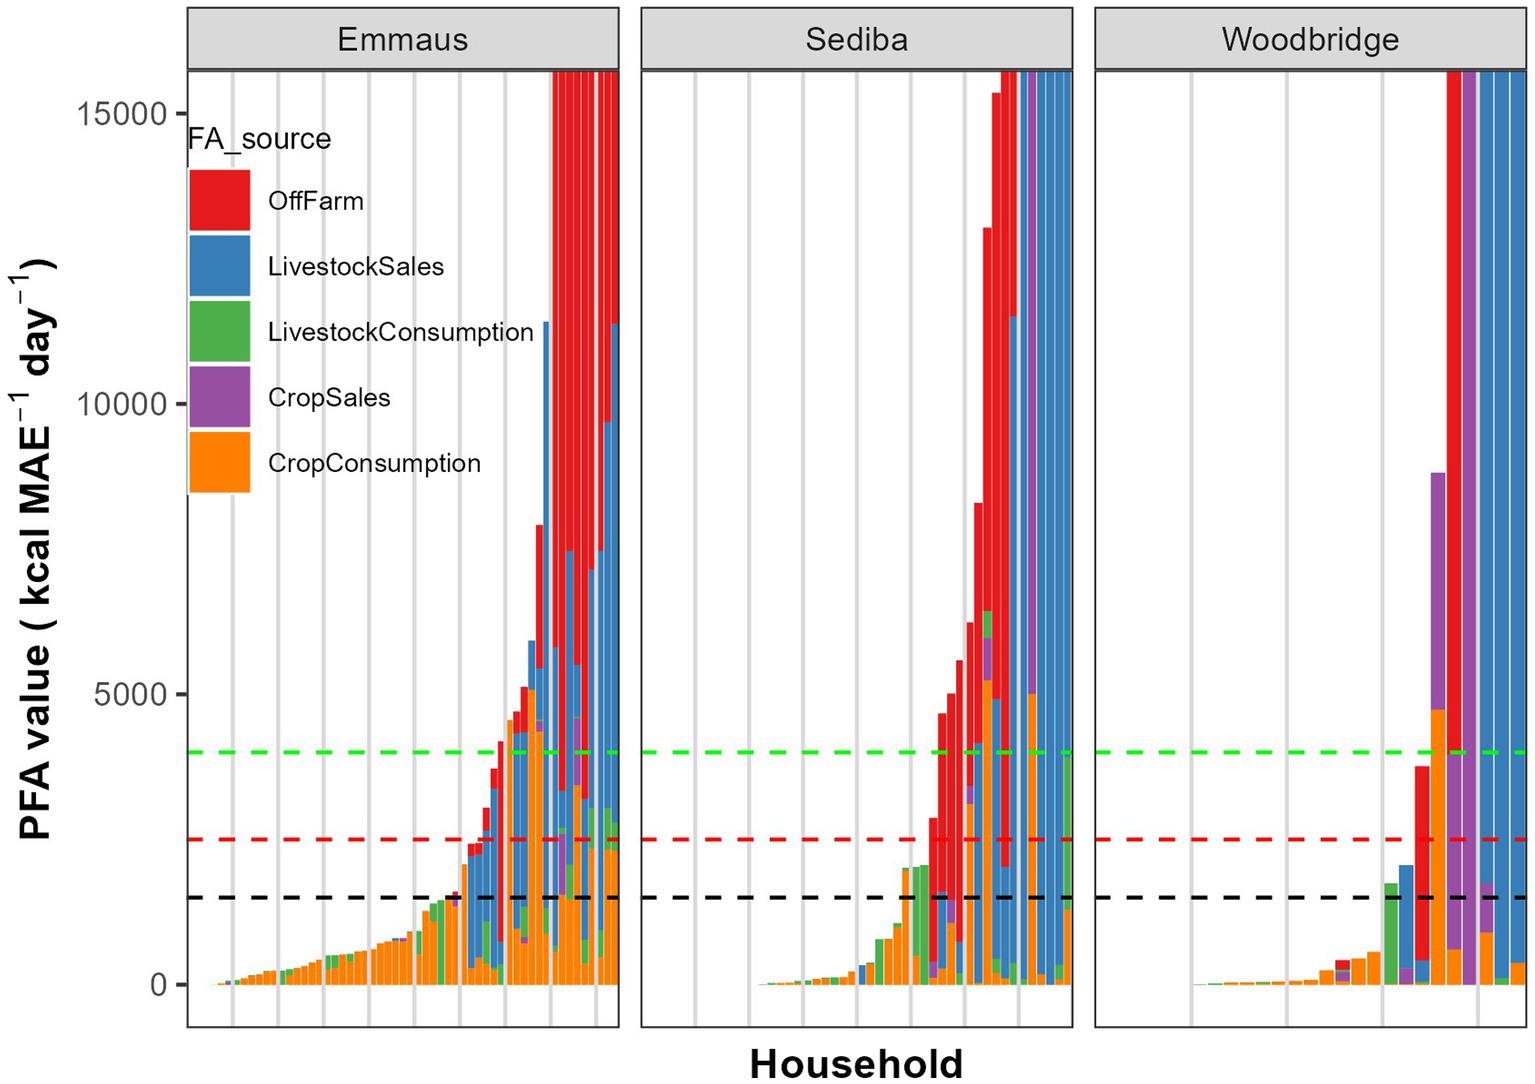
Figure 3. Potential food availability (PFA) per MAE for all households in the three regions. The red dotted line represents the threshold value for food security: 2,500 kcal MAE−1 day−1 while the black and the green represent the low and the high PFA classes, respectively.
3.3. The relative contributions of farm and off-farm sources to total income
Income results cannot be considered to be entirely reliable, as many households were reluctant to disclose and discuss their incomes, especially income from social grants. Indeed, some households reported no income at all. Nevertheless, the results of those who did report on income revealed the contribution of on-farm versus off-farm sources to people’s livelihoods (Figure 4). When we compare total income against the following thresholds: the South African poverty line, the international poverty line, and the living income indicator or benchmark (calculated for the regions), most households are below these poverty benchmarks. At best, only a third can meet the international poverty line. The only households that could surpass the living income thresholds were those relying strongly on off-farm sources. Only three households in Emmaus, five in Sediba and three in Woodbridge surpassed the calculated living income benchmark. Of those relying mainly on on-farm income, six households in Sediba earned more than the SA food poverty line, none in Emmaus and only four in Woodbridge.
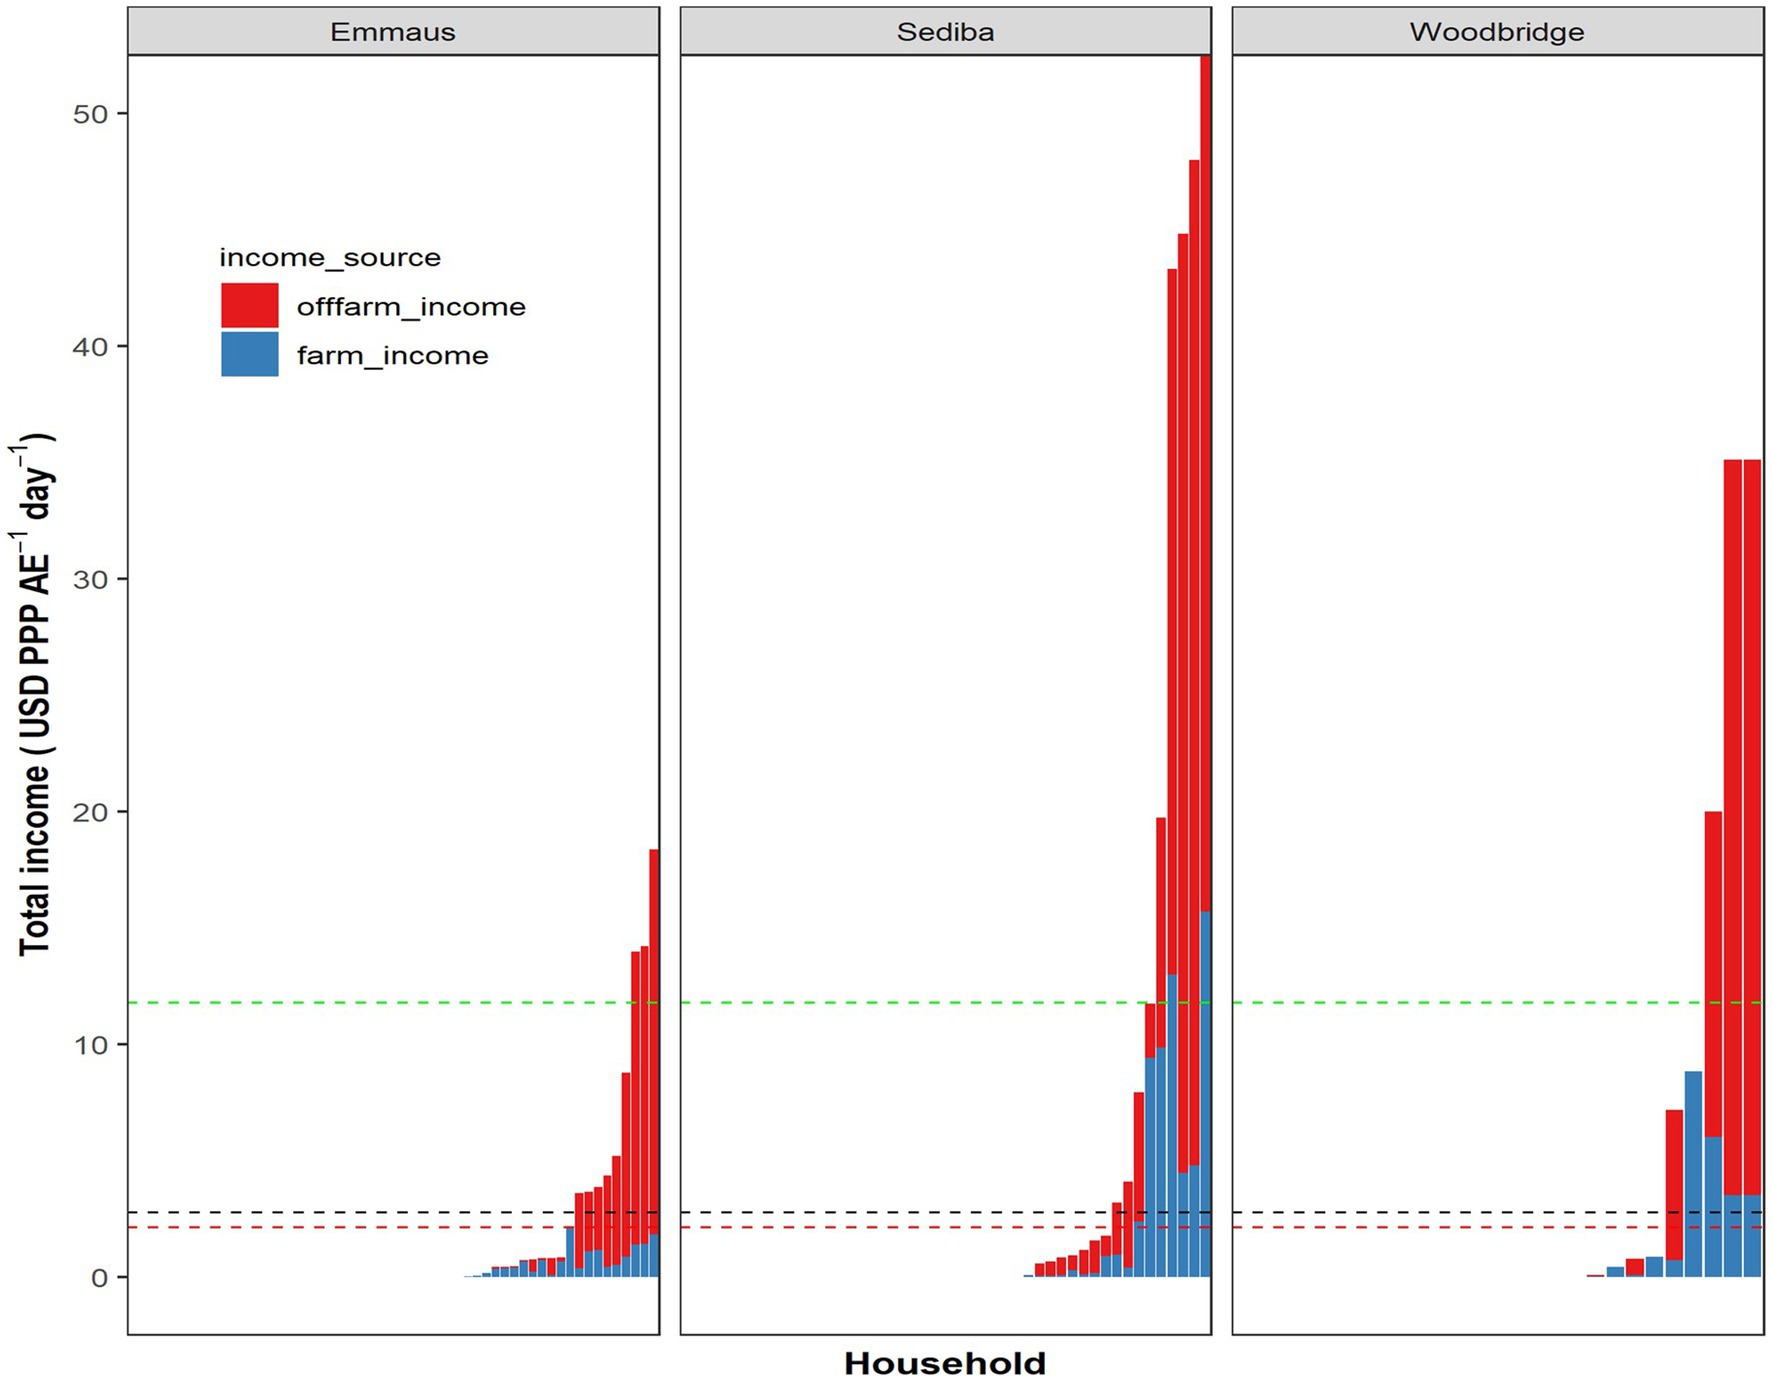
Figure 4. Total income (Purchasing power parity per household per year) presented against the international poverty line (red line), the South African Food poverty line (black line), and the rural South African living income benchmark (green line).
Although some households did not report any form of income, field notes, and photographs together with researcher observations (triangulated with key informants), noted some informal and irregular sources of income. In Emmaus, selling of marijuana (Cannabis sativa L.), is a prevalent and important but illegal economic activity. This crop is planted in the middle of fields and after harvesting, sold by members of the households (usually men) working elsewhere. Another prominent, more public way of generating income was through weaving of traditional carpets and sewing of cultural garments. This represented a prominent source of income during the “wedding season,” usually in early summer (October to late December). Some households that are closer to more foot traffic such as those living closer to the main road or the Emmaus hospital, or schools, rented rooms to people who worked there such as hospital staff and teachers. Furthermore, some families received remittances from those working away, although this would be only once or twice a year – mainly on major public holidays such as Easter and Christmas. In Thaba Nchu, sewing of school uniforms sold to people in and around the Trust lands generated income mostly in the first part of the academic year (January to March). Some households also preserved some of their harvest such as peaches [Prunus persica (L.) Batsch] and beans through canning or drying to sell later in the season when other households have run out.
A crucial part of the total household income which cannot be fully explored with the current empirical evidence is the extent and reach of the South African social security grant or services. In our study, 23 and 44% of households in Emmaus and Thaba Nchu, respectively, received monthly social security grants, i.e., either: Old Age (60–74 years old): 284 USD PPP; Older Age (75+ years): 287 USD PPP; Care Dependency: 284 USD PPP; Child support grant (per child under 18): 69 USD PPP; or Orphaned child support: a top up of 34 USD PPP on the child support grant, etc. per month (Ruiters, 2016). While these grants were acknowledged by some households as off-farm source of income and others did not mention it, depending on the age of the household heads and household sizes, they could add up to a monthly income equal to 5.3 and 3.6 USD PPP MAE−1 day−1, in Emmaus (one old age grant and four child support grants) and Thaba Nchu (one old age grant and two child support grants) respectively. This alone potentially puts the households above the US$2.15 poverty line. Furthermore, the indigent status of these regions means that the social security services extend far beyond the monthly income. It makes provision for housing through the Reconstruction and Development Program (RDP; already observed in both Emmaus and Thaba Nchu at the time of the study), electricity fully subsidized to a maximum of 50 kWh per month and fully subsidized water to a maximum of 6 kL per month. Additionally, children attend the “no-fees” schools where they are also provided with a meal in accordance with the National Schools Nutrition Program.3
4. Discussion
The livelihoods of households in former homelands such as Emmaus and Thaba Nchu, are often stereotyped as persistently poorly resourced, female-led households (Hurlbut, 2018; Khumalo and Sibanda, 2019), resistant to change (Ighodaro et al., 2016) in severely underdeveloped regions (D'Haese et al., 2013). While the current study in two regions cannot represent all former homelands in South Africa, our study clearly shows that these common assumptions do not hold. Our findings highlight the diversity of households, the limited contribution of small-scale farming to food and nutrition security, as well as its variable contribution to the households’ total income.
The current survey was conducted at one point in time and did not fully capture the dynamic nature of farming systems. Neither did we investigate in detail the influence of different biophysical factors at play in these regions—an important aspect when considering options for intensifying production. Our study nevertheless offered important insights into the context of small-scale farming systems in South Africa. Additionally, our results provide a comprehensive picture of food security and poverty contributing to answering our research question: Can small-scale farming serve as an economic engine in the former homelands of South Africa?
4.1. Diversity of small-scale farming systems
In both regions, households farmed on communal land and none of them owned the land, which is common in other South African homelands as well (Kepe and Tessaro, 2014). Farming in the communities was primarily pursued by older women, as is generally the case in small-scale farming across the country (Mkuhlani et al., 2019; Materechera and Scholes, 2022). However, the farming systems in the two regions differed, particularly in the dependency of households on farming for food provisioning.
In the region of Emmaus, situated about 129 km away from the city of Pietermaritzburg, crop production formed the base of the livelihood portfolio to the extent that households related the “good season” to the months of harvest (May to July). During this time, maize and beans were harvested for household consumption with their residues remaining in the fields. The residues were grazed by livestock that was extensively kept not as a food source but as means of saving and insurance. Away from the crop fields, vegetables were produced to supplement the household food source, irrigated with water from nearby natural streams. In addition to age, the vulnerability of households to poverty could be related to the low education level of the household heads (Hurlbut, 2018). Female adults made the day-to-day management decisions of the farm with great reliance on the local NGO for long-term planning. The active involvement of the NGO was appreciated and reported by the households to have far greater positive impacts than government departments and their programs, something also previously observed (Hebinck et al., 2011; Naumann, 2014; de la Hey and Beinart, 2017; Harris et al., 2021).
By contrast, the Thaba Nchu region is closer to major urban centers (63 km to Bloemfontein city and 28 km to Thaba Nchu town) and people could commute daily to these centers for work. This led to off-farm sources contributing more to their livelihoods. Hence, the “good season” here was unrelated to the agricultural production calendar. It referred to the months of November and December, generally known as the “festive season,” a time of the year when off-farm income is received from family members (mostly men) working away. Being more livestock-oriented, households used crop residues to feed the livestock which—unlike in Emmaus—provided the most energy for the households in terms of potential food availability. On the 0.3 ha of cultivated land, maize, beans, and vegetables under fruit trees were grown and irrigated with water from community or homestead taps that were fairly easy to access. Less than 10% of households acknowledged receiving management advice from extension agents of an external organization, which in this case was the local Department of Agriculture. Unlike in Emmaus, household heads had received a higher level of education and were responsible for all management decisions.
An interesting contrast between these regions was the role of livestock. While there was little livestock consumption in both regions, livestock sales were prominent in Thaba Nchu. The differences between these regions demonstrate the important knowledge gap regarding—how, under what context, and which forms of agricultural interventions—may complement rural development efforts and contribute to the rural economy. This is of great consequence, especially to the country’s ongoing land reform debates (Materechera and Scholes, 2022).
4.2. Food security, poverty dynamics, and the role of small-scale farming
Food insecurity is prevalent in rural areas in South Africa (Maziya et al., 2017). Cheteni et al. (2020) reported that about 60% of households in South Africa scored in the low HDDS category, making undernourishment a prevalent and common issue (Khumalo and Sibanda, 2019). However, in our study areas, the HDDS scores were in the medium (4–5) range, indicating a fair degree of nutrition security (FAO, 2006). Our findings are comparable to those of Hammond et al. (2017), who reported that crop diversification in the Lushoto district of Tanzania improved nutrition (HDDS) but not food (PFA) security. Abegunde et al. (2022) also found that the adoption of climate-smart agriculture in small-scale farming contributes to food security. In this survey, PFA differed both at regional and household levels. While the exclusion of households who had not planted crops in Thaba Nchu may mean an underestimation of food insecurities, the distribution, with most households forming a long tail to the left with only a few “better-off households” at the right-hand side (Figure 3), is strikingly similar among the sites. Such a pattern is commonly observed in small-scale farming across Africa (Hammond et al., 2017; Giller et al., 2021).
Understanding the farming system in its broader context allows us to situate small-scale farming and its contribution to rural economies. For example, water for irrigation of vegetables is readily accessible in Thaba Nchu, making agricultural intensification through vegetable production more viable than in Emmaus, where the primary water source is natural streams with unreliable flows. Furthermore, as a satellite town of Bloemfontein, Thaba Nchu offers more market access, facilitating intensified production, especially of perishable products such as vegetables. In addition, an avenue exists to explore options for enhancing livestock production in Thaba Nchu by improving livestock and grazing management. This would require regulated and monitored rotational grazing. This is rather a unique opportunity for Thaba Nchu as, in addition to other uses (manure, social class, insurance, traction etc. Udo et al., 2011), livestock contributed to household income.
In Emmaus, the long distance from urban centers means limited market access, constraining opportunities to diversify income with off-farm sources. Under such circumstances, enhancing the production of food crops that could be stored throughout the year to address household food security would be warranted. A focus on good agricultural practices could achieve this. Furthermore, households in Emmaus used limited inputs in relation to the potential output, so the focus here could be on increasing input use and improving input use efficiencies. In Emmaus, interventions could target nutrition security through diversification as crops already provided sufficient energy for the households in terms of potential food availability. This could include local and adaptable vegetables such as amaranthus (Amaranthus retroflexus L.) and okra (Abelmoschus esculentus L.; Bvenura and Afolayan, 2015). Beyond improving crop production for household consumption in Emmaus, farmers could focus on producing cash crops for household income by targeting crops for which a niche market might exist. A case in point is marijuana, if a legal market for medicinal use could be developed. Another example would be teff for the blooming market for healthy foods (Cheng et al., 2017).
Our results showed that land availability did not limit an expansion of crop production in both regions, while labor availability was a limiting factor. So, increasing the available arable land alone is unlikely to increase crop production. In theory, mechanization and the use of herbicides could reduce labor demand for cropping. However, mechanization that is appropriate and economically justified for the scale at which farmers crop in these regions (<0.5 ha) is difficult to achieve.
The potential contribution and drive that the well-developed social security services of the country have in the community cannot be fully encapsulated in our results but is critical in understanding the households that reported no income and seem to meet their welfare needs with on-farm production. Some argue that the provision of these social security services increases reliance on the government and retard the development of economic life in rural areas (Obi, 2011). The availability of social grants may reduce the pressure on farmers to produce for markets and reinforces the status quo whereby farmers primarily produce for household food security. However, these services may also free up income for investment into agricultural inputs or the required start-up to venture into other forms of income diversification (Sinyolo et al., 2016). The lack of evidence on these important aspects limits the scope and robustness of current national discussions on the future of small-scale farming.
Our analysis suggests that farming activities currently contribute little to household income as also noted by Ragie et al. (2020). Yet for some households (at the right of the distributions in Figures 3, 4), farm income alone was sufficient to surpass the poverty line, while the addition of off-farm income elevated them above the living income threshold. Notably, households who derived substantial income from farming activities, often had substantial income from off-farm activities as well. While we cannot disentangle if and how the two are exactly related, it is likely that these households have stronger economic positions, are able to invest more in agricultural production and carry more risk due to their relatively large off-farm income. These households might invest in making their farming activities more efficient to improve their food self-sufficiency and, in turn, free up any additional income for household needs other than food. This small group of farmers is likely in the best position to develop into small- to medium-scale commercial farmers, as the national government envisages.
These dynamics of on-farm vs. off-farm income are important to understand how households patch together a livelihood from all the different sources and what this means for the role of agriculture in each region. Complementary to the findings of Mbatha and Masuku (2018), small-scale farming could be seen as “enhancing” rural economies by contributing food, although it is not the primary source of income for many households as was reported for households in Ghana and Côte d’Ivoire (Alemayehu et al., 2022). Even so, our results indicate that there is potential for small-scale farming to be explored as a primary source of income for a few households (those on the right-hand side of Figures 3, 4). Therefore, we take a step back and question if rural development in South Africa can depend on small-scale farms as proposed for other African countries (Larson et al., 2016). This would be more challenging in South Africa as small-scale farmers who want to commercialize need to fight their way into agricultural sectors that are served by well-established and highly competitive large-scale farming enterprises (Mathinya et al., 2022). This suggests that while small-scale farming systems in South Africa actively supports local diets and household nutrition the contribution to national, continental and global food security is small.
5. Conclusion
We identified a wide diversity in rural livelihoods at regional and household scales. Among others, differences between the regions were likely related to the proximity to urban centers which provided alternative employment and income to people and market access for agricultural produce. Our study highlighted the importance of social security grants for income, as well as irregular sources of income that influenced the degree of reliance of households on farm production. Furthermore, our results demonstrated that farming is one of several important activities that support rural livelihoods. Other activities include small businesses such as sewing. Given the centrality of small-scale farming to hunger and poverty alleviation policies of the country, we suggest it is important to take a step back and question whether the answers for thriving rural livelihoods in former homelands rest within small-scale farming. The farmers interviewed generally seem to have little potential or interest to develop into small- to medium-scale commercially oriented producers. Our findings reveal the weakness of current blanket approaches of rural development interventions to improve people’s lives in former homelands of South Africa that focus on farming. Therefore, the potential for small-scale farmers to serve as an engine for economic growth appears to be limited. However, a few farmers do obtain substantial incomes from farming activities and appear able to invest in intensifying production. Where market access is limited, such agricultural intensification could take the form of enhancing the production of crops with a long shelf-life such as pecan nuts that could be profitably produced at a small scale or investment in livestock production, primarily because scale matters less for profitable production of grazing animals. In the vicinity of urban centers, investments in high-value vegetable crops such as peppers, tomatoes, and mushrooms are an option. Commercialization options for small-scale farmers, however, remain constrained by the country’s highly competitive large-scale farming sector.
Data availability statement
The raw data supporting the conclusions of this article will be made available by the authors, without undue reservation.
Ethics statement
The studies involving humans were approved by Human Research Ethics of the University of the Free State. The studies were conducted in accordance with the local legislation and institutional requirements. The participants provided their written informed consent to participate in this study.
Author contributions
VM, AF, GV, and KG contributed to the conception and design of the research on which the manuscript is based. VM supervised the field surveys, conducted all the interviews, and wrote the first draft of the manuscript. All authors contributed to the article and approved the submitted version.
Acknowledgments
Tshiamo Setsipane and Phahlakazi Maleka: data collection; Cappi Wefers Bettink: data exploration; Sean van der Merwe and Thomas Delaune: refinement of the R codes; Mahlathini (KZN) and the Department of Agriculture and Rural Development (FS): Personnel for logistical arrangements during data collection. Sam Adams and Jim Hammond for assistance with the RHoMIS tool.
Conflict of interest
The authors declare that the research was conducted in the absence of any relationships that may be construed as a potential conflict of interest.
Publisher’s note
All claims expressed in this article are solely those of the authors and do not necessarily represent those of their affiliated organizations, or those of the publisher, the editors and the reviewers. Any product that may be evaluated in this article, or claim that may be made by its manufacturer, is not guaranteed or endorsed by the publisher.
Footnotes
1. ^http://ndb.nal.usda.gov/ndb/search/list
2. ^http://databank.worldbank.org/data/reports.aspx?source=2&series=PA.NUS.PRVT.PP&country=RSA.Ch
3. ^https://www.education.gov.za/Informationfor/ParentsandGuardians/SchoolFees.aspxhttps://www.education.gov.za/Programmes/NationalSchoolNutritionProgramme.aspx
References
Abegunde, V. O., Sibanda, M., and Ajuruchukwu, O. (2022). Effect of climate-smart agriculture on household food security in small-scale production systems: a micro-level analysis from South Africa. Cogent Soc. Sci. 8:2086343. doi: 10.1080/23311886.2022.2086343
Alemayehu, T., Assogba, G. M., Gabbert, S., Giller, K. E., Hammond, J., Arouna, A., et al. (2022). Farming systems, food security and farmers’ awareness of ecosystem services in Inland Valleys: a study from Côte d’Ivoire and Ghana. Front. Sustain. Food Syst. 6:892818. doi: 10.3389/fsufs.2022.892818
Baulch, B., and Hoddinott, J. (2000). Economic mobility and poverty dynamics in developing countries. J. Dev. Stud. 36, 1–24. doi: 10.1080/00220380008422652
Bolliger, A. (2007). Is zero-till an appropriate agricultural alternative for disadvantaged smallholders of South Africa? A study of surrogate systems and strategies, smallholder sensitivities and soil glycoproteins. Masters thesis. University of Copenhagen. Copenhagen.
Boudet, M., Maria, A., Antra, B., Ginette, A., Jayne, Y., and Kathleen, B. (2021). A global view of poverty, gender, and household composition. Policy Research Working Paper. World Bank, Washington, DC. Available at: http://hdl.handle.net/10986/35183
Bvenura, C., and Afolayan, A. J. (2015). The role of wild vegetables in household food security in South Africa: a review. Food Res. Int. 76, 1001–1011. doi: 10.1016/j.foodres.2015.06.013
Castañeda, A., Doan, D., Newhouse, D., Nguyen, M. C., Uematsu, H., and Azevedo, J. P. (2018). A new profile of the global poor. World Dev. 101, 250–267. doi: 10.1016/j.worlddev.2017.08.002
Chapman, S. A., Tjasink, K., and Louw, J. (2021). What works for poor farmers? Insights from South Africa’s national policy evaluations. Afric. Eval. J. 9. doi: 10.4102/aej.v9i1.548
Cheng, A., Mayes, S., Dalle, G., Demissew, S., and Massawe, F. (2017). Diversifying crops for food and nutrition security—a case of teff. Biol. Rev. 92, 188–198. doi: 10.1111/brv.12225
Cheteni, P., Khamfula, Y., and Mah, G. (2020). Exploring food security and household dietary diversity in the eastern Cape Province, South Africa. Sustain. For. 12, 1–16. doi: 10.3390/su12051851
de la Hey, M., and Beinart, W. (2017). Why have south African smallholders largely abandoned arable production in fields? A case study. J. South. Afr. Stud. 43, 753–770. doi: 10.1080/03057070.2016.1265336
D'Haese, M., Vink, N., Nkunzimana, T., Van Damme, E., van Rooyen, J., Remaut, A., et al. (2013). Improving food security in the rural areas of KwaZulu Natal province, South Africa: too little, too slow. Dev. South. Afr. 30, 468–490. doi: 10.1080/0376835X.2013.836700
FAO (2006). Baseline survey report protecting and improving household food security and nutrition in HIV/AIDS affected areas in Manica and Sofala Province, Maputo, Mozambique. Available at: http://www.fao.org/fileadmin/user_upload/eufao-fsi4dm/doc-training/baseline_june07.pdf (Accessed May, 2007).
Frelat, R., Lopez-Ridaura, S., Giller, K. E., Herrero, M., Douxchamps, S., Andersson Djurfeldt, A., et al. (2016). Drivers of household food availability in sub-Saharan Africa based on big data from small farms. Proc. Natl. Acad. Sci. U. S. A. 113, 458–463. doi: 10.1073/pnas.1518384112
Gibson, K. (2020). “Collectively performed reciprocal labor: reading for possibility” in The Handbook of Diverse Economies. eds. J. K. Gibson-Graham and K. Dombroski, vol. 2020 (Cheltenham UK: Edward Elgar Publishing), 170–178.
Giller, K. E., Delaune, T., Silva, J. V., Descheemaeker, K., van de Ven, G., Schut, A. G. T., et al. (2021). Small farms and development in sub-Saharan Africa: farming for food, for income or for lack of better options? Food Security 13, 1431–1454. doi: 10.1007/s12571-021-01209-0
Hammond, J., Fraval, S., van Etten, J., Suchini, J. G., Mercado, L., Pagella, T., et al. (2017). The rural household multi-Indicator survey (RHoMIS) for rapid characterisation of households to inform climate smart agriculture interventions: description and applications in East Africa and Central America. Agric. Syst. 151, 225–233. doi: 10.1016/j.agsy.2016.05.003
Harris, D., Oduol, J., and Hughes, K. (2021). Poverty alleviation through technology-driven increases in crop production by smallholder farmers in dryland areas of sub-Saharan Africa: how plausible is this theory of change? Front. Sustain. Food Syst. 5:496. doi: 10.3389/fsufs.2021.723301
Hartung, C., Lerer, A., Anokwa, Y., Tseng, C., Brunette, W., and Borriello, G. (2010). “Open data kit: Tools to build information services for developing regions” in Proceedings of the 4th ACM/IEEE International Conference on Information and Communication Technologies and Development. London, United Kingdom.
Hebinck, P., Fay, D., and Kondolo, K. (2011). Land and agrarian reform in South Africa’s eastern Cape Province: caught by continuities. J. Agrar. Chang. 11, 220–240. doi: 10.1111/j.1471-0366.2010.00297.x
Holden, S., Shiferaw, B., and Pender, J. (2001). Market imperfections and land productivity in the Ethiopian highlands. J. Agric. Econ. 52, 53–70. doi: 10.1111/j.1477-9552.2001.tb00938.x
Hurlbut, W. B. (2018). Overcoming poverty and inequality in South Africa. An assessment of drivers, constraints and opportunities. ed. W. B. Hurlbut, Gauteng, South Africa, The World Bank. Available at: http://hdl.handle.net/10986/29614
Ighodaro, I. D., Lategan, F. S., and Mupindu, W. (2016). The impact of soil erosion as a food security and rural livelihoods risk in South Africa. J. Agric. Sci. 8, 1–9760. doi: 10.5539/jas.v8n8p1
Jolliffe, D. M., Mahler, D. G., Lakner, C., Atamanov, A., and Tetteh Baah, S. K. (2022). Assessing the impact of the 2017 PPPs on the international poverty line and global poverty. Policy Research working paper no. WPS 9941, The World Bank. Available at: http://documents.worldbank.org/curated/en/353811645450974574/Assessing-the-Impact-of-the-2017-PPPs-on-the-International-Poverty-Line-and-Global-Poverty
Kepe, T., and Tessaro, D. (2014). Trading-off: rural food security and land rights in South Africa. Land Use Policy 36, 267–274. doi: 10.1016/j.landusepol.2013.08.013
Khumalo, N., and Sibanda, M. (2019). Does urban and peri-urban agriculture contribute to household food security? An assessment of the food security status of households in Tongaat, eThekwini municipality. Sustain. For. 11, 1–24. doi: 10.3390/su11041082
Kruger, E., and Gilles, J. L. (2014). A review of participatory agricultural Research and Development in South Africa and KwaZulu Natal. Missouri University of Science and Technology, Rolla, Missouri, USA. Available at: www.communitycommons.org
Larson, D. F., Muraoka, R., and Otsuka, K. (2016). Why African rural development strategies must depend on small farms. Glob. Food Sec. 10, 39–51. doi: 10.1016/j.gfs.2016.07.006
Materechera, F., and Scholes, M. (2022). Scenarios for sustainable farming systems for macadamia nuts and mangos using a systems dynamics lens in the Vhembe District, Limpopo, South Africa. Agriculture 12, 1–19. doi: 10.3390/agriculture12101724
Mathinya, V. N., Franke, A. C., Van De Ven, G. W. J., and Giller, K. E. (2022). Productivity and constraints of small-scale crop farming in the summer rainfall region of South Africa. Outlook Agric. 51, 139–154. doi: 10.1177/00307270221091839
Matona, T. (2019). South Africa's national review report. The Presidency. Pretoria, South Africa. Available at: https://sustainabledevelopment.un.org/content/documents/23402RSA_Voluntary_National_Review_Report__9_July_2019.pdf
Maziya, M., Mudhara, M., and Chitja, J. (2017). What factors determine household food security among smallholder farmers? Insights from Msinga, KwaZulu-Natal, South Africa. Agrekon 56, 40–52. doi: 10.1080/03031853.2017.1283240
Mbatha, M. W., and Masuku, M. M. (2018). Small-scale agriculture as a panacea in enhancing south African rural economies. J. Econ. Behav. Stud. 10, 33–41. doi: 10.22610/jebs.v10i6(J).2591
Mkuhlani, S., Crespo, O., Rusere, F., Zhou, L., and Francis, J. (2019). Classification of small-scale farmers for improved rainfall variability management in South Africa. Agroecol. Sustain. Food Syst. 44, 7–29. doi: 10.1080/21683565.2018.1537325
Naumann, C. (2014). Stability and transformation in a south African landscape: rural livelihoods, governmental interventions and agro-economic change in Thaba Nchu. J. South. Afr. Stud. 40, 41–57. doi: 10.1080/03057070.2014.877653
NDP (2013). National Development Plan Vision 2030: Our future- make it work. National Planning Commission. Pretoria, South Africa. Available at: https://www.gov.za/issues/national-development-plan-2030
Neves, D., and du Toit, A. (2013). Rural livelihoods in South Africa: complexity, vulnerability and differentiation. J. Agrar. Chang. 13, 93–115. doi: 10.1111/joac.12009
Ntsebeza, L., and Hall, R. (2007). The Land Question in South Africa: The Challenge of Transformation and Redistribution. University of Cape Town, South Africa: HSRC Press
Obi, A. (2011). “The land question in smallholder development in South Africa” in Institutional Constraints to Small Farmer Development in Southern Africa (Wageningen, The Netherlands: Wageningen Academic Publishers)
Okunlola, A., Ngubane, M., Cousins, B., and Toit, A. D. (2016). Challenging the stereotypes: small-scale black farmers and private sector support programs in South Africa: a national scan. Res. Rep. PLAAS 53:ix.
Ragie, F. H., Olivier, D. W., Hunter, M. L., Erasmus, B. F. N., Vogel, C., Collinson, M., et al. (2020). A portfolio perspective of rural livelihoods in Bushbuckridge, South Africa. S. Afr. J. Sci. 116:7522. doi: 10.17159/sajs.2020/7522
Ritzema, R. S., Douxchamps, S., Fraval, S., Bolliger, A., Hok, L., Phengsavanh, P., et al. (2019). Household-level drivers of dietary diversity in transitioning agricultural systems: evidence from the greater Mekong subregion. Agric. Syst. 176:102657. doi: 10.1016/j.agsy.2019.102657
Rogerson, C. M., and Letsoalo, E. M. (1985). “Resettlement and under-development in the black ‘homelands’ of South Africa” in Population and Development Projects in Africa. ed. J. Clarke (Cambridge: Cambridge University Press), 176–193.
Ruiters, G. (2016). The moving line between state benevolence and control: municipal indigent Programs in South Africa. J. Asian Afr. Stud. 53, 169–186. doi: 10.1177/0021909616667522
Sinyolo, S., Mudhara, M., and Wale, E. (2016). The impact of social grants on the propensity and level of use of inorganic fertiliser among smallholders in Kwazulu-Natal, South Africa. Agrekon 55, 436–457. doi: 10.1080/03031853.2016.1243063
Udo, H. M. J., Aklilu, H. A., Phong, L. T., Bosma, R. H., Budisatria, I. G. S., Patil, B. R., et al. (2011). Impact of intensification of different types of livestock production in smallholder crop-livestock systems. Livest. Sci. 139, 22–29. doi: 10.1016/j.livsci.2011.03.020
van de Ven, G. W. J., de Valença, A., Marinus, W., de Jager, I., Descheemaeker, K. K. E., Hekman, W., et al. (2021). Living income benchmarking of rural households in low-income countries. Food Security 13, 729–749. doi: 10.1007/s12571-020-01099-8
Keywords: farming systems, food security, homelands, rural development, SDGs
Citation: Mathinya VN, Franke AC, van de Ven GWJ and Giller KE (2023) Can small-scale farming systems serve as an economic engine in the former homelands of South Africa? Front. Sustain. Food Syst. 7:1222120. doi: 10.3389/fsufs.2023.1222120
Edited by:
Ademola Braimoh, World Bank Group, United StatesReviewed by:
Peter Hazell, International Food Policy Research Institute, IndiaFenji Materechera-Mitochi, Rhodes University, South Africa
Farirai Rusere, University of the Witwatersrand, South Africa
Copyright © 2023 Mathinya, Franke, van de Ven and Giller. This is an open-access article distributed under the terms of the Creative Commons Attribution License (CC BY). The use, distribution or reproduction in other forums is permitted, provided the original author(s) and the copyright owner(s) are credited and that the original publication in this journal is cited, in accordance with accepted academic practice. No use, distribution or reproduction is permitted which does not comply with these terms.
*Correspondence: V. N. Mathinya, bWF0aGlueWF2bkB1ZnMuYWMuemE=