
94% of researchers rate our articles as excellent or good
Learn more about the work of our research integrity team to safeguard the quality of each article we publish.
Find out more
ORIGINAL RESEARCH article
Front. Sustain. Food Syst. , 28 September 2023
Sec. Social Movements, Institutions and Governance
Volume 7 - 2023 | https://doi.org/10.3389/fsufs.2023.1212764
This article is part of the Research Topic Alternative Food Networks for Sustainable, Just, Resilient and Productive Food Systems View all 15 articles
 Riley Denton1†
 Margarita Velandia1*†
 Jackie Yenerall1Karen DeLong1
 Carlos Trejo-Pech1
 Xuqi Chen1Keiko Tanaka2Karen Rignall2
 Susan Schexnayder3
Introduction: The food justice movement focuses on resolving food system inequalities, including, but not limited to, income, ethnicity, and race differences related to household access to food, farmer access to markets, and the fair treatment of farmworkers. Previous studies have focused on food system inequalities from the consumer demand side, but only a few studies have focused on the role farmers play in creating more equitable food systems. An example of a market model aiming to fulfill various missions of the food justice movement is Fresh Stop Markets (FSMs). FSMs aggregate food from local farmers and sell shares on a sliding scale based on consumers’ income. Lower income households pay less than higher-income households for the same food. A vital component of this market concept is farmers’ willingness to sell produce through FSMs.
Methods: We used data from a 2020 survey of Tennessee and Kentucky fruit and vegetable farmers and the double-bounded dichotomous choice contingent valuation approach to assess farmers’ willingness to sell produce through FSMs when faced with a price discount scenario. A probit regression was used to investigate the factors correlated with farmers’ willingness to sell produce through FSMs.
Results and discussion: Results suggest gross farm revenue, farmer age, education, experience selling produce through farmers markets, and running programs on the farm to educate communities about sustainable agriculture and food systems are associated with farmers’ willingness to sell produce through FSMs.
Conclusion: Farmer and farm business characteristics, as well as prior experience running education programs on the farm related to sustainable agriculture and food systems are important factors to consider when trying to engage farmers willing to sell produce through FSMs.
Previous studies have described the mission of the food justice movement as one that aims to restructure food systems to address societal inequality and disparity issues (Gottlieb and Joshi, 2010). When addressing food systems, some define the food justice movement in combination with ecological and economic sustainability and social justice (Alkon and Agyeman, 2011). Others have emphasized the existence of racial and economic inequalities through the food systems from production to consumption and ways to address these inequalities (Alkon and Mares, 2012). In general, the food justice movement addresses various elements of the food system, including unequal access to fresh, nutritious, affordable, and culturally appropriate food among households, the wellness of farm workers, and the social, economic, and environmental sustainability of family farms, among other related elements (Gottlieb and Joshi, 2010; Alkon and Agyeman, 2011; Allen, 2016).
While the number of studies related to initiatives connected to the food justice movement in the context of local food systems has increased in the past two decades, the vast majority of these studies focus on strategies to increase consumer access to fresh fruits and vegetables at market outlets such as farmers markets, Community Supported Agriculture markets (CSAs), and food hubs (Quandt et al., 2013; Cotter et al., 2017; Pershing and Hendrickson, 2017; Bradford et al., 2019; Hanson et al., 2019; Kaiser et al., 2020; McGuirt et al., 2020; Kasprzak et al., 2021).
There are very few studies evaluating farmers’ experiences and involvement with initiatives connected to the food justice movement. The majority of these studies focus on farmers selling or willingness to sell produce to low-income consumers and the impact of these activities on the economic viability of their businesses (Pilgeram, 2011; Pershing and Hendrickson, 2017; Hodgins and Fraser, 2018; Kaiser et al., 2020; Sitaker et al., 2020; Montri et al., 2021). These studies use farmer interviews to assess motivations and barriers to selling products through market outlets located in low-income areas or serving low-income communities. Limitations of these studies include the inability to generalize results from a small sample of farmer interviews (i.e., 12–27 farmers), and their focus on market outlets aiming to fulfill one goal of the food justice mission (e.g., increase low-income households’ access to farm-fresh products) but not multiple goals of the food justice mission.
Data from a 2020 survey of Tennessee and Kentucky fruit and vegetable farmers was used to assess farmers’ willingness to sell produce through Fresh Stop Markets (FSMs). FSMs are defined as a market outlet that addresses multiple aspects of the food justice mission. Specifically, FSMs address low-income, food-insecure (i.e., having unreliable or restricted access to adequate food due to individuals’ household-economic status or other social factors) households’ access to farm-fresh products, connecting small- and medium-sized, limited-resource farms to markets, and community engagement that promotes and supports sustainable agriculture, sustainable food systems, and healthy eating (Velandia et al., 2021). We used the double-bounded dichotomous choice contingent valuation approach (Hanemann et al., 1991) as a reference to design a survey instrument aiming to assess farmers’ willingness to sell produce through FSMs. This approach allowed us to present realistic price discount scenarios survey respondents will face when selling produce through FSMs. A probit regression was then used to evaluate the factors correlated with farmers’ willingness to sell produce through FSMs at a price discount.
Some of the correlations evaluated with the probit regression included the correlation between willingness to sell produce through FSMs and activities that represent different levels of farmer engagement in terms of money and time investments (i.e., donating produce to food banks, providing low-income family discounts, participating as leaders or volunteers in organizations with a food justice mission, and running programs on the farm to educate the community about sustainable agriculture and food systems). For example, donating produce will imply low time and money investments as a third party coordinates the logistics of donations. In contrast, running an on-farm education program implies a higher investment from the farmers’ perspective than donating produce.
Farmers’ willingness to participate in initiatives connected to the food justice movement, specifically selling their products through market outlets with a food justice mission, such as FSMs, is critical for the success and long-term sustainability of these initiatives (Velandia et al., 2021). For the case of FSMs, understanding the profile of farmers and farm businesses that are more likely to be interested in participating in FSMs is essential when evaluating the ability to engage farmers in FSMs and replicate this market model successfully.
FSMs is an example of an initiative supported by New Roots Inc., a non-profit organization covering various aspects of the food justice mission that depend heavily on farmer engagement (Velandia et al., 2021). New Roots Inc. has successfully implemented this market model for more than 10 years with a great impact on the community they serve, providing access to fresh, healthy organic produce to 715 families—a large percentage of these families are categorized as limited resources households-, and generating a revenue of $160,000 for local farmers in 2021 (New Roots Inc., 2023). The longevity of this market model and the positive impact this market has had on Kentucky communities make this market model an attractive model to be replicated.
A FSM is a market occurring every 2 weeks, for 20 weeks, during the growing season at a specific location that provides local produce to customers on a sliding scale. This means that households receive access to the same amount of food at different costs based on their income. Therefore, higher-income households will pay a higher amount for a share (i.e., a box of fresh produce) than lower-income families so that these families can have access to fresh food at an affordable cost. Currently, there are eight FSMs, seven located in Louisville, Kentucky, and one located in New Albany, Indiana (New Roots, Inc., 2023).
On the production side, New Roots, Inc. tries to guarantee that fresh produce available for a FSM originates from small, limited-resource, minority farmers. New Roots, Inc. is responsible for all marketing efforts. Therefore, farmers have no costs associated with recruiting and maintaining buyers. Additionally, New Roots, Inc. is responsible for aggregating the food and delivering it to the markets to decrease the logistics burden for farmers. Finally, although there is no binding contract between the farmer and New Roots, Inc., farmers have a better understanding of the products they could sell through FSMs before the production season because New Roots, Inc. provides information about the potential produce volume and kinds of produce a farmer could sell through the FSMs each season. This information and reduced marketing efforts associated with selling produce through FSMs reduce farmers’ risk associated with selling produce through other direct-to-consumer market outlets (e.g., farmers markets). Farmers who have sold produce through FSMs indicated that these market outlets are less labor-intensive, entail lower marketing efforts, and allow them to move larger volumes of products compared to other outlets such as farmers markets and CSAs (Velandia et al., 2021). These benefits explain why farmers find this market outlet attractive even though they receive prices lower than those they receive for their products at other retail market outlets such as farmers markets. Three farmers providing more than 50% of the produce sold through FSMs to shareholders in 2019 indicated receiving prices between 20 and 30% below the prices they receive for produce sold through farmers markets and CSAs (Velandia et al., 2021).
The data used in this study is from a 2020 survey of Tennessee and Kentucky fruit and vegetable farmers conducted between February and May. The survey instrument was approved by the University of Tennessee Institutional Review Board (IRB) (UTK IRB-19-05601-XM).
The contact list of 961 farmers representing fruit and vegetable farms located in 32 counties across East Tennessee and 14 counties near the Lexington and Louisville, Kentucky areas used for this survey was obtained from the Tennessee and Kentucky Departments of Agriculture. The 14 Kentucky counties included in the survey were counties where FSMs are or were located, or counties that share boundaries with counties where FSMs are or were located. We assume that farms located in these Kentucky counties might have a better understanding of how FSMs work and, therefore, be more likely to provide useful information about their willingness or not to sell products through FSMs. We acknowledge that the selection of counties to be included in the survey will impact the representativeness of the sample and our ability to generalize results from our analysis. In the results section, we discuss the representativeness of the sample used in this study.
The survey was a mixed-mode survey consisting of mail [paper] and web versions. A total of 245 Tennessee farmers for whom we had e-mail addresses received the web version of the survey between February and March 2020. Those Tennessee farmers for whom we only had mailing addresses and not e-mail addresses (i.e., 58) and those who did not complete the web version of the survey by April 2020 (i.e., 222) received a mail version of the survey. A mail version was also sent to all Kentucky farmers (i.e., 658) in the contact list since we only had mailing address information for these farms. A total of 161 farmers from the 961 farmers included in the contact list completed the survey. This represents a 17% response rate.
The survey included questions related to farmer engagement with food justice activities, including donating produce to food banks, providing low-income family discounts, participating as leaders or volunteers in organizations with a food justice mission, and running programs on the farm to educate the community about sustainable agriculture and food systems.
The survey also included questions related to farmers’ willingness to sell produce through FSMs, market outlets they used, and farmer and farm business characteristics (e.g., farmer age, education, gross farm revenue). A copy of the survey instrument is available from the authors upon request.
Only farmers who have never sold produce through FSMs were asked about their willingness to sell produce through FSMs. Before eliciting respondents’ willingness to sell produce through FSMs, we provided the following information:
“Imagine that you had the choice to sell produce through Fresh Stop Markets. This market outlet has the following characteristics:
1. Fresh Stop Markets representatives communicate with the farmers about items needed for the market. They are responsible for aggregating the food and delivering it to the markets to decrease the logistics burden for farmers.
2. A non-profit organization is responsible for all marketing efforts. Therefore, farmers have no costs associated with recruiting and maintaining shareholders.
3. The mission of this market is to give low-income, food-insecure families access to fresh, healthy foods.
4. There is no binding contract between the farmer and the non-profit organization coordinating this market opportunity, but this organization provides information about the potential produce volume and kinds of produce a farmer could sell through the Fresh Stop Markets.”
The double-bounded dichotomous choice contingent valuation approach (Hanemann et al., 1991) was used as a reference to assess farmers’ willingness to sell produce through FSMs. The method involves presenting respondents with two bids, in this case, two price discount scenarios. The second bid or price discount scenario is contingent on the response to the first bid or price discount scenario. If the respondent answers “yes” to the first bid or price discount, a second bid or price discount higher than the first one is presented to the respondent. If the respondent says “no” to the first bid or price discount, then a second bid or price discount lower than the first one is presented to the respondents. Our approach differs from the double-bounded dichotomous choice contingent valuation approach in that all respondents were presented with the same initial bid or price discount instead of randomly assigning various price discounts among respondents.
The approach used in this study allowed us to assess farmer willingness to sell produce through FSMs under realistic market conditions, specifically price discounts over retail prices of anywhere between 20 and 30%. All respondents were initially asked if they were willing to sell to FSMs at a 25% price discount (i.e., prices paid are 25% below retail prices). Next, respondents were presented with a second possible price discount based on their response to this initial price discount. Those who responded yes to the 25% discount were asked if they would be willing to sell produce through FSMs at a 30% price discount. Those who responded no to the 25% discount were asked if they would be willing to sell produce at a 20% price discount (see Figure 1). The 20–30% price discount scenarios presented to respondents were created using information from interviews we conducted with the executive director of New Roots Inc. (organization coordinating FSMs) and three farmers who were selling produce through FSMs and who were providing more than 50% of the produce sold by FSMs to customers in 2019. The executive director of New Roots Inc. provided information about the value of a FSM share based on prices paid to farmers. All farmers we interviewed were using community supported agriculture (CSA) as a marketing strategy, and therefore, we asked them to indicate the value of their CSA shares. We estimated the difference between the value of the FSM shares and the value of the farmers’ CSA shares. This information was used to determine the percent price discount scenarios presented to survey respondents.
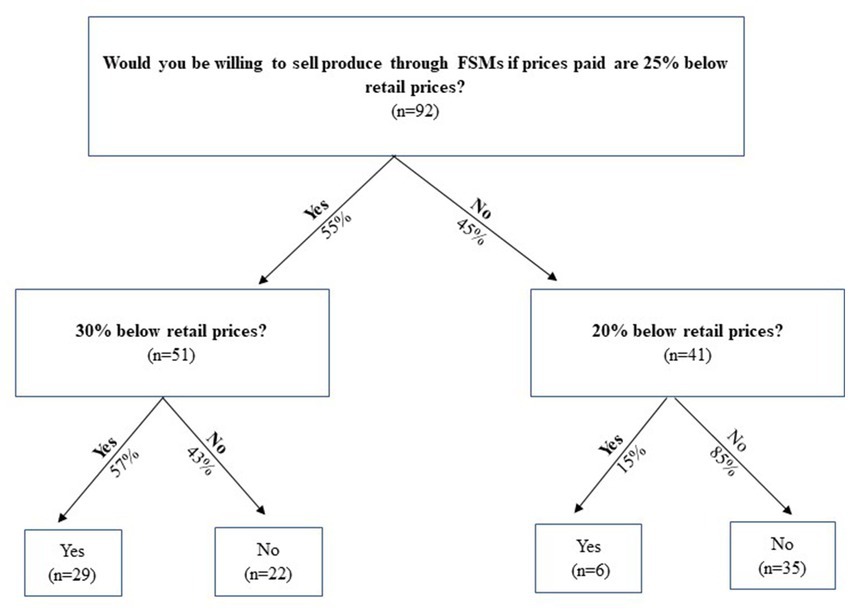
Figure 1. Price discount scenarios presented to respondents to assess their willingness to sell produce through FSMs.
We created a variable that captures farmers’ willingness to sell produce at prices between 20 and 30% below retail prices. Similar to Rihn et al. (2023), we coded producer responses regarding their willingness to sell produce at a price discount scenario between 20 and 30% into a binary variable. Our single binary indicator of willingness to sell takes a value of one for respondents who responded Yes-Yes, Yes-No, or No-Yes, or Yes to at least one of the price discount scenarios presented in Figure 1. Those who selected no (i.e., No-No) in all price discount scenarios are, in general, those who are not interested in selling produce through FSM at any price discount of 20% or above.
When creating our single binary variable indicator, we noticed only six respondents indicated that they were not willing to sell produce through FSMs at a 25% price discount level but were willing to sell produce through FSMs at a 20% price discount level (see Figure 1). When considering these six respondents as unwilling to sell produce through FSM, we ignore that we have additional information indicating they were interested in selling produce through FSM when faced with a 20% discount scenario. Because we had very few observations in the No-Yes category, we wanted to ensure these observations belonged to the category representing respondents willing to sell produce through FSMs. We tested for statistically significant differences between the characteristics of those who indicated a willingness to sell produce at a 20% price discount level (i.e., No-Yes) and the characteristics of the respondents who indicated they were willing to sell produce at a 25% (i.e., Yes-No) or 30% (Yes-Yes) price discount level. Overall, these subsamples were similar. These results further justify the way we coded responses to create our willingness to sell variable.
A list of the variables capturing respondent and farm characteristics hypothesized to influence willingness to sell produce through FSMs, as well as their definitions, hypothesized signs, and descriptive statistics, are included in Table 1.
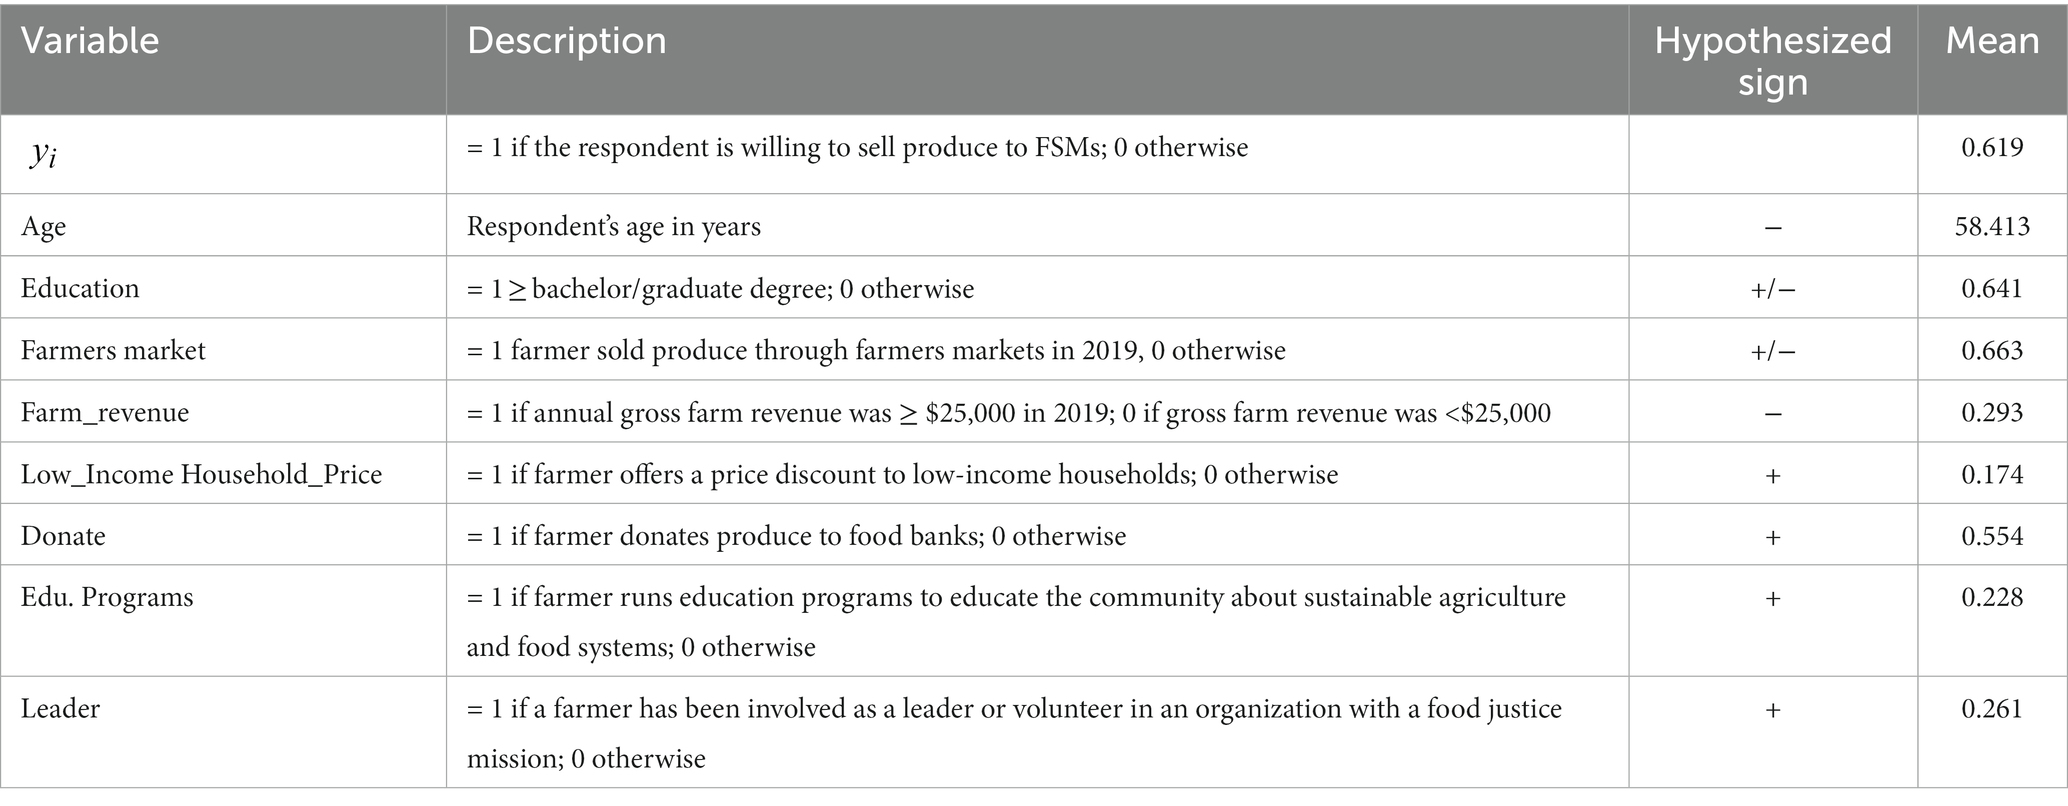
Table 1. Regression sample dependent and explanatory variables’ description and summary statistics (n = 92).
In this study, we assumed that a farmer’s decision to sell produce through FSMs is not only related to reducing risks associated with the uncertainty of marketing fruits and vegetables and maintaining or improving these farms’ economic viability but also to farmers’ values, goals, and motivations for farming (Kaiser et al., 2020; Sitaker et al., 2020; Montri et al., 2021). For example, previous studies suggest that farmers’ interest in serving low-income communities and the ability to promote sustainable agriculture, sustainable food systems, and healthy eating through community engagement could be related to farmers’ participation in market outlets aiming to fulfill at least one of the food justice missions (Kaiser et al., 2020; Sitaker et al., 2020).
We captured farmer values, goals, and motivations for farming through variables indicating farmer engagement with food justice activities such as offering price discounts to low-income households (Low_Income_Household_Price), donating produce to a food bank (Donate), serving as a volunteer or leader in an organization with a food justice mission (Leader), and offering on-farm, agricultural education programs to communities (Edu.Programs). Each of these variables captures different levels of engagement or investment in terms of time and money and is considered a non-monetary motivation for farmers’ willingness to participate in FSMs.
We expected that all variables described above (Low_Income_Household_Price, Donate, Leader, and Edu.Programs) might positively correlate with farmers’ willingness to sell produce through FSMs. We assumed that farmers offering price discounts might already have a price discount incorporated in the business plan that aligns with their values and motivations for farming, which gives them more flexibility to transition to selling produce through FSMs. Additionally, donating produce gives farmers an avenue to fulfill their goal of increasing low-household income access to fresh produce while at the same time giving them an alternative avenue to sell produce at discounted prices that otherwise will be donated to a food bank. Also, selling produce through FSMs could align with their values and goals related to participating as leaders and volunteers in organizations with a food justice mission. Finally, farmers running educational programs on their farms might perceive FSMs as an extension of their efforts to educate the community about sustainable food systems. Farmers already investing time and money in educating the community on sustainable food systems might be more committed to further any efforts to achieve the goals of the food justice mission in their communities.
We assumed that farm business characteristics could also be correlated with farmers’ willingness to sell produce through FSM. Specifically, we assumed that gross farm revenue (Farm_revenue), as a measure of farm size, is negatively correlated with farmers’ willingness to sell produce through FSMs. The literature related to farmer participation in an Alternative Food Network (AFN) suggests that small farms might be more attracted to sell products through these networks, which FSMs could be classified as, because they might be more likely to have excess labor with a low opportunity cost (e.g., no job opportunities, lack of skills) such that farmers would be willing to participate in market activities with low returns (Corsi et al., 2018).
We assumed that farmer characteristics are correlated with farmers’ willingness to sell produce through FSMs. We specifically hypothesized that farmer age (Age), farmer education (Education), and farmer experience selling produce through farmers markets (Farmers_market) are correlated with farmers’ willingness to sell produce through FSMs.
We postulated that the farmers’ age is negatively correlated with farmers’ willingness to sell produce through FSMs. As suggested by previous studies, older farmers have shorter planning horizons and, thus, might be less likely to change or modify their production and marketing strategies (Walton et al., 2008; Zhong et al., 2016; Edge et al., 2018; Dong et al., 2019). On the other hand, we hypothesized that education could be positively but also negatively correlated with farmers’ willingness to sell produce through FSMs. We expect knowledge and information to affect farmer marketing or market outlet choice decisions (Pilgeram, 2011; Zhong et al., 2016; Edge et al., 2018). Those decisions could be to sell but also to not sell produce through FSMs.
Finally, we expect farmers’ experience selling produce through farmers markets (Farmers_market) could be negatively or positively correlated with farmer willingness to sell produce through FSMs. On the one hand, price discounts over retail prices (e.g., farmers markets prices) might deter farmers from selling produce through FSMs. On the other hand, the potential reduced labor and costs associated with marketing produce through FSMs compared to farmers markets might motivate farmers to sell produce through FSMs.
Survey respondents’ willingness to participate in FSMs is hypothesized to be a function of farmers’ values, motivation for farming, and farmer and farm business characteristics as described below,
where captures willingness to sell produce through FSMs, and takes the value of one ( = 1) if the respondent is willing to sell produce through FSMs at a price discount between 20 and 30% and takes the value of zero ( = 0) otherwise; captures all respondent and farm characteristics hypothesized to influence willingness to sell produce through FSMs (see the hypotheses section above); represents all parameters associated with ; and is the error term.
The probability of a farmer i willing to sell produce through FSM is defined as (Amemiya, 1981; Greene, 2012),
Φ ,
where is the cumulative distribution function for the random variable . We assume is normally distributed, and therefore Φ(.) is the cumulative normal distribution. Therefore, a probit regression is used to estimate the binary choice model described in Equation (2) (Amemiya, 1981; Greene, 2012).
In order to evaluate the association between the probability of a farmer willing to sell produce through FSMs and , we estimated the average marginal effects (Greene, 2012). The marginal effects allow us to evaluate whether there is a positive or negative association between the independent variables, the probability of a farmer’s willingness to sell produce through FSMs and the magnitude of this association. The marginal effect for a continuous variable k can be defined as,
where is the probability density function for the normal distribution. For a discrete variable l the marginal effects can be defined as,
The probit regression and the associated marginal effects were estimated using the statistical software Stata version 18 (StataCorp., 2023).
There were 112 observations for analysis after eliminating survey responses of those who indicated not producing fruits and vegetables for sale in 2019 and those who were selling or had sold products through FSMs (i.e., 49). A total of 92 observations were used for the regression analysis after eliminating 20 observations due to missing values.
Similar to Velandia et al. (2020a,b), we assessed the representativeness of the Tennessee and Kentucky fruit and vegetable farms included in the regression sample by comparing the sample distribution of acres in fruit and vegetable production to the distribution of acres in vegetable production according to the 2017 Census of Agriculture (USDA, 2022).
Figure 2 shows the distribution of Tennessee farms based on acres in fruit and vegetable production for the regression sample and the distribution of Tennessee farms based on acres in vegetable production according to the 2017 Census of Agriculture (USDA, 2022). The distribution of farms for the regression sample followed closely the distribution of vegetable farms according to the 2017 Census of Agriculture. The regression sample tends to underrepresent farms with less than 1 acre in vegetable production and slightly overrepresent farms reporting between 5 and 50 acres in vegetable production. The overrepresentation of medium-sized farms (i.e., 5–50 acres) could be explained by the fact that those farms might be in a better position to expand their market outlets based on the volume of fruits and vegetables they produce compared to those farms with less than 1 acre in vegetable production. They, therefore, might be more likely to be interested in responding to a survey assessing their willingness to participate in a new market outlet.
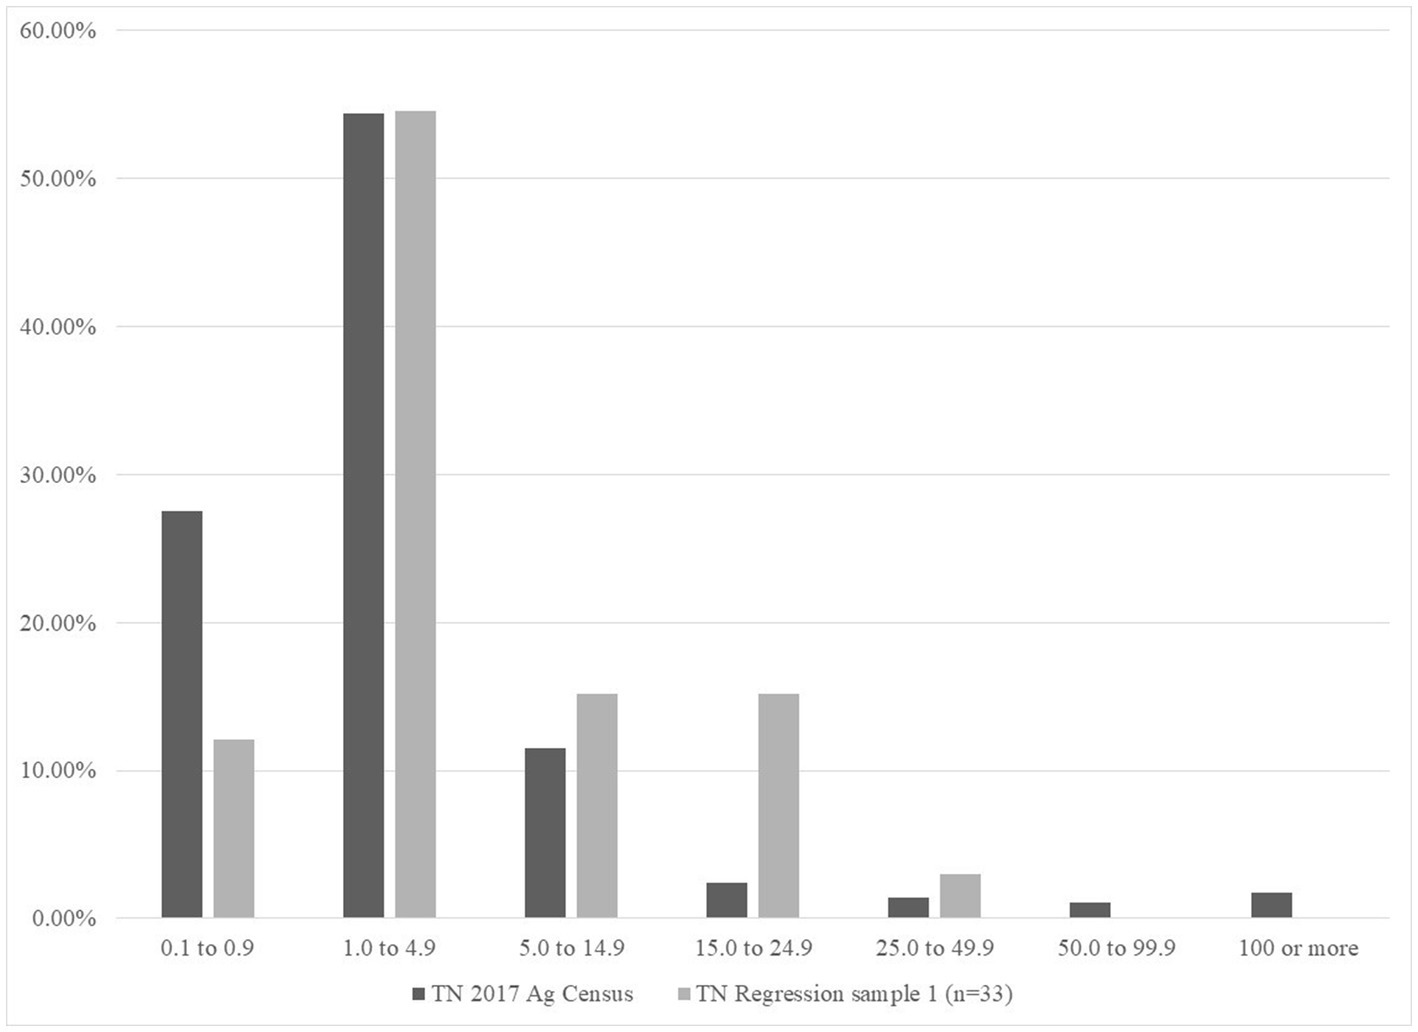
Figure 2. Percentage of Tennessee farms in each farm size category based on acres in vegetable production according to the 2017 U.S. Census of Agriculture and the probit regression sample.
We evaluated the representativeness of the Kentucky farms included in the regression sample by comparing the average fruit and vegetable acres reported by the Kentucky farms included in this sample with the average acres in vegetable production for Kentucky farms according to the 2017 Census of Agriculture (USDA, 2022). On average, the Kentucky farms included in the regression sample are larger in size, based on acres in fruit and vegetable production (7 acres), compared to the Kentucky vegetable farms according to the 2017 Census of Agriculture (3.63 acres). Similar to the Tennessee farms included in the regression sample, operators of larger Kentucky farms might be more likely to respond to a survey exploring their participation in a new market outlet because they might be in a better position to expand their market outlets compared to operators of smaller farms.
The means of the dependent and all explanatory variables included in the regression analysis are presented in Table 1. More than half of the respondents (62%) indicated they were willing to sell produce through FSMs at a price discount of anywhere between 20 and 30%. About 64% of the respondents included in the probit regression indicated having a bachelor’s degree or higher, and they were, on average, 58 years old. About 29% of the respondents reported more than $25,000 in annual gross farm revenue. More than half (66%) of the respondents reported selling produce through farmers markets in 2019.
More than half of the respondents (55%) included in the regression sample reported donating produce through food banks. About a fourth of the respondents (26%) indicated they had been involved with an organization with a food justice mission as a leader or volunteer, and also about a fourth of respondents (23%) indicated they run educational programs to educate the community about sustainable agriculture and food systems. Finally, 17% of the respondents indicated they offer price discounts to low-income households.
Parameter estimates from the probit regression with the corresponding standard errors, statistical significance levels, average marginal effects, and diagnostic test results are presented in Table 2. We only present the marginal effects associated with statistically significant parameters. The Wald test statistic evaluating the overall significance of the probit regression suggests at least one of the independent variables included in the regression is different than zero. The condition index (15.82) indicates there are no collinearity issues that could affect inferences from the estimated parameters (Belsley et al., 1980).
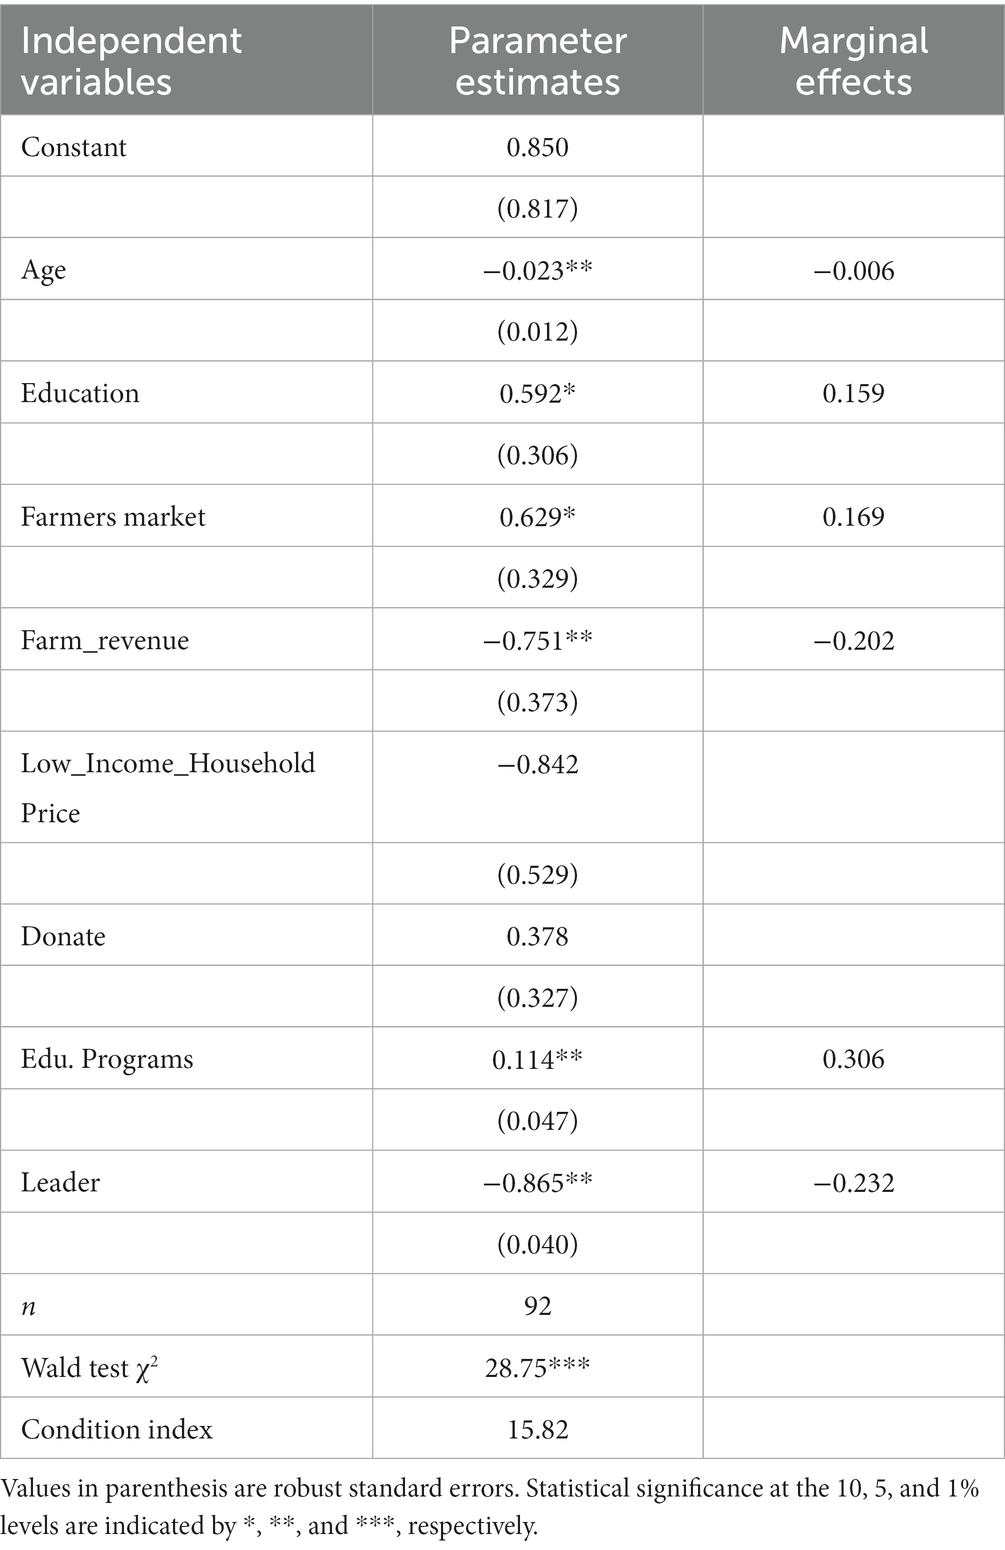
Table 2. Parameter estimates from the bivariate probit regression.
There were three variables negatively correlated and three positively correlated with the probability of a respondent’s willingness to sell produce through FSMs. The three variables negatively correlated with the probability of participating in FSMs were gross farm revenue (Farm_revenue), operator age (Age) and farmers serving or who have served as volunteers or leaders in an organization with a food justice mission (Leader). The three variables positively correlated with the probability of participating in FSMs were operator education (Education), experience selling produce through farmers markets (Farmers_market), and farmers running education programs to educate the community about sustainable agriculture and food systems (Edu.Programs).
These results suggested that older operators, those reporting more than $25,000 in gross farm revenue, and those who have been involved as leaders or volunteers in organizations with a food justice mission are less likely to be willing to sell produce through FSMs at price discounts between 20 and 30% over retail prices. Respondents who reported annual gross farm revenue of more than $25,000 were 20% less likely to be willing to sell produce through FSMs. Those respondents who have been engaged as leaders or volunteers in an organization with a food justice mission were 23% less likely to be willing to sell produce through FSMs.
In contrast, the results suggest that farmers with a bachelor’s degree or higher, experience selling produce through farmers markets, and who run education programs on their farms related to sustainable agriculture and food systems are more likely to be willing to sell produce through FSMs. Respondents who had a bachelor’s degree or higher were 16% more likely to be willing to sell produce through FSMs. Also, respondents running education programs on their farms were about 31% more likely to be willing to sell produce through FSMs. Finally, respondents who indicated having experience selling produce through farmers markets were about 17% more likely to be willing to sell produce through FSMs.
Some of the results presented in this study are consistent with our hypotheses and align with findings from previous studies. Our results related to the negative correlation between age and willingness to sell produce through FSMs suggest that older individuals are less likely to be willing to change their marketing strategies by adding FSMs to the mix because they have a shorter planning horizon (Dong et al., 2019). Also, our results suggest small farms might be more attracted to selling produce through FSMs, which is consistent with previous studies evaluating farmers’ willingness to participate in Alternative Food Networks (AFN) (Corsi et al., 2018). Finally, findings related to farmers offering on-farm, agricultural education programs to communities suggest that the alignment of farmer values and motivation for farming with the goals of FSMs will positively affect their participation, as suggested by previous literature related to farmer participation in market outlets with a food justice mission (Kaiser et al., 2020; Sitaker et al., 2020). Specifically, respondents who are already investing time or money in running education programs on their farms are more likely to be willing to sell produce through FSMs.
The results related to farmers running on-farm educational programs might help communities interested in replicating the FSM model identify farmers likely to sell produce through FSMs in their communities. For example, incorporating on-farm education programs in the FSM model could add value to the model and help attract farmers willing to sell produce through FSMs.
The result associated with the negative correlation between respondent engagement as leaders or volunteers in organizations with a food justice mission is surprising and not consistent with our hypothesis. A potential explanation for this result is that farmers already investing time as leaders or volunteers in their communities might be less likely to sell produce through FSMs due to time constraints that prevent them from adding one more market outlet to their marketing strategies. They might also believe their time as leaders and volunteers already contribute to the food justice mission. Additionally, respondents with experience as leaders or volunteers in organizations with a food justice-related mission could have more insights about the challenges related to running and sustaining organizations or market outlets with a food justice-related mission (Velandia et al., 2021), which might deter them from considering market outlets with a food justice mission.
Results related to the positive correlation between farmer level of education and willingness to participate in FSMs suggest that more educated farmers might better understand the concept of food justice and better assess the impact of the price discounts they would be facing when selling produce through FSMs on their farm businesses. The additional information might positively influence their decision to sell produce through FSMs. These farmers could be used as advocates of FSMs and as information sources for farmers interested in selling produce through FSMs.
Finally, results associated with farmers’ experience selling produce through farmers markets suggest, the potential for reducing marketing costs when transitioning from farmers markets to FSMs might motivate farmers to sell produce through FSMs. Farmers who understand the potential cost savings associated with transitioning from farmers markets to FSMs might also serve as information sources for farmers interested in selling produce through FSMs.
There are several limitations of this study that need to be acknowledged. The sample available for the probit regression used in this study was limited to specific regions in Tennessee and Kentucky. Therefore, we cannot confidently generalize the results and conclusions for this study and apply them to farmers located outside the geographic regions included in the regression sample. As a result, future research should focus on accounting for more farmers located in a much larger geographic area. Furthermore, future research should also determine the specific price discounts farmers are willing to accept for their produce when selling produce through FSMs. The survey design and methods used for this study did not allow us to assess willingness to accept estimates. Future studies could improve the survey design to allow for these estimates. These estimates will provide organizations interested in replicating the FSM model with valuable information regarding the specific price discounts farmers are willing to accept when attracting market suppliers. This information will help prevent these organizations from setting price discounts that could negatively impact farm net profits, and, therefore, farmer participation in FSMs.
The raw data supporting the conclusions of this article will be made available by the authors, without undue reservation.
This study was approved by the University of Tennessee Institutional Review Board (IRB) (UTK IRB-19-05601-XM). The study was conducted in accordance with the local legislation and institutional requirements. A brief informed consent statement was attached to the survey instrument. Participants’ willingness to respond to the survey constituted documentation of their consent.
MV, CT-P, KT, and KR conceived the project, designed the study, and wrote the grant. JY, KD, and XC helped with the survey design, provided the ideas for survey analysis, and contributed to the writing of the final manuscript. SS coordinated survey distribution, data collection, and cleaning. MV and RD did the survey data analysis, conducted the literature review, and wrote the final draft of the manuscript. All authors contributed to the article and approved the submitted version.
This work was supported by the Sustainable Agriculture Research and Education (SARE) program [grant number LS18-300] and the Hatch Multistate project S-1088, TEN00579.
We acknowledge Karen Moskowitz, executive director of New Roots, Inc., for providing valuable information that helped design the survey instrument. We would like to thank all the participating farms, including those that provided information to help design the survey instrument.
The authors declare that the research was conducted in the absence of any commercial or financial relationships that could be construed as a potential conflict of interest.
All claims expressed in this article are solely those of the authors and do not necessarily represent those of their affiliated organizations, or those of the publisher, the editors and the reviewers. Any product that may be evaluated in this article, or claim that may be made by its manufacturer, is not guaranteed or endorsed by the publisher.
Alkon, A. H., and Agyeman, J. (2011). Introduction: the food movement as polyculture. In: Cultivating Food Justice: Race, Class, and Sustainability, Cambridge, MA: MIT Press. 1–20.
Alkon, A. H., and Mares, T. M. (2012). Food sovereignty in US food movements: radical visions and neoliberal constraints. Agric. Hum. Values 29, 347–359. doi: 10.1007/s10460-012-9356-z
Allen, P. (2016). Labor in the food system, from farm to table. J. Agricult. Food Syst. Commun. Dev. 6, 1–4. doi: 10.5304/jafscd.2016.062.022
Belsley, D. A., Kuh, E., and Welsch, R. E. (1980). Regression diagnostics: Identifying influential data and sources of collinearity. New York: John Wiley & Sons.
Bradford, V. A., Quinn, E. L., Walkinshaw, L. P., Rocha, A., Chan, N. L., Saelens, B. E., et al. (2019). Fruit and vegetable access programs and consumption in low-income communities. J. Hunger Environ. Nutr. 14, 780–795. doi: 10.1080/19320248.2018.1498819
Corsi, A., Novelli, S., and Pettenati, G. (2018). “Determinants of farmers’ participation in AFNs”, in Alternative Food Networks: An Interdisciplinary Assessment. 173–196. doi: 10.1007/978-3-319-90409-2_9
Cotter, E. W., Teixeira, C., Bontrager, A., Horton, K., and Soriano, D. (2017). Low-income adults’ perceptions of farmers’ markets and community-supported agriculture programmes. Public Health Nutr. 20, 1452–1460. doi: 10.1017/S1368980017000088
Dong, H., Campbell, B., and Rabinowitz, A. N. (2019). Factors impacting producer marketing through community supported agriculture. PLoS One 14:e0219498. doi: 10.1371/journal.pone.0219498
Edge, B., Velandia, M., Boyer, C., Larson, J., Lambert, D., Roberts, R., et al. (2018). Automatic section control technologies and GPS auto-guidance systems adoption in cotton production. J. Agric. Sci. 10, 282–293. doi: 10.5539/jas.v10n7p282
Hanemann, M., Loomis, J., and Kanninen, B. (1991). Statistical efficiency of double-bounded dichotomous choice contingent valuation. Am. J. Agric. Econ. 73, 1255–1263. doi: 10.2307/1242453
Hanson, K. L., Garner, J., Connor, L. M., Jilcott Pitts, S. B., McGuirt, J., Harris, R., et al. (2019). Fruit and vegetable preferences and practices may hinder participation in community-supported agriculture among low-income rural families. J. Nutr. Educ. Behav. 51, 57–67. doi: 10.1016/j.jneb.2018.08.006
Hodgins, K. J., and Fraser, E. D. G. (2018). “We are a business, not a social service agency.” barriers to widening access for low-income shoppers in alternative food market spaces. Agric. Hum. Values 35, 149–162. doi: 10.1007/s10460-017-9811-y
Kaiser, M. L., Ryan-Simkins, K., Dionne, J., and Pence, E. K. (2020). Connecting small-scale producers and consumers: exploring the feasibility of online food hubs in low-income communities. J. Agricult. Food Syst. Commun. Dev. 9, 1–18. doi: 10.5304/jafscd.2020.093.019
Kasprzak, C. M., Sauer, H. A., Schoonover, J. J., Lapp, M. M., and Leone, L. A. (2021). Barriers and facilitators to fruit and vegetable consumption among lower-income families: matching preferences with stakeholder resources. J. Hunger Environ. Nutr. 16, 490–508. doi: 10.1080/19320248.2020.1802383
McGuirt, J. T., Jilcott Pitts, S. B., Hanson, K. L., DeMarco, M., Seguin, R. A., Kolodinsky, J., et al. (2020). A modified choice experiment to examine willingness to participate in a community supported agriculture (CSA) program among low-income parents. Renew. Agricult. Food Syst. 35, 140–157. doi: 10.1017/s1742170518000364
Montri, D., Chung, K., and Behe, B. (2021). Farmer perspectives on farmers markets in low-income urban areas: a case study in three Michigan cities. Agric. Hum. Values 38, 1–14. doi: 10.1007/s10460-020-10144-3
New roots, Inc. (2023). Available at: https://newroots.org (Accessed June 9, 2022).
Pershing, M., and Hendrickson, M. (2017). The impact on farmers selling into low-income communities: A literature review. Available at: https://www.feedingflorida.org/cms/resources/fab_resources/rafiliteraturereviewimpactoffarmerssellingintolowincomecommunitiesjuly-2017.pdf (Accessed June 10, 2021).
Pilgeram, R. (2011). The only thing that isn’t sustainable is the farmer: social sustainability and the politics of class among Pacific northwest farmers engaged in sustainable farming. Rural. Sociol. 76, 375–393. doi: 10.1111/j.1549-0831.2011.00051.x
Quandt, S. A., Dupuis, J., Fish, C., and D’Agostino, R. B. Jr. (2013). Feasibility of using a community-supported agriculture program to improve fruit and vegetable inventories and consumption in an underresourced urban community. Prev. Chronic Dis. 10:E136. doi: 10.5888/pcd10.130053
Rihn, A. L., Velandia, M., Warner, L. A., Fulcher, A., Schexnayder, S., and LeBude, A. (2023). Factors correlated with the propensity to use automation and mechanization by the US nursery industry. Agribusiness 39, 110–130. doi: 10.1002/agr.21763
Sitaker, M., McCall, M., Belarmino, E. H., Wang, W. W., Kolodinsky, J., Becot, F., et al. (2020). Balancing social values with economic realities: farmer experience with cost-offset community supported agriculture. J. Agricult. Food Syst. Commun. Dev. 9, 1–15. doi: 10.5304/jafscd.2020.094.004
USDA . (2022). 2017 census of agriculture. Census data query tool (CDQT). Washington, DC: U.S. Department of Agriculture, National Agricultural Statistics Service. Available at: https://www.nass.usda.gov/Quick_Stats/CDQT/chapter/1/table/1 (Accessed May 9, 2022).
Velandia, M., DeLong, K. L., Wszelaki, A., Schexnayder, S., Clark, C., and Jensen, K. (2020a). Use of polyethylene and plastic biodegradable mulches among Tennessee fruit and vegetable growers. HortTechnology 30, 212–218. doi: 10.21273/HORTTECH04559-19
Velandia, M., Rejesus, R., Clark, C., DeLong, K. L., Wszelaki, A., Schexnayder, S., et al. (2020b). Evaluating the relationship between fruit and vegetable growers use of plastic biodegradable mulches, and environmental stewardship and labor savings: the case of Tennessee fruit and vegetable farmers. Sustainability 12:2075. doi: 10.3390/su12052075
Velandia, M., Trejo-Pech, C., Moskowitz, K., Tanaka, K., Hyden, H., Rignall, K., et al. (2021). Financial sustainability of nonprofit organizations covering multiple goals of the food justice mission: the case of New Roots, Inc. J. Food Distribut. Res. 52, 63–87.
Walton, J. C., Lambert, D. M., Roberts, R. K., Larson, J. A., English, B., Larkin, S. L., et al. (2008). Adoption and abandonment of precision soil sampling in cotton production. J. Agric. Resour. Econ. 33, 428–448. doi: 10.22004/ag.econ.46556
Keywords: farmers’ willingness to sell, fresh stop markets, price discount, food justice, probit regression
Citation: Denton R, Velandia M, Yenerall J, DeLong K, Trejo-Pech C, Chen X, Tanaka K, Rignall K and Schexnayder S (2023) Evaluating factors influencing Tennessee and Kentucky farmers’ willingness to sell produce through fresh stop markets. Front. Sustain. Food Syst. 7:1212764. doi: 10.3389/fsufs.2023.1212764
Edited by:
José Luis Vicente-Vicente, Leibniz Center for Agricultural Landscape Research (ZALF), GermanyReviewed by:
Phillip Warsaw, Michigan State University, United StatesCopyright © 2023 Denton, Velandia, Yenerall, DeLong, Trejo-Pech, Chen, Tanaka, Rignall and Schexnayder. This is an open-access article distributed under the terms of the Creative Commons Attribution License (CC BY). The use, distribution or reproduction in other forums is permitted, provided the original author(s) and the copyright owner(s) are credited and that the original publication in this journal is cited, in accordance with accepted academic practice. No use, distribution or reproduction is permitted which does not comply with these terms.
*Correspondence: Margarita Velandia, bXZlbGFuZGlAdXRrLmVkdQ==
†These authors have contributed equally to this work and share first authorship
Disclaimer: All claims expressed in this article are solely those of the authors and do not necessarily represent those of their affiliated organizations, or those of the publisher, the editors and the reviewers. Any product that may be evaluated in this article or claim that may be made by its manufacturer is not guaranteed or endorsed by the publisher.
Research integrity at Frontiers
Learn more about the work of our research integrity team to safeguard the quality of each article we publish.