
94% of researchers rate our articles as excellent or good
Learn more about the work of our research integrity team to safeguard the quality of each article we publish.
Find out more
ORIGINAL RESEARCH article
Front. Sustain. Food Syst., 06 September 2023
Sec. Climate-Smart Food Systems
Volume 7 - 2023 | https://doi.org/10.3389/fsufs.2023.1209541
 Matthew R. Beck1*
 Logan R. Thompson2
 Jason E. Rowntree3
 Terra N. Thompson1
 Jacek A. Koziel1Sara E. Place4
 Kim R. Stackhouse-Lawson4
Introduction: It is important to relate different greenhouse gas (GHG) emissions to a carbon dioxide (CO2) equivalence (CO2-e) basis. This is typically done by multiplying the emissions of a GHG by its global warming potential (GWP), usually on a 100-year basis (GWP100). For methane (CH4), the predominant GHG from livestock production, the GWP100 value is 28. The GWP100 method has been shown to not adequately relate CH4 emissions to actual climate warming due to CH4′s short atmospheric lifespan (~12 years). As such, a newer method has been developed, termed GWP*. This method relates current emission rates to previous emission rates, typically on a 20-year time horizon. To date, the implications of using GWP* rather than GWP100 have not been discussed for manure emissions and have not been discussed for enteric and manure emissions relative to different livestock species or geographical regions of the United States.
Methods: Using emission estimate data from the U.S. Environmental Protection Agency (EPA), we assessed how national manure and enteric CH4 emissions changed from 1990 to 2020.
Results: The average rate of change was analyzed by regression. Enteric CH4 emissions remained relatively constant with a non-significant slope (P = 0.51), whereas manure CH4 emissions have been increasing (P < 0.01; R2 = 0.96) by 0.03-MMT/year. Furthermore, investigation demonstrated that the increase in manure CH4 emissions was largely driven by the dairy (25.9-kt increase in manure CH4 per year; P < 0.01; R2 = 0.98) and swine (5.4-kt increase in manure CH4 per year; P < 0.01; R2 = 0.50) industries. Due to the increasing emission estimates, manure CH4 [90.8-MMT CO2-warming equivalence (CO2-we) on average] was a larger contributor to climate warming than enteric CH4 (89.2-MMT CO2-we on average) from 2010 through 2020, when calculated with the GWP* methodology. This stands in contrast to the GWP100 methodology, which suggests that enteric CH4 emissions (191-MMT CO2-e) from 2010 to 2020 were on average 206% greater contributors to warming than manure CH4 emissions (62.3-MMT CO2-e).
Discussion: These results suggest that manure CH4 emissions may be contributing more to climate warming than enteric CH4, and more effort may be required to mitigate this source of emissions.
In 2020, enteric and manure methane (CH4) accounted for 26.9 and 9.2% of the total U.S. CH4 emissions, respectively, with enteric CH4 being the largest source of CH4 in the United States (EPA, 2022a). During 2020, the beef industry accounted for 71.6% and the dairy industry accounted for 24.9% of the total enteric CH4 emissions in the United States. However, in 2020, the largest contributors to manure CH4 emissions were swine (37.6%) and dairy (31.7%), while beef (3.0%) and poultry (6.0%) represented a smaller contribution (EPA, 2022a).
It is often necessary to relate different greenhouse gases (GHG) to an equivalent basis to compare the contribution of different industries' impact on the climate as GHG emission profiles can vary widely. This has conventionally been done by multiplying the emissions of a GHG by its respective global warming potential (GWP), typically on a 100-year time horizon [GWP100; 28 for methane (CH4) and 265 for nitrous oxide (N2O)], to relate these emissions to a carbon dioxide (CO2) equivalence basis (CO2-e; IPCC, 2013). Although this metric is the standard and widely accepted accounting method, climate scientists have consistently debated whether it accurately captures the behavior of different gases in the atmosphere (O'Neill, 2000; Fuglestvedt et al., 2003; Shine et al., 2005, 2007). While this methodology appears to work well for GHG with a long atmospheric lifespan, such as N2O which has a lifespan of ~114 years, it has been demonstrated to not be adequate for short-lived climate forcer (SLCF; Lynch et al., 2021), such as CH4 with an atmospheric lifespan of only 12 years (EPA, 2022a). Due to its short-lived behavior in the atmosphere, the relative rate of change of emissions is critical when evaluating the impact of current and future emissions on climate warming. For example, if the rate of emissions today is lower than 20 years ago, we would observe a beneficial impact (i.e., “cooling”), and the opposite would be true with a higher current emission rate than 20 years ago. In fact, a recent group of leading climate scientists recommended that, considering the ambitious global climate targets outlined by the Paris Climate Accord, we may be best served by reporting all GHG emissions individually rather than utilizing the ambiguous GWP100 metric (Allen et al., 2022).
A relatively new methodology has been developed to account for the nuanced behavior of SLCF, which is termed GWP* (Allen et al., 2018; Lynch et al., 2020; Smith et al., 2021). This method relates current emissions of a SLCF (e.g., CH4) to their previous emission rates, typically from 20 years ago, to calculate a CO2 warming equivalence (CO2-we; Smith et al., 2021). The GWP* has been demonstrated to relate closely to actual temperature responses to CH4 radiative forcing that were derived using the “Finite amplitude Impulse Response” (FaIR) simple climate model, unlike the GWP100 method (Cain et al., 2019).
Considering the short-lived nature of CH4 in the atmosphere, reducing CH4 emissions is the most promising means to limit climate warming in the short term (Ocko et al., 2021). Ocko et al. (2021) demonstrated that pursuing all CH4 (from all sources) mitigation options rapidly could reduce the global mean temperature by 0.25°C by 2050 and by 0.5°C by the end of the century. In terms of livestock CH4, the use of all available mitigation options may reduce mean global temperature by 0.09°C by the end of the century (Ocko et al., 2021).
The GWP* method has a large impact on CH4 emissions' implied contribution to climate warming relative to the GWP100 method (Beck et al., 2022). For example, a previous study from our team demonstrated that when using the GWP100 method for enteric CH4 emissions, there was an estimated 200 MMT CO2-e emissions in 2019, whereas there were only 83 MMT CO2-we estimated when using the GWP* method—a 58.4% reduction in implied climate warming (Beck et al., 2022). Furthermore, if emission rates of CH4 are reduced below a 0.32% annual reduction rate, then there can be a net cooling effect on the environment (Lynch et al., 2020; Beck et al., 2022). As enteric and manure CH4 emissions are a major source of GHG from the livestock industry, the debate over which metric to use (either GWP100 or GWP*) for relating CH4 emissions to a CO2 basis is of utmost importance. This is especially true because it is these equivalences that are considered when decision-makers enact policies for mitigating climate warming. To the best of our knowledge, the implications of implementing the GWP* methodology have not been discussed for enteric or manure CH4 from major livestock species or geographical regions of the United States. The objective of this study was to determine how implementing the GWP* methodology influences manure and enteric CH4 emissions' implied contribution to climate warming using emission estimates obtained from the U.S. EPA.
All data used for this study were obtained from the U.S. EPA's publicly available websites. The (EPA, 2022b) annex reports methodologies used to estimate emissions from livestock that are reported in the EPA (2022a) report. In brief, the EPA (2022a) utilizes their Cattle Enteric Fermentation Model (CEFM), which uses an IPCC tier 2 approach for estimating enteric CH4 from cattle, but a tier 1 methodology was employed for enteric CH4 emissions from other livestock species. The CEFM model also uses established methods to estimate actual cattle inventory per year from the USDA-NASS reported values as affected by livestock that do not remain in the herd for an entire year as they are culled or harvested. These animal inventory values are then multiplied by an emission factor dependent on diet type and production system. The Ym, which is the methane conversion rate (fractional gross energy intake lost as methane) used for forage animals, can be found in Table A-146, and the Ym for dairy and feedlot cattle can be found in Table A-147 of the annex report (EPA, 2022b). For manure CH4 emissions, the EPA (2022a) utilizes a tier 2 approach using specific emission factors based on manure management strategies [primarily based on survey data, but the methodology described in the annex (EPA, 2022b) is species-dependent], production systems, and animal inventory numbers from the USDA-NASS report. Manure management for feedlots is assumed to be 100% dry-lot and forage systems to be 100% “pasture/range/paddock”. For dairy, swine, and poultry, the data used prior to 2016 were obtained from the Census of Agriculture, which occurred during 1992, 1997, 2002, 2007, 2012, and 2017, and data from these years were interpolated and applied to years that a survey was not conducted. From 2016 to 2020, the manure management data were obtained by the EPA from the USDA-ERS Agricultural Resource Management Survey data. The specific calculations to determine manure CH4 emissions are outlined in EPA (2022b), but they stem from volatile solid (VS) production estimates, which are a function of gross energy intake, digestible energy intake, and ash, which is assumed to be 8% of dry matter intake. The remaining calculations are also outlined in the EPA (2022b) annex report, but they consider a CH4 conversion factor (which is system and manure management dependent) and the maximum CH4-producing capacity of the VS (based on temperature). One important limitation of these calculations is that they appear to not account for certain dietary characteristics that could influence both enteric (e.g., ether extract; Beck et al., 2018, 2019) or manure (e.g., by-product inclusion; Schingoethe et al., 2009). Despite this limitation, the dataset obtained from the EPA (2022a) report represents the only dataset of its kind, with emission estimates from 1990 to 2020, and forms the basis of the report that provides the information that U.S. policymakers and society at large use to draw conclusions regarding agriculture's contribution to U.S. GHG emissions.
National data, including total enteric and manure CH4 emissions, were obtained from the main report tables (Table 5-2; EPA, 2022b). Animal inventory (Table A-161), enteric (Table A-155), and manure (Table A-172) CH4 emissions by livestock species were obtained from the U.S. EPA Annex Tables (EPA, 2022a). The enteric and manure CH4 emissions from each state were downloaded from the EPA's State GHG Emissions and Removals website (EPA, 2022c). All of these data sheets that were accessed provide estimates from 1990 to 2020, and these data were used to generate the latest EPA Inventory of the U.S. GHG Emissions and Sinks report (EPA, 2022a). The enteric and manure CH4 emission estimates by state were grouped into seven geographical regions, based on the groupings used by Rotz et al. (2019). Table 1 lists which states were assigned to each of the seven regions.
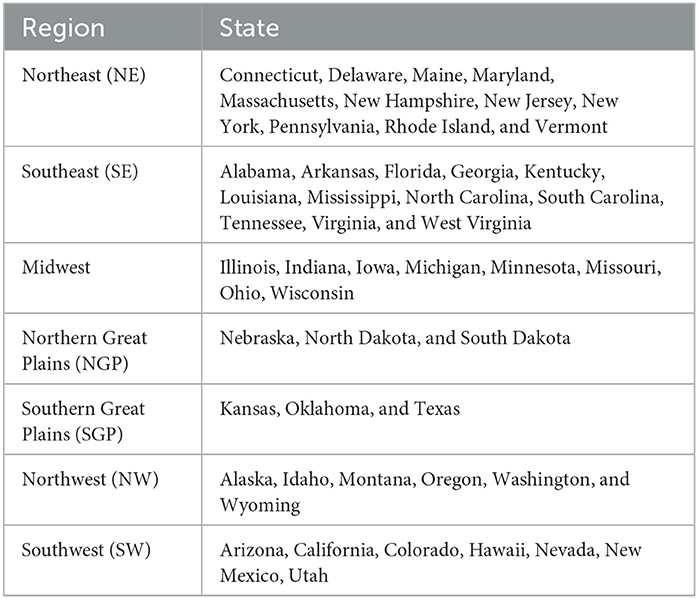
Table 1. List of how the U.S. states were assigned to one of seven geographical regions.
The EPA reports use a GWP100 value of 25 for CH4. However, the IPCC (2021) and the authors who developed the GWP* methodology suggest a GWP100 value of 28 (Allen et al., 2018; Cain et al., 2019; Smith et al., 2021). We employed the GWP100 values instead of the GWP20 values because it is the most common value used by reporting bodies (e.g., IPCC and EPA) and also because it is the one used when developing the GWP* method. As such, we converted all EPA data to CO2-e based on the 28 GWP100 value for CH4. The GWP100 factor to calculate CO2-e for CH4 is 28 (IPCC, 2021). Accordingly, the GWP100 values reported in this article were calculated as follows:
The GWP* methodology has had several recent improvements (Allen et al., 2018; Cain et al., 2019; Lynch et al., 2020; Smith et al., 2021). We used the latest improved equation to calculate GWP* (Smith et al., 2021), which was demonstrated to provide CO2-we estimates that better aligned with a climate model that predicts actual warming under more ambitious scenarios [Representative Concentration Pathway (RCP) 2.6] relative to the equation reported by Lynch et al. (2020). The GWP* equation used is as follows:
where CH4(t) is the CH4 emitted (MMT) at year t and CH4(t − 20) is the amount of CH4 emitted (MMT) from 20 years prior to year t. To put it simplistically, the two coefficients represent a weight applied to year t and year t minus 20 CH4 emissions, and the difference between the two coefficients (i.e., 4.53–4.25) attempts to account for warming caused by the CH4-derived CO2. These calculations were made for the total national enteric and manure CH4 emissions, the national enteric and manure CH4 emissions separated by livestock species, and the enteric and manure CH4 grouped by geographical region (Table 1).
All statistical analyses were conducted in R (v.4.1.0), and figures were generated using the “ggplot” package of R (Wickham, 2016; R Core Team, 2021). Simple linear regression was used to determine average rates of change per year across years (1990–2020). This analysis was conducted for national enteric and manure CH4 emissions; national livestock inventory for beef, dairy, swine, and poultry; enteric and manure CH4 emissions by livestock species; and enteric and manure CH4 emissions for each of the geographical regions. The regression slope, slope standard error of the mean, slope P-value, and R2 for each of these linear regression analyses are reported in their respective figures.
Figure 1 displays the total national enteric and manure CH4 emissions and the regression lines associated with these emission sources. From 1990 to 2020, there was no change in enteric CH4 emissions on average (P = 0.51; R2 = 0.01). However, manure CH4 emissions have been increasing at an average rate of 0.03 (0.0013) MMT CH4 per year (P < 0.01; R2 = 0.96).
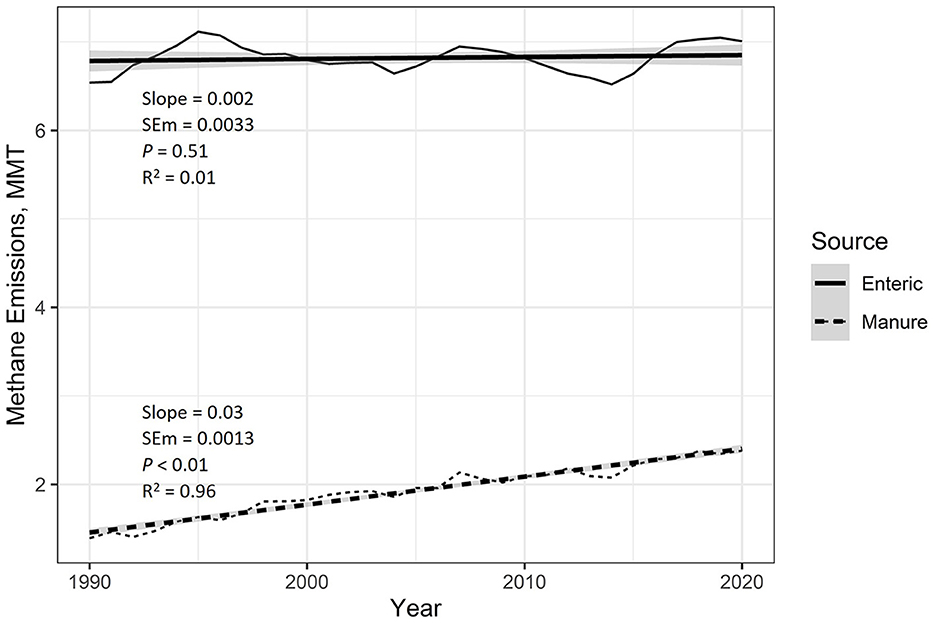
Figure 1. EPA estimated national emissions of enteric and manure methane (CH4). Regression analysis was used to estimate average yearly changes over this period. Provided in the figure are the regression slope, slope standard error of the mean (SEM), slope P-value, and the regression coefficient of determination (R2). The shaded area around the regression lines represents the 95% confidence interval. From 1990 to 2020, estimated enteric CH4 has not increased on average, so the slope of the regression was not significant (P = 0.51). However, national manure CH4 emissions have been increasing (P < 0.01) at an average rate of 0.03 MMT per year.
Over the last 30 years, there has been an average reduction in the beef herd by 300,000 head per year (P < 0.01; R2 = 0.46), while there has been no average change in the dairy herd population (P = 0.83; R2 = 0.002; Figure 2). From 1990 to 2020, there has been growth in the population of both swine (600,000 head increase per year; P < 0.01; R2 = 0.84) and poultry (19.5 million head increase per year; P < 0.01; R2 = 0.79).
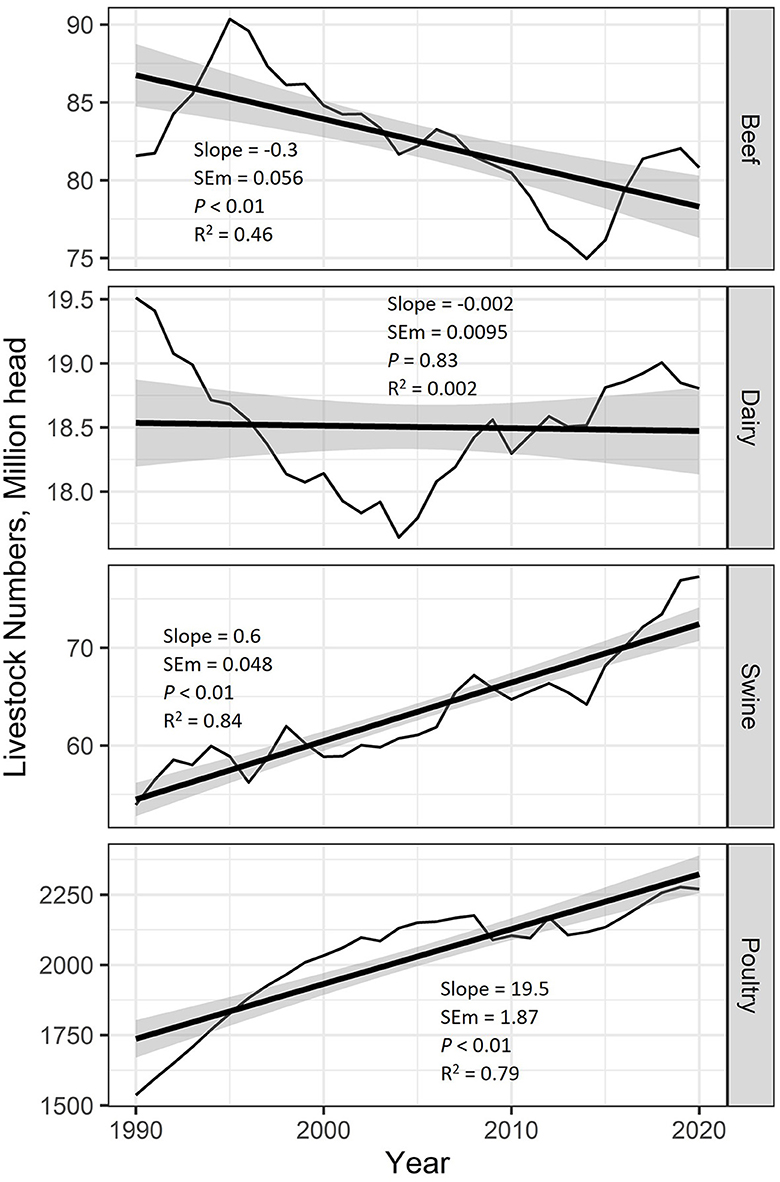
Figure 2. National livestock inventory of beef, dairy, swine, and poultry obtained from the U.S. EPA estimates from 1990 to 2020. Regression analysis was used to estimate average yearly changes over this period. Provided in the figure are the regression slope, slope standard error of the mean (SEM), slope P-value, and the regression coefficient of determination (R2). The shaded area around the regression lines represents the 95% confidence interval. Beef cattle populations have decreased by an average of 300,000 head per year, whereas the U.S. dairy cattle herd was unchanged on average. Both swine and poultry inventory have increased by an average of 600,000 head and 19.5 million head, respectively.
According to the EPA estimates, enteric CH4 emissions from beef cattle have decreased (on a national scale) by 7.1 kt of CH4 per year (P = 0.05; R2 = 0.12), whereas enteric CH4 emissions from dairy cattle have increased by 9.3 kt of CH4 per year (P < 0.01; R2 = 0.72; Figure 3). Manure emissions have significantly increased for all livestock species. Chiefly, manure CH4 from dairy has increased at an average rate of 25.9 kt CH4 per year (P < 0.01; R2 = 0.98) and swine by 5.4 kt CH4 per year (P < 0.01; R2 = 0.50). Beef (0.1 kt CH4 per year; P < 0.01; R2 = 0.26) and poultry (0.29 kt CH4 per year; P < 0.01; R2 = 0.36) manure CH4 emissions have also increased but at a slower rate than dairy and swine.
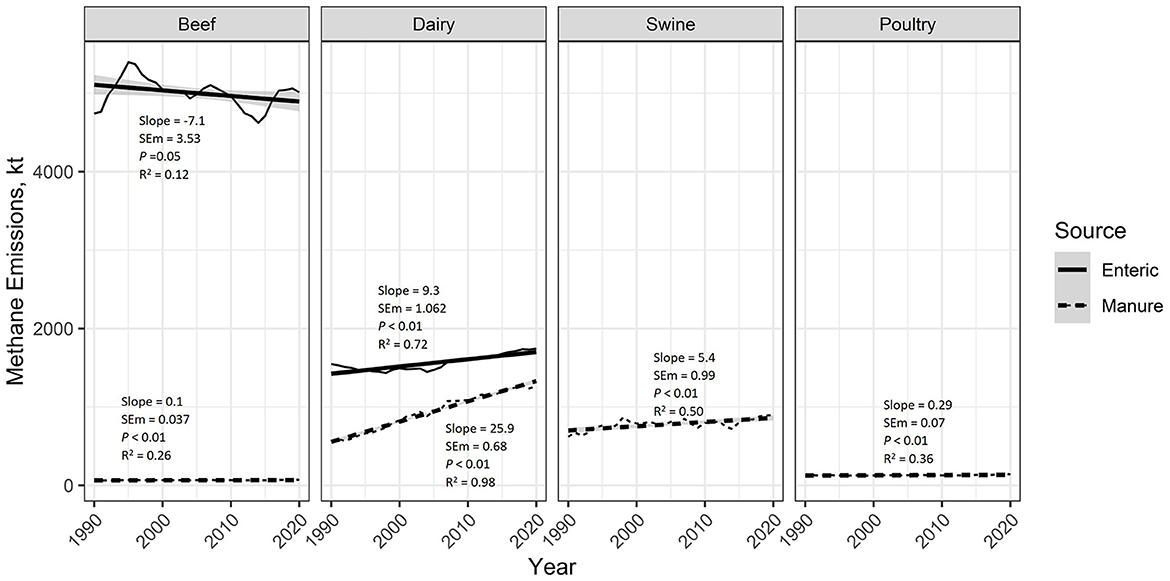
Figure 3. EPA estimated national emissions of enteric and manure methane (CH4) by livestock type from 1990 to 2020. Regression analysis was used to estimate average yearly changes over this period. Provided in the figure are the regression slope, slope standard error of the mean (SEM), slope P-value, and the regression coefficient of determination (R2). The shaded area around the regression lines represents the 95% confidence interval. Enteric CH4 emissions from beef cattle have been decreasing at an average rate of −7.1 kt CH4 per year, while enteric CH4 emissions from dairy have been increasing by 9.3 kt CH4 per year. Manure CH4 emissions have been increasing for all livestock types, but especially for dairy (25.9 kt manure CH4 per year) and swine (5.4 kt manure CH4 per year).
Enteric CH4 emissions from all sources have decreased in the Northeast and Southeast regions (0.07 and 0.7 kt enteric CH4 per year, respectively; P < 0.01); the Midwest (P = 0.18) and the Southern Great Plains (P = 0.38) have remained unchanged; and they have increased in the Northern Great Plains (1.2 kt additional enteric CH4 per year; P < 0.01), Southwest (0.92 kt additional enteric CH4 per year; P < 0.01), and the Northwest (0.7 kt additional enteric CH4 per year; P < 0.01) regions (Figure 4). The Southeastern U.S. region has seen no change (P = 0.27) in manure CH4 emissions on average. However, all other regions have seen a significant (P < 0.01) increase in manure CH4 emissions (Figure 4). These annual rates of increase range from 0.38 kt of manure CH4 per year in the Northeast to 1.4 kt of manure CH4 per year in the Midwest.
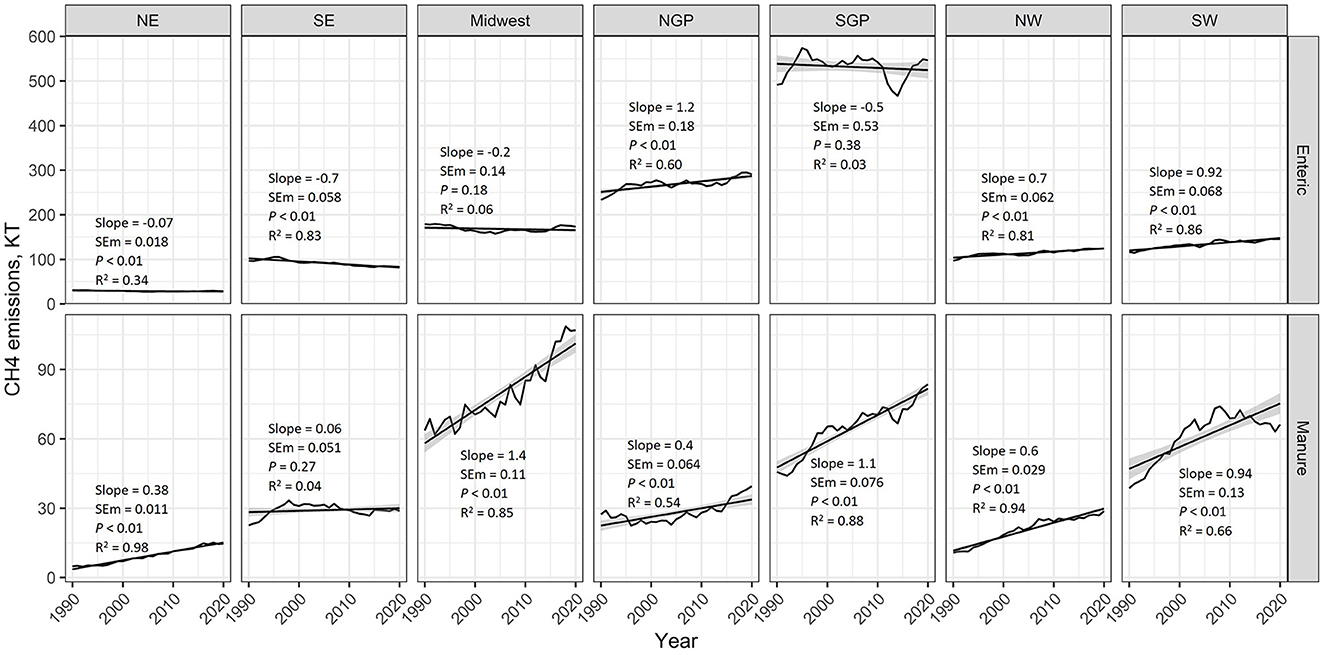
Figure 4. EPA estimated enteric and manure methane (CH4) emissions from 1990 to 2020 for various regions of the United States (NE, Northeast; SE, Southeast; NGP, Northern Great Plains; SGP, Southern Great Plains; NW, Northwest; SW, Southwest). Regression analysis was used to estimate average yearly changes over this period. Provided for each quadrant in the figure are the regression slope, slope standard error of the mean (SEM), slope P-value, and the regression coefficient of determination (R2). The shaded area around the regression lines represents the 95% confidence interval.
In all but one instance, the GWP* methodology provided smaller estimates than the GWP100 methodology for enteric CH4 only (Tables 2, 3; Figure 5). For the total national enteric CH4 data, using GWP* provided estimates of 49.2 MMT CO2-we on average from 2010 to 2020, whereas the GWP100 method averaged 190.6 MMT CO2-e, a 3.9 times greater value. Furthermore, the GWP* method demonstrated that decreasing enteric CH4 emissions had a cooling effect during 2014 and 2015 (Table 2). Cumulatively, the GWP100 methodology would imply that from 2010 to 2020, enteric CH4 emissions have contributed 2,096.3 MMT of CO2-e, while this contribution is only 541.2 MMT of CO2-we when using the GWP* methodology, a 74.2% lower value.
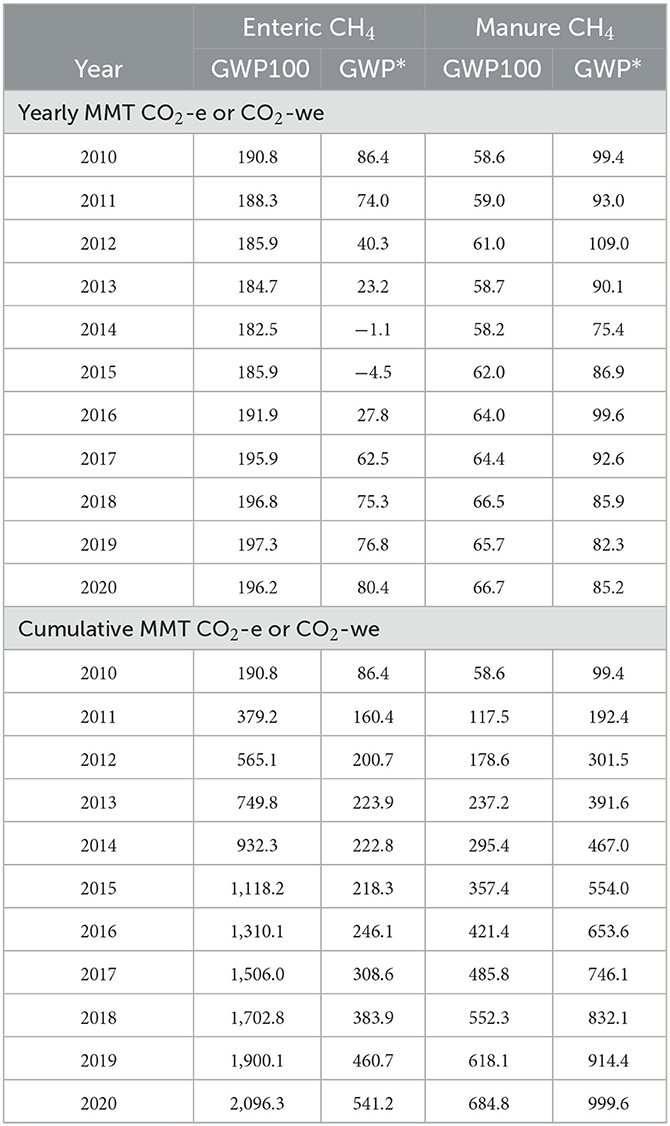
Table 2. EPA estimated national enteric and manure methane (CH4) emissions expressed as CO2 equivalence (CO2-e) or CO2-warming equivalence (CO2-we) using the global warming potential (GWP100) or the global warming potential* (GWP*) methodologies, respectively.
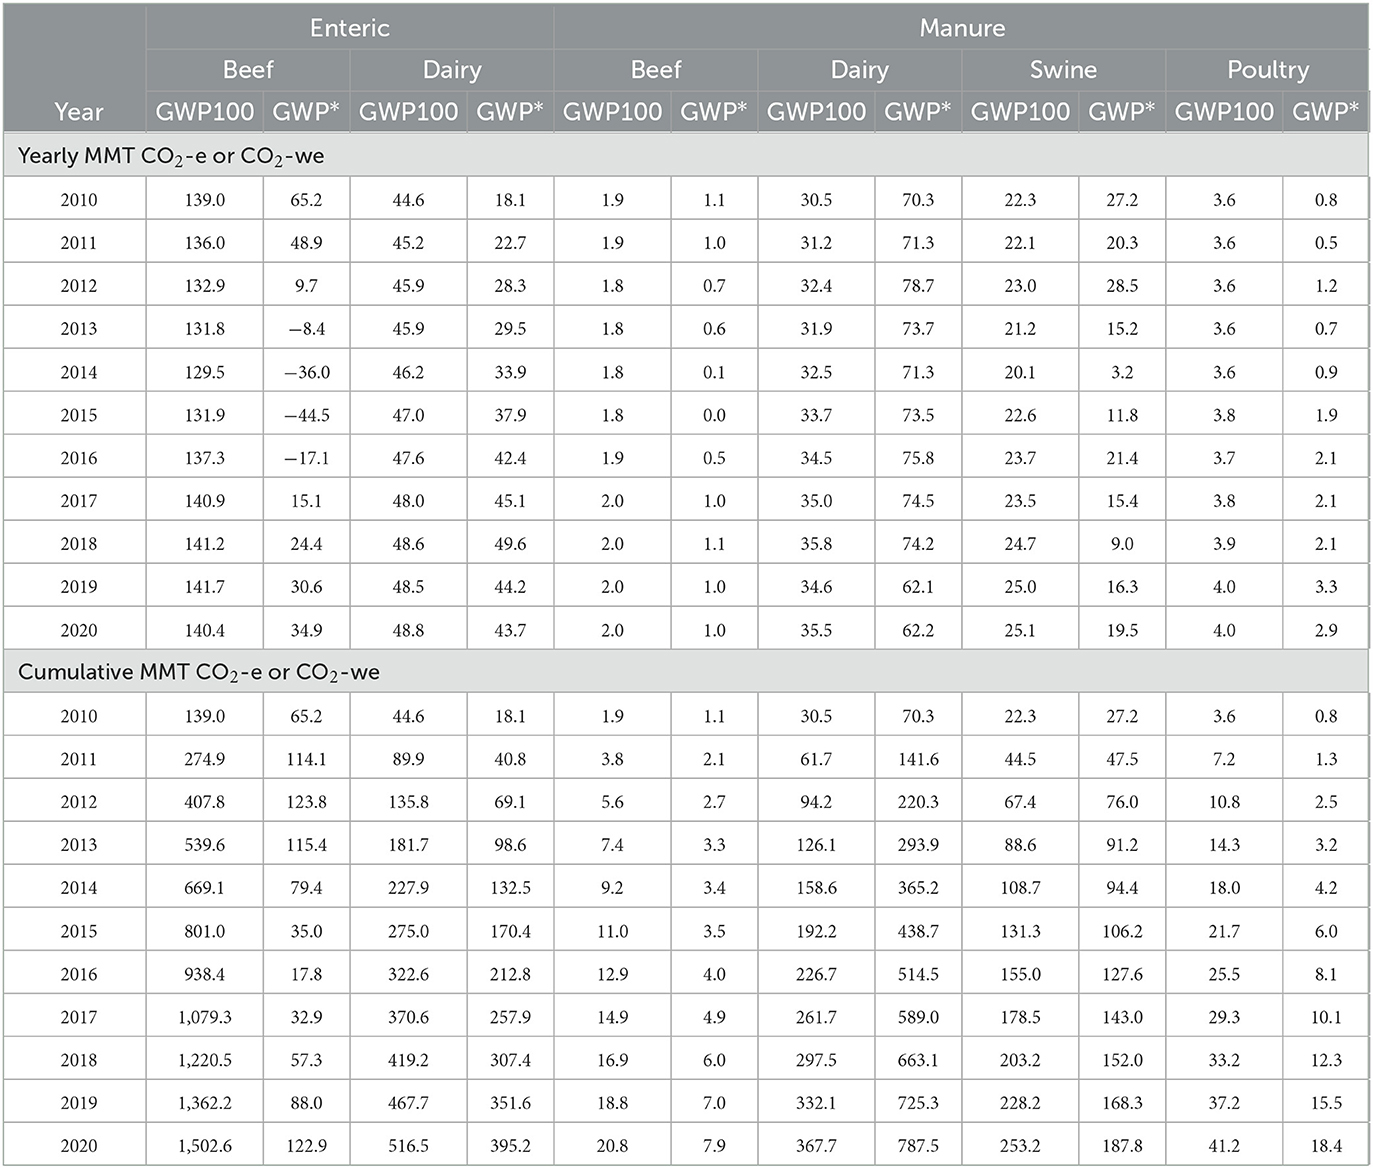
Table 3. EPA estimated national enteric and manure methane (CH4) emissions expressed as CO2 equivalence (CO2-e) or CO2-warming equivalence (CO2-we) using the global warming potential (GWP100) or the global warming potential* (GWP*) methodologies for different livestock types, respectively.
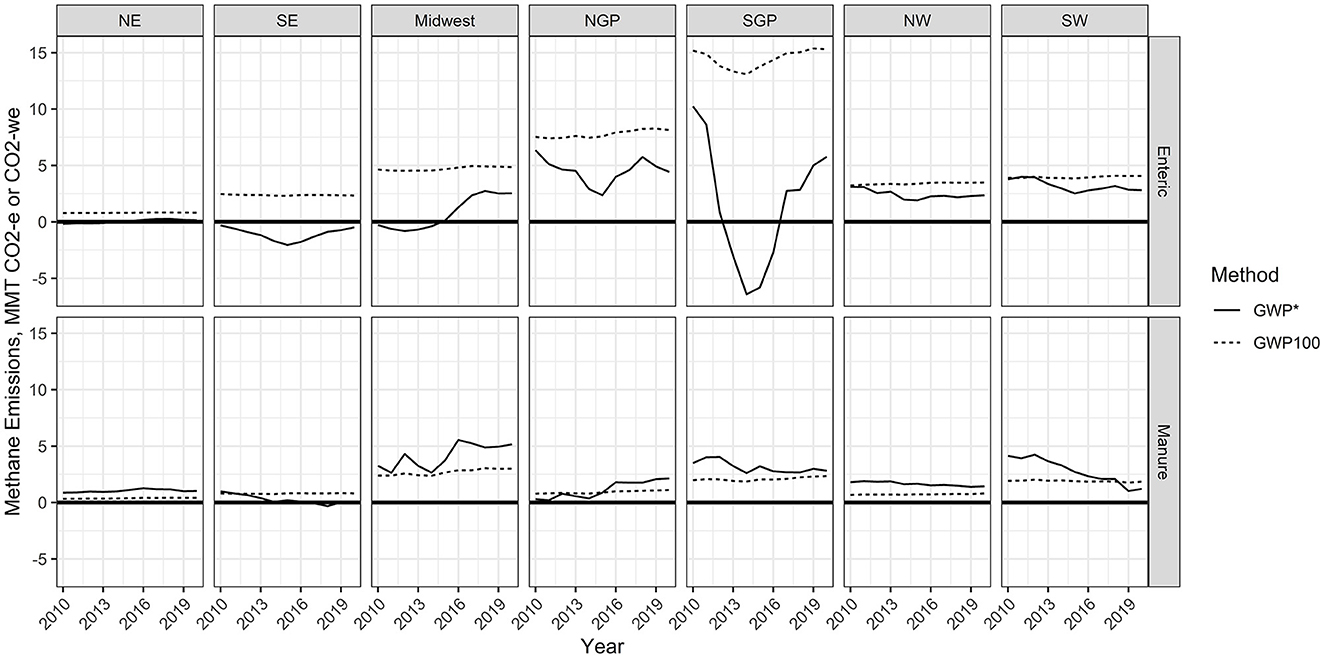
Figure 5. Annual CO2 equivalence (CO2-e) or warming equivalence (CO2-we) as calculated following the global warming potential (GWP100) or global warming potential* (GWP*) methodology, respectively. Calculations were made using EPA manure and enteric methane emissions estimates from 2010 to 2020 for different regions of the United States (NE, Northeast; SE, Southeast; NGP, Northern Great Plains; SGP, Southern Great Plains; NW, Northwest; SW, Southwest).
The apparent large reductions in warming-equivalent values resulting from the use of GWP* relative to the GWP100 method for enteric CH4 are driven by the beef industry impact, where GWP100 provided estimates that were on average 12.2-fold greater than the GWP* method (Table 2). In fact, the GWP* methodology demonstrated negative CO2-we values for 4 years, from 2013 to 2016. The dairy industry had the only instance where GWP* had a larger value than GWP100 (year 2018; Table 3).
Regionally, GWP* provided estimates that were much lower than GWP100 values of CO2 equivalence from enteric CH4 emissions (Figure 5). The Northeast, Southeast, Midwest, and Southern Great Plains had several years with negative CO2-we values. Negative cumulative (cooling effects) emissions occurred from 2010 to 2017 for the Northeast, from 2010 to 2020 for the Southeast, and from 2010 to 2016 for the Midwest (Figure 6). Additionally, the Southern Great Plains saw a reduction in cumulative CO2-we emissions from the peak in 2012 through the lowest cumulative emissions in 2017.
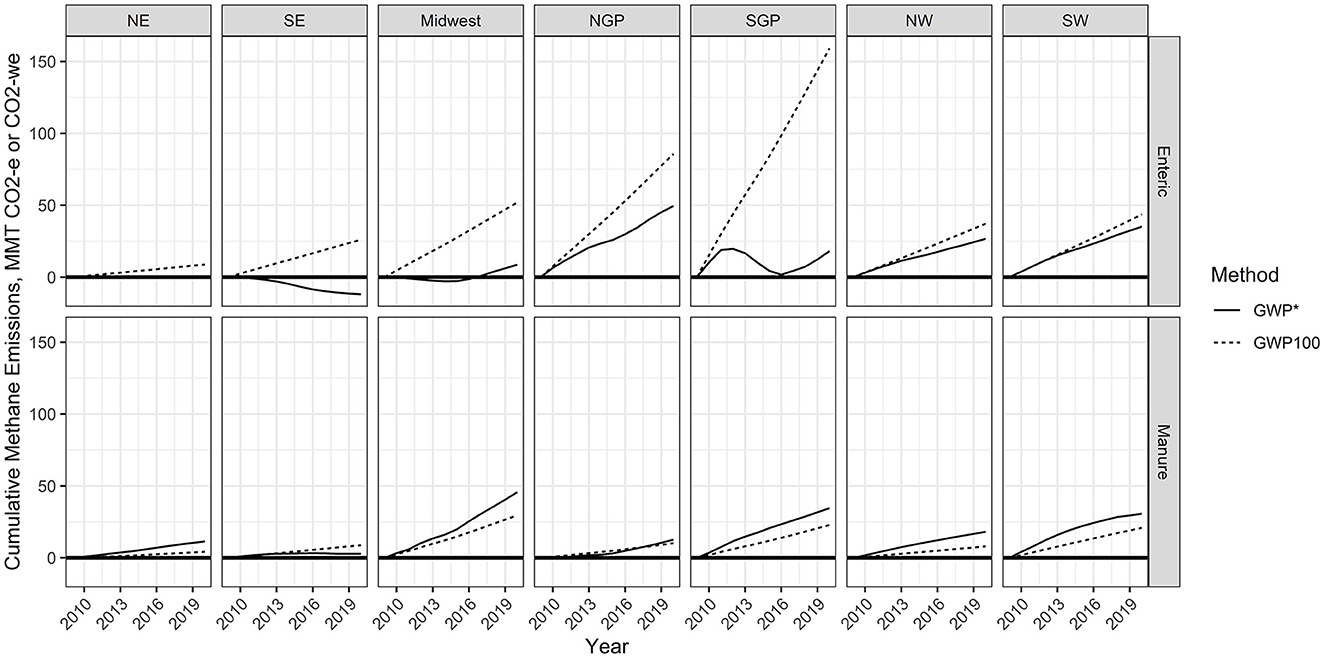
Figure 6. Cumulative CO2 equivalence (CO2-e) or warming equivalence (CO2-we) as calculated following the global warming potential (GWP100) or global warming potential* (GWP*) methodologies, respectively. Calculations were made using EPA manure and enteric methane emission estimates from 2010 to 2020 for different regions of the U.S. (NE, Northeast; SE, Southeast; NGP, Northern Great Plains; SGP, Southern Great Plains; NW, Northwest; SW, Southwest).
Using the GWP* methodology increased the national manure CH4 emissions on a CO2 equivalence basis relative to the GWP100 method across all years (Table 2). This was on average a 1.45 times increase in CO2-e for the GWP* method compared with the GWP100. This resulted in a cumulative value from 2010 to 2020 being 314.8 MMT more when using the GWP* method compared with the GWP100 method. This apparent difference was driven by the dairy industry impact, which had a 2.14 times greater estimate of CO2-we when calculated using the GWP* method compared with the GWP100 method. Using GWP* to calculate cumulative CO2-we emissions from 2010 to 2020 provided much smaller estimates relative to GWP100 for all livestock types, except for dairy. Using the GWP* methodology resulted in greater cumulative CO2-we emissions for all regions except for the Southeast (Figure 6).
Breaking the regions up by states for their contribution to cumulative CO2-e and CO2-we from 2010 to 2020 demonstrates which U.S. states are the drivers behind each region (Figure 7). In the Northeast, New York and Pennsylvania are the largest sources of enteric and manure CH4 emissions. However, despite New York and Pennsylvania having similar cumulative emissions when calculated by GWP100, New York is the largest source of enteric CH4 emissions when calculated by GWP*. In the Midwest, Illinois, Indiana, and Missouri all provided a net “cooling” effect for enteric CH4 in MMT CO2-we, while Iowa, Michigan, and Wisconsin were the largest contributors to net warming. Finally, for enteric CH4, despite Texas being the largest contributor of CO2-e calculated with GWP100, it was the only state in the Southern Great Plains that provided a net “cooling” effect for CO2-we calculated with GWP*. In terms of manure CH4, again, New York and Pennsylvania were the largest sources in the Northeast. In the Southeast, Alabama, Arkansas, and Florida all provided a net “cooling” effect of CO2-we, and these were the only states in the United States that had negative cumulative CO2-we manure CH4 emissions, while North Carolina was the largest contributor (Figure 7).
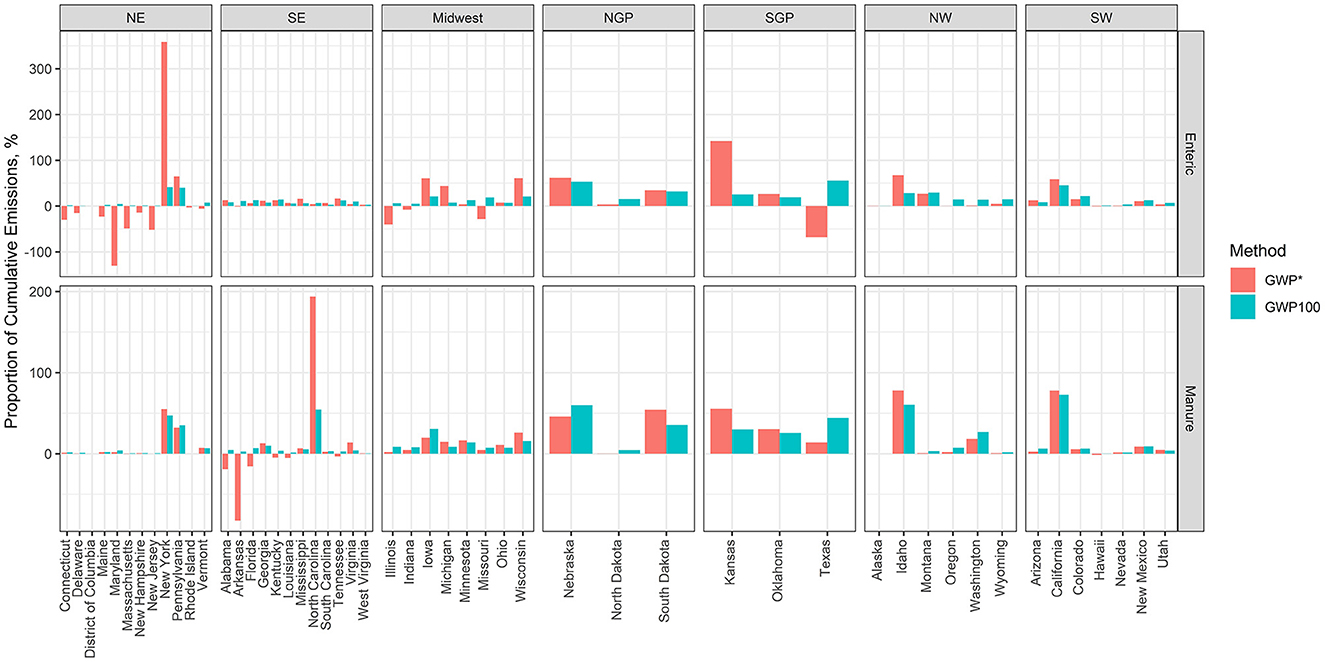
Figure 7. Proportion of regional cumulative CO2 equivalence (CO2-e) or CO2-warming equivalence (CO2-we) as calculated following the global warming potential (GWP100) or global warming potential* (GWP*) methodologies, respectively. The CO2-e and CO2-we were calculated using EPA estimates of enteric and manure CH4 emissions from 1990 to 2020. The cumulative CO2-e and CO2-we values were calculated by adding CO2-e and CO2-we emissions from 2010 to 2020.
For both beef and dairy populations, enteric methane emissions were largely driven by changes in population size. Even though population alone did not explain all of the variation in enteric CH4 estimates from the EPA, as reported by Beck et al. (2022), it is still the driving factor for national-level emission estimates. For example, enteric CH4 emissions from national beef cattle have decreased by 7.1 kt per year from 1990 to 2020, whereas enteric CH4 emissions from dairy cows have been increasing by 9.3 kt per year over the same period. This is associated with a national beef herd that has decreased by 300,000 head per year and a dairy herd that has remained relatively constant from 1990 to 2020. Across all livestock types, national enteric CH4 has remained relatively consistent from 1990 to 2020, with the slope of the regression line for enteric CH4 on year being not significantly different from 0. Due to these annual changes, enteric CH4 emissions from all sources represented a net cooling effect for 2 years from 2014 to 2015 for all species but for 4 years from 2013 to 2016 for beef but not for dairy cattle.
While changes in estimated CH4 emission rates resulted in net cooling effects for several years when using GWP* to estimate climate impacts, this was only related to changes in cattle numbers. Reductions in cattle numbers occurred from 1990 to 2005 for dairy cattle and from 1995 to 2014 for beef cattle. The reduction in dairy numbers (2,000 head per year) during this timeframe is associated with a period of liquidation of many small dairy farms (< 1,000 head) and an increase in larger dairy farms (>1,000 head) (MacDonald et al., 2007; Njuki, 2022). The reductions in beef cattle numbers from 1995 to 2014 were due to difficult market conditions (record high grain prices, widening of farm-to-retail beef price spread, low cattle prices, etc.) and drought during 1995 and 1996 (Mathews et al., 1999), cases of bovine spongiform encephalopathy in the early 2000s (Miljkovic, 2009), and then a drought during 2011 (Rippey, 2015). In fact, the drought of 2011, which affected large areas of the Southern Great Plains, explains the lower enteric methane emissions and negative CO2-we values, calculated using GWP* (Figure 5). While reducing enteric CH4 emissions is an important goal, we should not strive to achieve it through cattle inventory reductions alone. Reducing cattle populations would have a multitude of negative impacts. This includes negative economic impacts on rural economies that rely on ruminant agriculture, worsened food security via increasing food prices for high-quality food, and directly harming the emotional, cultural, and economic realities of those who rear these animals.
The current analysis has highlighted that, according to EPA estimates, the only times when the beef and dairy industries have considerably reduced enteric CH4 emissions have occurred because of reduced cattle inventory, largely driven by economic and climatic conditions. Therefore, the beef and dairy industries need solutions for reducing enteric CH4 emissions rather than relying on changes in population size to achieve the climate goals of food companies and producer organizations alike. In recent years, the development of these solutions has resulted in several options for producers, although each option currently faces significant social and economic roadblocks to adoption.
Two promising means of reducing enteric CH4 emissions are 3-nitrooxpropanol (3-NOP) and Asparagopsis seaweed, both of which are methanogenesis inhibitors. In a meta-analysis, 3-NOP was determined to reduce enteric CH4 production by 22% for beef cattle and 39% for dairy cattle (Dijkstra et al., 2018). Feeding Asparagopsis seaweed has elicited the largest enteric CH4 reductions in cattle. In dairy cattle, CH4 reductions have been reported ranging from 26.4 to 67.25% when included in the diet at ~0.5–2% on a dry matter basis (Roque et al., 2019; Stefenoni et al., 2021). In beef cattle fed Asparagopsis seaweed in total mixed rations at 0.2% DM to 1% DM, CH4 emissions were reduced by 36–98% (Kinley et al., 2020; Roque et al., 2021). The extent to which Asparagopsis will reduce CH4 is dependent on the bromoform content of the seaweed, with bromoform being the compound that is responsible for the majority of methanogenesis inhibition (Machado et al., 2016; Vucko et al., 2017).
Several challenges must be overcome before 3-NOP and Asparagopsis can be provided to cattle. Neither of these mitigation strategies have been approved by the FDA to be fed in the United States and this approval is required before producers can utilize these mitigation technologies. Another issue is that, to date, the applicability of implementing these mitigation options in grazing scenarios is largely unknown, especially in extensive grazing systems such as those that occur in the Western U.S. Approximately 77% of CH4 emissions from the U.S. beef industry come from the cow-calf sector, which is a pastoral system (Rotz et al., 2019). Previous research has involved feeding 3-NOP and Asparagopsis seaweed to cattle through total mixed rations with a near continuous infusion of the methanogenesis inhibitory products into their rumen as the cattle consume the feed. These products would need to be supplemented to cattle in extensive grazing systems where continuous dosing is not possible, requiring that the inhibitory products be introduced to the rumen as a pulse-dose. Accordingly, the CH4 inhibitory effects of 3-NOP and Asparagopsis seaweed may not be as great as what has been demonstrated in confined feeding operations. It is important to assess these inhibitors in grazing systems, as mitigation of CH4 from these systems would have the largest impact on U.S. enteric CH4 emissions. Scalability is the final challenge that exists for feeding Asparagopsis seaweed. In order to provide enough seaweed to feed the U.S. cattle herd, 1% of dry matter and approximately 3-MMT of seaweed would need to be produced and transported on-farm (Vijn et al., 2020). According to USDA-NASS cattle inventory estimates from January 2022, December 2022, and January 2023, the Southern Great Plains (Kansas, Oklahoma, and Texas) had, on average, 47% of cattle on feed (USDA-NASS, 2023a) and 26% of beef cows in the United States (USDA-NASS, 2023b). This adds another layer of logistical issues, where seaweed would need to be transported from the coasts into areas with higher concentrations of cattle. Additionally, continued research is needed to ensure there are no food safety concerns due to bromoform residues in meat and milk.
While these technological interventions have high potential in confined operations, in extensive operations where they may have lowered efficacy and adoption potential, a coupled approach with nature-based solutions may be most impactful. In these systems, a greater focus on management that improves soil carbon sequestration has been demonstrated in some operations to have the potential to offset all or part of the footprint of beef production (Stanley et al., 2018; Rowntree et al., 2020). Additionally, improving producers' willingness to adopt best management practices such as strategic supplementation of protein or energy, utilizing adaptive grazing management, and grazing higher quality forages have been shown to reduce emissions from grazing beef cattle (DeRamus et al., 2003; Savian et al., 2018; Thompson and Rowntree, 2020). Furthermore, broadening the focus beyond GHG emissions and utilizing an ecological approach to landscape management can simultaneously improve water cycling, biodiversity, and other sustainable development goals.
According to the EPA dataset, manure CH4 emissions have been increasing at a drastic and consistent rate from 1990 to 2020. These increases are largely driven by dairy and swine production. Manure CH4 originates from anaerobic microbial fermentation of organic matter, and as such, the largest sources of manure CH4 occur in confined animal systems where manure storage occurs in wet, anaerobic conditions. Manure that is handled as solids tends to undergo aerobic decomposition, which favors CO2 production rather than CH4 (EPA, 2022a). Most of the manures from beef and poultry sources are stored and handled dry according to the EPA (2022b). However, manures from dairy and swine are increasingly stored in liquid-based systems via retention ponds, lagoons, and pits underneath pen floors (Niles and Wiltshire, 2019; EPA, 2022a). This shift in manure management is a key driver behind manure CH4 emission increases for swine and dairy production. While dairies in drier climates still store much of their manure dry, all areas are undergoing some degree of transition to liquid manure storage (Niles and Wiltshire, 2019). Furthermore, as the dairy industry became more and more consolidated with a diminishing number of small farms (< 500-head) and an increasing number of larger farms (>500-head), there was an increasing number of dairy farms handling their manure in liquid form (EPA, 2022a,d). This greatly corresponds with the drastic increases in manure CH4 emissions from the dairy industry. From 2003 to 2014, the proportion of farms using liquid slurry manure management increased by 9.7%, and the proportion of farms using anaerobic lagoon manure management increased by 16.9% (Niles and Wiltshire, 2019).
As observed in Table 3 and Figure 3, manure CH4 emissions deserve greater attention across the animal production systems community given their rapid rise over the last 30 years, particularly in the dairy industry. These changes are important when contrasting these results with the changes in the dairy cattle population over this time. While there have been large changes, with a range of ~17.2–19.5 million head of cattle, the rate of change in absolute emissions of both manure and enteric CH4 is dissimilar and does not follow the trend in population as we observe in beef cattle. As reported above, dairy enteric CH4 emissions increased at an average rate of 9.3 kt per year compared to 25.9 kt for manure CH4. Manure emissions from dairy are on a trajectory to equal or surpass enteric emissions from dairy in the coming years if this trend continues. This speaks to the changes in dairy cattle production and management over the last several decades. Dairy cattle production has been shifting from smaller to larger scale operations, and this has altered how manure has been managed. One significant change has been an increase in manure retention time, which results in increased manure emissions (Place and Mitloehner, 2010; Gerber et al., 2013). Additionally, manure lagoons that provide the anaerobic conditions which favor CH4 production have increased (Gerber et al., 2013). Prior to shifting to large-scale dairy production, manure was held for shorter durations and spread on fields more frequently, which does not favor CH4 emissions once the manure has been applied (Place and Mitloehner, 2010). Other shifts in production beyond manure management are likely to contribute to manure CH4 emissions from cattle. These include changes in animal production (more outputs require more inputs, which can alter fecal and urine output) and dietary characteristics. A recent change in cattle diets over the last two decades has been an increase in the dietary inclusion of distillers' grains. Distillers' grains are high in fiber content and have been used as an inexpensive alternative to partially replace high-starch feedstuffs (Schingoethe et al., 2009). While utilizing this feedstuff can result in reduced enteric CH4 emissions, Massé et al. (2013) reported that manure from cattle fed distillers' grains plus solubles increased fecal matter and slurry excreted per day, increased dry matter content, volatile solids, and fiber content of excreta relative to animals not fed distillers' grains. These shifts in excreta conditions are favorable to CH4 production from manure. Additionally, this feedstuff is high in crude protein content and has been observed to increase manure N2O emissions, although it can reduce enteric CH4 production (Hünerberg et al., 2013). This therefore represents potential pollution “swapping” the industry has undergone when adopting this abundant feed alternative. However, these effects of dried distillers' grains are likely not the cause of the trends in the EPA (2022a) dataset because the equations used do not contain the resolution necessary to make adjustments based on dietary by-product inclusion. Thus, more comprehensive measurements of emissions and accounting for all major GHGs (N2O, CH4, and CO2) and their GWP across the entire dairy and beef production systems are recommended. It also needs to be recognized that similar pollution “swapping” can inadvertently occur between N2O and ammonia (NH3), another important air pollutant in the context of agriculture. Large gaps in knowledge exist in reliable farm-scale research on the performance of mitigation technologies for emissions of GHGs, NH3, odor, particulate matter, and volatile organic compounds (Maurer et al., 2016).
One way to reduce manure CH4 emissions is to minimize fugitive emissions from the facility and from digestate storage. The greatest opportunity for CH4 mitigation from liquid stored manure is through the installation of manure digesters. These systems capture CH4 produced from manure, and this biogas can be used to generate electricity or renewable natural gas on-farm or sold and utilized for energy production (EPA, 2018). However, manure must be stored in conditions with a high moisture content (>85% water), thereby making this technology impractical to implement on farms with dry manure storage. In semi-arid and arid environments, groundwater is typically the source of water for municipal and agricultural purposes. Using groundwater for biogas production in areas where this resource is diminishing is difficult to justify. Additionally, the cost associated with installing the digester systems limits the size of the farm where installation becomes economically feasible, which is suggested to be 500-head for dairy farms and 2,000-head capacity for swine farms (EPA, 2018). Another roadblock associated with installing anaerobic digesters is that the CH4 captured during anaerobic digestion is not a sufficiently clean or usable form of gas. Further costs are associated with cleaning and upgrading the captured biogas to remove trace gases and CO2 for conversion to bio-methane. Bio-methane is then used to generate electricity, heat, steam, replace or supplement natural gas, and can be further processed into biofuel for use in vehicles (Campbell et al., 2021). Another key roadblock to the adoption of anaerobic digesters is cold temperature. Temperatures of the liquid manure between 55 and 60°C, 35 and 37°C, and < 20°C undergo thermophilic, mesophilic, and psychrophilic anaerobic digestion, respectively, with gas production being reduced with lower temperatures (Dev et al., 2019). Thermophilic anaerobic digestion produced 41 and 144% more biogas per day than mesophilic and psychrophilic anaerobic digestion, respectively (Bouallagui et al., 2004; Dev et al., 2019). Producers located in colder climatic conditions aiming to install anaerobic digesters must consider temperature and make adjustments accordingly (Dev et al., 2019). Currently, there are 279 dairy, 45 swine, eight poultry, and eight beef farms with digesters installed, totaling 331 digester units in the United States (EPA, 2023). However, the EPA (2018) reported a total of ~5,400 swine and ~2,700 dairy operations that could feasibly install anaerobic digesters. If all of these farms installed anaerobic digesters, where feasible, there would be an estimated 85% reduction in manure CH4 (EPA, 2018). The substrate, environment, operational conditions, and technology management can all determine the success or failure of the digester. Due to the complexity and sensitivity of anaerobic digestion, it has a high rate of failure even when perfect conditions exist (Campbell et al., 2022). In areas where anaerobic digesters are not feasible, such as farms that store manure as solids, other reduction strategies should be employed. Albeit solid storage of manure is not believed to be a considerable source of CH4 emissions, some possible alternatives for manure CH4 mitigation in solid and wet manure management systems include manipulation of storage temperatures, aeration, covering storage areas, composting, land application, chemical additives, and manure nutrient separation (Peterson et al., 2013). However, using the GWP* approach to calculate implied warming, not all farms would be required to achieve a “cooling” effect as observed in Place et al. (2022).
There are differences in implied warming contribution, on a CO2 basis, when using GWP* compared with GWP100 for both enteric and manure CH4 emissions. This is because the GWP* methodology relates current emission rates to emission rates from only 20 years prior. With the large differences in values obtained when using GWP* instead of GWP100 (century-based), the question arises of which of these approaches is most appropriate and representative? The inappropriateness of GWP100 as a metric to relate gases to a common CO2 basis has long been discussed (O'Neill, 2000; Fuglestvedt et al., 2003; Shine et al., 2005, 2007; Lynch et al., 2020). It is argued that the GWP100 methodology may work for SLCFs, such as CH4, on a short-time horizon (e.g., immediate effects) but significantly overestimate warming contributions over longer time scales (e.g., over a century) or underestimate its impact when CH4 emissions increase rapidly (Cain et al., 2019; Smith et al., 2021). Furthermore, there are situations where GWP100 and GWP* provide similar values (Lynch et al., 2020; Beck et al., 2022). Beck et al. (2022) conducted a scenario where enteric CH4 emissions were increased annually by 1.01% and the GWP100 and GWP* estimates were identical. Thus, if emission rates are increasing above 1.01% per year, the GWP* would provide estimates greater than GWP100, while if emission rates are below the 1.01% per year rate, the GWP* would provide estimates that are lower than GWP100. Demonstrating that GWP* provides a more appropriate indication of warming, Cain et al. (2019) and Smith et al. (2021) demonstrated that GWP* provided estimates that closely followed actual warming contributions from CH4 emissions predicted using the FaIR climate model (Smith et al., 2018), while GWP100 were divergent.
Perhaps the most notable observation when comparing GWP100 and GWP* is the divergent results for enteric and manure CH4 emissions. For enteric CH4 emissions, utilizing GWP* typically results in lower implied warming impacts than GWP100 for beef and dairy cattle, with the one exception being 2018 for dairy cattle. For manure emissions, GWP* also resulted in lower warming impacts for beef cattle manure emissions. However, for dairy cattle manure CH4, the implied warming impact was ~2-fold higher using GWP* than GWP100. Furthermore, dairy manure CH4 emissions became the largest source of CO2-we from all livestock and poultry when using GWP* calculations. Therefore, adoption of this method would signal that greater attention should be paid to dairy cattle manure CH4 emissions. However, the magnitude of the impact of reductions from manure sources would still be less than that from enteric fermentation reductions, as absolute emission rates are lower from manure management than enteric fermentation. With anaerobic digesters maturing as a technology, more research is needed along with improved incentives for producers to improve the practicality of installing and reliably operating these systems outside of regions with clean energy subsidies. Finally, these results show that the adoption of GWP* is not a “cure all” solution for the livestock industry's GHG emissions. Rather because GWP* is sensitive to the emission trend (not just the emission magnitude), this method shows that an often-overlooked source of emissions (i.e., manure) has a greater climate impact than previously thought.
The GWP* methodology has been suggested to represent the warming contribution of CH4 relative more aptly compared with the GWP100 methodology. Accordingly, its adoption by reporting bodies, such as the EPA, is necessary to adequately inform policy decisions that aim to reduce global warming. Implementing GWP* calculations for enteric and manure CH4 emissions has enormous effects on the implied climate warming contribution of these sources of emissions. For example, applying GWP* to national enteric CH4 emissions drastically reduced its cumulative implied contribution to climate warming during 2010–2020 by 74% compared with the GWP100 method. This effect was due to the changes in enteric CH4 emission rates during that timeframe, which were mainly caused by changing cattle inventory. In contrast with enteric CH4, when GWP* is applied to manure CH4 emissions, it provides considerably higher implied climate warming estimates (on a CO2 basis). Using GWP* with manure CH4 resulted in cumulative CO2-we values from 2010 to 2020 that were 46% higher than the CO2-e values obtained when using GWP100. This was due to a near-linear increase in manure CH4 emissions from 1990 to 2020, which was driven by dairies adopting more liquid storage of manure. In fact, when using GWP*, the cumulative implied climate warming effects of manure CH4 from 2010 to 2020 were 85% greater than for enteric CH4 emissions. This suggests that manure CH4 has contributed much more to climate warming than enteric CH4 over this timeframe. The results of this modeling experiment call for rapid reductions in manure CH4 that are needed to occur, which is possible with liquid-stored manure by installing anaerobic digesters. Additionally, strategies should focus on technological and/or ecological approaches as potential solutions and not be reliant on the reduction of ruminant population (Cheng et al., 2022). While this research does highlight the importance of reducing manure CH4, the animal agriculture industry should still aim to reduce enteric CH4 emissions because reductions in enteric CH4 would offset more warming than reductions in manure CH4 even at similar reduction rates (expressed as percentages).
The original contributions presented in the study are included in the article/Supplementary material, further inquiries can be directed to the corresponding author.
MB and LT contributed to the conception and design of the study and wrote the first draft of the manuscript. MB compiled the data, performed the statistical analysis, and figure generation. JR, TT, JK, SP, and KS-L wrote sections of the manuscript. All authors contributed to the manuscript revision, read, and approved the submitted version.
The authors declare that the research was conducted in the absence of any commercial or financial relationships that could be construed as a potential conflict of interest.
All claims expressed in this article are solely those of the authors and do not necessarily represent those of their affiliated organizations, or those of the publisher, the editors and the reviewers. Any product that may be evaluated in this article, or claim that may be made by its manufacturer, is not guaranteed or endorsed by the publisher.
The Supplementary Material for this article can be found online at: https://www.frontiersin.org/articles/10.3389/fsufs.2023.1209541/full#supplementary-material
Allen, M. R., Peters, G. P., Shine, K. P., Azar, C., Balcombe, P., Boucher, O., et al. (2022). Indicate separate contributions of long-lived and short-lived greenhouse gases in emission targets. npj Clim. Atmos. Sci. 5, 18–21. doi: 10.1038/s41612-021-00226-2
Allen, M. R., Shine, K. P., Fuglestvedt, J. S., Millar, R. J., Cain, M., Frame, D. J., et al. (2018). A solution to the misrepresentations of CO2-equivalent emissions of short-lived climate pollutants under ambitious mitigation. npj Clim. Atmos. Sci. 1, 1–8. doi: 10.1038/s41612-018-0026-8
Beck, M. R., Thompson, L. R., and Campbell, T. N. (2022). Implied climate warming contributions of enteric methane emissions are dependent on the estimate source and accounting methodology. Appl. Anim. Sci. 38, 639–647. doi: 10.15232/aas.2022-02344
Beck, M. R., Thompson, L. R., White, J. E., Williams, G. D., Place, S. E., Moffet, C., et al. (2018). Whole cottonseed supplementation improves performance and reduces methane emission intensity of grazing beef steers 1. Prof. Anim. Sci. 34, 339–345. doi: 10.15232/pas.2018-01722
Beck, M. R., Thompson, L. R., Williams, G. D., Place, S. E., Gunter, S. A., Reuter, R., et al. (2019). Fat supplements differing in physical form improve performance but divergently influence methane emissions of grazing beef cattle. Anim. Feed Sci. Technol. 254, 114210. doi: 10.1016/j.anifeedsci.2019.114210
Bouallagui, H., Haouari, O., Touhami, Y., Ben Cheikh, R., Marouani, L., and Hamdi, M. (2004). Effect of temperature on the performance of an anaerobic tubular reactor treating fruit and vegetable waste. Process Biochem. 39, 2143–2148. doi: 10.1016/j.procbio.2003.11.022
Cain, M., Lynch, J., Allen, M. R., Fuglestvedt, J. S., Frame, D. J., Macey, A., et al. (2019). Improved calculation of warming-equivalent emissions for short-lived climate pollutants. npj Clim. Atmos. Sci. 2, 1–7. doi: 10.1038/s41612-019-0086-4
Campbell, T. N., Rhoades, M. B., Parker, D. B., and Blaser, B. C. (2021). “Model of estimated energy from bio-methane generated with hydraulic fracturing wastewater and beef cattle manure,” in 2021 ASABE Annual International Meeting (St. Joseph, MI: ASABE), 7–11. doi: 10.13031/aim.202100518
Campbell, T. N., Rhoades, M. B., Parker, D. B., and Blaser, B. C. (2022). Biogas production with beef cattle manure and wastewater from hydraulic fracturing. J. ASABE. 65, 113–121. doi: 10.13031/ja.14685
Cheng, M., McCarl, B., and Fei, C. (2022). Climate change and livestock production: A literature review. Atmosphere. 13, 140. doi: 10.3390/atmos13010140
DeRamus, H. A., Clement, T. C., Giampola, D. D., and Dickison, P. C. (2003). Methane emissions of beef cattle on forages: efficiency of grazing management systems. J. Environ. Qual. 32, 269–277. doi: 10.2134/jeq2003.2690
Dev, S., Saha, S., Kurade, M. B., and Salama, E. (2019). Perspective on anaerobic digestion for biomethanation in cold environments. Renew. Sustain. Energy Rev. 103, 85–95. doi: 10.1016/j.rser.2018.12.034
Dijkstra, J., Bannink, A., France, J., Kebreab, E., and van Gastelen, S. (2018). Short communication: antimethanogenic effects of 3-nitrooxypropanol depend on supplementation dose, dietary fiber content, and cattle type. J. Dairy Sci. 101, 9041–9047. doi: 10.3168/jds.2018-14456
EPA (2018) Market Opportunities for Biogas Recovery Systems at U.S. Livestock Facilities. Washington, DC. Available online at: https://www.epa.gov/agstar/agstar-market-opportunities-report (accessed February 08, 2023).
EPA (2022a) Inventory of U.S. Greenhouse Gas Emissions and Sinks: 1990-2020. Washington DC: U.S. Environmental Protection Agency. Available online at: https://www.epa.gov/ghgemissions/inventory-us-greenhouse-gas-emissions-and-sinks-1990-2020 (accessed March 15, 2023).
EPA (2022b) Annexes to the Inventory of U.S. GHG Emissions and Sinks. U.S. Washington DC: Environmental Protection Agency. Available online at: https://www.epa.gov/ghgemissions/inventory-us-greenhouse-gas-emissions-and-sinks-1990-2020 (accessed August 09, 2023).
EPA (2022c) State GHG Emissions and Removals. Available online at: https://www.epa.gov/ghgemissions/state-ghg-emissions-and-removals (accessed February 01, 2023).
EPA (2022d) Anaerobic Digestion on Dairy Farms. Washington, DC. Available online at: https://www.epa.gov/agstar/anaerobic-digestion-dairy-farms#:~:text=Anaerobicdigestion%28AD%29ofdairymanureinthe,methanefromlivestockmanuremanagement%28seeFigure1%29 (accessed February 01, 2023).
EPA (2023) AgSTAR Data and Trends. AgSTAR. Available online at: https://www.epa.gov/agstar/agstar-data-and-trends (accessed February 01, 2023).
Fuglestvedt, J. S., Berntsen, T. K., Godal, O., Sausen, R., Shine, K. P., and Skodvin, T. (2003). Metics of climate change: assessing radiative forcing and emission indices. Clim. Change 58, 267–331. doi: 10.1023/A:1023905326842
Gerber, P. J., Steinfeld, H., Henderson, B., Opio, M. A. C., Dijkman, J., Falcucci, A., et al. (2013). Tackling Climate Change Through Livestock: A Global Assessment of Emissions and Mitigation Opportunities. Rome: Food and Agriculture Organization of the United Nations (FAO).
Hünerberg, M., McGinn, S. M., Beauchemin, K. A., Okine, E. K., Harstad, O. M., and McAllister, T. A. (2013). Effect of dried distillers' grains with solubles on enteric methane emissions and nitrogen excretion from finishing beef cattle. Can. J. Anim. Sci. 93, 373–385. doi: 10.4141/CJAS2012-151
IPCC (2013). “Climate change 2013: the physical science basis,” in Contribution of Working Group I to the Fifth Assessment Report of the Intergovernmental Panel on Climate Change, eds T. F. Stocker, Q. D. Plattner, G. K. Tignor, M. Allen, S. K. Boschung, J. Nauels, et al. (Cambridge: Cambridge University Press).
IPCC (2021). “Climate change 2021: the physical science basis,” in Contribution of Working Group I to the Sixth Assessment Report of the Intergovernmental Panel on Climate Change, eds V. Masson-Delmotte, P. Zhai, A. Pirani, S. L. Connors, C. Péan, S. Berger, et al. (Cambridge; New York, NY: Cambridge University Press).
Kinley, R. D., Martinez-fernandez, G., Matthews, M. K., de Nys, R., Magnusson, M., and Tomkins, N. (2020). Mitigating the carbon footprint and improving productivity of ruminant livestock agriculture using a red seaweed. J. Clean. Prod. 259, 120836. doi: 10.1016/j.jclepro.2020.120836
Lynch, J., Cain, M., Frame, D., and Pierrehumbert, R. (2021). Agriculture's Contribution to climate change and role in mitigation is distinct from predominantly fossil CO2-emitting sectors. Front. Sustain. Food Syst. 4, 1–9. doi: 10.3389/fsufs.2020.518039
Lynch, J., Cain, M., Pierrehumbert, R., and Allen, M. (2020). Demonstrating GWP*: a means of reporting warming-equivalent emissions that captures the contrasting impacts of short- and long-lived climate pollutants. Environ. Res. Lett. 15:044023. doi: 10.1088/1748-9326/ab6d7e
MacDonald, J. M., Donoghue, E. J. O., Mcbride, W. D., Nehring, R. F., Sandretto, C. L., and Mosheim, R. (2007). Profits, Costs, and the Changing Structure of Dairy Farming. Washington, DC: USDA-ERS.
Machado, L., Magnusson, M., Paul, A., Nicholas Kinley, R., de Nys, R., and Tomkins, N. (2016). Identification of bioactives from the red seaweed Asparagopsis taxiformis that promote antimethanogenic activity in vitro. J. Appl. Phycol. 28, 3117–3126. doi: 10.1007/s10811-016-0830-7
Massé, D. I., Jarret, G., Benchaar, C., and Saady, N. M. C. (2013). Effect of corn dried distiller grains with solubles (DDGS) in dairy cow diets on manure bioenergy production potential. Animals 4, 82–92. doi: 10.3390/ani4010082
Mathews, K. H., Hahn, W. F., Nelson, K. E., Duewer, L. A., and Gustafson, R. A. (1999). U.S. Beef Industry: Cattle Cycles, Price Spreads, and Packer Concentration. Washington, DC: USDA-ERS.
Maurer, D. L., Koziel, J. A., Harmon, J. D., Hoff, S. J., Rieck-Hinz, A. M., and Andersen, D. S. (2016). Summary of performance data for technologies to control gaseous, odor, and particulate emissions from livestock operations: Air management practices assessment tool (AMPAT). Data Brief. 7, 1413–1429. doi: 10.1016/j.dib.2016.03.070
Miljkovic, D. (2009). US and Canadian livestock prices: market integration and trade dependence. Appl. Econ. 41, 183–193. doi: 10.1080/00036840600994260
Niles, M. T., and Wiltshire, S. (2019). Tradeoffs in US dairy manure greenhouse gas emissions, productivity, climate, and manure strategies. Environ. Res. Commun. 1, 075003. doi: 10.1088/2515-7620/ab2dec
Njuki, E. (2022). Sources, Trends, and Drivers of Dairy Productivity, U. S., and Efficiency. Washington, DC: USDA-ERS. Available online at: http://www.ers.usda.gov (accessed March 01, 2023).
Ocko, I. B., Sun, T., Shindell, D., Oppenheimer, M., Hristov, A. N., Pacala, S. W., et al. (2021). Acting rapidly to deploy readily available methane mitigation measures by sector can immediately slow global warming. Environ. Res. Lett. 16:054042. doi: 10.1088/1748-9326/abf9c8
O'Neill, B. C. (2000). The jury is still out on global warming potentials. Clim. Change 44, 427–443. doi: 10.1023/A:1005582929198
Peterson, S. O., Blanchard, M., Chadwick, D., Del Prado, A., Edouard, N., Mosquera, J., et al. (2013). Manure management for greenhouse gas mitigation. Animal. 7, 266–282. doi: 10.1017/S1751731113000736
Place, S. E., McCabe, C. J., and Mitloehner, F. M. (2022). Symposium review: Definining a pathway to climate neutrality for US dairy cattle production. J. Dairy Sci. 105, 8558–8568. doi: 10.3168/jds.2021-21413
Place, S. E., and Mitloehner, F. M. (2010). Contemporary environmental issues: a review of the dairy industry's role in climate change and air quality and the potential of mitigation through improved production efficiency. J. Dairy Sci. 93, 3407–3416. doi: 10.3168/jds.2009-2719
R Core Team (2021). R: A Language and Environment for Statistical Computing. R Found. Stat. Comput. Available from: http://www.r-project.org (accessed April 01, 2023).
Rippey, B. R. (2015). The U.S. drought of 2012. Weather Clim. Extrem. 10, 57–64. doi: 10.1016/j.wace.2015.10.004
Roque, B. M., Salwen, J. K., Kinley, R., and Kebreab, E. (2019). Inclusion of Asparagopsis armata in lactating dairy cows' diet reduces enteric methane emission by over 50 percent. J. Clean. Prod. 234, 132–138. doi: 10.1016/j.jclepro.2019.06.193
Roque, B. M., Venegas, M., Kinley, R. D., De Nys, R., Duarte, T. L., Yang, X., et al. (2021). Red seaweed (Asparagopsis taxiformis) supplementation reduces enteric methane by over 80 percent in beef steers. PLoS ONE 16, 1–20. doi: 10.1371/journal.pone.0247820
Rotz, C. A., Asem-Hiablie, S., Place, S., and Thoma, G. (2019). Environmental footprints of beef cattle production in the United States. Agric. Syst. 169, 1–13. doi: 10.1016/j.agsy.2018.11.005
Rowntree, J. E., Stanley, P. L., Maciel, I. C. F., Thorbecke, M., Rosenzweig, S. T., Hancock, D. W., et al. (2020). Ecosystem impacts and productive capacity of a multi-specie3s pastured livestock system. Front. Sustain. Food Syst. 4, 544984. doi: 10.3389/fsufs.2020.544984
Savian, J. V., Schons, R. M. T., Marchi, D. E., Freitas, T. S. D., da Silva Neto, G. F., Mezzalira, J. C., et al. (2018). Rotatinuous stocking: A grazing management innovation that has high potential to mitigate methane emissions by sheep. J. Clean. Prod. 186, 602–608. doi: 10.1016/j.jclepro.2018.03.162
Schingoethe, D. J., Kalscheur, K. F., Hippen, A. R., and Garcia, A. D. (2009). The use of distillers products in dairy cattle diets. J. Dairy Sci. 92, 5802–5813. doi: 10.3168/jds.2009-2549
Shine, K. P., Berntsen, T. K., Fuglestvedt, J. S., Skeie, R. B., and Stuber, N. (2007). Comparing the climate effect of emissions of short- and long-lived climate agents. Philos. Trans. R. Soc. A Math. Phys. Eng. Sci. 365, 1903–1914. doi: 10.1098/rsta.2007.2050
Shine, K. P., Fuglestvedt, J. S., Hailemariam, K., and Stuber, N. (2005). Comparing climate impacts of emissions of greenhouse gases. Clim. Change 68, 281–302. doi: 10.1007/s10584-005-1146-9
Smith, C. J., Forster, P. M., Allen, M., Leach, N., Millar, R. J., Passerello, G. A., et al. (2018). FAIR v1.3: a simple emissions-based impulse response and carbon cycle model. Geosci. Model Dev. 11, 2273–2297. doi: 10.5194/gmd-11-2273-2018
Smith, M. A., Cain, M., and Allen, M. R. (2021). Further improvement of warming-equivalent emissions calculation. npj Clim. Atmos. Sci. 4, 2–4. doi: 10.1038/s41612-021-00169-8
Stanley, P. L., Rowntree, J. E., Beede, D. K., DeLonge, M. S., and Hamm, M. W. (2018). Impacts of soil carbon sequestration on life cycle greenhouse gas emissions in Midwestern USA beef finishing systems. Agri. Syst. 162, 249–258. doi: 10.1016/j.agsy.2018.02.003
Stefenoni H. A. Räisänen S. E. Cueva S. F. Wasson D. E. Lage C. F. A. Melgar A.. (2021). Effects of the macroalga Asparagopsis taxiformis and oregano leaves on methane emission, rumen fermentation, and lactational performance of dairy cows. J. Dairy Sci. 104, 4157–4173. doi: 10.3168/jds.2020-19686
Thompson, L. R., and Rowntree, J. E. (2020). INVITED REVIEW: Methane sources, quantification, and mitigation in grazing beef systems. Appl. Anim. Sci. 36, 556–573. doi: 10.15232/aas.2019-01951
USDA-NASS (2023b) Cattle. Washington, DC. Available online at: https://usda.library.cornell.edu/concern/publications/h702q636h (accessed February 01, 2023).
Vijn, S., Compart, D. P., Dutta, N., Foukis, A., Hess, M., Hristov, A. N., et al. (2020). Key considerations for the use of seaweed to reduce enteric methane emissions from cattle. Front. Vet. Sci. 7, 1–9. doi: 10.3389/fvets.2020.597430
Vucko, M. J., Magnusson, M., Kinley, R. D., Villart, C., and De Nys, R. (2017). The effects of processing on the in vitro antimethanogenic capacity and concentration of secondary metabolites of Asparagopsis taxiformis. J. Appl. Phycol. 29, 1577–1586. doi: 10.1007/s10811-016-1004-3
Wickham, H. (2016). ggplot2: Elegant Graphics for Data Analysis. New York, NY: Springer-Verlag. Available online at: https://ggplot2.tidyverse.org doi: 10.1007/978-3-319-24277-4_9 (accessed February 01, 2023).
Keywords: greenhouse gases, enteric methane, manure methane, U.S. livestock production, cattle
Citation: Beck MR, Thompson LR, Rowntree JE, Thompson TN, Koziel JA, Place SE and Stackhouse-Lawson KR (2023) U.S. manure methane emissions represent a greater contributor to implied climate warming than enteric methane emissions using the global warming potential* methodology. Front. Sustain. Food Syst. 7:1209541. doi: 10.3389/fsufs.2023.1209541
Received: 20 April 2023; Accepted: 10 August 2023;
Published: 06 September 2023.
Edited by:
Leonard Rusinamhodzi, International Institute of Tropical Agriculture (IITA), NigeriaReviewed by:
Miguel Angel Taboada, University of Buenos Aires, ArgentinaCopyright © 2023 Beck, Thompson, Rowntree, Thompson, Koziel, Place and Stackhouse-Lawson. This is an open-access article distributed under the terms of the Creative Commons Attribution License (CC BY). The use, distribution or reproduction in other forums is permitted, provided the original author(s) and the copyright owner(s) are credited and that the original publication in this journal is cited, in accordance with accepted academic practice. No use, distribution or reproduction is permitted which does not comply with these terms.
*Correspondence: Matthew R. Beck, bWF0dGhldy5yLmJlY2tAdXNkYS5nb3Y=
Disclaimer: All claims expressed in this article are solely those of the authors and do not necessarily represent those of their affiliated organizations, or those of the publisher, the editors and the reviewers. Any product that may be evaluated in this article or claim that may be made by its manufacturer is not guaranteed or endorsed by the publisher.
Research integrity at Frontiers
Learn more about the work of our research integrity team to safeguard the quality of each article we publish.