
94% of researchers rate our articles as excellent or good
Learn more about the work of our research integrity team to safeguard the quality of each article we publish.
Find out more
ORIGINAL RESEARCH article
Front. Sustain. Food Syst. , 27 July 2023
Sec. Climate-Smart Food Systems
Volume 7 - 2023 | https://doi.org/10.3389/fsufs.2023.1208283
This article is part of the Research Topic Modelling Approaches for Climate Variability and Change Mitigation and Adaptation in Resource Constrained Farming Systems View all 12 articles
 Malamal Alickal Sarath Chandran1,2*
 Saon Banerjee1Asis Mukherjee1Manoj Kumar Nanda1
 Visha Kumari Venugopalan2,3Alison M. Laing4
 Manzer H. Siddiqui5
 Akbar Hossain6*
Introduction: Crop sequences are important to make efficient use of natural resources and ensure food security. Climate change affects the sustainability of crops in cropping sequence. The application of crop sequence modelling to evaluate the sustainability of cropping sequences under projected climate is a less explored area.
Methods: The present work evaluated the impact of projected climate on six cropping sequences viz., rice-mustard-groundnut, rice-lentil-groundnut, rice-potato-groundnut, rice-wheat-groundnut, rice-maize-groundnut and rice-mustard-fallow in the Lower Gangetic Plain of India. CMIP-5 multi-model ensemble, long-term crop sequence modelling using DSSAT and a multiple criteria decision analysis tool, TOPSIS was used to evaluate sustainability. Future climate scenarios were developed using 29 GCMs from which a subset of 5 representative GCMs was selected for mid-century (2040-2069) and end-century (2070-99) under RCP4.5 and RCP8.5 emission scenarios. Weighted average ensemble yield, ETa and nitrogen fixed by all cropping sequences for the study period were used to rank cropping sequences for sustainability using TOPSIS.
Results and Discussion: The minimum and maximum temperatures during mid and end-centuries were projected to be consistently higher than the baseline period (1980-2010) for all the cropping seasons. Under all the periods, rice-lentil-groundnut had the highest weighted average ensemble yield, followed by rice-wheat-groundnut. Rice-lentil-groundnut fixed the highest quantity of nitrogen, followed by rice-maize-groundnut. Ranking of cropping sequences for sustainability by the TOPSIS method indicated that during mid-century (under both RCP4.5 and RCP8.5), the rice-lentil-groundnut sequence will be the most sustainable cropping sequence. However, by the end century, the rice-wheat-groundnut sequence will be the most sustainable cropping sequence, followed by rice-lentil-groundnut under both RCP4.5 and 8.5. In all the cropping sequences, rice will be benefitted by higher amount of nitrogen fixed and preceding groundnut. The three parameters considered for defining sustainability in crop production (yield, ETa and N-fixed) ensures higher produce and return for the farmer, less dependence on irrigation sources and increase in soil nitrogen content. In this paper, we show for the first time that cropping sequences can be evaluated for sustainability by combining crop sequence modelling, GCM ensemble and multi-criteria decision analysis. The results of the study will help the farmers of the study area to opt for the most sustainable cropping sequence and other alternatives in the context of climate change.
The ecosystem, including living things, has experienced significant loss and negative effects from anthropogenic climate change. In India, the air temperature increased on an average by 0.7°C during 1901 and 2018 (Krishnan et al., 2020). Diverse climatic disasters will become inevitable in the near future if global warming exceeds 1.5°C, posing multiple dangers to ecosystems and mankind (IPCC, 2022).
Climate has a well-known impact on crop productivity all over the globe. Hence, any change in climate will have either positive or negative impact on crop production. India’s agricultural production is highly dependent on rainfall, notably during the “kharif” season (June–September, also known as southwest monsoon season). There is substantial evidence that climate change has had a negative impact on agriculture through changing rainfall patterns, soil water balance, crop duration, and areas suitable for crops (Olesen and Bindi, 2002). Temperature, precipitation, carbon dioxide concentration, and solar radiation are the main factors considered in the case of climate change. While an increase in temperature during the growing season reduces yield, the CO2 fertilization effect will mitigate this negative impact to some extent. Furthermore, a rise in the frequency and length of dry spells or high rainfall events has a detrimental effect on crop productivity. The interaction of these elements makes the climate change impact assessment on crops difficult. Understanding the relationship between these factors and other factors is a challenge for agricultural experts.
Process-based crop models have long been used to predict the performance of crops and cropping systems in a changing climate (Parry et al., 2004; Jones et al., 2017). Their ability to evaluate genotype-environment-management interactions, in particular, has made them crucial in agricultural climate change impact and adaptation studies. Cropping system models, such as Decision Support System for Agrotechnology Transfer (DSSAT; Jones et al., 2003) and Agricultural Production Systems Simulator (APSIM; Keating et al., 2003), are bio-physical models that simulate crop growth in relation to weather, soil physical and chemical properties, and management practices. DSSAT v4.7 includes models that simulate growth, development, and yield for over 32 crops. It was developed to assess the effects of crop management on the productivity and sustainability of agroecosystems, as well as practices like crop rotations and tillage methods. In regions with a longer growing season, techniques targeted at enhancing resource capture at the crop sequence level through the use of double-crops (Videla-Mensegue et al., 2021) or triple crops (Chandran et al., 2022) can be just as important as agronomic measures at the individual crop level for maximizing resource productivity.
The growing of a number of crops in a specified order on a single field at a particular period is known as cropping sequence (Matthews et al., 2006). It is thought to be an approach for environmentally friendly sustainable agriculture (Reidsma et al., 2009; Lin, 2011). Although there is a considerable amount of work on using crop modelling to evaluate the performance of specific crops in the context of future climates, there are very few studies on using crop modelling to evaluate the performance of a cropping sequence or crop rotation. The primary conclusion from such studies is that continuous simulation of multi-year crop rotations outperformed single crop/year simulations in terms of yield (Kollas et al., 2015; Teixeira et al., 2015).
India’s Lower Gangetic Plains (LGP) are a highly productive region. LGP makes a sizable contribution to the nation’s total agricultural production. We have thus undertaken our research in this area. Despite the fact that LGP is a region where intensive agricultural production is prevalent, there are no information on how expected climatic changes would affect LGP’s intense cropping sequences. Further, how the impact of projected climate on a single crop in a cropping sequence will affect the productivity of the cropping sequence is also not reported. Modelling the cropping sequence can provide a better understanding about the changes in carry over effect from one crop to the next in a cropping sequence on a long-term basis. A comparison of crop sequence modelling between major cropping sequences in a region can aid the researchers in identifying the most sustainable ones under projected climate. This study, for the first time, has evaluated the sustainability of multiple cropping sequences using ensemble of general circulation models (GCM), crop sequence modelling and multi-criteria decision analysis. Here, the sustainability is defined as the ability of the cropping sequence to produce more with less water and fertilizers. The assumption regarding less fertilizer is that the cropping sequences which fixes higher nitrogen will require lesser dose of nitrogen fertilizer, thereby reducing the leaching loss. The major objectives of the study were: (i) to identify the impact of projected climate on major cropping sequences of LGP on a long-term basis (ii) to rank the cropping sequences based on sustainability using multi-criteria decision analysis.
The climate of LGP is typically subtropical—hot and humid, with an annual average rainfall of 1,435 mm. As per USDA modern taxonomical classification, the soil is classified as Aeric Haplaquept. The texture is sandy loam, with moderately well drainage. The physicochemical characteristics of the soil in the study area are presented in Supplementary Table S1.
The major cropping sequences of the study area selected for the study were:
• Rice–Mustard–Groundnut.
• Rice–Lentil–Groundnut.
• Rice–Potato–Groundnut.
• Rice–Wheat–Groundnut.
• Rice–Maize–Groundnut.
• Rice–Mustard–Fallow.
Rice, being the major kharif crop in the study area, was chosen for all the six cropping sequences. In rabi (October to March), the crops were selected based on the area under cultivation and availability in DSSAT. For summer, only groundnut was selected due to unavailability of crop modules for green gram, black gram etc. in DSSAT.
The Decision Support System for Agrotechnology Transfer (DSSAT) modelling system consists of crop-specific models for simulating the growth and yield of various crops. It is widely used around the world for climate change impact assessment in field crops. It has different modules to simulate water balance, nutrient dynamics, crop growth, phenology, biomass and yield daily during the crop growth based on crop characteristics like phenology, photoperiod, leaf area development, biomass partitioning etc., which are defined by cultivar-specific genetic coefficients. The input data required for the calibration and validation in DSSAT includes daily weather data, soil data, crop management data and observed crop data. The cropping system model (CSM) in DSSAT consists of different modules for different categories of crops for simulation. In this study, the following modules of DSSAT were used.
• CERES module for rice, wheat, maize.
• CROPGRO module for lentil, groundnut, mustard.
• SUBSTOR module for potato.
The crop data for the calibration and validation of the models were collected from secondary sources in the LGP (mentioned in Supplementary Table S2). Experimental data collected were used to calibrate and validate the models individually so that the optimized parameters during calibration represent the response of crops to soil, weather conditions and management practices of LGP.
Model calibration was done by optimizing the values of genetic coefficients of specific cultivars (mentioned in Supplementary Table S2) using the ‘Generalized Likelihood Uncertainty Analysis’ (GLUE) tool (Jones et al., 2011). Genetic coefficients related to phenology were optimized first so that the difference between simulated and observed phenology was minimum. Then coefficients related to growth, biomass and yield were optimized for all the crops and cultivars used in the study.
For validation, root mean square error (RMSE), normalized RMSE (nRMSE) and mean bias error (MBE) were used as a measure of the difference between observed and simulated values. The RMSE was calculated using Eq. (1).
where, n is the total number of observations, Si is the simulated values and Oi is the observed values. The standard deviation of the model prediction error is given by the RMSE. A smaller value indicates better model performance. The nRMSE was calculated using Eq. (2).
where, is the mean of observed values. It gives a measure of the relative difference between observed and simulated values as a percentage of mean observed values (Soler et al., 2007). The simulation is considered excellent with a nRMSE less than 10%, good if nRMSE greater than 10 and less than 20%, fair if the nRMSE is greater than 20% and less than 30%; poor if nRMSE is greater than 30% (Jamieson et al., 1991). The mean bias error (MBE) was calculated using Eq. (3).
The MBE captures the average bias in the prediction. A positive bias or error indicates an overestimation of the simulated variable and vice versa.
The observed daily meteorological data for baseline (1980–2010) as well as for the model calibration and validation period (2007–2016) was collected from agromet observatory maintained by All India Coordinated Research Project on Agrometeorology, Mohanpur Center. Future climate scenarios were generated from 29 general circulation models (GCMs). The list of GCMs considered is listed in Supplementary Table S3.
The ‘Representative Temperature and Precipitation (T&P) GCM Subsetting Approach’ (Ruane and McDermid, 2017) was used to select 5 GCMs from a pool of 29 GCMs for this study.
Using this technique, 29 GCMs were divided into five groups according to how much they deviated from the ensemble median in terms of temperature and precipitation. The predicted climate of a GCM would then be divided into cool/hot and wet/dry regions (Figure 1).
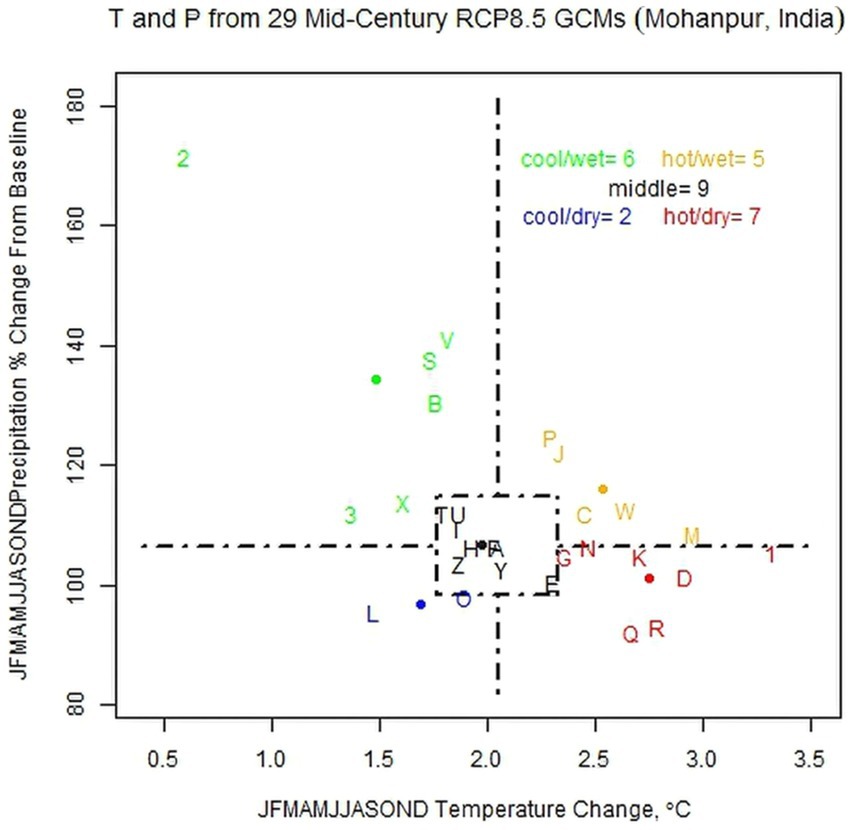
Figure 1. Five categories of 29 GCMs for mid-century and RCP8.5. Alphabets A–Z (26) and numbers 1–3 represent 29 GCMs and they are coloured according to their category. The dots represent the median of GCMs within a category. Source: Authors’ own previous published article: (Chandran et al., 2022).
These conditions can be combined to create four categories: cool/wet, cool/dry, hot/wet, and hot/dry. The intersection of the four previously mentioned categories around the ensemble’s median is represented by a fifth category called “middle.” The five representative GCMs thus selected were, MRI-CGCM3, CMCC-CMS, HadGEM2-ES, MIROC5 and GFDL-ESM2G. More details regarding the methodology can be found in Chandran et al. (2021, 2022). From this point forward, each GCM will be referred to by the name of its quadrant, which is listed in Table 1. The weightage established for the five selected GCMs was used to quantify the ensemble mean yield under future scenarios. The chosen GCMs were bias corrected using “Empirical Quantile Mapping.” The monthly mean maximum and minimum temperature, precipitation, daily maximum and minimum temperature standard deviation and variance, the number of rainy days, and the shape of the rainfall distribution were all adjusted. The historical time series was modified in this way to resemble future predictions where mean and variability changes have already taken place.
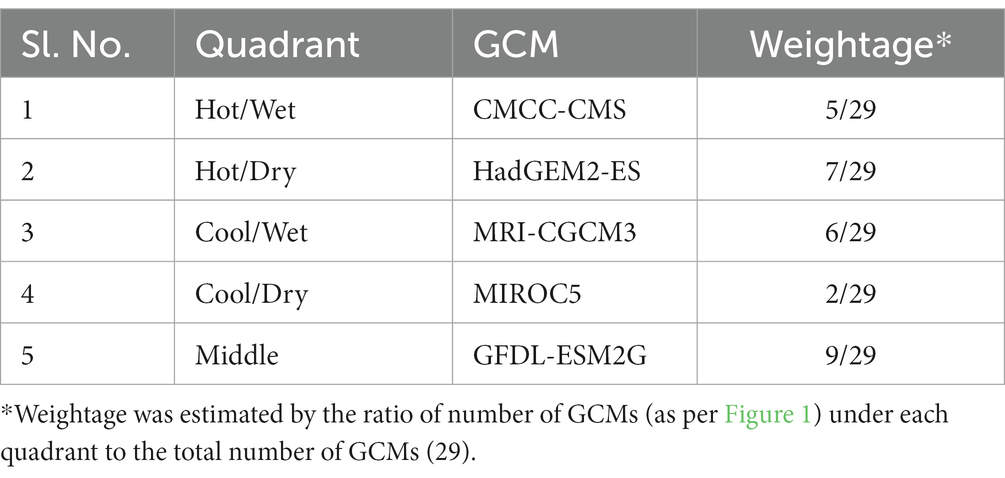
Table 1. Selected GCMs for climate change impact analysis.
The future climate scenarios were developed for two time slices viz., mid-century (2040–2069) and end-century (2070–99). Two emission scenarios were considered viz. RCP4.5 and RCP 8.5. The ‘R’ scripts were used to generate the future climate as presented in AgMIP (2013). The AgMIP central year CO2 assumption for mid-century under RCP4.5 (499 ppm) and RCP8.5 (571 ppm) and for end-century under RCP4.5 (532 ppm) and RCP8.5 (801 ppm) were also adopted (AgMIP, 2012). The baseline (1980–2009) CO2 concentration considered was 380 ppm.
The total rainfall, mean Tmax and mean Tmin for the three crop seasons (kharif, rabi and summer) was estimated during baseline (with observed weather data) and future periods (with 29 GCMs). Then, the deviation of these climatic elements (per cent deviation of rainfall, absolute deviation of Tmax and Tmin in degree Celsius) during future from that of baseline was estimated and presented in the form of grouped box plots.
Cropping sequence simulation necessitates daily calculation of soil-related processes such as soil water balance, as well as the no-crop period between two crops. Crop residue and residual soil moisture from the previous crop should be made available for the next crop as well. The DSSAT sequence analysis module considers all of the aforementioned processes and is an excellent tool for evaluating the long-term performance of a cropping sequence. For example, sequence analysis of the rice–maize–groundnut cropping sequence was carried out in the current study by running CERES-Rice, CERES-Maize, and CROPGRO-Peanut crop models in order, with initial soil conditions specified solely for the first model in the sequence, CERES-Rice.
The cropping sequences under study was simulated using the sequence analysis module in DSSAT for three time periods: 1980–2010 (baseline), 2040–2069 (mid-century), and 2070–2099 (End-century). Furthermore, simulations were conducted with baseline CO2 concentration (360 ppm) and elevated CO2 concentration to investigate the influence of elevated CO2 on crop growth and yield over time. Table S4 of Supplementary Material-1 contains the details of the crop management data used in the DSSAT sequence analysis. Because the majority of crop production in the study area occurs under irrigated conditions, irrigation was turned to automatic when necessary. In DSSAT cropping system model, automatic irrigation is triggered by either soil moisture or evapotranspiration demand. Irrigation amounts was calculated based on deficit. In this study, the threshold for triggering irrigation was, when the soil moisture of top 30 cm of the soil profile (management depth) falls below 50% of the maximum available.
Three parameters viz., total yield, total actual evapotranspiration (ETa) of the cropping sequence and Total nitrogen fixed by the cropping sequence were considered to identify sustainable cropping sequence in this study.
The weighted average ensemble yield for the crops under all the future scenarios was estimated using Eq (4)
Where YHot/Wet is the yield obtained when the simulation was performed with Hot/Wet GCM. The multiplication factor was the number of GCMs in each quadrant while subsetting and ‘29’ in the denominator of Eq (4) represents the total number of GCMs used in the study. The same equation was used for estimating weighted average ensemble ETa and nitrogen fixed by the cropping sequences. To find the total yield of cropping sequences under study, the yield of other crops was converted into rice equivalent yield by Eq. (5)
This was required because we cannot directly add the yield of different crops in a sequence and estimate the total yield of the cropping sequence. For example, though, the yield of lentil is less than that of wheat or maize, its price per kg is much higher. After finding rice equivalent yield of crops in a sequence, total yield was estimated as explained in the following example.
The total yield of rice–wheat–groundnut cropping sequence was calculated by Eq. (6)
Where, ‘Y’ represents yield, ‘P’ represents price and subscripts represent the crops – ‘r’ for rice, ‘w’ for wheat and ‘g’ for groundnut. Similarly, the total yield of all other five cropping sequences was estimated for different time periods under study.
The prices of crops were taken from the minimum support price (MSP) announced by Govt. of India for all the crops, except for potato, which is not covered under MSP program. MSP was obtained from respective CACP reports from 1991 onwards for rice, wheat, maize, mustard and groundnut. For potato and lentil, the prices were taken from Agmarknet (2013–2020) and data.gov.in (1991–2012). The prices of crops understudy for the recent 30 years (1991–2020) were taken to calculate the rice-equivalent yields (Table S5 of Supplementary Materials-1) as price details were not available during 1980–1986. We assumed that the relative prices of these crops will remain the same during future periods also. Hence, the same values were used to estimate rice-equivalent yields during the future period too. This assumption was made due to the difficulty in price forecasting for a longer period of time.
Cumulative ETa of the six cropping sequences was estimated by adding ETa of individual crops in the sequence. For all the cropping sequences, except rice–lentil–groundnut and rice–mustard–fallow, only groundnut contributed to nitrogen-fixing. For rice–lentil–groundnut, both lentil and groundnut contributed to nitrogen-fixing. As the legume crops were not included, there was no nitrogen fixation for rice–mustard–fallow.
After estimating these three parameters, a multi-criteria decision analysis (MCDA) tool called TOPSIS (Technique for Order Preference by Similarity to Ideal Solution) was used to identify the sustainable cropping sequence for different time periods under study. MCDA is a complex decision-making technique that takes into account both quantitative and qualitative considerations. The basic principle of TOPSIS is that the chosen alternative should have the shortest distance from the ideal solution and the farthest from the negative ideal solution. The steps involved in the TOPSIS method are as follows (Kobryń and Prystrom, 2016).
The first step is the creation of a decision matrix. In the present study, the decision matrix will contain values of total yield, ETa and nitrogen fixed by cropping sequences. In the second step, a normalized decision matrix is created using Eq. (7). The normalized values represent the relative performance of the generated design alternatives.
In the third step, a weighted normalized decision matrix is constructed. Here, the weighting is included considering the fact that all the selection criteria is of equal importance. The weights were calculated using analytical hierarchy process (AHP) to quantify the relative importance of selection criteria.
The relative importance of the criteria considered was estimated using Supplementary Table S6. According to this, the yield was given extreme importance (intensity 9) when compared with nitrogen fixation and strong importance (intensity 5) when compared with ETa. Among ETa and nitrogen fixation, ETa was considered moderately important over nitrogen fixation (intensity 4). Based on this, a priority matrix was created and is presented in Supplementary Table S7. From the priority matrix, the weights were derived and the values were 0.74 for yield, 0.19 for ETa and 0.06 for nitrogen fixation. The consistency of the derived weights was evaluated using a consistency ratio. The obtained consistency ratio was 0.06, which was less than 0.1 (acceptable upper limit). The derived weights were used for TOPSIS analysis.
The weighted decision matrix was then constructed by multiplying each element of each column of the normalized decision matrix by the weights (Eq. 8).
where, Wj is the weight of the jth element.
In the fourth step, the positive and negative ideal solution are identified using weighted decision matrix as explained by Supraja and Kousalya (2016). In the fifth step, the separation distance of each alternative from the positive and negative ideal solution is estimated. The final step consists of the estimation of performance score, based on which the cropping sequences were ranked. The performance score ranges between zero and one, where higher score was obtained for more sustainable cropping sequences. A detailed description of about the TOPSIS method and equations used for steps 4–6 are provided in Supplementary Material 2. The overall methodology used in the study is presented in Figure 2.
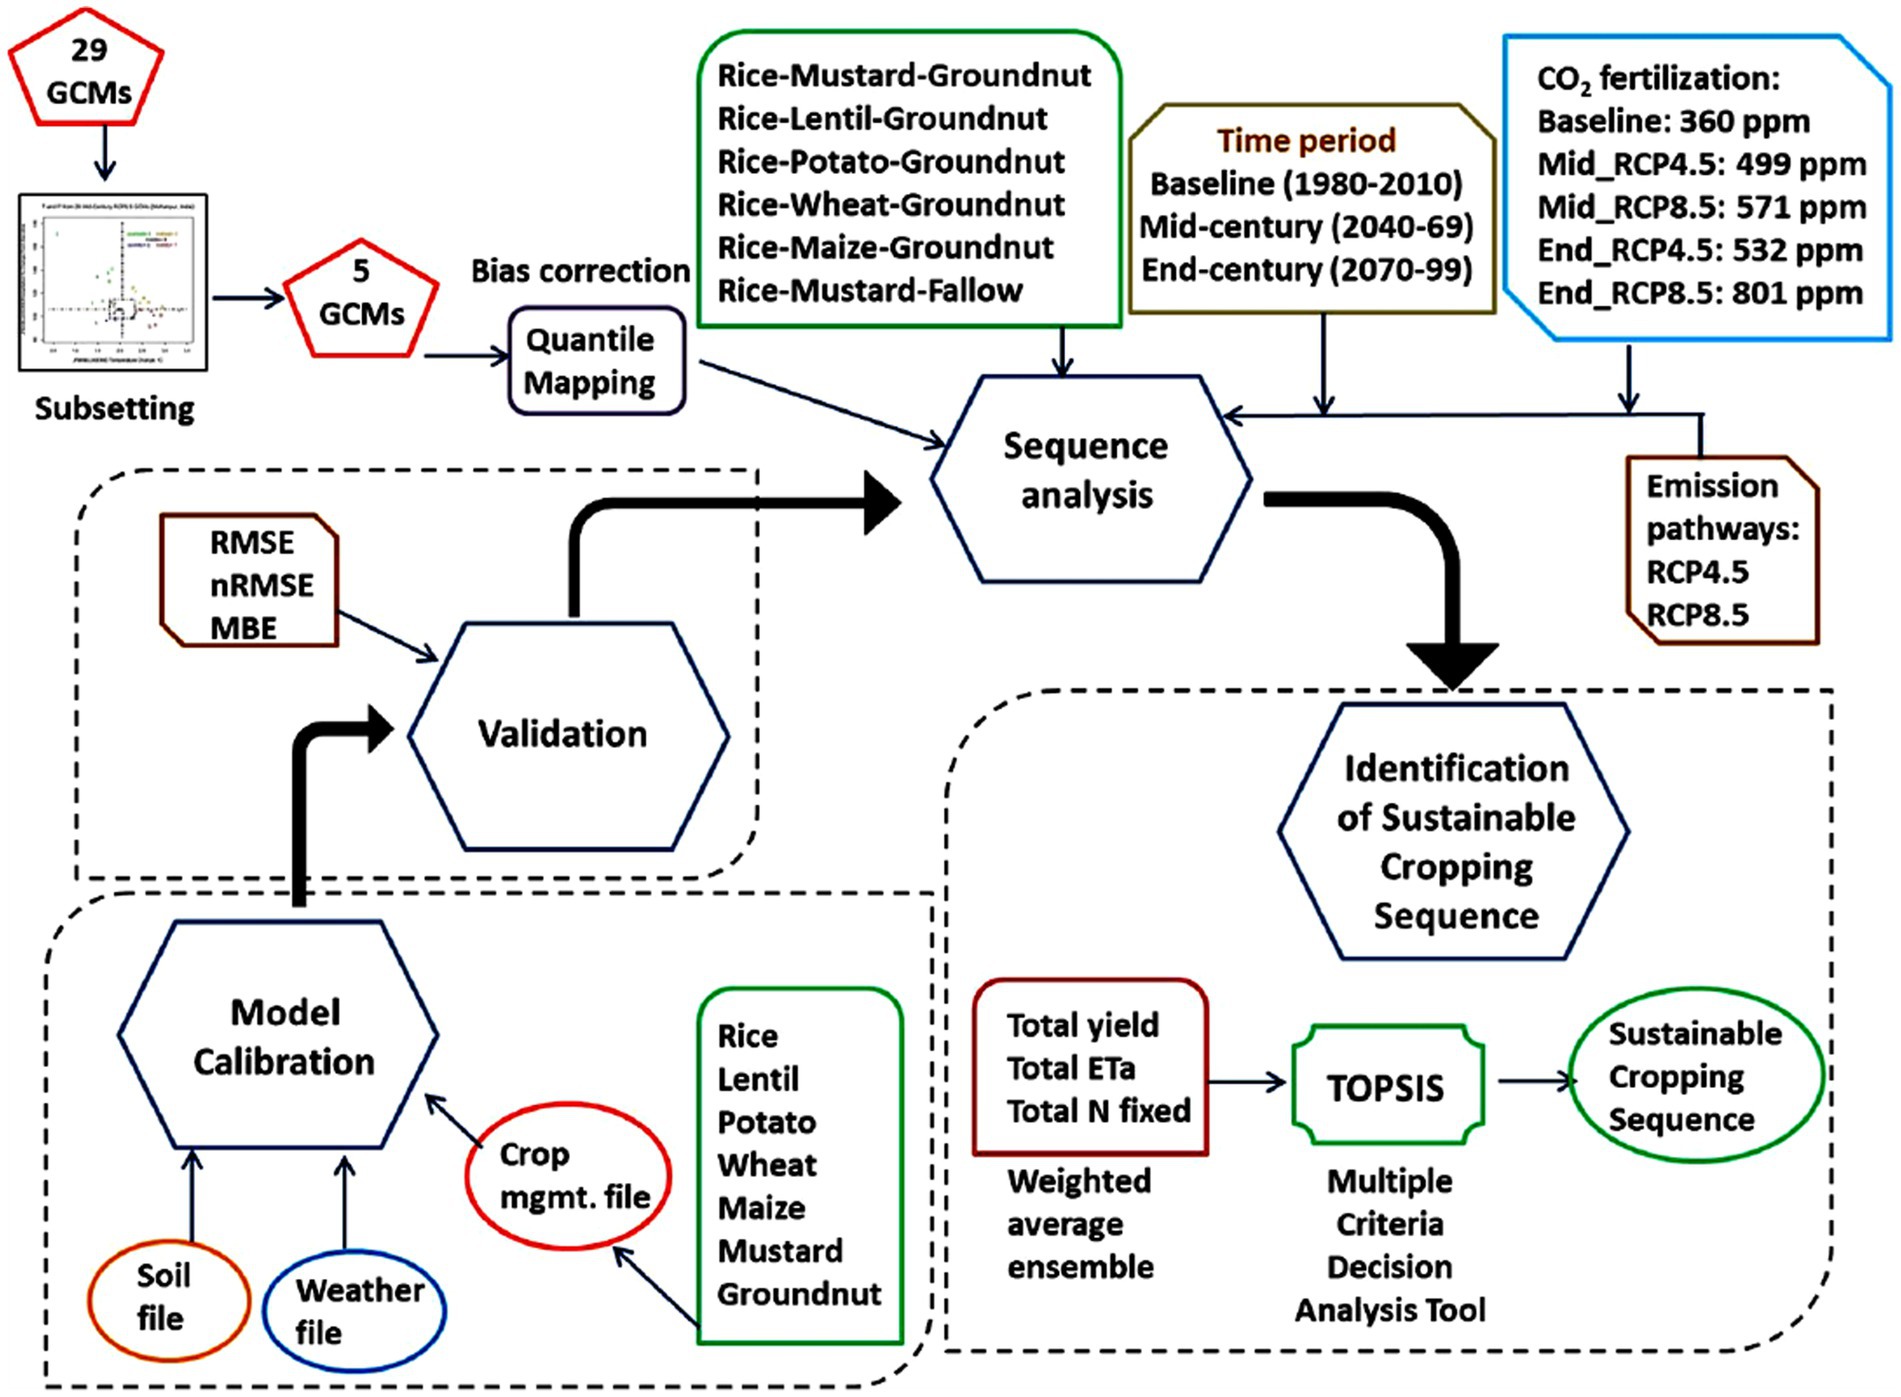
Figure 2. The flow chart depicting the methodology used in the work.
A set of genetic coefficients were calibrated for all the crops under study. These cultivar-specific coefficients, such as photothermal days to flowering and maturity, sensitivity to photoperiod, seed size etc. are presented in Supplementary Tables S8–S14. The calibrated models were tested with independent data sets for validation as explained in Materials and methods. The validation metrics are presented in Supplementary Tables S15–S17. The days to anthesis and maturity of all the crops under study was well-calibrated as indicated by nRMSE values (‘excellent’ for all crops as per Jamieson et al., 1991). Validation of tops weight indicated that for all crops except wheat, nRMSE was ‘good’. For wheat, nRMSE was ‘fair’, which is also acceptable. Validation of yield indicated that mustard and potato yield was the best calibrated as nRMSE was ‘excellent’, followed by maize, groundnut and wheat (‘good’) and lentil and rice (‘fair’).
For the baseline period (July–October), the average seasonal rainfall for the rice growing season was 901 mm. The projected change in rainfall for the kharif season varied across all future scenarios, from − 1.5 to + 5.4%. The average seasonal rainfall during the second growing season (rabi) was 75 mm. The projected change ranges from − 8.5 to + 1.7%. The mean seasonal rainfall of the summer season during baseline was 459 mm. In future scenarios, it is expected to change by + 0.5%, reaching + 13.1% (Figure 3A).
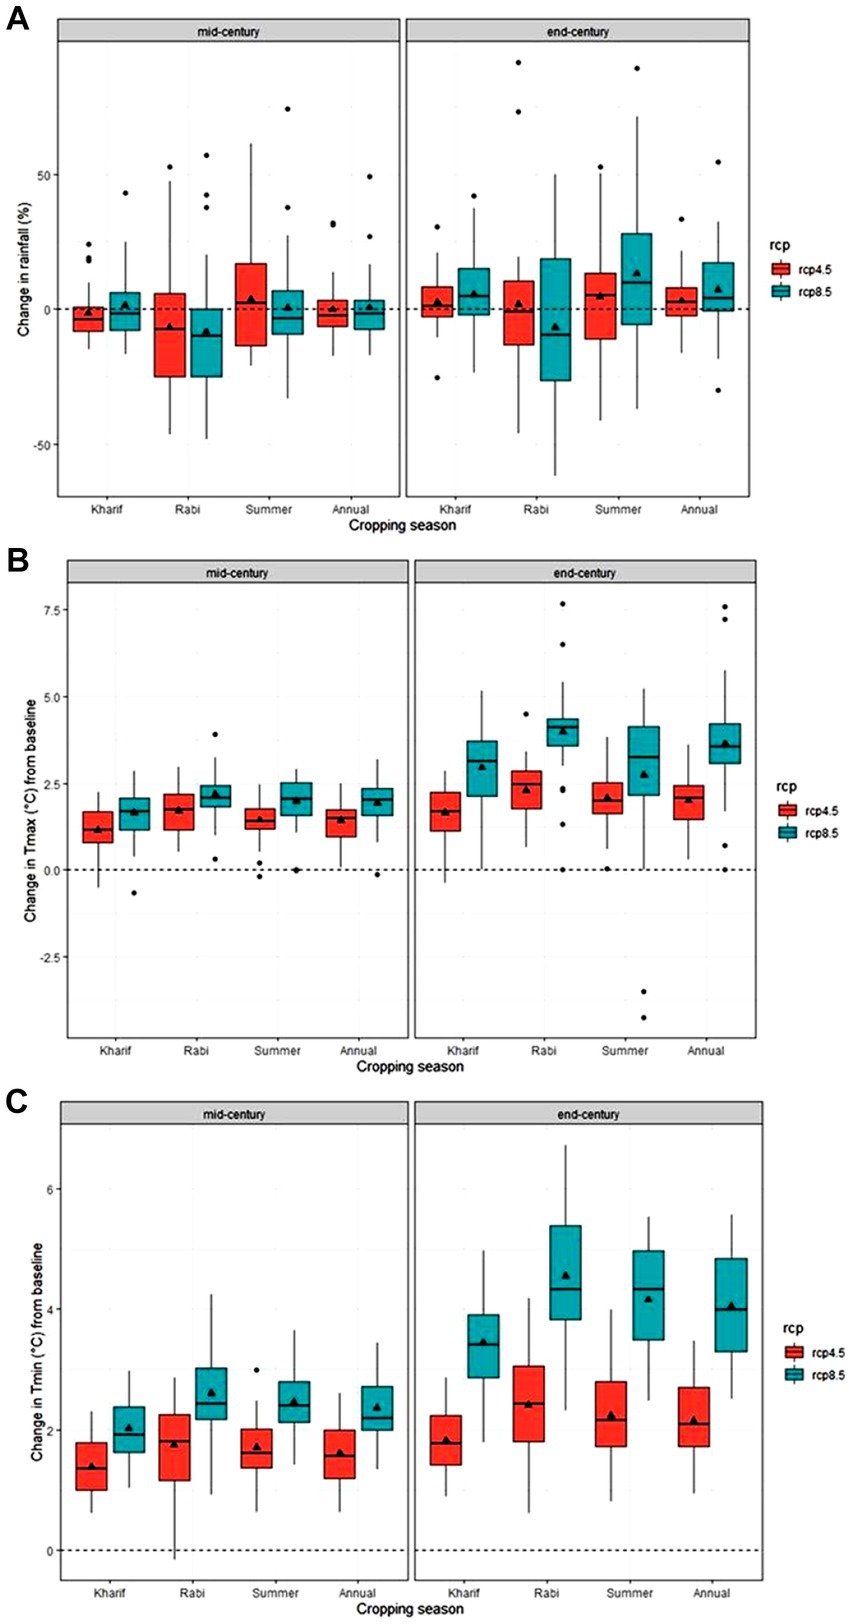
Figure 3. Change in projected (A) mean seasonal rainfall, (B) Tmax and (C) Tmin over the study region during kharif (July–October), rabi (November–February), summer (March–June) and annual under RCP4.5 and RCP8.5 from 29 GCMs. The black lines and triangle within each box indicate the multi-model median and mean, respectively and zero denotes baseline.
The mean Tmax during baseline kharif season was 32.8°C. It is likely to increase to the range of 1.1–2.9°C. In a similar vein, the average Tmax during rabi season was 27.9°C, and it is anticipated to rise by 1.7–4°C. The Tmax during the summer season is also expected to rise which is depicted in Figure 3B. Similarly, the projected change from the baseline value in Tmin is presented in Figure 3C. The results showed that the mean seasonal rainfall, Tmax and Tmin showed higher variability (among the 29 GCMs) under RCP8.5 than RCP4.5, as indicated by the width of the box plots. The width of the box plots indicates that among the future periods, the variability is comparatively larger at the end of the century. A drastic increase in Tmin (more than 4°C during rabi and summer seasons) during the end-century is also projected.
A reduction in total crop duration was simulated for all the cereal crops in cropping sequences. In most of the cases, the reduction in duration of vegetative stage is more than that of reproductive stage. The projected reduction in total duration of rice was 6 (mid-century-RCP4.5) to 15 (end-century-RCP8.5) days, considering all the six cropping sequences (Figure 4A).
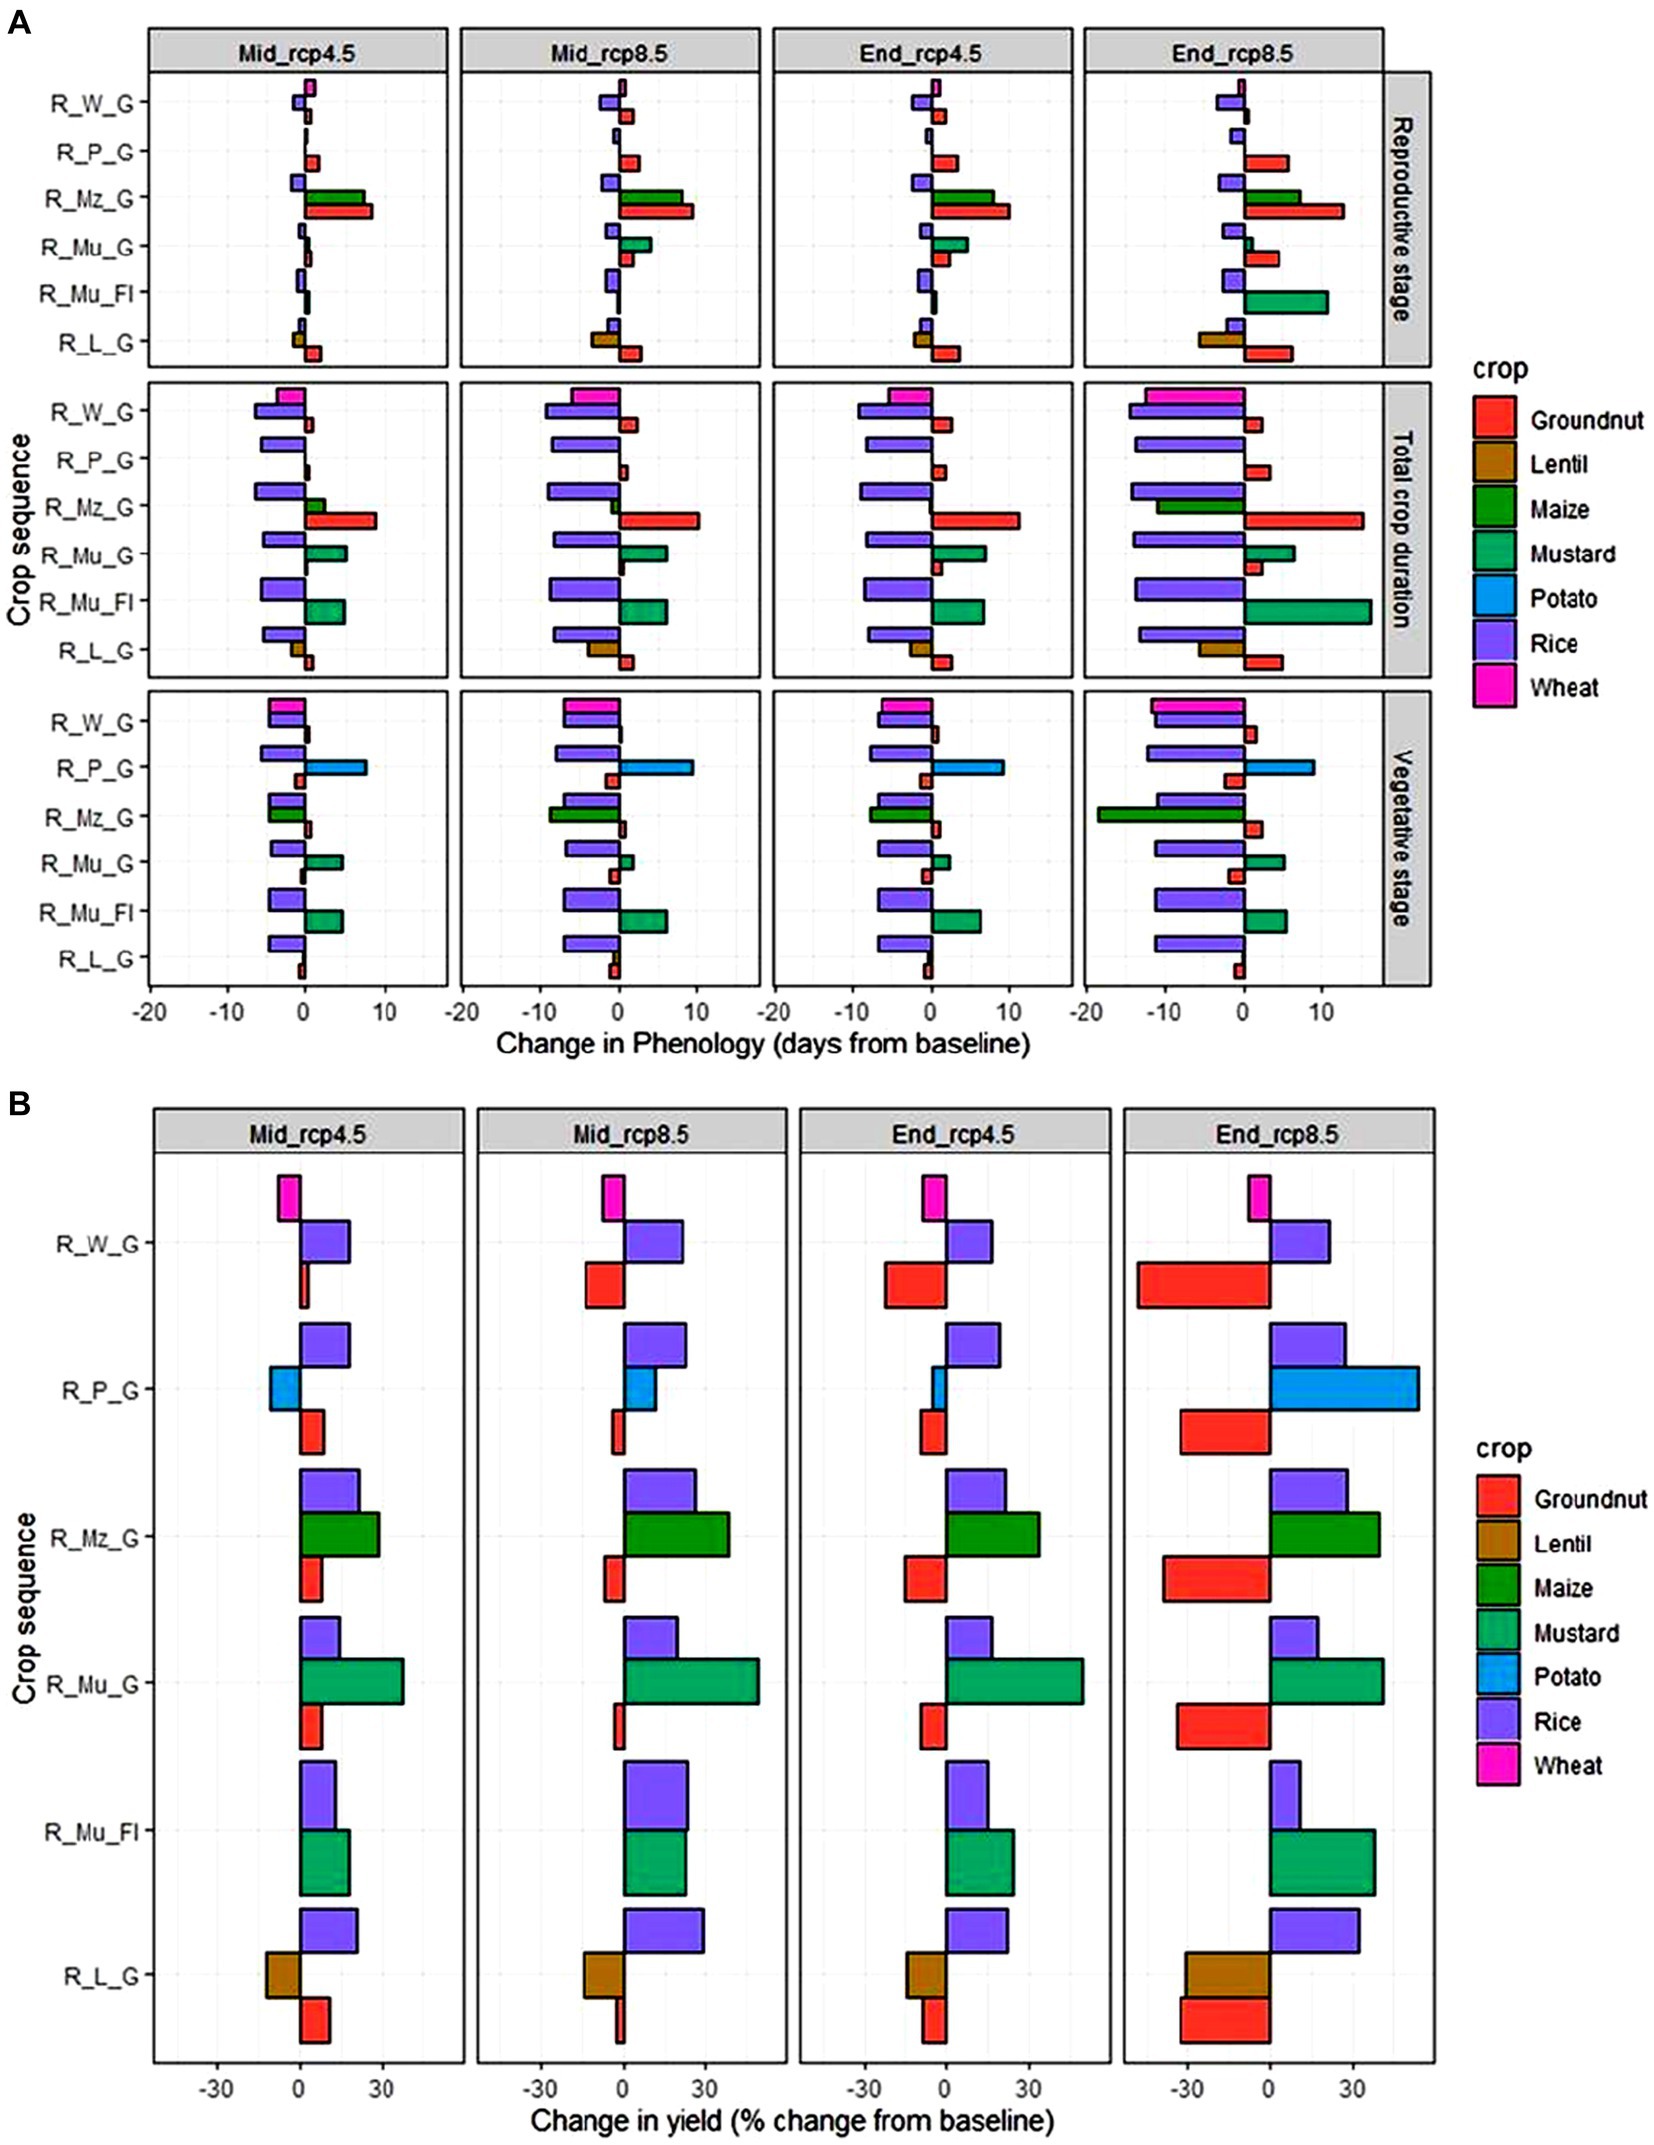
Figure 4. (A) Change in total crop duration, reproductive phase, vegetative phase and (B) per cent change in yield of crops in the cropping sequences under study during mid and end-centuries under RCP4.5 and 8.5 from baseline.
The reduction in duration of vegetative phase (ranging 5–12 days) has contributed mainly to the total reduction in duration of rice. Similar results were observed in the case of other cereals (wheat, maize). However, for lentil, the reduction in total crop duration (ranging 2–6 days) was mainly due to shortened reproductive phase (ranging 1–6 days). For groundnut, the total crop duration was simulated to increase, mainly due to the increased duration of reproductive phase.
In all the six cropping sequences, the yield of rice was simulated to increase under future climate and it ranged from 11 to 40% higher than the baseline average yield. Similar results were observed for maize also (29–40% increase; Figure 4B). However, the yield of wheat in rice–wheat–groundnut sequence was simulated to decrease by 7–9%. The magnitude of yield decline was higher for lentil (12–31%) and groundnut (3–48%).
Sequence analysis was run for all the six cropping sequences under study during baseline, mid and end-centuries (under RCP4.5 and RCP8.5) and the weighted average ensemble yield, seasonal ETa and amount of nitrogen fixed was estimated.
The simulation study showed that under both baseline and projected scenarios, Rice–lentil–groundnut recorded the highest yield, followed by rice–wheat–groundnut (Figure 5A). The lowest yield was recorded for the rice–mustard–fallow sequence. The average yield of Rice–lentil–groundnut across the five-time periods (including baseline) was 18,866 kg ha−1 and that of rice–wheat–groundnut was 17,888 kg ha−1. The yield of lentil was lower than that of wheat when comparing rice–lentil–groundnut and rice–wheat–groundnut sequences. However, due to the higher price per unit of lentil, its equivalent yield was higher than that of wheat. The rice–maize–groundnut, with an average yield of 14,188 kg ha−1 ranked third among the cropping sequences under study. The higher yield was considered as one of the criteria for the identification of sustainable cropping sequence. Over the time periods, a gradual decrease in the yield of rice–lentil–groundnut was observed, especially during the end-century. However, its magnitude is much higher than that of other cropping sequences, except that of rice–wheat–groundnut sequence.
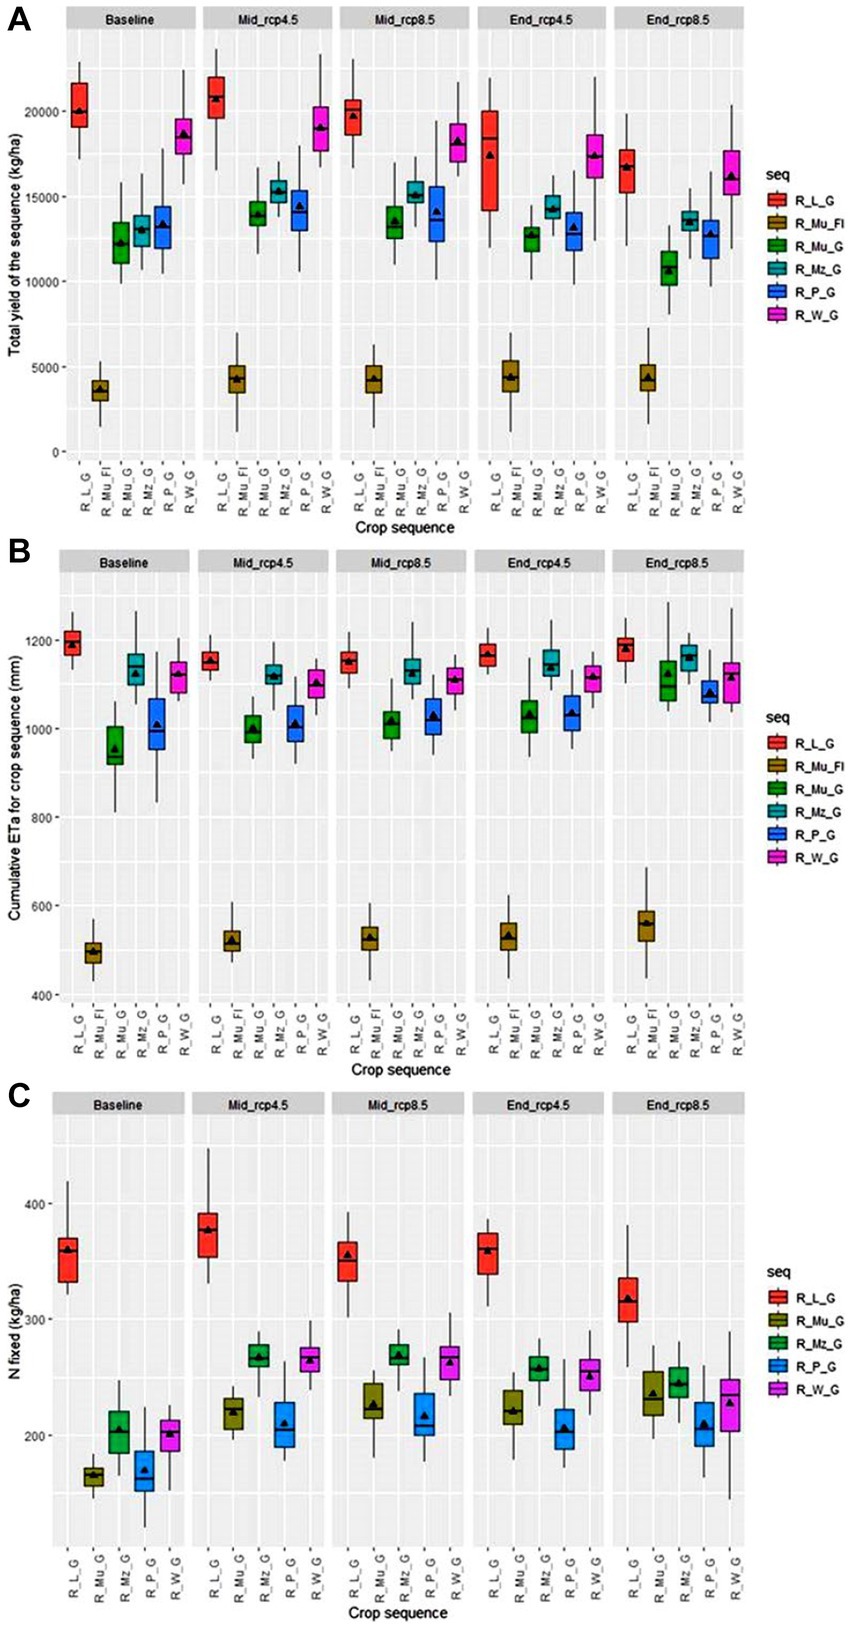
Figure 5. Total weighted average ensemble (A) yield (kg ha−1), (B) ETa (mm) and (C) N fixed (kg ha−1) of the cropping sequences under baseline, mid-century and end-century under RCP4.5 and RCP8.5 considering CO2 fertilization. The black triangle and black line inside each box plot represent the mean and median of 30 years, respectively.
Under all the time periods, the rice–mustard–fallow sequence recorded the lowest ETa, with an average ETa of 526 mm (Figure 5B). Rice–lentil–groundnut recorded the highest ETa (1,166 mm), followed by rice–wheat–groundnut (1,112 mm). Lower ETa was considered as one of the criteria for the identification of sustainable cropping sequence.
Rice–lentil–groundnut fixed the highest quantity of nitrogen (average of 353 kg N ha−1), followed by rice–maize–groundnut (248 kg N ha−1) and rice–wheat–groundnut (241 kg N ha−1) under all the time periods (Figure 5C). Rice–lentil–groundnut was the only cropping sequence that had two legume crops. That was the reason for the higher quantity of nitrogen fixed by this sequence, compared to others. In groundnut, CO2 fertilization increased the nitrogen fixation to quantities higher than the baseline level. In lentil, CO2 fertilization reduced the magnitude of reduction in nitrogen fixation due to elevated temperature during all study periods.
Weighted average ensemble yield, ETa and nitrogen fixed under different time periods were the inputs for TOPSIS method, which is a multiple criterion decision aid tool. A performance score was derived based on which the cropping sequences were ranked for sustainability under different time periods (Table 2). The results indicated that Rice–lentil–groundnut was the most sustainable cropping sequence during baseline, followed by rice–wheat–groundnut. During mid-century under RCP4.5 and 8.5 also, Rice–lentil–groundnut will be the most sustainable cropping sequence. But, during the end-century under RCP4.5 and RCP8.5, rice–wheat–groundnut will be a slightly better choice compared to Rice–lentil–groundnut. The third best alternative will be rice–maize–groundnut.
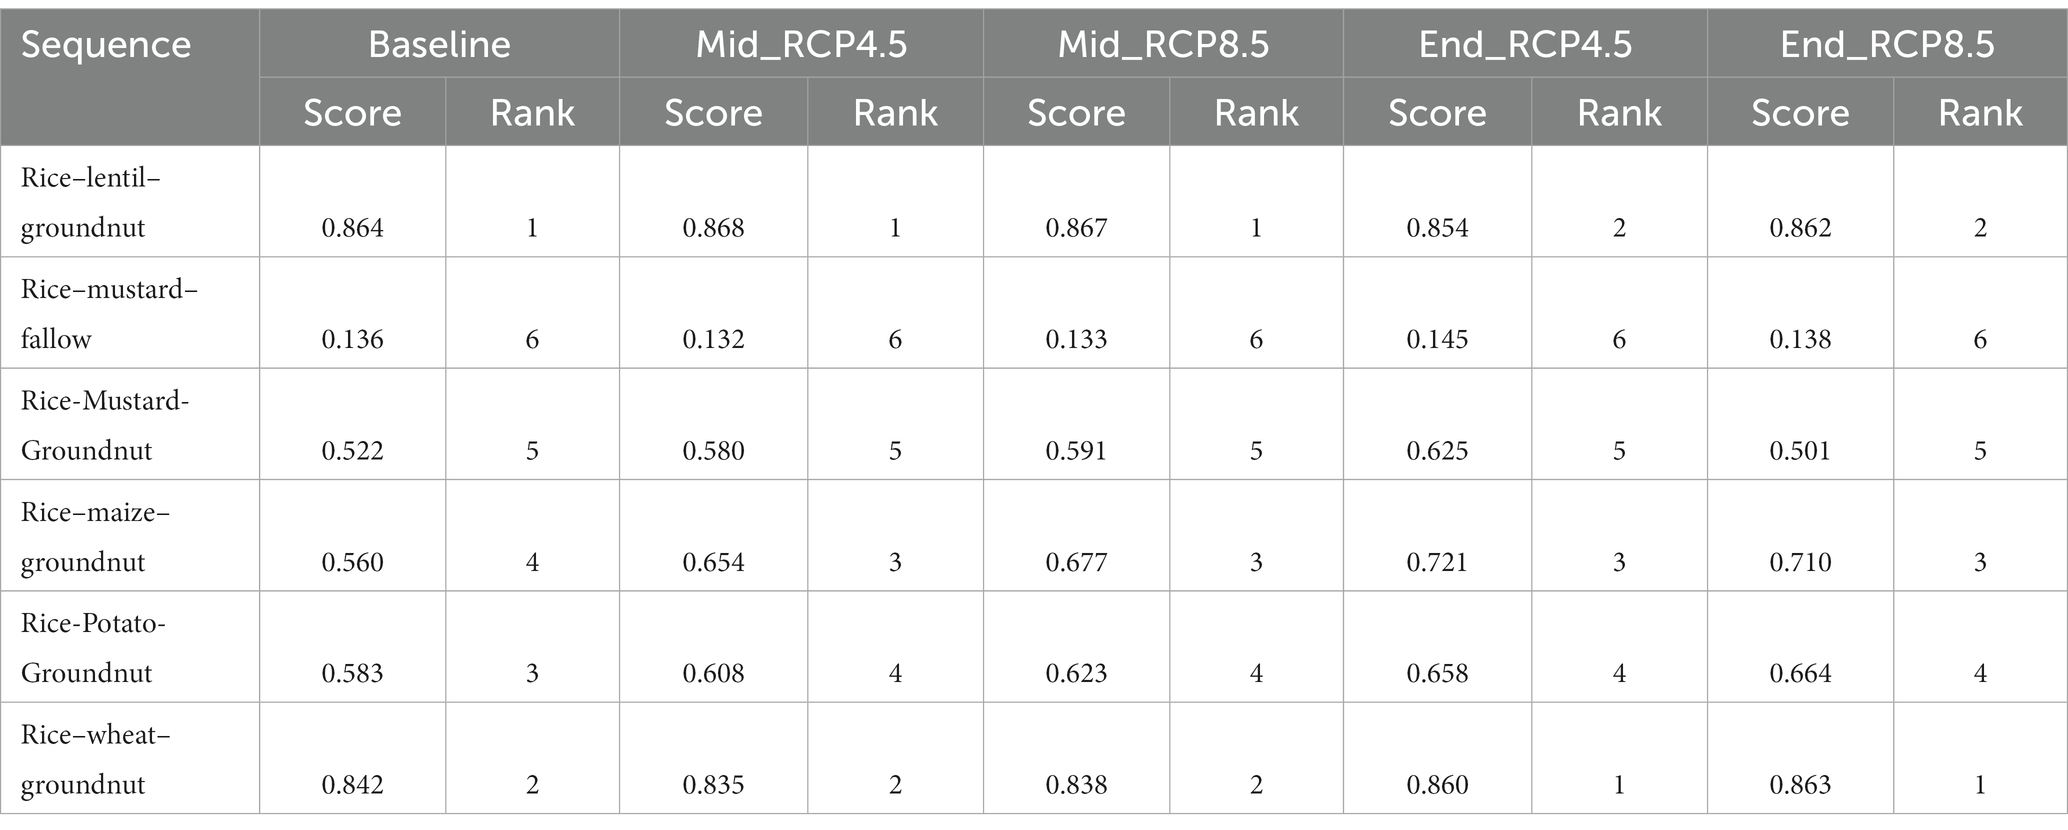
Table 2. Ranking of crop sequences based on TOPSIS multi-criteria decision-making tool for baseline, mid-century and end-century under RCP4.5 and RCP8.5 emission scenarios.
Gangetic West Bengal (GWB) is the most important agricultural hub of eastern India. According to the IPCC (2007) report, eastern India would experience less rain and a 0.5–1°C rise in average temperature between 2020 and 2029, and a 3.5–4.5°C rise between 2030 and 2099. The results of our study regarding the temperature increase were in agreement with this IPCC report. The notable increases in both mean seasonal Tmax and Tmin during all the three crop growing seasons will have a great influence on crop model simulations, especially in crop phenology. It is known that the growing degree days and photoperiod sensitivity of crops account for the crop phenology. In light of this, it follows that under future climate scenarios, a rise in mean seasonal Tmax and Tmin will result in advancement of the days to anthesis and crop maturity. An earlier study by Ghosh (2018) showed a marked decline in rainfall over Gangetic West Bengal during the early monsoonal month of June and the mid monsoonal month of August during mid-century. The same result was observed in the present study during mid-century under RCP8.5 and during the end-century under RCP4.5. An increase in summer rainfall by 13% (i.e., an increase of 60 mm rainfall) is projected during the end-century under RCP8.5 emission scenario. The third season crop taken into consideration in the study, groundnut, had changes in phenology, growth, and yield as a result.
The variation in total yield of cropping sequence during different time periods can be attributed to (a) variation in Tmax, Tmin and seasonal rainfall during the time periods; (b) variation in CO2 concentration; (c) variations in the interaction of elevated temperature and elevated CO2 and (d) changes in crop phenology. The mean seasonal Tmax and Tmin are projected to be higher during all four time periods as indicated by 29 GCMs (Figures 3B,C). Crops responded differently to this increase in temperature. The crop duration of rice, wheat, lentil and maize was projected to decrease and that of groundnut and mustard was projected to increase (Figure 5A). Many previous studies (Jagadish et al., 2016; Zhang et al., 2017; Guo et al., 2019), have stated that rising temperatures (both Tmax and Tmin) causes shortening of crop growth duration. In the present study, this was true for rice, wheat, lentil, and maize but not for groundnut and mustard. One possible reason for this may be the increase in projected summer rainfall, especially during end century under RCP8.5 scenario, where an increase in more than 60 mm rainfall is expected compared to the baseline average. According to a simulation study conducted by Singh et al. (2008), as the temperature rises, rain becomes the deciding factor in crop production regulation. The increase in temperature, if any, is likely to be balanced by an increase in rainfall. The results also indicated that the reduction in total crop duration of cereals (rice, wheat and maize) was mainly due to reduction in duration of the vegetative phase, leaving their reproductive phase largely unaffected (Figure 4A). The factor of largely unaffected reproductive phase along with CO2 fertilization might have increased the yield of rice and maize during future scenarios, compared to that of baseline (Figure 4B). Without considering CO2 fertilization, the yield of rice across the six cropping sequences under study will vary by −20 to +20%, −41to +25%, −15 to +26% and − 58 to +21% during mid-century-RCP4.5, mid-century-RCP-8.5, end-century-RCP4.5 and end-century-RCP8.5, respectively. The range indicates the variability in simulated yield by five selected GCMs for a particular period. But, CO2 fertilization would counteract the negative impact of elevated temperature and improve the yield of rice in all six sequences. With CO2 fertilization, the yield of rice would range by +7% to +31%, +11 to +42%, +8 to +36% and + 10 to +53% during mid-century-RCP4.5, mid-century-RCP-8.5, end-century-RCP4.5 and end-century-RCP8.5, respectively (Figure 4B). The direct effect of elevated CO2 on C3 crops include enhancement in photosynthesis rate, thus increasing crop growth rate and yield (Kimball et al., 2002). In crops like wheat, lentil and potato, CO2 fertilization would reduce the magnitude of yield reduction due to elevated temperature. Besides being a C3 crop and better response to CO2 fertilization, the increase in rice yield may also be due to higher crop residue availability from the preceding groundnut. The biomass of groundnut is projected to increase remarkably during future periods with CO2 fertilization effect (data not presented in the paper). Another reason may be the availability of higher amount of nitrogen fixed by preceding groundnut in the sequence.
When the temperature of the air rises, so does the saturation deficit, resulting in increased evaporative demand in the air and higher ET levels (Kamruzzaman et al., 2020). Nonetheless, rising CO2 levels in the atmosphere are likely to trigger a decrease in stomatal conductance, reducing canopy transpiration. Stomatal closure under elevated CO2 has a quantitatively greater effect in decreasing transpiration levels than rising transpiration rates due to the effects of increasing temperature. On the other hand, an increase in temperature reduces the length of the growing period by hastening the physiological maturity of crops. Reduction in crop duration could be a reason for the lower seasonal ET of crops (Rahman et al., 2018).
In our study, a reduction in total crop duration is simulated for lentil, potato, wheat, maize and rice. The results indicated that the seasonal ETa of all the crops, except rice, mustard and groundnut is projected to decrease during the future periods. This reduction in seasonal ETa can be attributed to a reduction in total crop duration due to a rise in temperature. For mustard and groundnut, an increase in total crop duration is simulated during future periods, which could result in higher seasonal ETa. The reason for lowest ETa by rice–mustard–fallow under all the time periods is obvious due to the fallow period.
In Rice–lentil–groundnut, both lentil and groundnut are nitrogen fixers. Due to this reason, Rice–lentil–groundnut fixed highest amount of nitrogen among all cropping sequences studied. In all other sequences, only groundnut was the n-fixer. The nitrogen thus fixed was carried over to the next crop in the sequence. Since, rice of a particular year was followed by groundnut in the preceding year, it might have benefitted due to carry over effect in all the cropping sequences, except in rice–mustard–fallow. The beneficial effects of CO2 enrichment are largely attributed to increased nodule mass and numbers as well as stimulated nodule activity, all of which contribute to higher whole-plant nitrogen contents. Carbon allocation to roots and nodules of symbiotic nitrogen-fixing plants is stimulated by increased CO2, which increases sugar concentrations in nodules and root starch concentrations (Allen et al., 1988; Thomas et al., 2000; Cabrerizo et al., 2001).
Multi-criteria decision methods (MCDM) help to select and prioritize choices by organizing relevant information and evaluating alternatives. TOPSIS, a popular MCDM, was selected in this study to rank the cropping sequences for sustainability due to some of its advantages. The TOPSIS method is a practical and useful technique for ranking and selecting alternatives. It provides a scalar value that accounts for the best and worst alternatives ability to measure the relative performance for each alternative in a simple mathematical form. Also, it has a clear logic that represent the rationale of human choice. In the present study, TOPSIS could rank the cropping sequences under different periods based on sustainability. The temporal change in sustainability of a particular cropping sequence was also revealed. Another aspect is the weights assigned for the criteria that defined sustainability. There are mainly two approaches for assigning weights viz., direct weightage and weightage by analytic hierarchy process (AHP). Some of the previous studies have reported the superior performance of TOPSIS when AHP-derived weights were used (Qureshi and Rachid, 2022). In the present study also, the weightage was derived using AHP, which makes the methodology robust. However, like all MCDMs, TOPSIS requires human recognitions as source of information, where uncertainty and subjective aspects exist. The relative importance of one criterion over other can vary from person to person. Another problem attributable to TOPSIS is the rank reversal. It is a phenomenon where an alternative’s order of preference changes when a new alternative is added or an existing alternative is removed from the decision problem (García-Cascales and Lamata, 2012). Though in this study we have not attempted to add or delete any alternatives, the researchers need to exercise caution while adding or removing alternatives.
Crops are grown for three seasons continuously in a year in the Lower Gangetic Plain. But climate change poses a great threat to this intensive cropping system. Implementation of TOPSIS for evaluating the crop sequences made it possible to provide different weights to the criteria considered (yield, ETa and nitrogen fixed). The three parameters considered for defining sustainability in crop production ensures higher produce and return for the farmer, less dependence on irrigation sources and increase in soil nitrogen content. We believe that these parameters ensure sustainable crop production in an area, considering the limitation to include multiple parameters as sustainability metrics, which are not available in crop models. Higher weightage was given to yield, followed by ETa as yield (and thereby returns) is the most important parameter deciding crop selection by the farmers. Among ETa and nitrogen fixed, farmers will always opt for crop with less water requirement, as it reduces input cost. A direct benefit of higher nitrogen fixing sequence may be the reduced dependence on nitrogen fertilizer.
This approach has helped to compare the performance of six crop sequences during baseline and four future scenarios and the most sustainable sequences were identified. The impact of projected climate during mid-century and end-century under RCP4.5 and RCP8.5 on these crop sequences were quantified. A shift from Rice–lentil–groundnut to rice–wheat–groundnut is suggested during end century under RCP4.5 and 8.5 scenarios. This is because, the yield reduction for lentil in Rice–lentil–groundnut sequence is relatively higher than that of wheat in rice–wheat–groundnut sequence. Since, the crop price (used for calculating rice equivalent yield) of lentil is much higher than that of wheat, a slight reduction in yield will also affect the sustainability metric of Rice–lentil–groundnut sequence. From farmers’ point of view, marketing of the produce from the rice–wheat–groundnut cropping sequence may not be a problem as regulated markets are functional in the study region and minimum support price is available for wheat. However, they may require higher dose of nitrogen fertilizer as wheat is replacing lentil, a nitrogen fixing crop. The result also suggests the next best alternative, if a farmer cannot opt for a particular crop sequence.
Over the Lower Gangetic Plain of India, for the first time, we have evaluated the sustainability of major cropping sequences under projected climate by combining CMIP-5 GCM ensemble, long-term crop modelling and multi-criteria decision aid. Weighted average ensemble yield, total seasonal ETa and nitrogen fixed were considered as the key parameters for evaluating sustainability. Under all the time periods, Rice–lentil–groundnut had the highest weighted average ensemble yield, followed by rice–wheat–groundnut in the study area. In the case of ETa for the whole cropping sequence, the rice–mustard–fallow sequence recorded the lowest ETa, with an average ETa of 526 mm, across the five time periods. Rice–lentil–groundnut recorded the highest (mean of 1,166 mm), followed by rice–wheat–groundnut (1,112 mm). Since Rice–lentil–groundnut was the only cropping sequence with two legumes, it fixed the highest amount of nitrogen (average of 353 kg N ha−1), followed by rice–maize–groundnut (248 kg N ha−1) and rice–wheat–groundnut (241 kg N ha−1) under all the time periods. Rice–lentil–groundnut was the most sustainable cropping sequence during baseline, followed by rice–wheat–groundnut. During mid-century also (under both RCP4.5 and 8.5), the Rice–lentil–groundnut sequence will be the most sustainable cropping sequence. But, during the end-century, the rice–wheat–groundnut sequence will be the most sustainable cropping sequence, followed by Rice–lentil–groundnut under both RCP4.5 and 8.5 for the new alluvial zone of West Bengal. The third best alternative cropping sequence will be rice–maize–groundnut during all the four future scenarios considered in the study.
The original contributions presented in the study are included in the article/Supplementary material, further inquiries can be directed to the corresponding authors.
MC and SA: conceptualization and writing—original draft. MC: methodology and visualization. VV: investigation. AM, AH, AL and MS: data curation. AM, MN, AL, MS and AH: writing—review and editing. All authors contributed to the article and approved the submitted version.
This research was funded by Department of Agricultural Meteorology and Physics, Bidhan Chandra Krishi Viswavidyalaya, Mohanpur, Nadia, West Bengal, India-741252 and the Researchers Supporting Project number (RSP2023R347), King Saud University, Riyadh, Saudi Arabia.
The authors of this study are very much thankful to Department of Agricultural Meteorology and Physics, Bidhan Chandra Krishi Viswavidyalaya, Mohanpur, Nadia, West Bengal, India-741252 to provide all the necessary funds and facilities to conduct this study. The authors would like to extend their sincere appreciation to the Researchers Supporting Project number (RSP2023R347), King Saud University, Riyadh, Saudi Arabia.
The authors declare that the research was conducted in the absence of any commercial or financial relationships that could be construed as a potential conflict of interest.
All claims expressed in this article are solely those of the authors and do not necessarily represent those of their affiliated organizations, or those of the publisher, the editors and the reviewers. Any product that may be evaluated in this article, or claim that may be made by its manufacturer, is not guaranteed or endorsed by the publisher.
The Supplementary material for this article can be found online at: https://www.frontiersin.org/articles/10.3389/fsufs.2023.1208283/full#supplementary-material
AgMIP. (2013). Guide for running AgMIP climate scenario generation tools with R in windows Version 2.3. Available at: http://www.agmip.org/wp-content/uploads/2013/10/Guide-for-Running-AgMIP-Climate-Scenario-Generation-with-R-v2.3.pdf.
AgMIP (2012). Guide for regional integrated assessments: Handbook of methods and procedures, Version 4.2. AgMIP. Available at: http://www.agmip.org/wp-content/uploads/2013/06/AgMIP-Regional-Research-Team-Handbook-v4.2.pdf
Allen, L. H., Vu, J. C. V., Valle, R. R., Boote, K. J., and Jones, P. H. (1988). Nonstructural carbohydrates and nitrogen of soybean grown under carbon-dioxide enrichment. Crop Sci. 28, 84–94. doi: 10.2135/cropsci1988.0011183X002800010020x
Cabrerizo, P. M., Gonzalez, E. M., Aparicio-Tejo, P. M., and Arrese-Igor, C. (2001). Continuous CO2 enrichment leads to increased nodule biomass, carbon availability to nodules and activity of carbon-metabolizing enzymes but does not enhance specific nitrogen fixation in pea. Physiol. Plant. 113, 33–40. doi: 10.1034/j.1399-3054.2001.1130105.x
Chandran, M. A. S., Banerjee, S., Mukherjee, A., Nanda, M. K., Mondal, S., and Kumari, V. V. (2021). Evaluating the impact of projected climate on rice–wheat-groundnut cropping sequence in lower Gangetic plains of India: a study using multiple GCMs, DSSAT model, and long-term sequence analysis. Theor. Appl. Climatol. 145, 1243–1258. doi: 10.1007/s00704-021-03700-2
Chandran, M. A. S., Banerjee, S., Mukherjee, A., Nanda, M. K., Mondal, S., and Kumari, V. V. (2022). Evaluating the long-term impact of projected climate on rice-lentil-groundnut cropping system in Lower Gangetic Plain of India using crop simulation modelling. Int. J. Biomet. 66, 55–69. doi: 10.1007/s00484-021-02189-8
García-Cascales, M. S., and Lamata, M. T. (2012). On rank reversal and TOPSIS method. Math. Comput. Model. 56, 123–132. doi: 10.1016/j.mcm.2011.12.022
Ghosh, K. G. (2018). Analysis of rainfall trends and its spatial patterns during the last century over the Gangetic West Bengal, eastern India. J geovis spat anal 2:15. doi: 10.1007/s41651-018-0022-x
Guo, Y., Wu, W., Du, M., Liu, X., Wang, J., and Bryant, C. R. (2019). Modeling climate change impacts on Rice growth and yield under global warming of 1.5 and 2.0°C in the Pearl River Delta, China. Atmosphere 10:567. doi: 10.3390/atmos10100567
IPCC (2007). “Climate change 2007: impacts, adaptation and vulnerability” in Contribution of Working Group II to the Fourth Assessment Report of the Intergovernmental Panel On Climate Change (Cambridge: Cambridge University Press)
IPCC (2022). “Summary for policymakers” in Climate Change 2022: Impacts, Adaptation, and Vulnerability. Contribution of Working Group II to the Sixth Assessment Report of the Intergovernmental Panel on Climate Change. eds. H.-O. Pörtner, D. C. Roberts, E. S. Poloczanska, K. Mintenbeck, M. Tignor, and A. Alegría, et al. (Cambridge: Cambridge University Press)
Jagadish, S. V. K., Bahuguna, R. N., Djanaguiraman, M., Gamuyao, R., Vara Prasad, P. V., and Craufurd, P. Q. (2016). Implications of high temperature and elevated CO2 on flowering time in plants. Front. Plant Sci. 7:913. doi: 10.3389/fpls.2016.00913
Jamieson, P. D., Porter, J. R., and Wilson, D. R. (1991). A test of the computer simulation model ARCWHEAT1 on wheat crops grown in New Zealand. Field Crops Res. 27, 337–350. doi: 10.1016/0378-4290(91)90040-3
Jones, J. W., Antle, J. M., Basso, B. O., Boote, K. J., Conant, R. T., Foster, I., et al. (2017). Brief history of agricultural systems modeling. Agric. Syst. 155, 240–254. doi: 10.1016/j.agsy.2016.05.014
Jones, J. W., He, J., Boote, K. J., Wilkens, P., Porter, C. H., and Hu, Z. (2011). “Estimating DSSAT cropping system cultivar-specific parameters using Bayesian techniques” in Methods of Introducing System Models into Agricultural Research. eds. L. R. Ahuja and L. Ma, 365–394.
Jones, J. W., Hoogenboom, G., Porter, C. H., Boote, K. J., Batchelor, W. D., Hunt, L. A., et al. (2003). DSSAT cropping system model. Eur. J. Agron. 18, 235–265. doi: 10.1016/S1161-0301(02)00107-7
Kamruzzaman, M., Hwang, S., Choi, S. K., Cho, J., Song, I., Song, J. H., et al. (2020). Evaluating the impact of climate change on Paddy water balance using APEX-Paddy model. Water 12:852. doi: 10.3390/w12030852
Keating, B. A., Carberry, P. S., Hammer, G. L., Probert, M. E., Robertson, M. J., Holzworth, D., et al. (2003). An overview of APSIM, a model designed for farming systems simulation. Eur. J. Agron. 18, 267–288. doi: 10.1016/S1161-0301(02)00108-9
Kimball, B. A., Kobayashi, K., and Bindi, M. (2002). Responses of agricultural crops to free-air CO2 enrichment. Adv. Agron. 77, 293–368. doi: 10.1016/S0065-2113(02)77017-X
Kobryń, A., and Prystrom, J. (2016). A data pre-processing model for the TOPSIS method. Folia Oecon. Stetin. 16, 219–235.
Kollas, C., Kersebaum, K. C., Nendel, C., Manevski, K., Müller, C., Palosuo, T., et al. (2015). Crop rotation modelling—a European model intercomparison. Eur. J. Agron. 70, 98–111. doi: 10.1016/j.eja.2015.06.007
Krishnan, R., Sanjay, J., Gnanaseelan, C., Mujumdar, M., Kulkarni, A., and Chakraborty, S. (2020). Assessment of climate change over the Indian region: A report of the Ministry of Earth Sciences. Springer: Springer Nature Singapore Pte Ltd, 152.
Lin, B. B. (2011). Resilience in agriculture through crop diversification: adaptive management for environmental change. Bioscience 61, 183–193. doi: 10.1525/bio.2011.61.3.4
Matthews, K. B., Buchan, K., Sibbald, A. R., and Craw, S. (2006). Combining deliberative and computer-based methods for multi-objective land use planning. J. Agric. Syst. 87, 18–37. doi: 10.1016/j.agsy.2004.11.002
Nouri, M., Homaee, M., Bannayan, M., and Hoogenboom, G. (2017). Towards shifting planting date as an adaptation practice for rainfed wheat response to climate change. Agric. Water Manag. 186, 108–119. doi: 10.1016/j.agwat.2017.03.004
Olesen, J. E., and Bindi, E. M. (2002). Consequences of climate change for European agricultural productivity, land use and policy. Eur. J. Agron. 16, 239–262. doi: 10.1016/S1161-0301(02)00004-7
Olesen, J. E., Trnka, M., Kersebaum, K. C., Skjelvag, A. O., Seguin, B., Peltonen-Sainio, P., et al. (2011). Impacts and adaptation of European crop production systems to climate change. Eur. J. Agron. 34, 96–112. doi: 10.1016/j.eja.2010.11.003
Palosuo, T., Kersebaum, K. C., Angulo, C., Hlavinka, P., Moriondo, M., Olesen, J. E., et al. (2011). Simulation of winter wheat yield and its variability in different climates of Europe: a comparison of eight crop growth models. Eur. J. Agron. 35, 103–114. doi: 10.1016/j.eja.2011.05.001
Parry, M. L., Rosenzweig, C., Iglesias, A., Livermore, M., and Fischer, G. (2004). Effects of climate change on global food production under SRES emissions and socio-economic scenarios. Glob. Environ. Chang. 14, 53–67. doi: 10.1016/j.gloenvcha.2003.10.008
Qureshi, A. M., and Rachid, A. (2022). Comparative analysis of multi-criteria decision-making techniques for outdoor heat stress mitigation. Appl. Sci. 12:12308. doi: 10.3390/app122312308
Rahman, M. H., Ahmad, A., Wang, X., Wajid, A., Nasim, W., Hussain, M., et al. (2018). Multi-model projections of future climate and climate change impacts uncertainty assessment for cotton production in Pakistan. Agric. For. Meteorol. 253-254, 94–113. doi: 10.1016/j.agrformet.2018.02.008
Reidsma, P., Ewert, F., Boogaard, H., and van Diepen, K. (2009). Regional crop modelling in Europe: the impact of climatic conditions and farm characteristics on maize yields. Agric. Syst. 100, 51–60. doi: 10.1016/j.agsy.2008.12.009
Rötter, R. P., Palosuo, T., Kersebaum, K. C., Angulo, C., Bindi, M., Ewert, F., et al. (2012). Simulation of spring barley yield in different climatic zones of northern and Central Europe: a comparison of nine crop models. Field Crops Res. 133, 23–36. doi: 10.1016/j.fcr.2012.03.016
Ruane, A. C., and McDermid, S. P. (2017). Selection of a representative subset of global climate models that captures the profile of regional changes for integrated climate impacts assessment. Earth Perspectives 4:1. doi: 10.1186/s40322-017-0036-4
Ruane, A. C., Winter, J. M., McDermid, S. P., and Hudson, N. I. (2015). “AgMIP climate data and scenarios for integrated assessment” in Handbook of Climate Change and Agroecosystems: The Agricultural Model Intercomparison and Improvement Project (AgMIP). eds. C. Rosenzweig and D. Hillel, ICP Series on Climate Change Impacts, Adaptation, and Mitigation (London: Imperial College Press), 45–78.
Singh, A. K., Tripathy, R., and Chopra, U. K. (2008). Evaluation of CERES-wheat and CropSyst models for water–nitrogen interactions in wheat crop. Agric. Water Manag. 95, 776–786. doi: 10.1016/j.agwat.2008.02.006
Smith, R. G., Gross, K. L., and Robertson, G. P. (2008). Effects of crop diversity on agro ecosystem function: crop yield response. Ecosystems 11, 355–366. doi: 10.1007/s10021-008-9124-5
Soler, C.M.T., Sentelhas, P.C., and Hoogenboom, G. (2007). Application of the CSM-CERES-maize model for planting date evaluation and yield forecasting for maize grown off-season in a subtropical environment. Eur. J. Agron 27, 165–177.
Supraja, S., and Kousalya, P. (2016). A comparative study by AHP and TOPSIS for the selection of all-round excellence award. In 2016 International Conference on Electrical, Electronics, and Optimization Techniques (ICEEOT), pp. 314–319.
Teixeira, E. I., Brown, H. E., Sharp, J. M., Meenken, E. D., and Ewert, F. (2015). Evaluating methods to simulate crop rotations for climate impact assessments—a case study on the Canterbury plains of New Zealand. Environ. Model. Softw. 72, 304–313. doi: 10.1016/j.envsoft.2015.05.012
Thomas, R. B., Bashkin, M. A., and Richter, D. D. (2000). Nitrogen inhibition of nodulation and N2 fixation of a tropical N2-fixing tree (Gliricidia sepium) grown in elevated atmospheric CO2. New Phytol. 145, 233–243. doi: 10.1046/j.1469-8137.2000.00577.x
Tsuji, G. Y., Jones, J. W., Hoogenboom, G., Hunt, L. A., and Thornton, P. K. (1994). “Introduction” in DSSAT v3, Decision Support System for Agrotechnology Transfer. eds. G. Y. Tsuji, G. Uehara, and S. Balas (Honolulu, HI: University of Hawaii), 1–20.
Videla-Mensegue, H., Caviglia, O. P., Degioanni, A., Marcos, J., and Bonadeo, E. (2021). Modelling water productivity for ecological intensification of crop sequences in the inner Argentinean pampas. Field Crops Res. 271:108246. doi: 10.1016/j.fcr.2021.108246
Waongo, M., Laux, P., and Kunstmann, H. (2015). Adaptation to climate change: the impacts of optimized planting dates on attainable maize yields under rainfed conditions in Burkina Faso. Agric. For. Meteorol. 205, 23–39. doi: 10.1016/j.agrformet.2015.02.006
Keywords: crop sequence modelling, GCMS, weighted average ensemble, sustainability, TOPSIS, yield, N-fixed, crop water requirement
Citation: Chandran MAS, Banerjee S, Mukherjee A, Nanda MK, Venugopalan VK, Laing AM, Siddiqui MH and Hossain A (2023) Coupling crop simulation modelling and multi-criteria decision aid for ranking the sustainability of cropping sequences. Front. Sustain. Food Syst. 7:1208283. doi: 10.3389/fsufs.2023.1208283
Edited by:
Siyabusa Mkuhlani, International Institute of Tropical Agriculture (IITA), KenyaReviewed by:
Tony Carr, London School of Hygiene and Tropical Medicine, University of London, United KingdomCopyright © 2023 Chandran, Banerjee, Mukherjee, Nanda, Venugopalan, Laing, Siddiqui and Hossain. This is an open-access article distributed under the terms of the Creative Commons Attribution License (CC BY). The use, distribution or reproduction in other forums is permitted, provided the original author(s) and the copyright owner(s) are credited and that the original publication in this journal is cited, in accordance with accepted academic practice. No use, distribution or reproduction is permitted which does not comply with these terms.
*Correspondence: Malamal Alickal Sarath Chandran, c2FyYXRoYWdyaUBnbWFpbC5jb20=; Akbar Hossain, YWtiYXJob3NzYWlud3JjQGdtYWlsLmNvbQ==
Disclaimer: All claims expressed in this article are solely those of the authors and do not necessarily represent those of their affiliated organizations, or those of the publisher, the editors and the reviewers. Any product that may be evaluated in this article or claim that may be made by its manufacturer is not guaranteed or endorsed by the publisher.
Research integrity at Frontiers
Learn more about the work of our research integrity team to safeguard the quality of each article we publish.