 Monique Soro1,2,3,4*
 Justin S. Pita1,2
 Koussao Somé3,4,5
 Daniel H. Otron1,2Edwige Yéo1,2
 J. Musembi Mutuku1James B. Néya3,4
 Fidèle Tiendrébéogo1,3,4*Daouda Koné2,6
- 1Central and West African Virus Epidemiology (WAVE) for Food Security Program, Pôle Scientifique et d’Innovation, Université Félix Houphouët-Boigny (UFHB), Abidjan, Côte d’Ivoire
- 2Laboratoire de Biotechnologie, Agriculture et Valorisation des Ressources Biologiques, UFR Biosciences, Université Félix Houphouët-Boigny, Abidjan, Côte d’Ivoire
- 3Laboratoire de Virologie et de Biotechnologies Végétales, Institut de l’Environnement et de Recherches Agricoles (INERA), Ouagadougou, Burkina Faso
- 4Laboratoire Mixte International Patho-Bios, IRD-INERA, Ouagadougou, Burkina Faso
- 5Laboratoire de Génétique et de Biotechnologies Végétales, Institut de l’Environnement et de Recherches Agricoles (INERA), Ouagadougou, Burkina Faso
- 6Centre d’Excellence Africain sur le Changement Climatique, la Biodiversité et l’Agriculture Durable (WASCAL/CEA-CCBAD, Université Félix Houphouët-Boigny), PSI-Université Félix Houphouët-Boigny, Abidjan, Côte d’Ivoire
Cassava adaptation to climate change and its resistance to diseases are essential prerequisites for achieving food security in sub-Saharan Africa. The accessions collected from farmers’ fields are very important because they can provide new sources of genetic variability that are essential to achieve this goal. In this study, a panel of 184 accessions collected in Burkina Faso was genotyped using 36 single nucleotide polymorphism (SNP) markers. The accessions and markers that presented with more than 6% missing data were removed from the dataset and the remaining 34 markers and 166 accessions were retained for genetic diversity and population structure assessment. The average values of expected heterozygosity (0.46), observed heterozygosity (0.58), and polymorphic information content (0.36) indicated high genetic diversity within accessions. A complex genetic structure of 166 accessions was observed through the formation of 17 clusters using discriminant analysis of principal components (DAPC) and two clusters using Bayesian analysis. Out of the 166 accessions, 79 were unique multilocus genotypes (MLGs) and 87 were potentially duplicates. From the 79 MLGs, DAPC suggested eight clusters while the Bayesian analysis suggested seven clusters. Clusters shaped by DAPC appeared to be more consistent with a higher probability of assignment of the accessions within the clusters. Principal Coordinate Analysis (PCoA) showed a lack of clustering according to geographical origin. Information related to breeding patterns and geographic origin did not allow for a clear differentiation between the clusters according to the analysis of molecular variance (AMOVA). The results of this study will be useful for cassava germplasm conservation and breeding programs.
1. Introduction
Cassava (Manihot esculenta Crantz, Family: Euphorbiaceae) is a staple food in most of the tropical regions of Africa, Asia, and Latin America (Zinga et al., 2016). It originated in the northern Amazonian basin (Olsen and Schaal, 1999; Léotard et al., 2009) and was introduced by the Portuguese to the African continent during the sixteenth century (Fauquet and Fargette, 1990). The global production of cassava was estimated to be 302.7 million tons in 2020. West Africa’s production was 100.6 million tons, in the same year, representing more than 33.2% of the world’s production of cassava (FAOSTAT, 2022). Cassava is an allogamous species propagated predominantly by cuttings (Elias et al., 2001; Oliveira et al., 2014). The genetic diversity studies in the genus Manihot seemed to support a single event of domestication from the wild form M. esculenta ssp. flabellifolia (Roa et al., 1997; Olsen and Schaal, 1999, 2001). The cassava hybrids resulting from interspecific crosses involving cassava and wild Manihot species can be highly fertile (Second et al., 1997; Nassar, 1999). In addition, interbreeding between different cassava genotypes within and between fields is common, and the seeds produced may fall and germinate, leading to an increase in the genetic diversity of cassava (Elias et al., 2001). Some studies reported the presence of a high diversity of accessions in farmers’ fields due to in situ conservation and the exchange of planting materials between farmers (Park et al., 2005). This high genetic diversity could be used to develop new varieties with drought-tolerant, disease-resistant, high-quality, and high-yield attributes (Oliveira et al., 2014). However, through the exchange of planting materials between farmers, the same accessions are often given different names, or conversely, different accessions are given the same name, resulting in the existence of duplicate accessions collected in different localities (Salick and Cellinese, 1997; Rao et al., 2002). The costs of cassava germplasm maintenance are relatively high because the plants are kept in the field and/or in vitro (Albuquerque et al., 2019). Therefore, it is important to conduct studies aimed at identifying duplicate accessions in order to optimize the physical storage space both in the laboratory and in the field and to reduce the cost of maintaining the collection (Van Treuren and Van Hintum, 2003). Identification of genetic diversity in cassava germplasm has been already done using biochemical markers (Lefèvre and Charrier, 1993), quantitative and qualitative descriptors (Kawuki et al., 2011; Kamanda et al., 2020), and molecular markers such as microsatellites (Tiago et al., 2017; Adjebeng-Danquah et al., 2020) and the single nucleotide polymorphism (SNP; Oliveira et al., 2014; de Albuquerque et al., 2018; Prempeh et al., 2020). Most of the morphological descriptors, especially the quantitative ones, are not very reliable due to the strong influence of genotype-environment interaction (Al-Fares and Abu-Qaoud, 2012). Molecular markers are stable, easily detectable, and not influenced by the environment (Asare et al., 2011; Mezette et al., 2013). Among the molecular markers, SNPs seemed to have attracted research attention because of their genome abundance, chromosome-specific localization, low mutation rate, and ease of automation (Mammadov et al., 2012). SNP markers are used in genomic selection studies (Oliveira et al., 2012; Wolfe et al., 2016), the identification of sources of disease resistance by marker-assisted selection (Carmo et al., 2015), the identification of duplicate accessions (Albuquerque et al., 2019) and the characterization of germplasm (Oliveira et al., 2014; Mtunguja et al., 2015; Tiago et al., 2017; de Albuquerque et al., 2018; Prempeh et al., 2020).
Cassava was introduced to Burkina Faso from some neighboring countries (Ghana and Côte d’Ivoire) and has long been considered a neglected crop (Guira et al., 2017). In recent years, cassava production has increased through many government initiatives including the introduction of improved varieties in 2013 by the International Institute of Tropical Agriculture (IITA). However, despite these efforts, cassava production in Burkina Faso is relatively low compared to the demand. Indeed, the demand for cassava was estimated to be 124,917 tons in 2017 with the annual production estimated to be 22,104 tons (MAAH, 2019). This might be due to the use of susceptible varieties to pests and diseases, but also the high sensitivity to harsh environmental conditions (Akinwale et al., 2011). It may then be necessary to develop new varieties that are resistant to diseases and better adapted to these environments. Any progress made in breeding programs depends on a better understanding of the genetic variability present in the existing population (Adjebeng-Danquah et al., 2016). Unfortunately, since the introduction (formally or informally) of cassava accessions to Burkina Faso until today, no study on their genetic diversity has yet been conducted using molecular markers. The aim of this study was to assess the genetic diversity of cassava grown in Burkina Faso and to identify duplicate accessions in order to provide breeding programs with unique genotypes and reduce the conservation costs of cassava germplasm in the field and in vitro.
2. Materials and methods
2.1. Plant material
In 2017, a total of 164 accessions from seven major cassava-growing regions of Burkina Faso (Figure 1), 13 genotypes from seed germination at the Institut de l’Environnement et de Recherches Agricoles (INERA, Burkina Faso) located in Centre region, and 7 cassava varieties from the International Institute of Tropical Agriculture (IITA) were used for this study. In each field, cassava accessions were collected on the basis of their morphological differences (apical leaves color, petiole color, leaf color, number of leaf lobes, and leaf vein color). All the accessions that have been collected are maintained at the INERA station in Kamboinsé. The global positioning system (GPS) coordinates have been recorded for each location where cassava cuttings were collected. We decided to consider the cassava varieties from IITA as accessions. One cutting (20 cm) per accession was grown in a pot containing an autoclaved mixed media (two measures of soil, one measure of sand, and one measure of organic manure) for 1 month to obtain fully expanded leaves. Leaves from each cassava accession were sampled using the BioArk Leaf sample collection kit1 and sent to LGC Biosearch Technologies, UK, for DNA extraction and genotyping. The collection and shipment of the samples were carried out according to the LGC company protocol.2
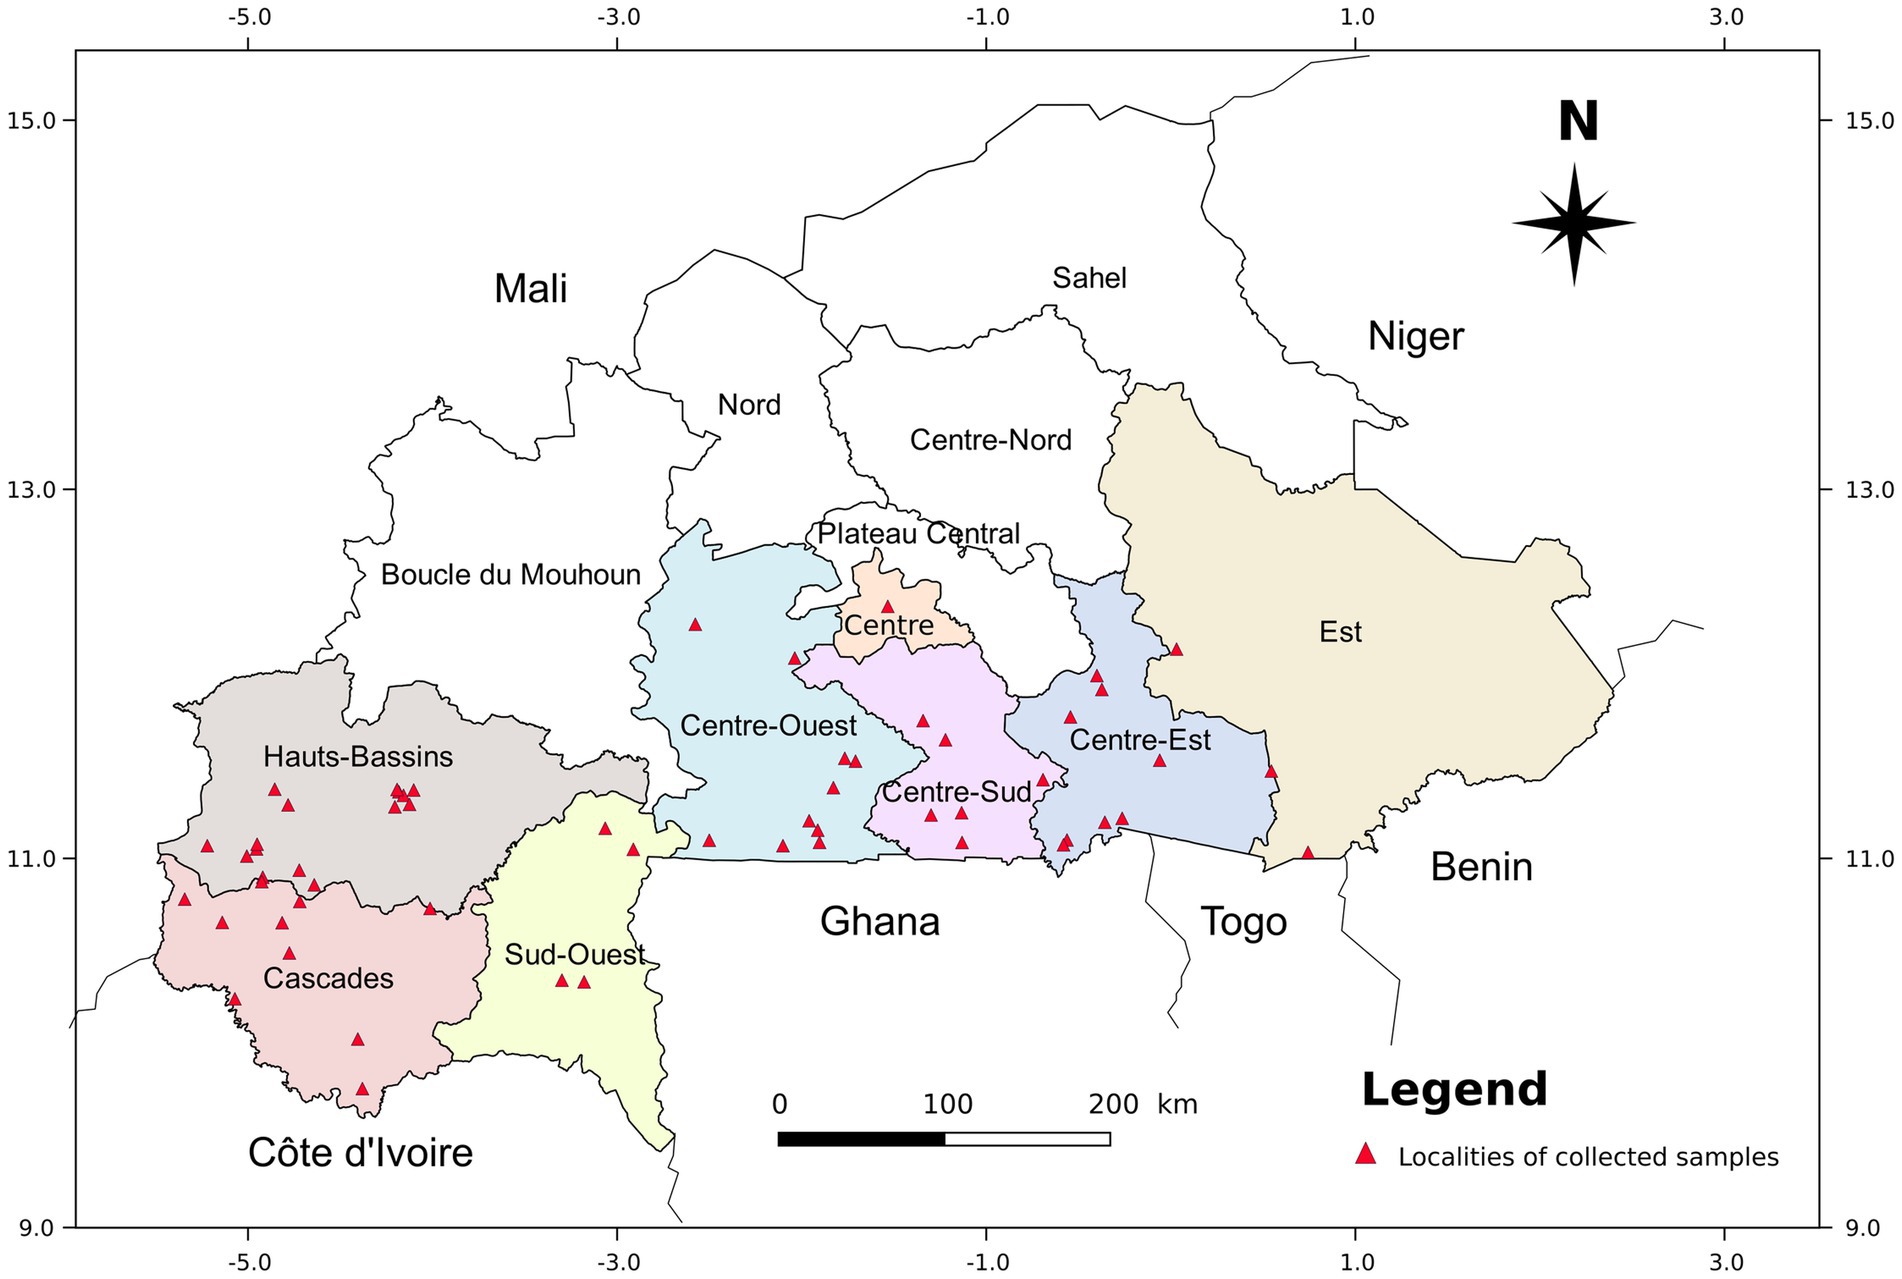
Figure 1. Map of Burkina Faso showing the regions and localities where cassava cuttings were collected.
2.2. SNPs markers selection
A total of 36 single nucleotide polymorphism (SNP) markers (Supplementary Table S1) were used for genotyping the 184 cassava accessions. These markers were selected from a list of markers identified by Ferguson et al. (2012) from the expressed sequence tag (EST) databases. Markers were selected based on their position on the cassava genome (to cover all 18 chromosomes) and their polymorphic information content (PIC) value. All the markers selected from the SNP markers identification and validation study conducted by Ferguson et al. (2012) had PIC values greater than 0.365. Kompetitive allele-specific PCR—polymerase chain reaction—(KASP) primers were designed for each SNP by LGC Biosearch Technologies, UK.
2.3. DNA extraction and genotyping
Total genomic DNA was extracted from cassava leaves using LGC’s sbeadex™ DNA extraction, and SNP genotyping was performed using KASP™ genotyping assays.3 DNA extraction and genotyping were performed at LGC Biosearch.4
2.4. Analysis of genetic diversity
The missing data percentage of each SNP marker and cassava accession was calculated using the function missingno in the package poppr (Kamvar, 2019) as implemented in R v. 4.0.2. Markers and accessions which had more than 6% missing data were removed from the dataset as recommended by Ferguson et al. (2019). The genotype accumulation curve was performed using the function genotype_curve in the package poppr to ensure that the remaining markers were sufficient to assess the genetic diversity of cassava accessions. The retained markers were subjected to various genetic diversity analyses such as polymorphic information content (PIC), major allele frequency (MaF), observed heterozygosity (Ho), and expected heterozygosity (He) under the Hardy–Weinberg equilibrium (HWE). PIC and MaF were obtained using PowerMarker v. 3.2.5 (Liu and Muse, 2005) while Ho and He were computed using the function basic.stats in the package hierfstat (Goudet et al., 2020) as implemented in R v. 4.0.2. Wright’s F-statistics were calculated using the package hierfstat (Goudet et al., 2020). The HWE for each locus was computed using the package pegas (Paradis, 2010).
2.5. Analysis of genetic structure
A principal coordinate analysis (PCoA) was done using the package cmdscale on a dissimilarity matrix constructed with the function vegdist in the package vegan (Oksanen et al., 2020). The Bray-Curtis method was used. The graph was generated using the function ggplot in the package ggplot2 (Villanueva and Chen, 2019). All the packages used were implemented in R v. 4.0.2.
A Ward’s minimum variance hierarchical clustering dendrogram was built using the function hclust in the package stats. The optimal number of clusters was assessed using the function best.cutree in the package JLutils (Larmarange, 2021) assuming the number of clusters to be between 1 and 20. The duplicate accessions were identified from the dendrogram on the basis of genetic distances. A threshold of 0.05 (based on the genetic distance between two representatives of the same accession) was defined as the minimum distance for considering that two genotypes were different. Any cassava accessions below this threshold were clustered into the same unique multilocus genotype (MLG). The identification of duplicates was also carried out based on the detection of MLGs using the function mlg.id in the package poppr. The same threshold was used and any cassava accessions below that were clustered into the same MLG.
The population structure was inferred using the Admixture model-based clustering algorithm as implemented in STRUCTURE v. 2.3.4 (Pritchard et al., 2000). The ad hoc number of clusters (k) varied from 1 to 20, with 50,000 burn-in steps, followed by 500,000 Markov chain Monte Carlo simulations. For each k, 15 independent iterations were implemented. The most likely number of k was determined by the ad hoc ∆k statistics (Evanno et al., 2005) embedded in Structure Harvester (Earl and vonHoldt, 2012). Accessions with membership proportions (Q-value) ≥80% were assigned to groups, while those with membership probabilities of less than 80% were designated as admixtures.
A discriminant analysis of principal components (DAPC) was carried out using the package adegenet (Jombart et al., 2010) implemented in R v. 4.0.2. The optimal number of clusters was assessed using the function find.clusters implemented in the package adegenet. The function xval.Dapc was used to assess the best number of principal components and discriminant functions use for the DAPC. DAPC was performed using the function dapc in the package adeneget and the results of DAPC were visualized using the function scatter.dapc in the package adegenet.
Analysis of molecular variance (AMOVA) was performed by decomposition of the principal components into different hierarchical levels: (a) geographical origin (Cascades, Centre, Centre-Est, Centre-Ouest, Centre-Sud, Est, Hauts-Bassins, and Sud-Ouest), (b) breeding patterns (improved variety or landrace), (c) theoretical clusters obtained according to DAPC; and (d) theoretical clusters obtained according to Bayesian analysis. These analyses were performed using the function poppr.amova in the package poppr.
3. Results
3.1. Genetic diversity parameters
The selected SNP markers were all successfully amplified except for the marker Me_MEF_c_1418. The marker Me_MEF_c_0869, which had 12% missing data, and 18 accessions with missing data between 8 and 60%, were removed from the initial dataset, leaving a final dataset consisting of 34 SNP markers and 166 accessions. The genotype accumulation curve obtained from this dataset showed that 33 markers randomly selected from the list of 34 remaining markers make it possible to identify 100% of the unique multilocus genotypes (79 accessions) present in the population of 166 accessions (Figure 2). The common genetic parameters and genetic differentiation parameters estimated for each marker are reported in Table 1. The MaF, He, Ho, FIT, FIS FST, and PIC values estimated for the 166 cassava accessions averaged 0.06, 0.46, 0.58, −0.24, −0.27, 0.03, and 0.36, respectively. For 76.47% of the loci, Ho was greater than He. FIT and FIS were below zero for 76.47 and 82.35% of loci, respectively.
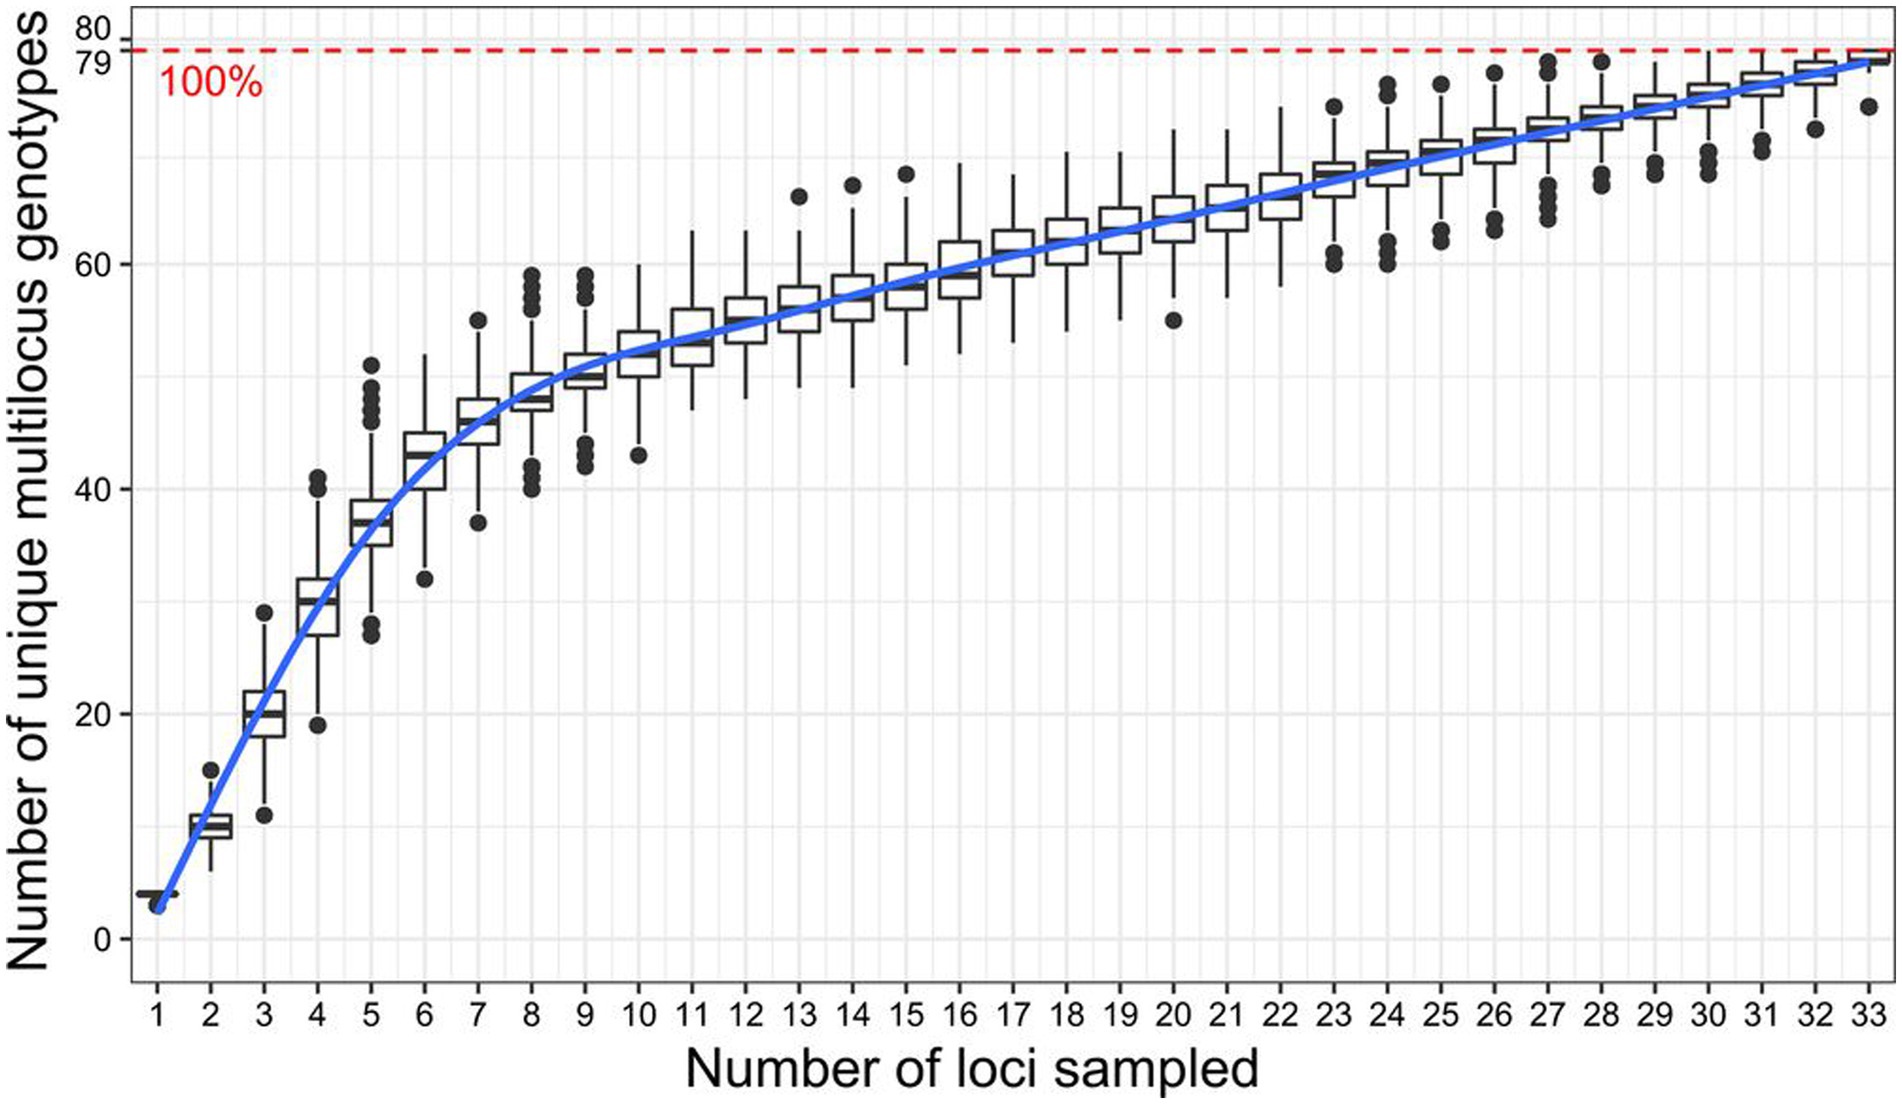
Figure 2. Genotype accumulation curve for 166 cassava accessions genotyped over 34 loci. The horizontal axis represents the number of loci randomly sampled without re-placement up to n − 1 loci, the vertical axis shows the number of unique multilocus genotypes observed. The red dashed line represents 100% of the total observed unique multilocus genotypes (79 MLGs).
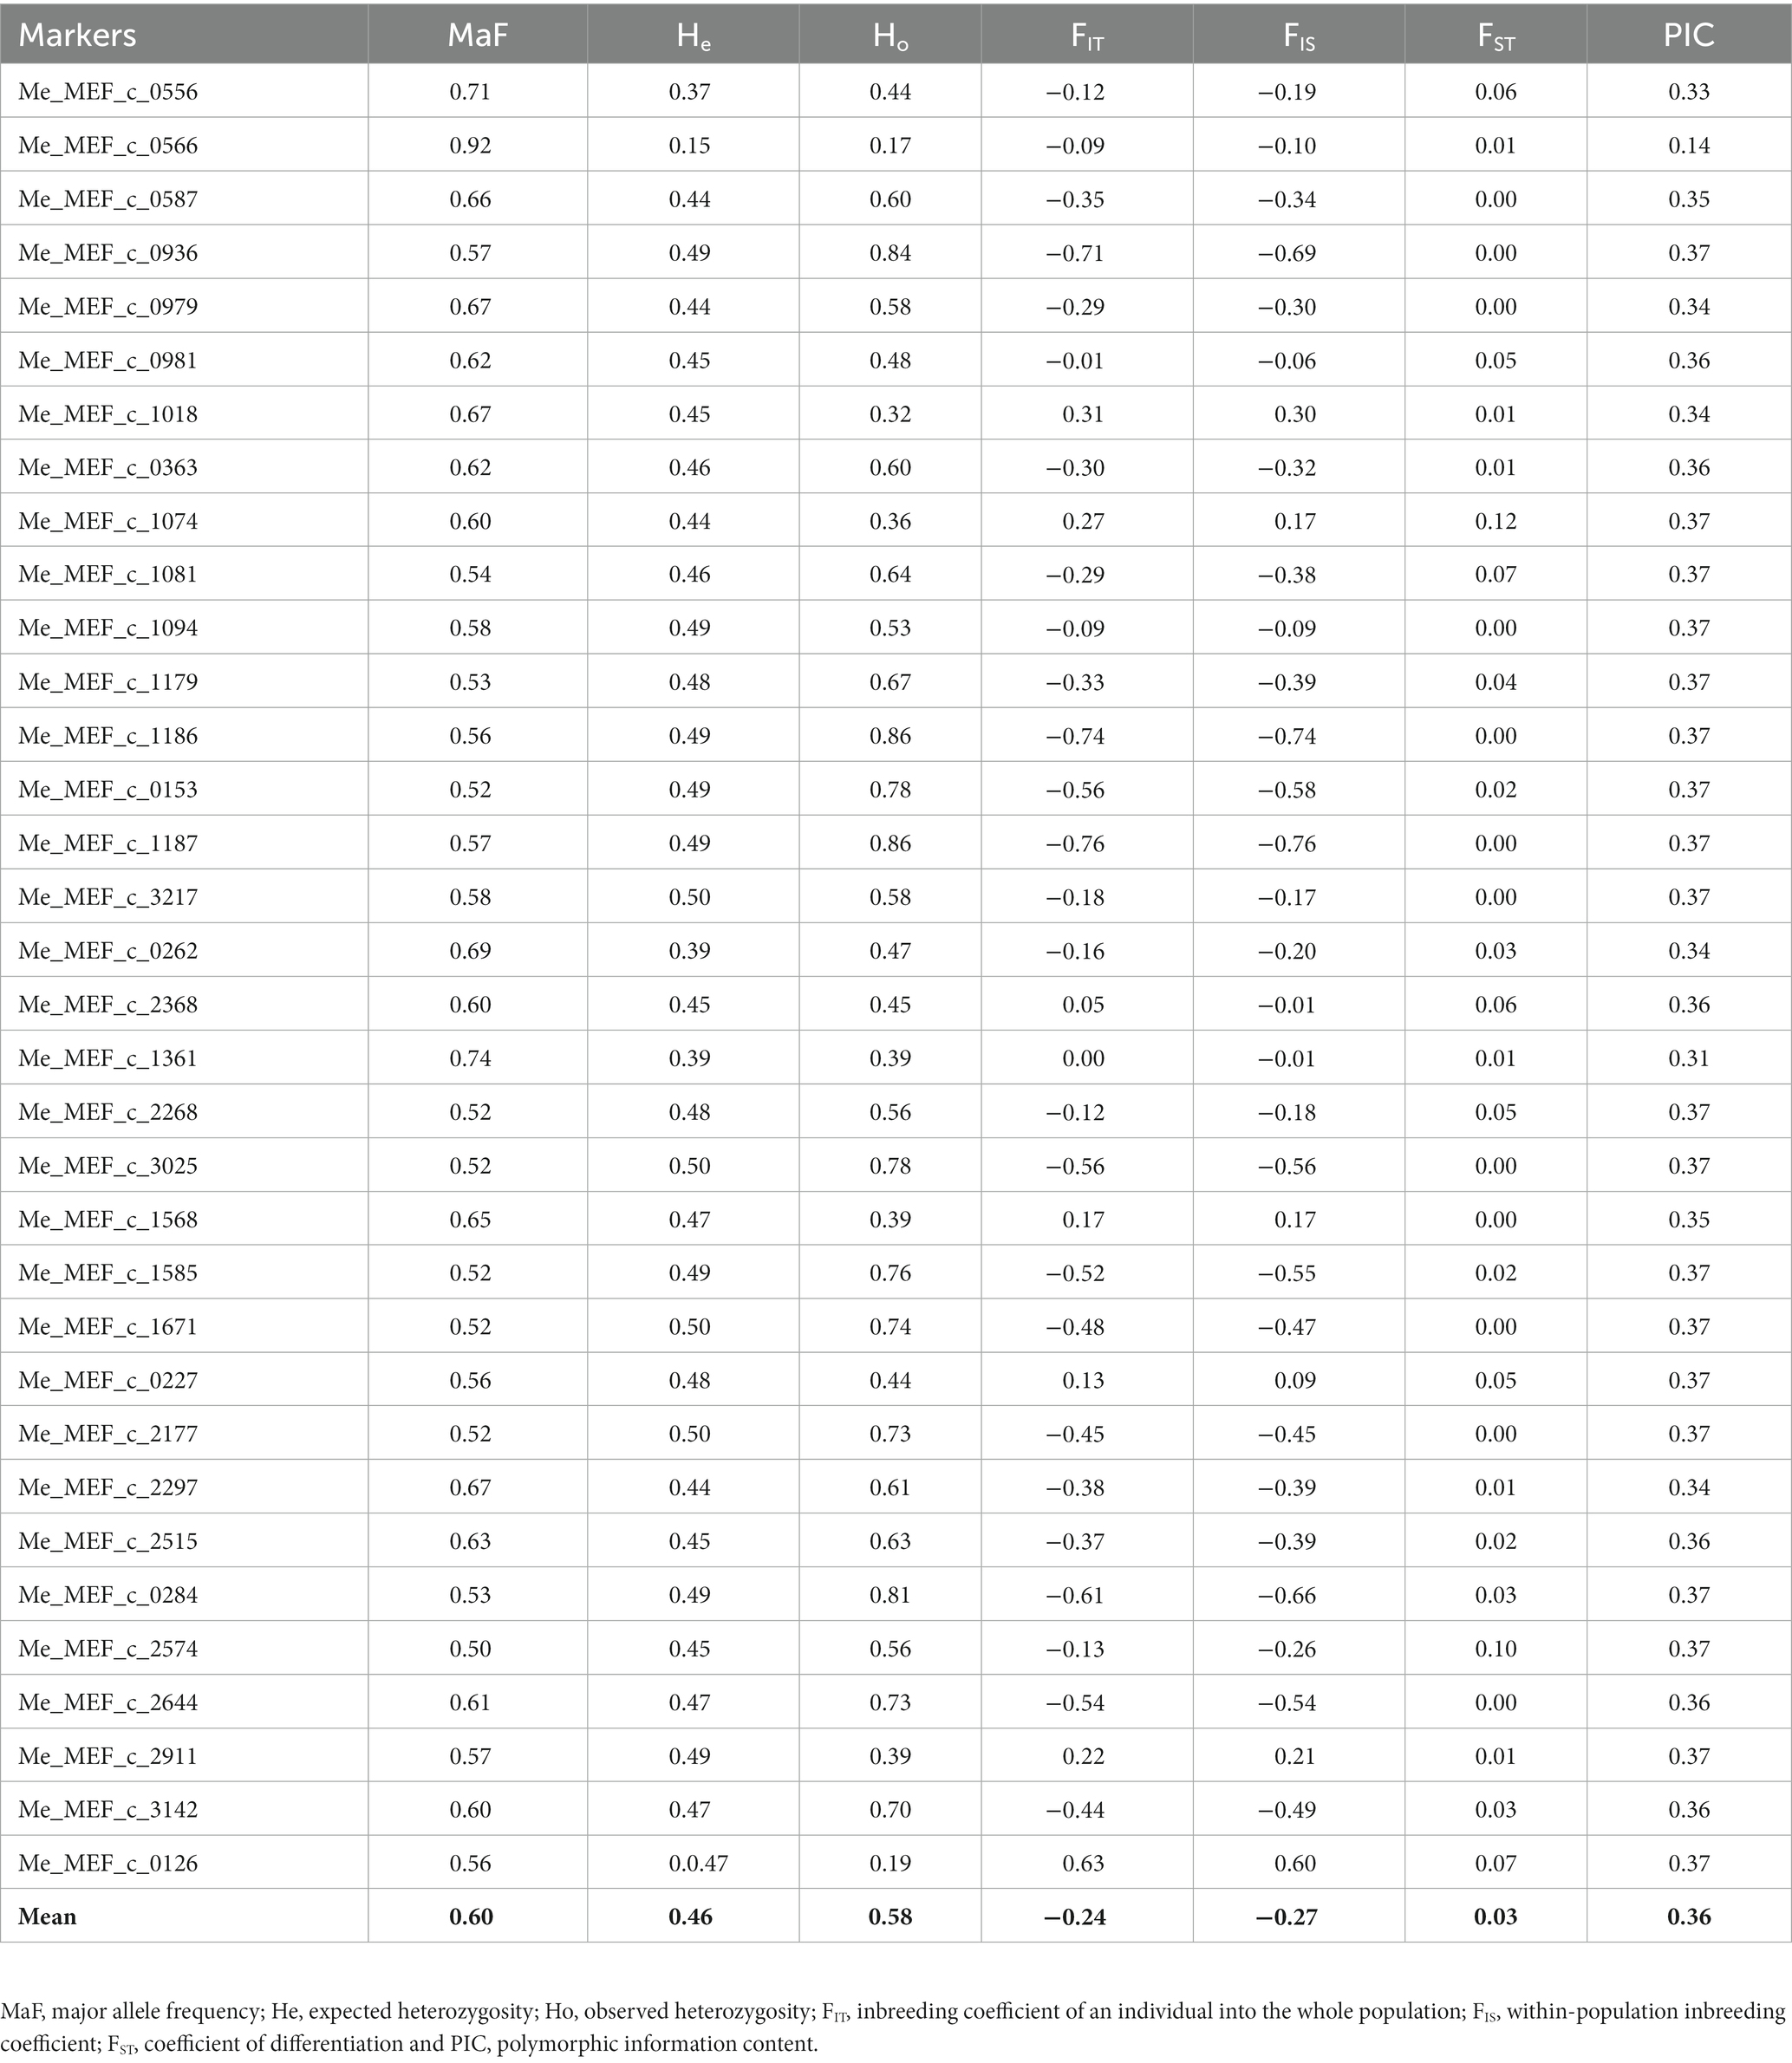
Table 1. Common genetic parameters and F-statistics for each locus.
3.2. Population structure and genetic relationships
3.2.1. Principal coordinates analysis
The principal coordinate analysis (PCoA) of the 166 cassava accessions generated a graphical representation of the relationship between the accessions based on a dissimilarity matrix calculated using the Bray-Curtis method (Figure 3). The graphical representation was made using the first two principal coordinates (Cord.1 and Cord.2). These two coordinates accounted for 48.13% of the total variation. The PCoA showed an absence of clustering cassava accessions according to their geographical origins.
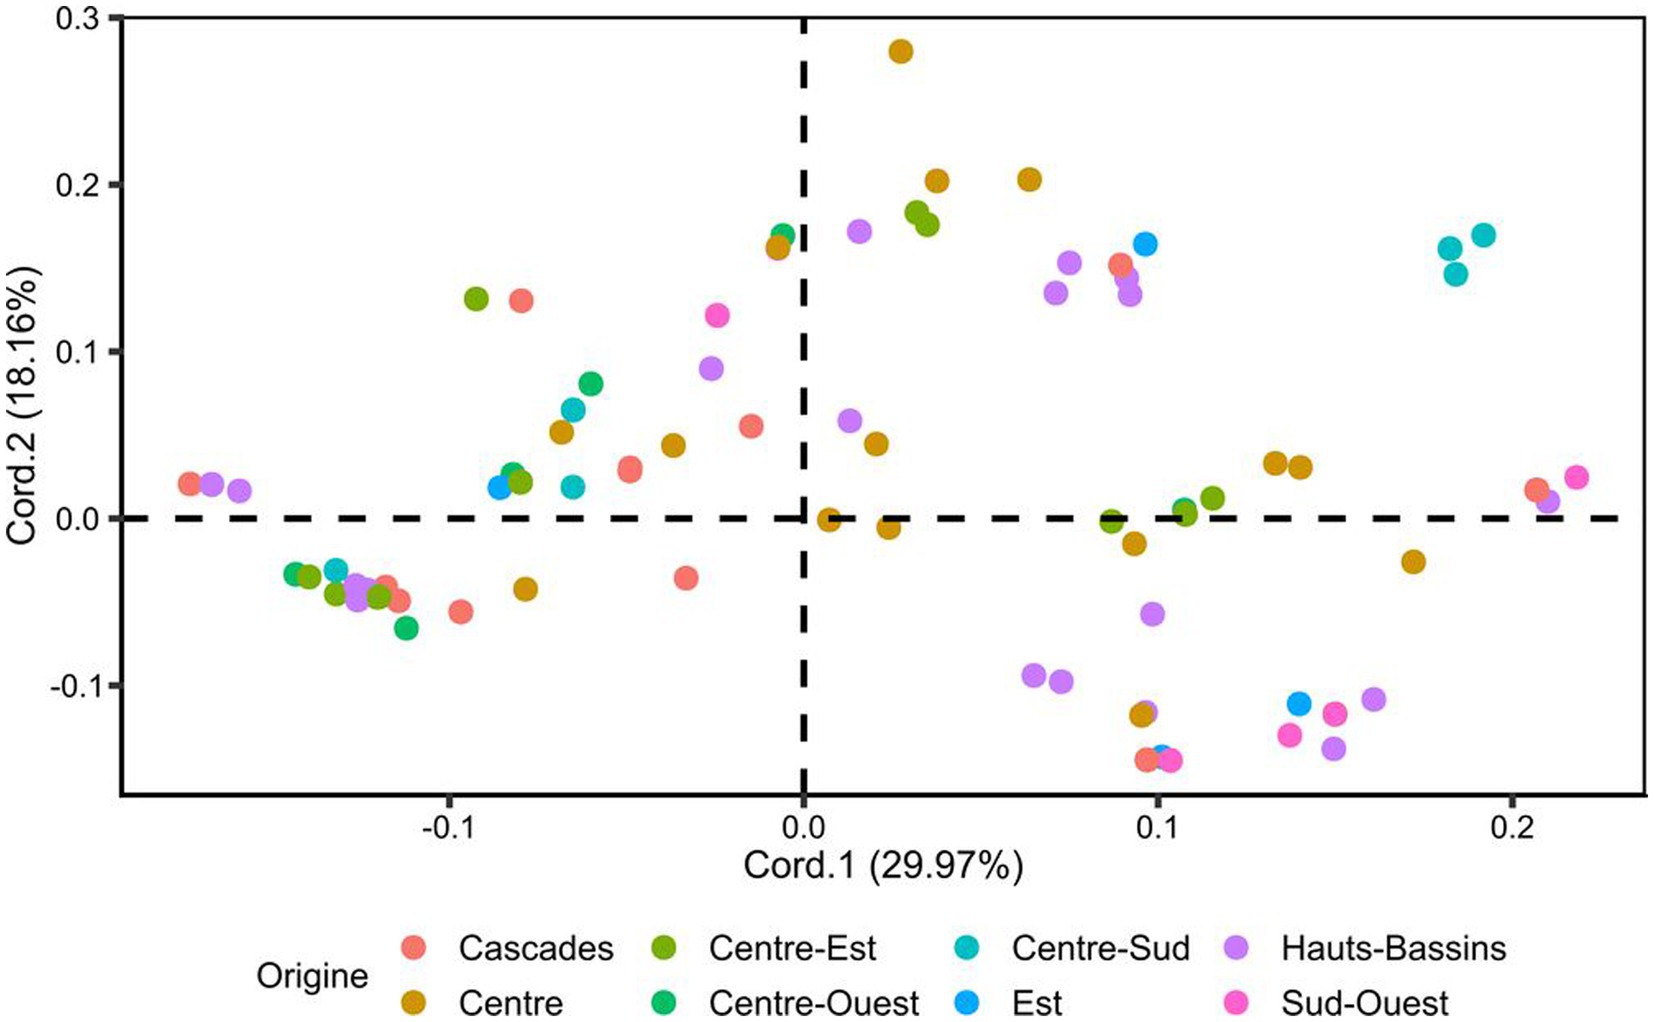
Figure 3. Principal coordinate analysis (PCoA) based on a dissimilarity matrix calculated using the Bray-Curtis method. Accessions are colored according to geographical origin.
3.2.2. Hierarchical clustering analysis and identification of potential duplicates
The Ward’s minimum variance hierarchical clustering dendrogram (Figure 4A) and optimal clusters number assessment (Figure 4B) showed that the 166 cassava accessions could be gathered into two clusters. The dendrogram revealed the presence of 87 (52.41%) potential duplicates in the dataset of 166 cassava accessions. The potential duplicates belonged to 17 unique multilocus genotypes (Figure 4A). These results were confirmed by the results of duplicate identification. The duplicate MLGs are distributed over eight regions of Burkina Faso (Figure 4C). The highest percentage of potential duplicates (70.59%) and the highest number of duplicate MLGs (10) were found in the Cascades region. The lowest percentage of potential duplicates (10.53%) was recorded in the Centre region and the lowest number of duplicate MLGs (2) was observed in the Sud-Ouest and Centre regions (Table 2). MLGs V and XIV were found only in the Cascades region, MLGs IX and XI were found only in the Hauts-Bassins region, and MLG XVI was only found in the Centre-Sud region. The other duplicate MLGs were found at least in 2 regions.
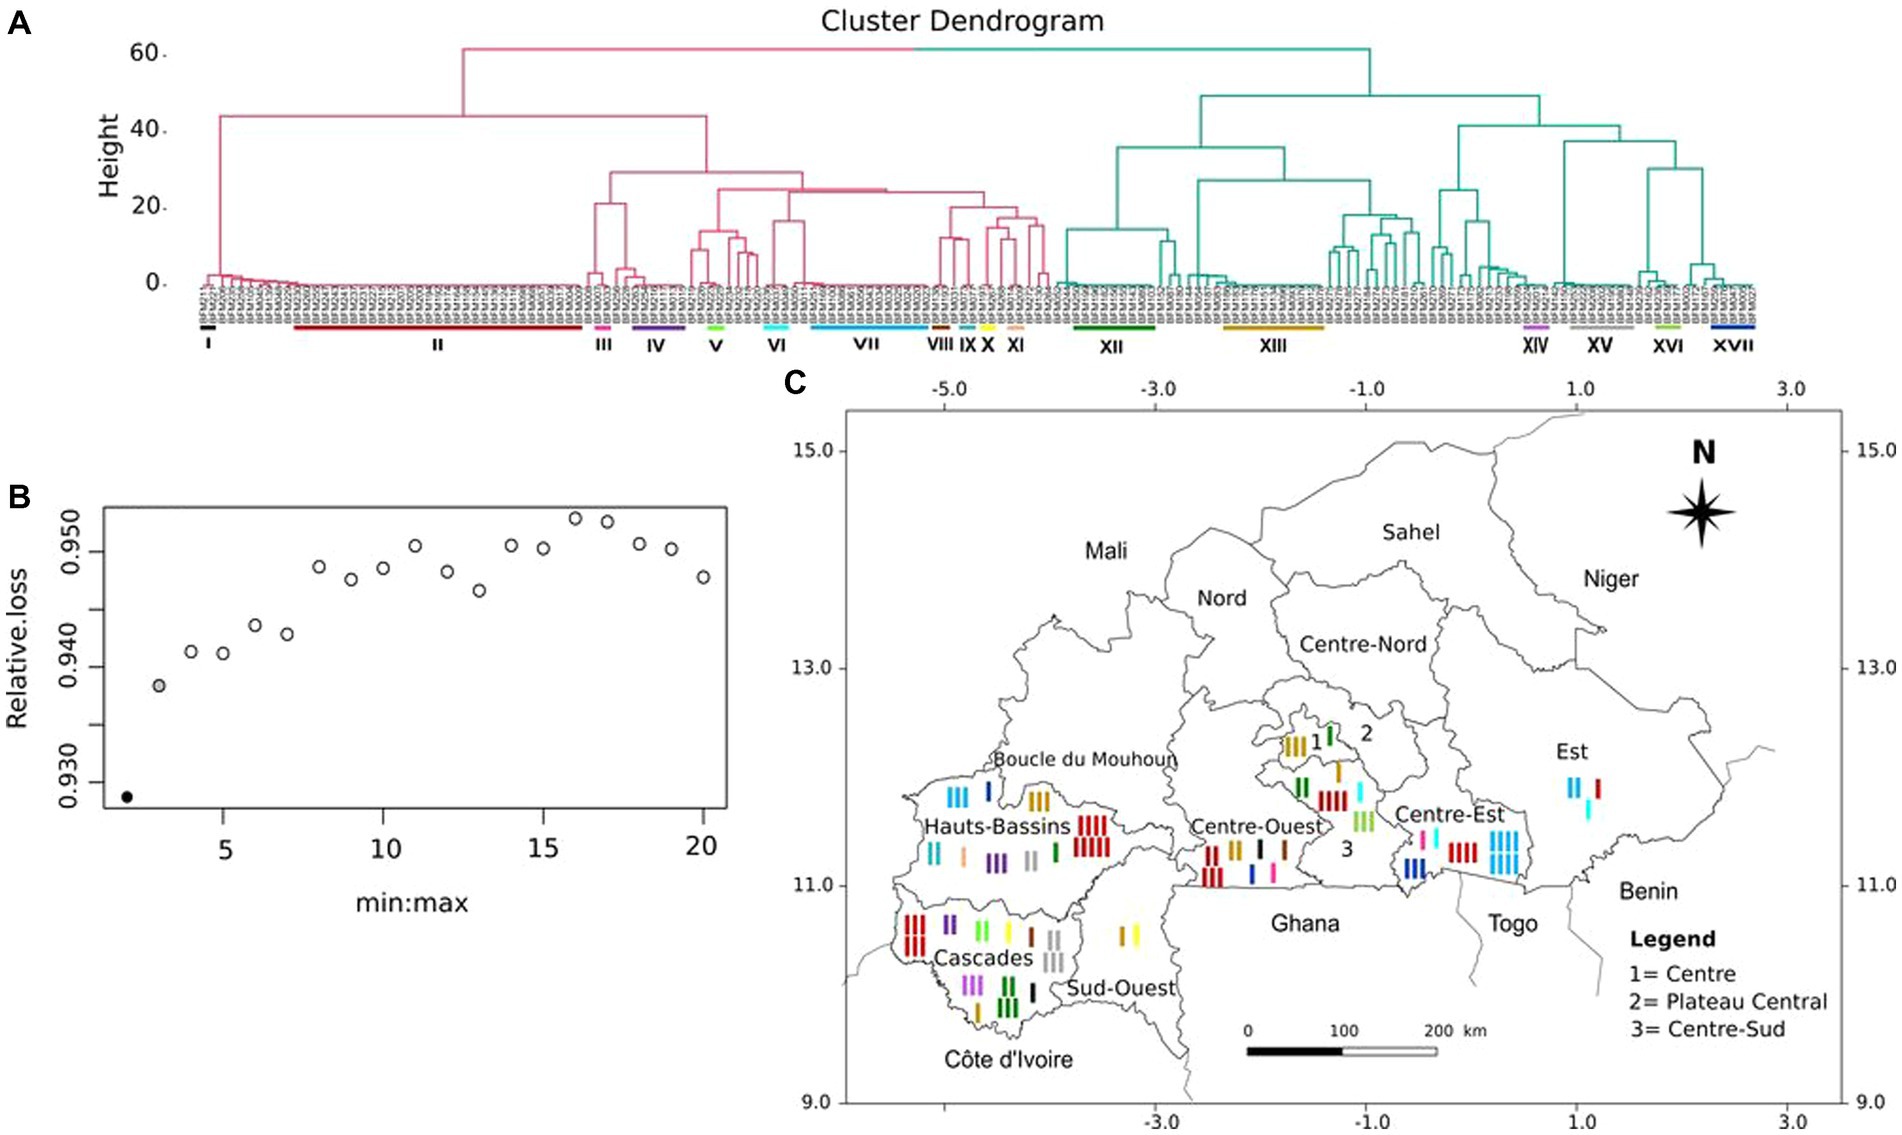
Figure 4. Hierarchical clustering of the 166 cassava accessions and geographical distribution of potential duplicates. (A) Ward’s minimum variance ascending hierarchical clustering of the 166 cassava accessions. The colored bars represent the 17 duplicate MLGs identified. (B) The black dot indicates the optimal number of clusters. (C) Distribution of duplicate MLGs in different cassava growing regions of Burkina Faso. Each color represents a duplicate MLG. For each duplicate MLG, the number of bars corresponds to the number of times the GLM has been found in the same region.
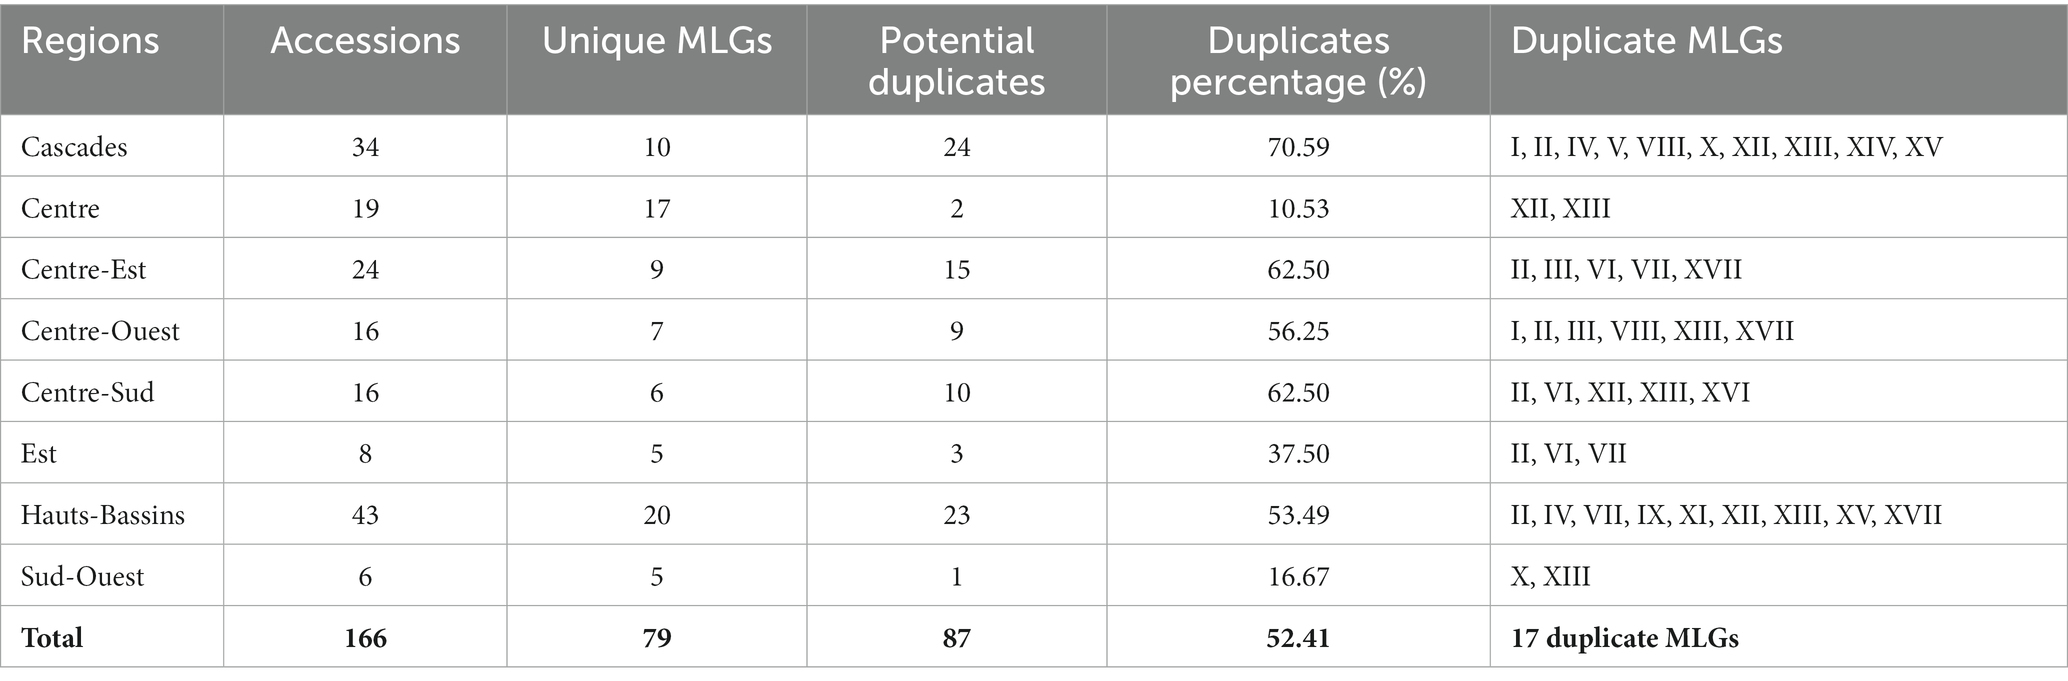
Table 2. Summary table of collected cassava accessions characteristics per region.
3.2.3. Bayesian analysis
Population structure analysis of the 166 cassava accessions based on Evanno’s method showed that the optimal number of groups that would best explain the structure of the accessions is two with a Δk of 474.94 (Figure 5). Using an 80% membership probability threshold, 118 accessions (71.08%) were successfully assigned to both groups. In contrast, 48 accessions (28.92%) with assignment probabilities less than 80% were considered admixtures (Supplementary Table S2). Fifty-two (31.33%) accessions were assigned to Group 1 with an average assignment probability of 96%. These accessions belonged to the Cascades, Centre-Est, Centre-Ouest, Centre-Sud, Est and Hauts-Bassins regions. Sixty-six accessions (39.76%) were assigned to Group 2 with an average assignment probability of 96%. The accessions of Group 2 belonged to the Cascades, Centre, Centre-Est, Centre-Ouest, Centre-Sud, Est, Hauts-Bassins, and Sud-Ouest regions. The admixtures belonged to the Cascades, Centre, Centre-Est, Centre-Ouest, Centre-Sud, Est, Hauts-Bassins, and Sud-Ouest regions.
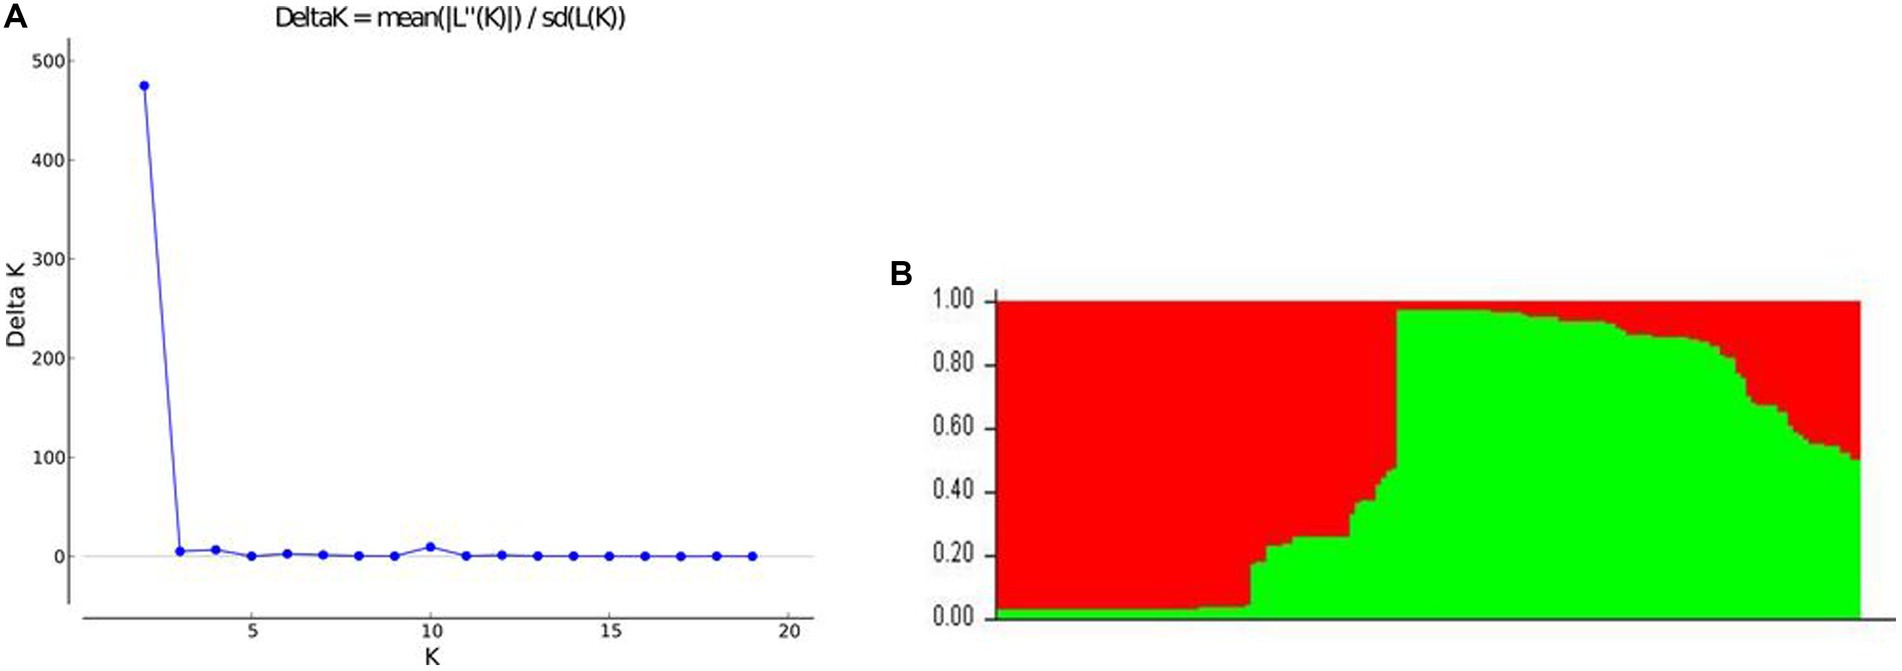
Figure 5. Graphical representation of the population structure of 166 cassava accessions. (A) Plot of mean likelihood of delta K against the number of K groups. The highest peak observed at K = 2 signifies the grouping of accessions into two groups. (B) The colors represent two groups of 166 accessions. The separation of accessions into Group 1 (red) and Group 2 (green) was based on membership probability ≥80%.
Population structure analysis of the 79 unique MLGs based on Evanno’s method showed that the seven groups would best explain the structure with a Δk of 61.51 (Figure 6). Using an 80% membership probability threshold, 60 MLGs (75.95%) were successfully assigned to seven groups. Nineteen MLGs (24.05%) with assignment probabilities less than 80% were considered admixtures (Supplementary Table S3). Group 1 consisted of seven MLGs belonging to the Centre-Est, Centre-Ouest, Centre-Sud, and Hauts-Bassins regions. Group 2 consisted of eight MLGs belonging to the Cascades, Centre-Est, Est, and Hauts-Bassins regions. Group 3 (10 MLGs) belonged to the Centre, Est, Hauts-Bassins, and Sud-Ouest regions. Groups 4 (6 MLGs) and 7 (3 MLGs) belonged to the Centre region. Group 5 (11 MLGs) belonged to the Cascades, Centre-Est, Centre-Ouest, Centre-Sud, and Hauts-Bassins regions. Group 6 (14 MLGs) belonged to the Centre-Est, Centre-Ouest, Centre-Sud, Est, and Hauts-Bassins regions. MLGs were assigned to the different groups with average assignment probabilities of 94% (Group 1), 93% (Group 2), 96% (Group 3), 93% (Group 4), 97% (Group 5), 91% (Group 6), and 93% (Group 7).
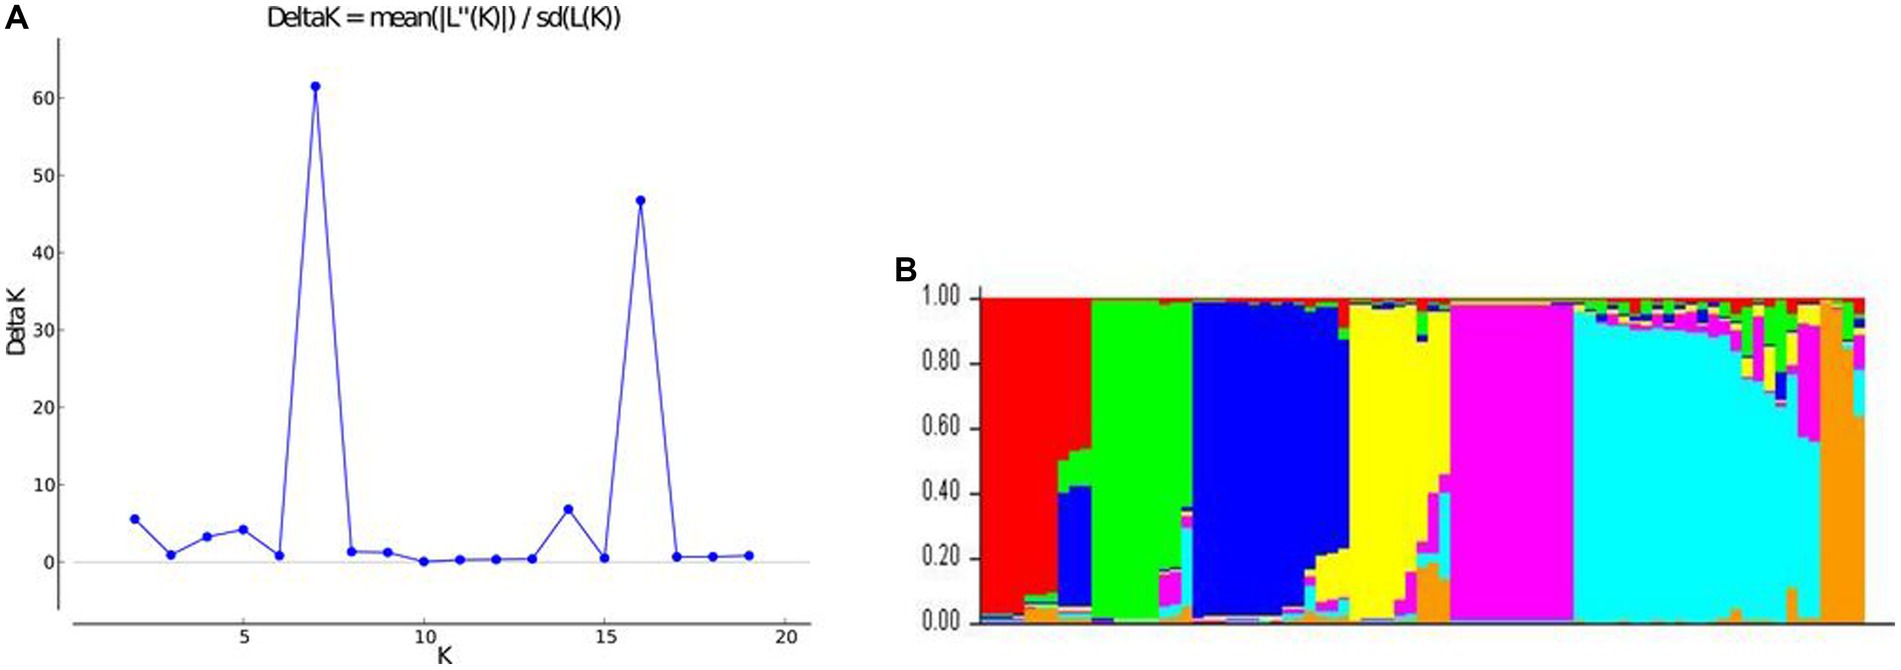
Figure 6. Graphical representation of the population structure of the 79 MLGs. (A) Plot of mean likelihood of delta k against the number of k groups. The highest peak observed at k = 7 signifies the grouping of accessions into seven groups. (B) The colors represent seven groups of 79 was based on membership probability ≥80%.
3.2.4. Discriminant analysis of principal components
The discriminant analysis of principal components was first performed using the regions as predefined groups. The first 20 principal components (PCs) (explaining 96.8% of the total variance retained by PCA) and seven discriminant functions were used for the DAPC. The first two discriminant functions explaining 62 and 14% of the total genetic variation, respectively, were used for the graphical representation of the DAPC results (Figure 7). Accessions were assigned to the different regions with average assignment probabilities of 12.5% (Est), 25.0% (Centre-Ouest), 31.2% (Centre-Sud), 50% (Sud-Ouest), 55.9% (Cascades), 66.7% (Centre-Est), 69.8% (Hauts-Bassins), and 73.7% (Centre). The HWE test performed on accessions collected in each region revealed that none of the sub-populations were at HWE (Figure 8).
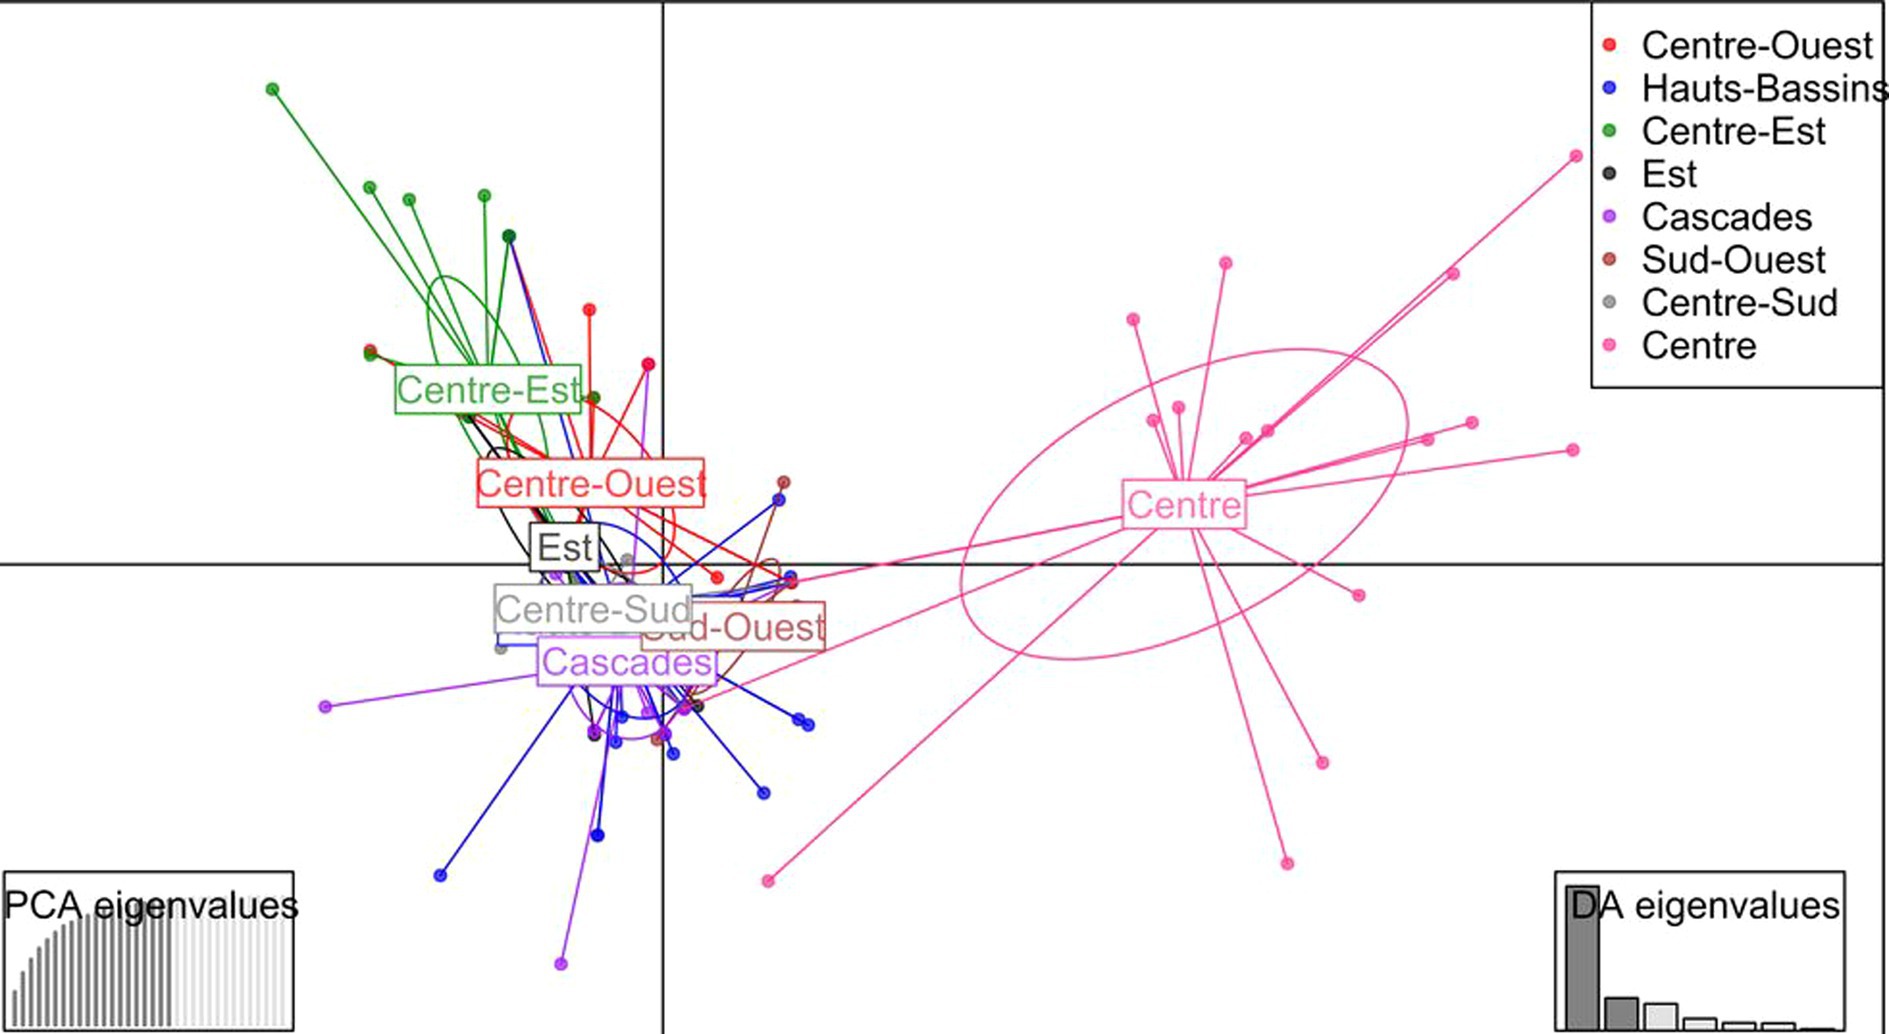
Figure 7. Discriminant analysis of principal components (DAPC) using the regions as predefined groups. The axes represent the first two discriminant functions. Each color represents a region, while each dot represents an accession.
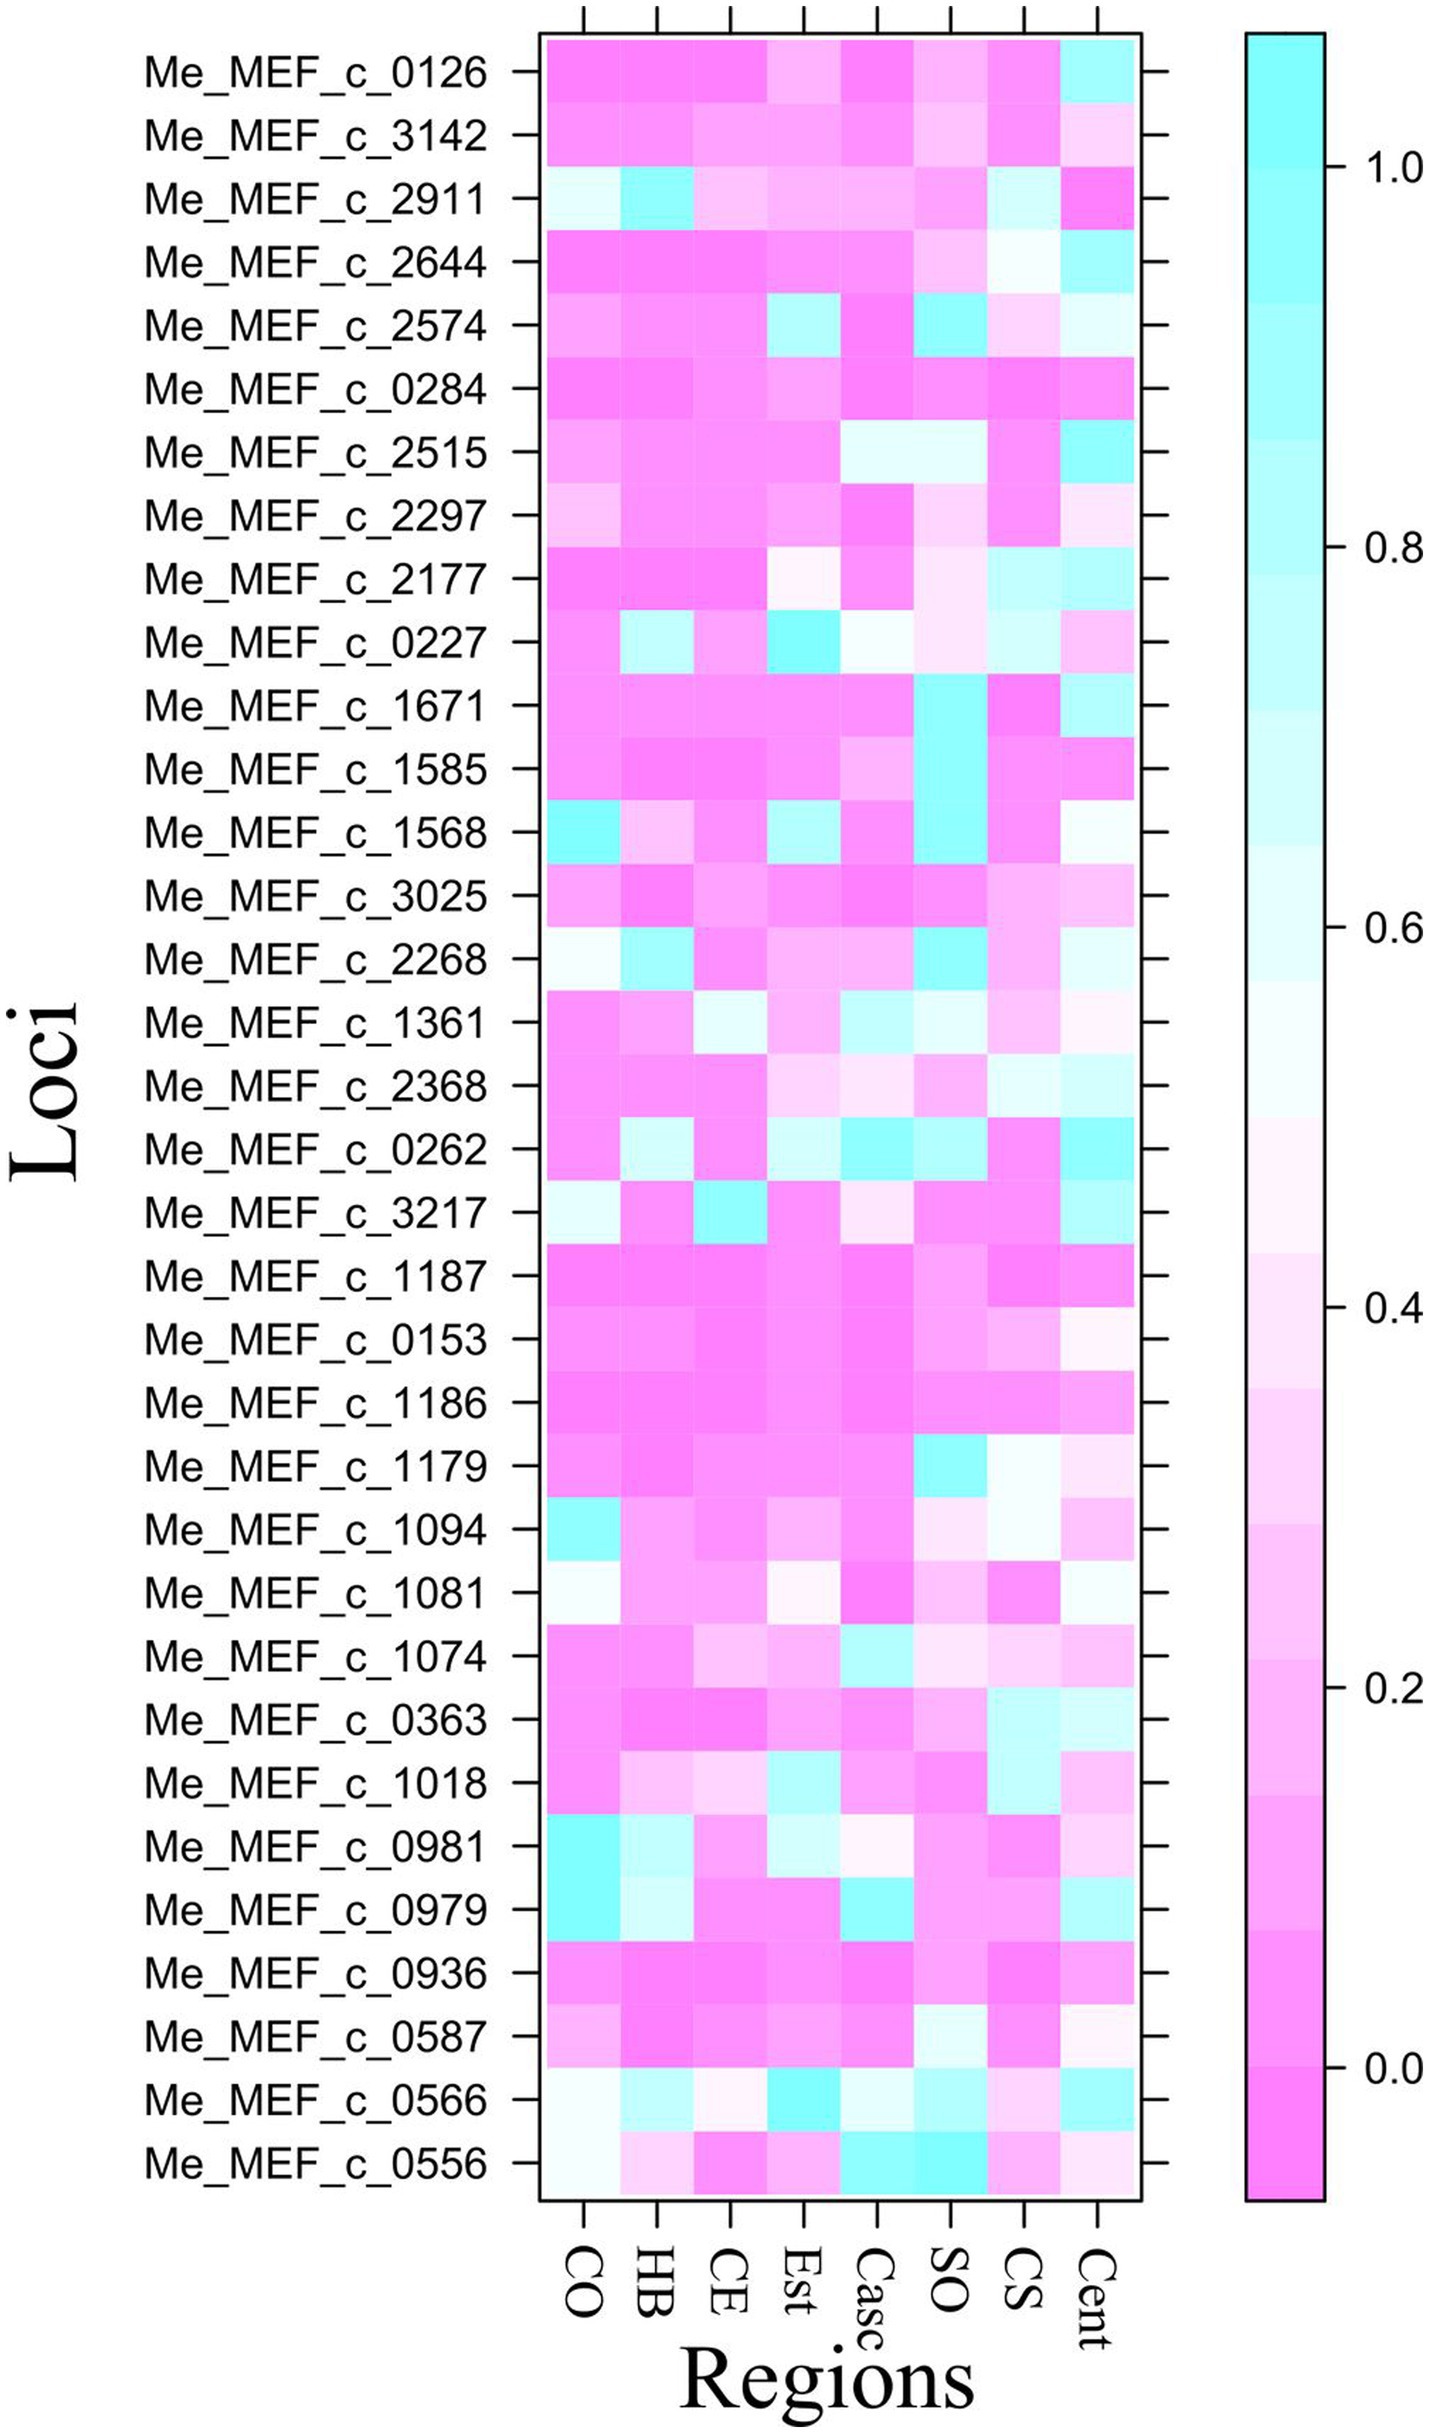
Figure 8. Graph showing significant deviations from the HWE. Each row represents a locus, and each column represents a subpopulation (CO, Centre-Ouest; HB, Hauts-Bassins; CE, Centre-Est; Casc, Cascades; SO, Sud-Ouest; CS, Centre-Sud; Cent, Centre). The presence of pink color in a column at a given locus indicates that the subpopulation is not at the HWE for that locus with a probability p ≤ 0.05.
For the 166 accessions, the lowest Bayesian Information Criterion (BIC) value (62.09) was obtained for an optimal number of 17 clusters (Figure 9A). This number of clusters was used for the DAPC. The first 10 principal components (PCs) (which explained 82.6% of the total variance retained by PCA) and 10 discriminant functions were used for the DAPC. The first two discriminant functions, which explained, respectively, 53.1 and 19.6% of the total genetic variation, were used for the graphical representation of the DAPC results (Figure 9B). Accessions were assigned to each of the 17 clusters with an individual assignment probability of 100% (Figure 9C).
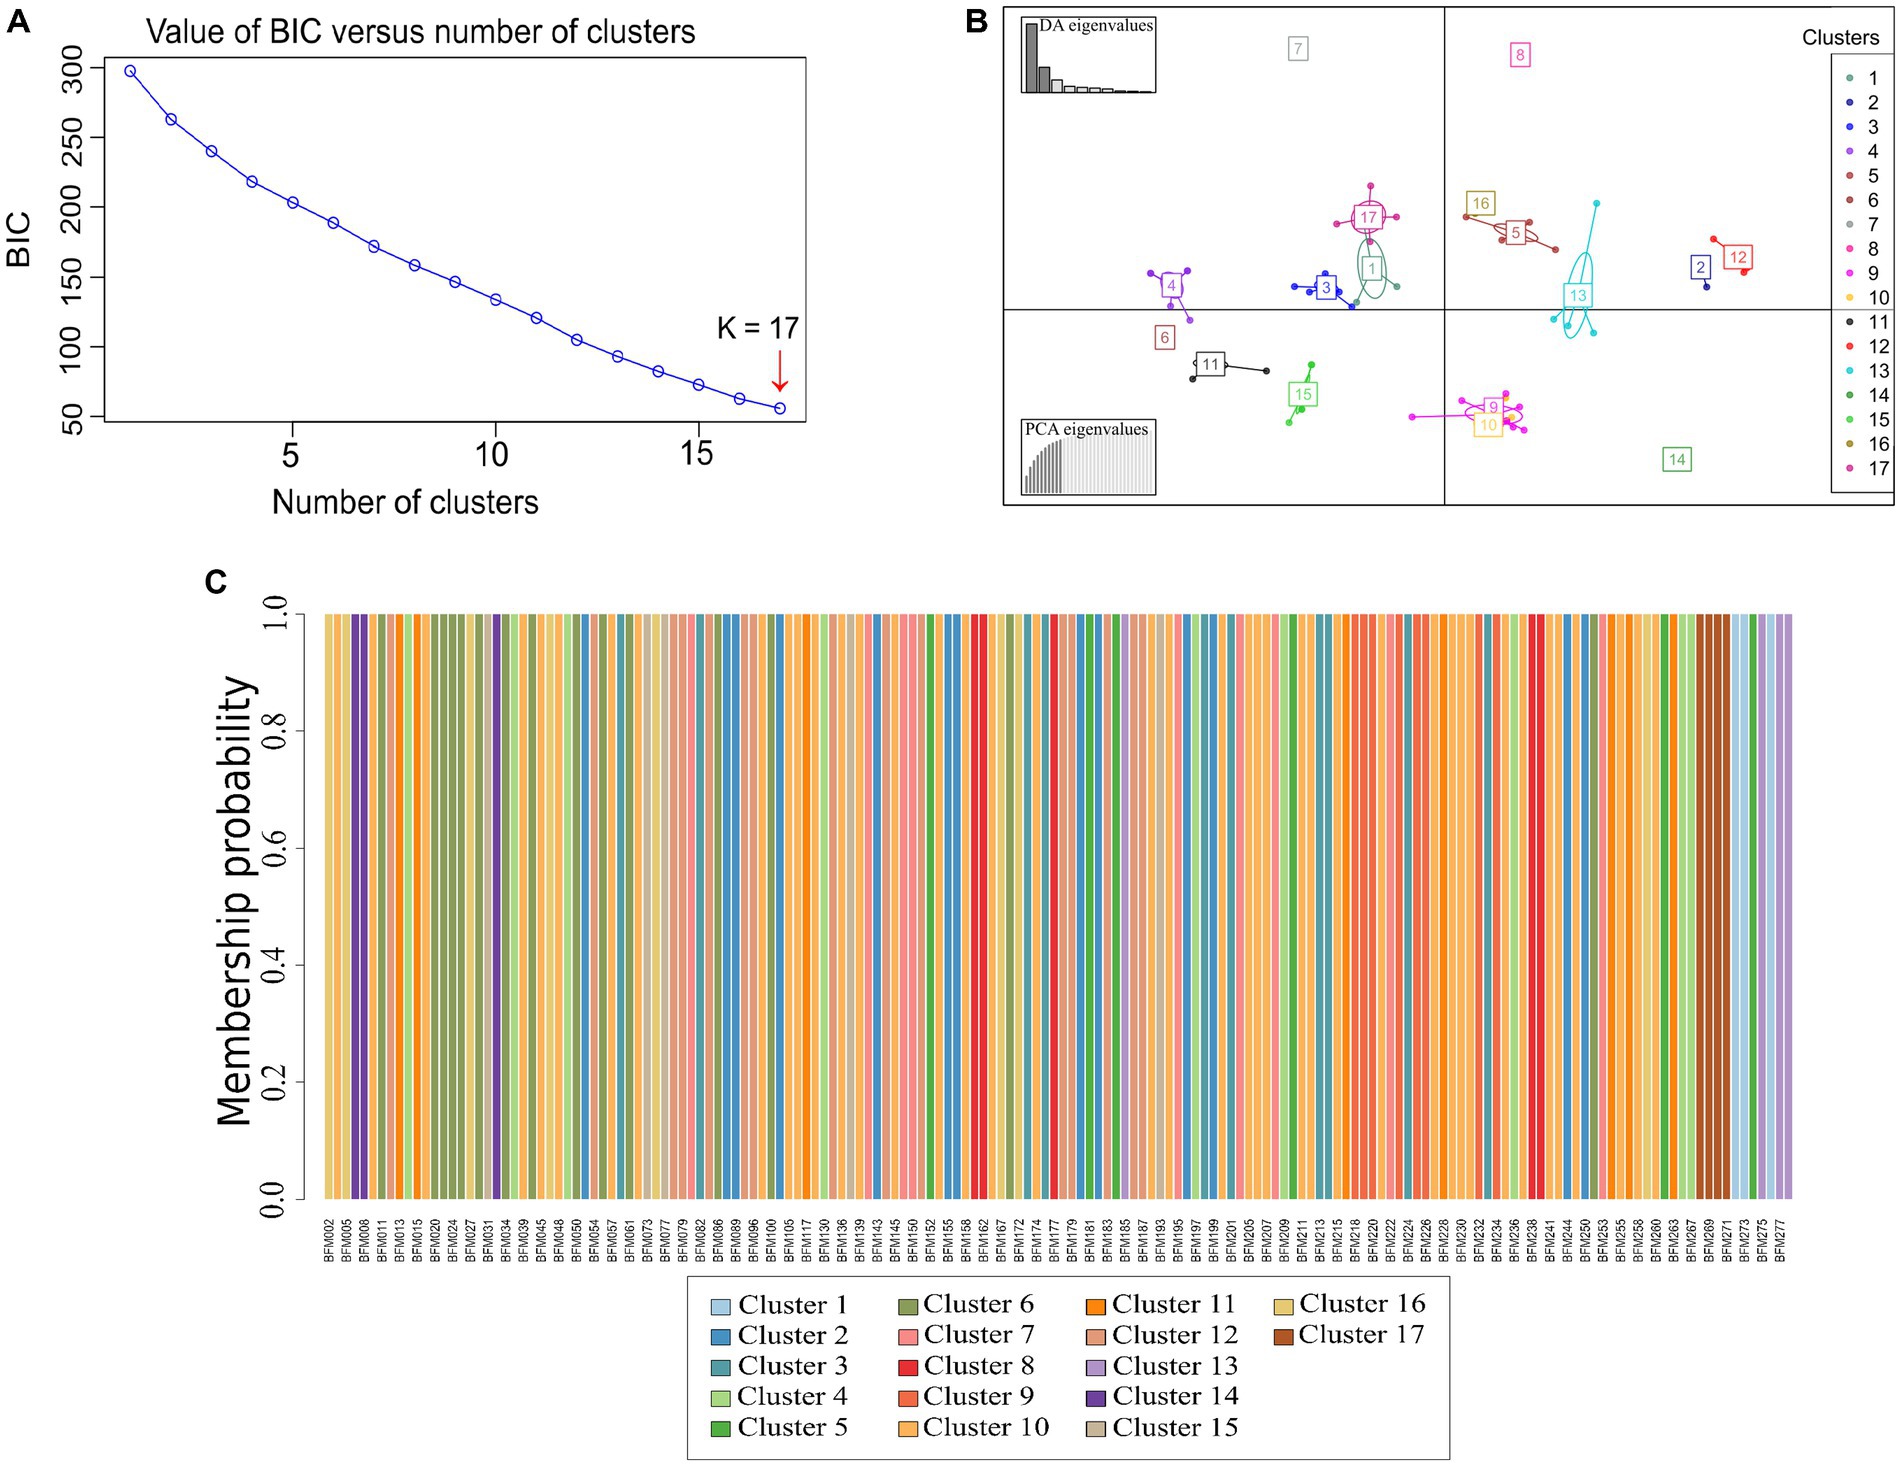
Figure 9. Discriminant analysis of principal components (DAPC) of 166 cassava accessions obtained from the analysis of 34 single nucleotide polymorphism (SNP) markers. (A) Optimal number of clusters. (B) Graphical representation of the DAPC results. Clusters are represented by colors according to the legend. The graph below to the left represents the contribution of the eigenvalues of the principal components selected, while the graph above to the left indicates the variance explained by the eigenvalues of the discriminant functions. (C) Membership probability of cassava accessions. Each accession is represented by a vertical line and the colors correspond to the probability of assignment in each of the 17 groups.
The lowest BIC value (120.97) indicating an optimal distribution of the 79 MLGs into 8 clusters was obtained (Figure 10A). The first five principal components (PCs), explaining 57.3% of the total variance retained by PCA, and five discriminant functions were retained for the DAPC. The first two discriminant functions, which explained, respectively, 53.9 and 22.5% of the total genetic variation, were used for the graphical representation of the DAPC results (Figure 10B). MLGs were assigned to the 8 clusters with an individual assignment probability ranging from 94 to 100% except for the BFM152 accession which was assigned to cluster 2 with a probability of 74%. MLGs in clusters 1, 3, 6, and 8 were assigned with an individual assignment probability of 100% (Figure 10C).
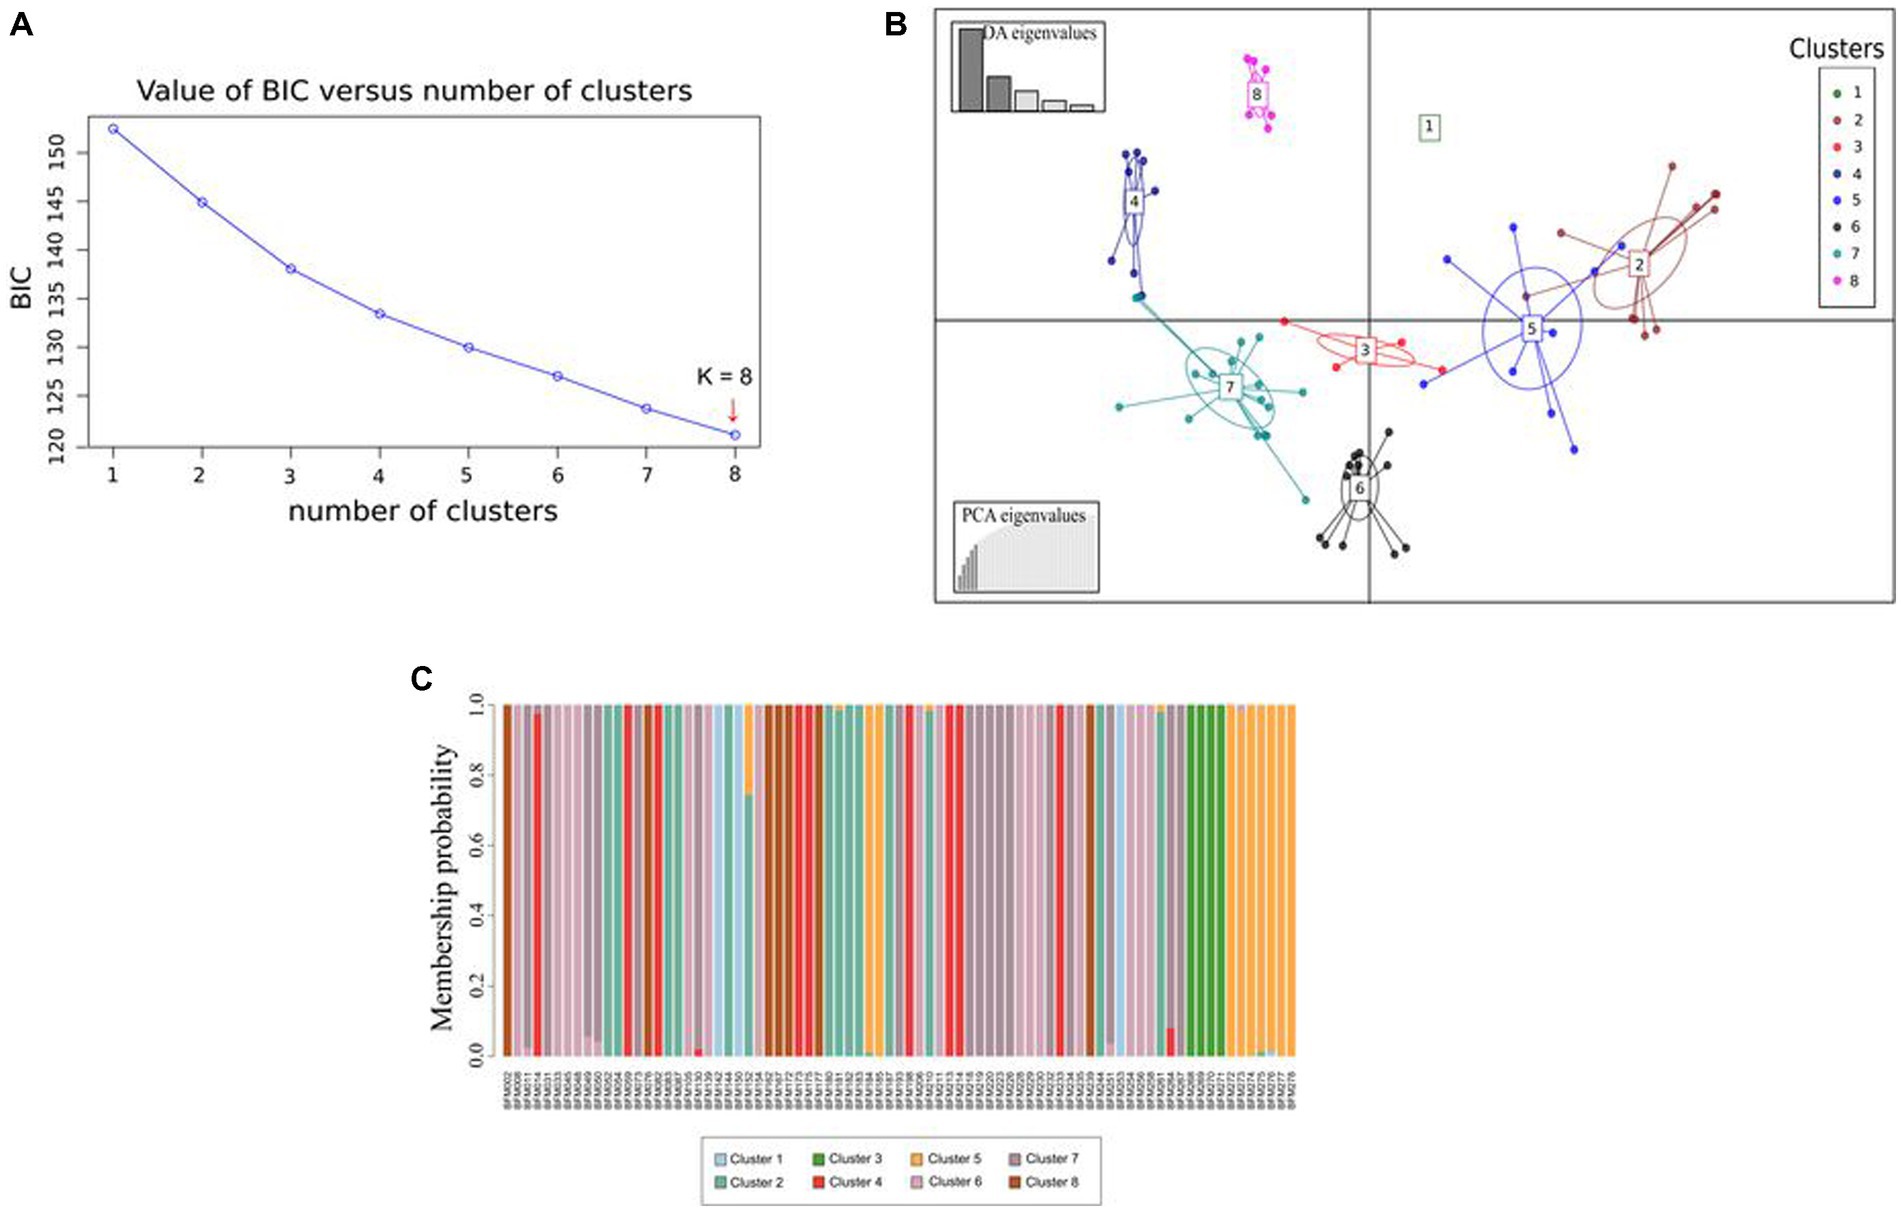
Figure 10. Discriminant analysis of principal components (DAPC) of 79 MLGs obtained from the analysis of 34 single-nucleotide polymorphism (SNP) markers. (A) Optimal number of clusters. (B) Graphical representation of the DAPC results. Clusters are represented by colors according to the legend. The graph below to the left represents the contribution of the eigenvalues of the principal components selected, while the graph above to the left indicates the variance explained by the eigenvalues of the discriminant functions. (C) Membership probability of MLGs. Each MLG is represented by a vertical line and the colors correspond to the probability of assignment in each of the eight groups.
3.2.5. Analysis of molecular variance
Analysis of molecular variance of the 166 cassava accessions based on geographical origin (regions), breeding patterns, and Bayesian analysis clusters showed that the most significant differences in the molecular variance of the SNPs were within individuals with 92.88, 84.27, and 66.52% of the total molecular variance, respectively. When using the clusters identified by DAPC, most of the variability was found among clusters (83.95%; Table 3). Analysis of the molecular variance of the 79 MLGs based on geographical origin and breeding patterns showed that the most significant differences in the molecular variance were within individuals with 93.50 and 87.19% of the total molecular variance, respectively. The AMOVA based on the DAPC clusters revealed that the molecular variance was slightly higher between clusters at 53.07% compared to the variance within individuals (46.93%). Using Bayesian analysis clusters, the results showed that the molecular variance between clusters and within individuals were almost the same with 50.41 and 49.59% of the total variance, respectively (Table 4). The mean indexes of genetic differentiation of the 166 accessions and 79 MLGs according to geographical origin, breeding patterns, DAPC clusters, and Bayesian analysis clusters are recorded in Table 5.
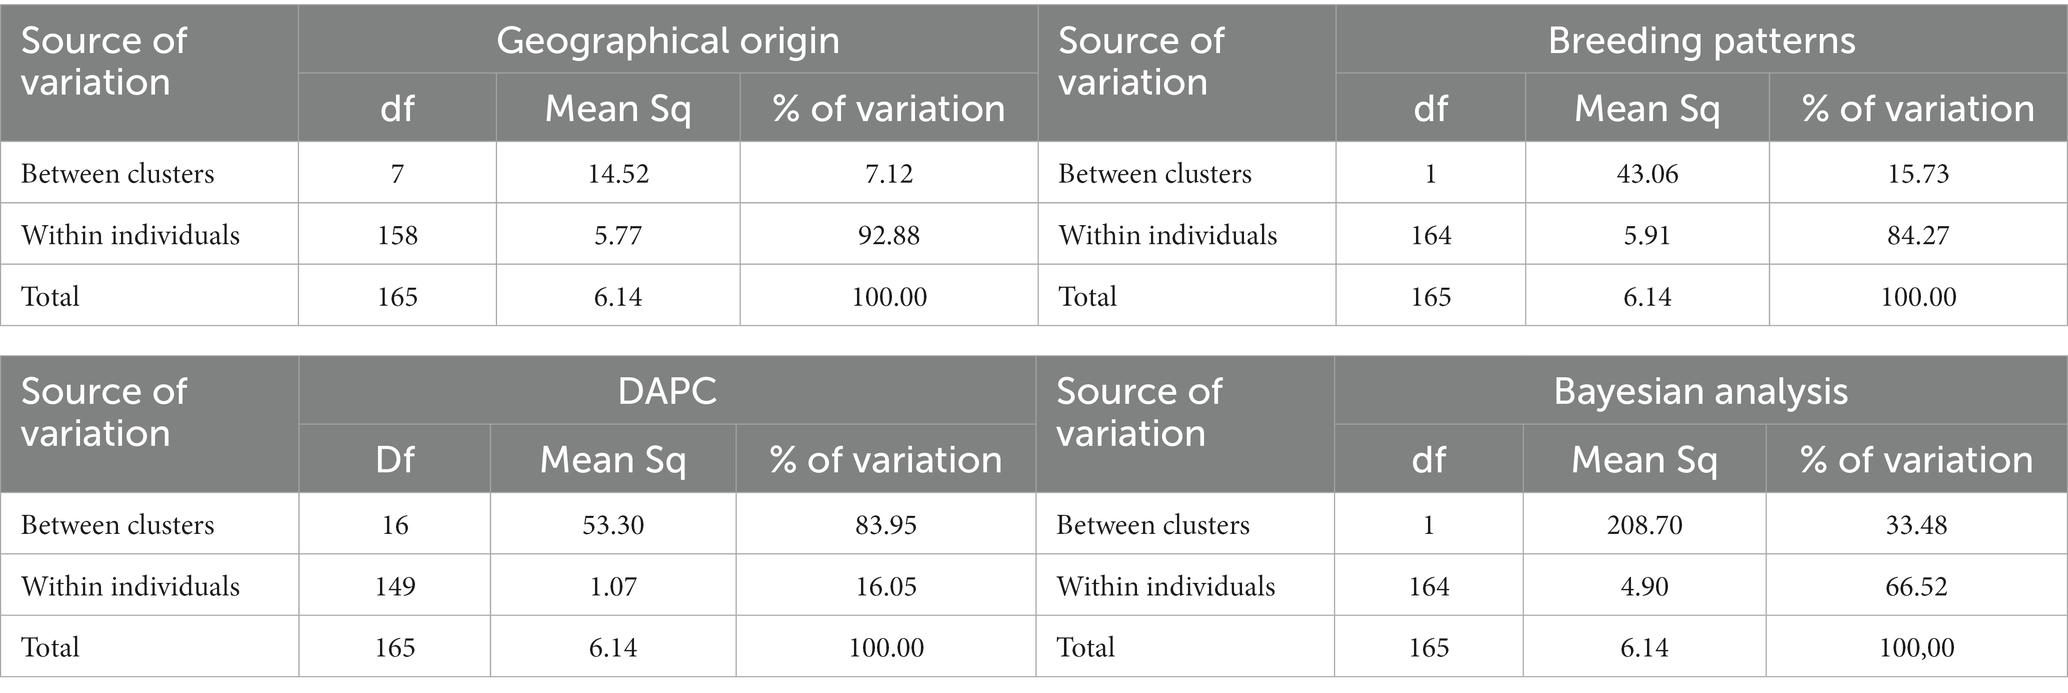
Table 3. AMOVA of the 166 accessions considering (a) geographical origins, (b) breeding patterns, (c) theoretical clusters obtained according to DAPC, and (d) theoretical clusters obtained according to Bayesian analysis.
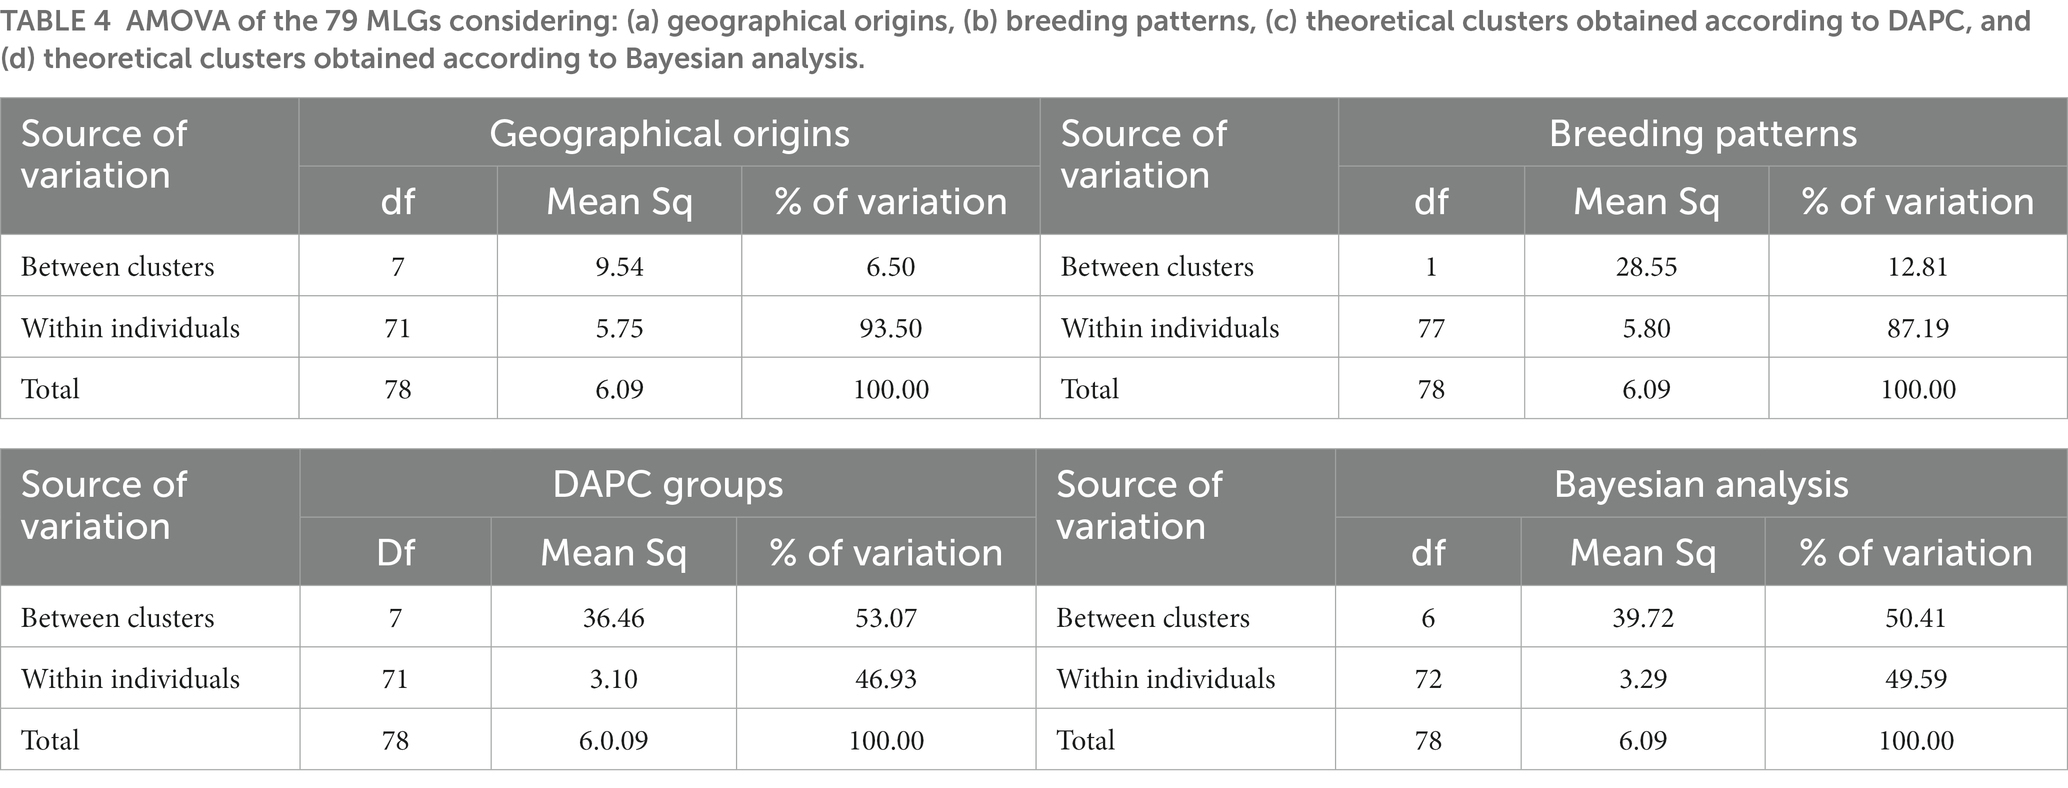
Table 4. AMOVA of the 79 MLGs considering: (a) geographical origins, (b) breeding patterns, (c) theoretical clusters obtained according to DAPC, and (d) theoretical clusters obtained according to Bayesian analysis.
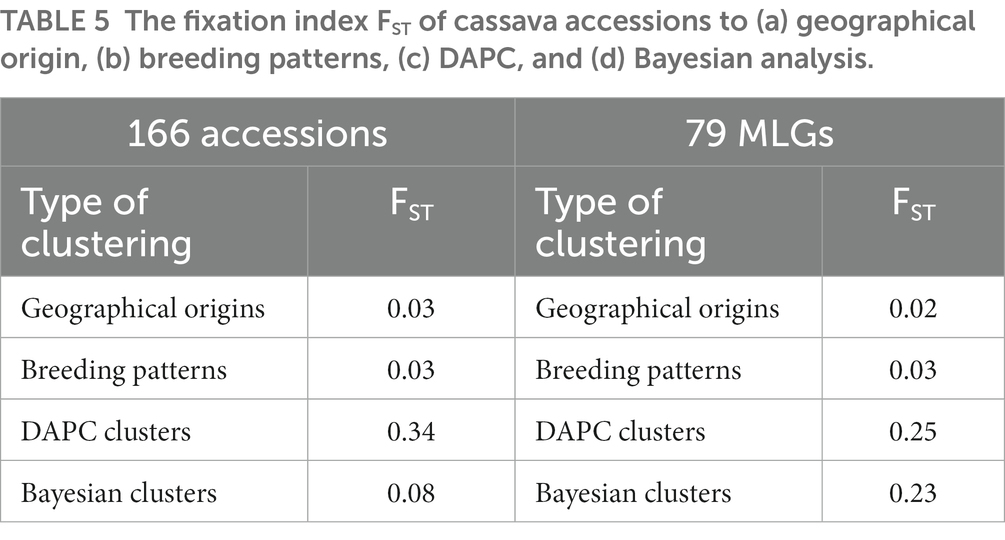
Table 5. The fixation index FST of cassava accessions to (a) geographical origin, (b) breeding patterns, (c) DAPC, and (d) Bayesian analysis.
4. Discussion
The minimum number of markers required to adequately determine genetic diversity in a population varies with the genetic diversity of the population, the scale of the study, and the type of marker used (Grünwald et al., 2017). Species that are highly inbred require a larger number of markers than those that are naturally heterogeneous, like cassava, for the detection of allelic variations. In addition, the number of alleles varies with the type of marker. SSR markers can have a large number of alleles at a locus while SNP markers have a fixed number of alleles (Adjebeng-Danquah et al., 2020). Thus, fewer microsatellite markers may be needed when compared with SNP markers to achieve the same degree of resolution (Schlötterer, 2004; Arnaud-Haond et al., 2007; Grünwald et al., 2017). Whatever the type of marker used or the diversity within the species, it is important to determine the appropriate number of markers for which the diversity observed in the population will not increase significantly if an additional marker is added (Arnaud-Haond et al., 2007). The genotype accumulation curve that was made to determine this appropriate number of markers showed that the selected markers were sufficient for the discrimination of the cassava accessions grown in Burkina Faso. Moreover, it revealed the existence of 79 unique multilocus genotypes among the 166 accessions.
Further analysis revealed that the retained 34 SNP markers were highly polymorphic. The high number of polymorphic SNP markers could be explained by the open-pollination mode of reproduction and the level of genetic variation in cassava (Oliveira et al., 2014). This finding could be a reflection of the diversified origin of cassava accessions grown in Burkina Faso through the informal introduction of accessions from other countries (Guira et al., 2017). Despite the high polymorphism of the SNP markers used in this study, the average PIC value was lower than those of other markers such as SSR (Asare et al., 2011; Pedri et al., 2019; Adjebeng-Danquah et al., 2020). This difference could be explained by the bi-allelic nature of SNP markers whose PIC values vary between 0.0 and 0.5, unlike SSR which are multi-allelic and can have PIC values up to 1 (Prempeh et al., 2020). Therefore, our results indicate that most of the SNPs used were sufficiently informative and can be used to study the genetic diversity of cassava accessions. The only exception we found was the Me_MEF_c_0566 marker which was moderately informative. Furthermore, the mean PIC value observed in this study was higher than those observed previously in some genetic diversity studies of cassava accessions (Oliveira et al., 2014; Kamanda et al., 2020; Karim et al., 2020; Prempeh et al., 2020). The average heterozygosity observed in this study was higher than the expected average heterozygosity suggesting a heterozygote excess within cassava accessions under the HWE. This heterozygote excess was confirmed by negative values of the FIS and FIT fixation indexes. Curiously, there are studies that have reported heterozygote excess within cassava accessions in relation to that expected under the HWE (Kamanda et al., 2020), and other studies reporting heterozygote deficit in relation to that expected under the HWE (de Albuquerque et al., 2018; Prempeh et al., 2020). Nevertheless, the differences observed between the mean values of PIC, Ho, and He in this study and those of other studies could be explained by the specificity of each cassava germplasm studied and the SNP markers used.
Molecular profiling of cassava accessions revealed a high rate of potential duplicates among the 166 accessions and a high variability in the proportions of potential duplicates across regions. The analysis also revealed that these potential duplicates belong to several genetic profiles and that the number of profiles varies between regions. This could be due to a high rate of exchange of cassava cuttings within regions. In addition, most of the potential duplicate profiles were found in several regions, indicating a high rate of exchange of cassava cuttings between regions. Similar results were obtained in Brazil in a study conducted on the identification of duplicates in the Embrapa cassava germplasm bank (Albuquerque et al., 2019). Accessions with profiles found in several regions probably have quite interesting characteristics for farmers (Rabbi et al., 2015). From the PCoA analysis, it was not possible to differentiate cassava accessions according to geographical origin. This lack of differentiation was confirmed by the low value of the genetic differentiation index (FST = 0.03) and by the low assignment probabilities of accessions to different regions. Furthermore, the AMOVA results revealed that more than 92%, for the 166 accessions, and more than 93%, for the 79 MLGs, of the total molecular variance were within accessions. This could be explained by the fact that some accessions are grown in several regions. The determination of the best number of clusters using the function best.cutree showed that the cassava accessions studied can be grouped into two large groups. The truncation was done at the top of the dendrogram and therefore does not accurately give the diversity of accessions. A lower truncation would more precisely give the real diversity of cassava accessions cultivated in Burkina Faso. The Bayesian analysis performed on the 166 accessions also grouped the accessions into two clusters, with more than 28% of the accessions not being assigned to a cluster at the 80% membership probability threshold. The result of the Bayesian analysis could be an underestimation of the diversity of cassava accessions. Indeed, as this analysis is based on the HWE model, it then assumes that the population is panmictic, that it is infinite, that there is no selection, mutation, or migration, and that successive generations are discrete (Oliveira et al., 2014; Rabbi et al., 2015). For populations with clonal and/or partially clonal reproduction such as cassava, these assumptions are violated because alleles are not always transmitted independently from one generation to another (Kamvar et al., 2014; Rabbi et al., 2015). The significant deviations from the HWE we detected during our analysis confirm this assertion as none of the subpopulations were at HWE. The DAPC performed on the 166 cassava accessions divided the accessions into 17 clusters with a higher individual assignment probability (100%) of accessions into clusters. The difference between the results of the Bayesian analysis (2 clusters) and the DAPC (17 clusters) could be explained by the multivariate approach used by the DAPC but also by the presence of many duplicates in the cassava germplasm. There are reports suggesting that the type of population structure influences the precision of the method (Jombart et al., 2010; Oliveira et al., 2014). In addition, the analysis of the population structure of the cassava germplasm involving samples from different genetic origins in different and unknown proportions leads to linkage disequilibrium between non-linked loci (Ersoz et al., 2007; Oliveira et al., 2014). In this case, DAPC would be more appropriate as it uses an approach that can identify genetic structures in the absence of any assumptions about the genetic model of the population (Jombart et al., 2010). Indeed, the results of the AMOVA of the 166 cassava accessions in relation to the clusters formed by the Bayesian analysis (STRUCTURE clusters) and by the DAPC (DAPC clusters) showed that the DAPC allows for better discrimination of cassava accessions. It was found that more than 80% of the total molecular variance was between the DAPC clusters, compared to only 16.05% within the accessions. In contrast to the DAPC, the molecular variance between the Bayesian analysis clusters represented 33.48% of the total molecular variance compared to 66.52% within the accessions. This moderate differentiation of the accessions by Bayesian analysis was confirmed by the low value of the genetic differentiation index (FST = 0.08). The criteria for classifying FST values showed that FST between 0 and 0.05 indicates low differentiation; FST between 0.05 and 0.15 reflects moderate differentiation; FST between 0.15 and 0.25 suggests high differentiation and above 0.25, the FST illustrates very high differentiation (Wright, 1978). These classification criteria showed that there was indeed moderate differentiation of the cassava accessions according to the clusters formed by the Bayesian analysis. Furthermore, the DAPC allowed a significant differentiation of the cassava accessions with an FST value higher than 0.25. The number of clusters proposed by the Bayesian analysis of the 79 MLGs (seven clusters) was very close to that proposed by the DAPC (eight clusters) which suggests that the elimination of duplicates improves the accuracy of the Bayesian analysis as mentioned in a previous study (Kamvar et al., 2014). Indeed, the results of the AMOVA in relation to the clusters formed by the Bayesian analysis (50.41% between clusters) and the FST value (0.23) showed a clear increase in the discriminatory power of the Bayesian analysis. The analysis also showed a weak differentiation of the accessions in relation to breeding patterns (improved varieties and landraces) with an FST of 0.03. This weak differentiation is probably due to the fact that most of the improved varieties were grown in cassava fields, but the difficulty in identifying them correctly led us to include them in the set of farmer accessions.
Data availability statement
The names of the repository/repositories and accession number(s) can be found through this link: https://www.ebi.ac.uk/biostudies/studies/S-BSST1040?key=6eb67c56-96f6-44da-b772-14dc9d750616.
Author contributions
MS, FT, and KS: conceptualization. MS and JP: methodology. MS, DO, and EY: formal analysis. MS: data curation and writing—original draft preparation. FT, KS, JP, JM, JN, and DK: writing—review and editing. DK, JP, FT, and KS: supervision. FT and JP: project administration and funding acquisition. All authors have read and agreed to the submitted version of the manuscript.
Funding
This work was supported by the Bill and Melinda Gates Foundation and The United Kingdom Foreign, Commonwealth and Development Office (FCDO; grant no. OPP1082413) to the Central and West African Virus Epidemiology (WAVE) Program for root and tuber crops—through a subgrant from Université Félix Houphouet-Boigny (UFHB) to the Institut de l’Environnement et de Recherches Agricoles (INERA). Under the grant conditions of the Foundation, a Creative Commons Attribution 4.0 Generic License has already been assigned to the Author Accepted Manuscript version that might arise from this submission.
Acknowledgments
The authors thank farmers for providing plant material.
Conflict of interest
The authors declare that the research was conducted in the absence of any commercial or financial relationships that could be construed as a potential conflict of interest.
Publisher’s note
All claims expressed in this article are solely those of the authors and do not necessarily represent those of their affiliated organizations, or those of the publisher, the editors and the reviewers. Any product that may be evaluated in this article, or claim that may be made by its manufacturer, is not guaranteed or endorsed by the publisher.
Supplementary material
The Supplementary material for this article can be found online at: https://www.frontiersin.org/articles/10.3389/fsufs.2023.1202015/full#supplementary-material
Footnotes
1. ^https://www.biosearchtech.com/bioark-sampling-kits
2. ^https://biosearchassets.blob.core.windows.net/assetsv6/guide_bioark-leaf-collection-kit.pdf
3. ^http://www.biosearchtech.com/kasp
4. ^http://www.biosearchtech.com/products/dna-extraction-kits
References
Adjebeng-Danquah, J., Gracen, V. E., Offei, S. K., Asante, I. K., and Manu-Aduening, J. (2016). Agronomic performance and genotypic diversity for morphological traits among cassava genotypes in the Guinea Savannah Ecology of Ghana. J. Crop. Sci. Biotechnol. 19, 99–108. doi: 10.1007/s12892-015-0095-8
Adjebeng-Danquah, J., Manu-Aduening, J., Asante, I. K., Agyare, R. Y., Gracen, V., and Offei, S. K. (2020). Genetic diversity and population structure analysis of Ghanaian and exotic cassava accessions using simple sequence repeat (SSR). Mark. Theory 6, 1–9. doi: 10.1016/j.heliyon.2019.e03154
Akinwale, M. G., Akinyele, B. O., Odiyi, A. C., and Dixon, A. G. O. (2011). Genotype X environment interaction and yield performance of 43 improved cassava (Manihot esculenta Crantz) genotypes at three agro-climatic zones in Nigeria. Br. Biotechnol. J. 1, 68–84. doi: 10.9734/bbj/2011/475
Albuquerque, H. D. Y. G., Oliveira, E. D. J., Brito, A. C., Andrade, L. D. R. B., Carmo, C. D. D., Morgante, C. V., et al. (2019). Identification of duplicates in cassava germplasm banks based on single-nucleotide polymorphisms (SNPs). Sci. Agric. 76, 328–336. doi: 10.1590/1678-992X-2017-0389
Al-Fares, H., and Abu-Qaoud, H. (2012). Molecular characterization of genetic diversity in some durum wheat (Triticum durum Desf.) in Palestine. Afr. J Biotechnol. 11, 12958–12963. doi: 10.5897/AJB12.1698
ARNAUD-HAOND, S., DUARTE, C. M., ALBERTO, F., and SERRÃO, E. A. (2007). Standardizing methods to address clonality in population studies. Mol. Ecol. 16, 5115–5139. doi: 10.1111/j.1365-294X.2007.03535.x
Carmo, C. D. D., Silva, M. D. S., Oliveira, G. A. F., and Oliveira, E. D. J. (2015). Molecular-assisted selection for resistance to cassava mosaic disease in Manihot esculenta Crantz. Sci. Agric. 72, 520–527. doi: 10.1590/0103-9016-2014-0348
de Albuquerque, H. Y. G., Carmo, C. D. D., Brito, A. C., and Oliveira, E. D. J. (2018). Genetic diversity of Manihot esculenta Crantz germplasm based on single-nucleotide polymorphism markers. Ann. Appl. Biol. 173, 271–284. doi: 10.1111/aab.12460
Earl, D. A., and vonHoldt, B. M. (2012). STRUCTURE HARVESTER: A website and program for visualizing STRUCTURE output and implementing the Evanno method. Conserv. Genet. Resour. 4, 359–361. doi: 10.1007/s12686-011-9548-7
Elias, M., Penet, L., Vindry, P., McKey, D., Panaud, O., and Robert, T. (2001). Unmanaged sexual reproduction and the dynamics of genetic diversity of a vegetatively propagated crop plant, cassava (Manihot esculenta Crantz), in a traditional farming system. Mol. Ecol. 10, 1895–1907. doi: 10.1046/j.0962-1083.2001.01331.x
Ersoz, E. S., Yu, J., and Buckler, E. S. (2007). “Applications of linkage disequilibrium and association mapping in crop plants” in Genomics-assisted crop improvement, vol. 1 (Netherlands: Springer), 97–119.
Evanno, G., Regnaut, S., and Goudet, J. (2005). Detecting the number of clusters of individuals using the software STRUCTURE: a simulation study. Mol. Ecol. 14, 2611–2620. doi: 10.1111/j.1365-294X.2005.02553.x
FAOSTAT. (2022). Food and agriculture organazation of the united nations statistics division. Available at: https://www.fao.org/faostat/en/#home (Accessed August 11, 2022).
Fauquet, C., and Fargette, D. (1990). African cassava mosaic virus: etiology, epidemiology, and control. Plant Dis. 74, 404–411. doi: 10.1094/PD-74-0404
Ferguson, M. E., Hearne, S. J., Close, T. J., Wanamaker, S., Moskal, W. A., Town, C. D., et al. (2012). Identification, validation and high-throughput genotyping of transcribed gene SNPs in cassava. Theor. Appl. Genet. 124, 685–695. doi: 10.1007/s00122-011-1739-9
Ferguson, M. E., Shah, T., Kulakow, P., and Ceballos, H. (2019). A global overview of cassava genetic diversity. PLoS One 14, e0224763–e0224716. doi: 10.1371/journal.pone.0224763
Goudet, J., Jombart, T., Kamvar, Z. N., Archer, E., and Hardy, O. (2020). Estimation and tests of hierarchical F-statistics. (Version 0.5–7). Available at: https://www.r-project.org,https://github.com/jgx65/hierfstat
Grünwald, N. J., Everhart, S. E., Knaus, B. J., and Kamvar, Z. N. (2017). Best practices for population genetic analyses. Pap. Plant Pathol. 107, 1000–1010. doi: 10.1094/PHYTO-12-16-0425-RVW
Guira, F., Some, K., Kabore, D., Sawadogo-Lingani, H., Traore, Y., and Savadogo, A. (2017). Origins, production, and utilization of cassava in Burkina Faso, a contribution of a neglected crop to household food security. Food Sci. Nutr. 5, 415–423. doi: 10.1002/fsn3.408
Jombart, T., Devillard, S., and Balloux, F. (2010). Discriminant analysis of principal components: a new method for the analysis of genetically structured populations. BMC Genet. 11:94. doi: 10.1186/1471-2156-11-94
Kamanda, I., Blay, E. T., Asante, I. K., Danquah, A., Ifie, B. E., Parkes, E., et al. (2020). Genetic diversity of provitamin-A cassava (Manihot esculenta Crantz) in Sierra Leone. Genet. Resour. Crop. Evol. 67, 1193–1208. doi: 10.1007/s10722-020-00905-8
Kamvar, Z. N. (2019). Package ‘poppr’ (Version 2.8.3). Available at: https://grunwaldlab.github.io/poppr
Kamvar, Z. N., Tabima, J. F., and Gr̈unwald, N. J. (2014). Poppr: an R package for genetic analysis of populations with clonal, partially clonal, and/or sexual reproduction. PeerJ 2, e281–e214. doi: 10.7717/peerj.281
Karim, K. Y., Ifie, B., Dzidzienyo, D., Danquah, E. Y., Blay, E. T., Whyte, J. B. A., et al. (2020). Genetic characterization of cassava (Manihot esculenta Crantz) genotypes using agro-morphological and single nucleotide polymorphism markers. Physiol. Mol. Biol. Plants 26, 317–330. doi: 10.1007/s12298-019-00740-x
Kawuki, R. S., Ferguson, M., Labuschagne, M. T., Herselman, L., Orone, J., Ralimanana, I., et al. (2011). Variation in qualitative and quantitative traits of cassava germplasm from selected national breeding programmes in sub-Saharan Africa. Field Crop Res. 122, 151–156. doi: 10.1016/j.fcr.2011.03.006
Larmarange, J. (2021). JLutils: collection of R functions. R package version 1.22.0. Available at: https://github.com/larmarange/JLutils
Lefèvre, F., and Charrier, A. (1993). Isozyme diversity within African Manihot germplasm 66, 73–80. doi: 10.1007/BF00023510,
Léotard, G., Duputié, A., Kjellberg, F., Douzery, E. J. P., Debain, C., de Granville, J. J., et al. (2009). Phylogeography and the origin of cassava: New insights from the northern rim of the Amazonian basin. Mol. Phylogenet. Evol. 53, 329–334. doi: 10.1016/j.ympev.2009.05.003
Liu, K., and Muse, S. V. (2005). PowerMaker: an integrated analysis environment for genetic maker analysis. Bioinformatics 21, 2128–2129. doi: 10.1093/bioinformatics/bti282
MAAH (2019). Plan d’actions de la filière manioc du Burkina Faso Ministère de l’Agriculture et des Aménagements Hydrauliques. Available at: https://faolex.fao.org/docs/pdf/bkf198280.pdf
Mammadov, J., Aggarwal, R., Buyyarapu, R., and Kumpatla, S. (2012). SNP markers and their impact on plant breeding. Int. J. Plant Genom. 2012, 1–11. doi: 10.1155/2012/728398
Mezette, T. F., Blumer, C. G., and Veasey, E. A. (2013). Morphological and molecular diversity among cassava genotypes. Pesqui. Agropecu. Bras. 48, 510–518. doi: 10.1590/S0100-204X2013000500007
Mtunguja, M. K., Ranjan, A., Laswai, H. S., and Muzanila, Y. (2015). Genetic diversity of farmer-preferred cassava landraces in Tanzania based on morphological descriptors and single nucleotide polymorphisms. Plant Genet. Resour. Charact. Util. 15, 138–146. doi: 10.1017/S1479262115000453
Nassar, N. M. A. (1999). Cassava, Manihot esculenta Crantz, genetic resources: their collection, evaluation, and manipulation. Adv. Agron. 69, 179–230. doi: 10.1016/S0065-2113(08)60950-5
Oksanen, J., Blanchet, F. G., Friendly, M., Kindt, R., Legendre, P., McGlinn, D., et al. (2020). vegan: community ecology package. R package version 2.5–7. Available at: https://www.researchgate.net/publication/346579465_vegan_community_ecology_package_version_25-7_November_2020
Oliveira, E. J., Resende, M. D. V.De, Santos, V. D. S., Ferreira, C. F., Oliveira, G. A. F., and Da Silva, M. S.,, et al. (2012). Genome-wide selection in cassava. Euphytica 187, 263–276. doi: 10.1007/s10681-012-0722-0
Oliveira, E. J., Ferreira, C. F., Silva, S. D. V., Jesus, O. D. N., Oliveira, G. A. F., and Silva, M. D. S. (2014). Potential of SNP markers for the characterization of Brazilian cassava germplasm. Theor. Appl. Genet. 127, 1423–1440. doi: 10.1007/s00122-014-2309-8
Olsen, K. M., and Schaal, B. A. (1999). Evidence on the origin of cassava: phylogeography of Manihot esculenta. Proc. Natl. Acad. Sci. U. S. A. 96, 5586–5591. doi: 10.1073/pnas.96.10.5586
Olsen, K. M., and Schaal, B. A. (2001). Microsatellite variation in cassava (Manihot esculenta, Euphorbiaceae) and its wild relatives: further evidence for a southern Amazonian origin of domestication. Am. J. Bot. 88, 131–142. doi: 10.2307/2657133
Asare, P. A., Galyuon, I. K. A., Sarfo, J. K., and Tetteh, J. P. (2011). Morphological and molecular based diversity studies of some cassava (Manihot esculenta crantz) germplasm in Ghana. Afr. J. Biotechnol. 10, 13900–13908. doi: 10.5897/ajb11.929
Paradis, E. (2010). pegas: an R package for population genetics with an integrated – modular approach. Bioinformatics 26, 419–420. doi: 10.1093/bioinformatics/btp696
Park, Y., Dixit, A., Ma, K., Kang, J., Rao, V. R., and Cho, E. (2005). On-farm conservation strategy to ensure crop genetic diversity in changing agro-ecosystems in the Republic of Korea. J. Agron. Crop Sci. 191, 401–410. doi: 10.1111/j.1439-037X.2005.00168.x
Pedri, E. C. M., Hoogerheide, E. S. S., Tiago, A. V., Cardoso, E. S., Pinto, J. M. A., Santos, L. L., et al. (2019). Genetic diversity of cassava landraces cultivated in northern Mato Grosso State, Brazil, using microsatellite markers. Genet. Mol. Res. 18, 1–11. doi: 10.4238/gmr18315
Prempeh, R. N. A., Manu-Aduening, J. A., Quain, M. D., Asante, I. K., Offei, S. K., and Danquah, E. Y. (2020). Assessment of genetic diversity among cassava landraces using single nucleotide polymorphic markers. Afr. J. Biotechnol. 19, 383–391. doi: 10.5897/AJB2018.16420
Pritchard, J. K., Stephens, M., and Donnelly, P. (2000). Inference of population structure using multilocus genotype data. Genetics 155, 945–959. doi: 10.1007/s10681-008-9788-0
Rabbi, I. Y., Kulakow, P. A., Manu-aduening, J. A., Dankyi, A. A., Asibuo, J. Y., Parkes, E. Y., et al. (2015). Tracking crop varieties using genotyping- by-sequencing markers: a case study using cassava (Manihot esculenta Crantz). BMC Genet. 16, 1–11. doi: 10.1186/s12863-015-0273-1
Rao, S. A., Bounphanousay, C., Schiller, J. M., Alcantara, A. P., and Jackson, M. T. (2002). Naming of traditional rice varieties by farmers in the Lao PDR. Genet. Resour. Crop. Evol. 49, 83–88. doi: 10.1023/A:1013843913975
Roa, A. C., Maya, M. M., Duque, M. C., Tohme, J., Allem, A. C., and Bonierbale, M. W. (1997). AFLP analysis of relationships among cassava and other Manihot species. Theor. Appl. Genet. 95, 741–750. doi: 10.1007/s001220050620
Salick, J., and Cellinese, N. (1997). Indigenous diversity of cassava: generation, maintenance, use and loss among the Amuesha, Peruvian Upper Amazon. Econ. Bot. 51, 6–19. doi: 10.1007/BF02910400
Schlötterer, C. (2004). The evolution of molecular markers — just a matter of fashion? Nat. Rev. Genet. 5, 63–69. doi: 10.1038/nrg1249
Second, G., Allem, A. C., Mendes, R. A., Carvalho, L. J. C. B., Emperaire, L., Lngram, C., et al. (1997). Molecular marker (AFLP)-based Manihot and cassava numerical taxonomy and genetic structure analysis in progress: Implications for their dynamic conservation and genetic mapping. Afr. J. Root Tubei Crop. 2, 140–147.
Tiago, M. G., Pedro, S. V. F., Maria, C. G. V., Rebecca, C. U. F., Vanesca, P. C. R., Alex, H. T. O., et al. (2017). Genetic diversity and population structure of traditional sweet cassava accessions from Southern of Minas Gerais State, Brazil, using microsatellite markers. Afr. J. Biotechnol. 16, 346–358. doi: 10.5897/AJB2016.15768
Van Treuren, R., and Van Hintum, T. J. L. (2003). Marker-assisted reduction of redundancy in germplasm collections: genetic and economic aspects. Acta Hortic. 623, 139–149. doi: 10.17660/ActaHortic.2003.623.15
Villanueva, R. A. M., and Chen, Z. J. (2019). ggplot2: elegant graphics for data analysis (2nd ed.). Meas. Interdiscip. Res. Perspect. 17, 160–167. doi: 10.1080/15366367.2019.1565254
Wolfe, M. D., Rabbi, I. Y., Egesi, C., Hamblin, M., Kawuki, R., Kulakow, P., et al. (2016). Genome-wide association and prediction reveals genetic architecture of cassava mosaic disease resistance and prospects for rapid genetic improvement. Plant Genome 9, 1–13. doi: 10.3835/plantgenome2015.11.0118
Wright, S. (1978). “Variability within and among natural populations,” in Evolution and the genetics of populations, vol. 4 ( University of Chicago Press), 1–590.
Keywords: cassava germplasm, genotyping, genetic diversity, SNPs markers, population structure, duplicate accessions
Citation: Soro M, Pita JS, Somé K, Otron DH, Yéo E, Mutuku JM, Néya JB, Tiendrébéogo F and Koné D (2023) Genomic analysis and identification of potential duplicate accessions in Burkina Faso cassava germplasm based on single nucleotide polymorphism. Front. Sustain. Food Syst. 7:1202015. doi: 10.3389/fsufs.2023.1202015
Edited by:
Duraisamy Saravanakumar, The University of the West Indies St. Augustine, Trinidad and TobagoReviewed by:
Mohammad Ehsan Dulloo, Alliance Bioversity International and CIAT, FranceLalit Arya, Indian Council of Agricultural Research (ICAR), India
Copyright © 2023 Soro, Pita, Somé, Otron, Yéo, Mutuku, Néya, Tiendrébéogo and Koné. This is an open-access article distributed under the terms of the Creative Commons Attribution License (CC BY). The use, distribution or reproduction in other forums is permitted, provided the original author(s) and the copyright owner(s) are credited and that the original publication in this journal is cited, in accordance with accepted academic practice. No use, distribution or reproduction is permitted which does not comply with these terms.
*Correspondence: Monique Soro, c29yb21vbmlxdWUxQGdtYWlsLmNvbQ==; Fidèle Tiendrébéogo, ZmlkZWxldEBnbWFpbC5jb20=