
95% of researchers rate our articles as excellent or good
Learn more about the work of our research integrity team to safeguard the quality of each article we publish.
Find out more
ORIGINAL RESEARCH article
Front. Sustain. Food Syst. , 02 August 2023
Sec. Nutrition and Sustainable Diets
Volume 7 - 2023 | https://doi.org/10.3389/fsufs.2023.1200453
 Aung Zaw Oo1*
 Hidetoshi Asai1*
 Kensuke Kawamura1†Junichiro Marui1Kazuhiko Nakahara1Toshiyuki Takai1
 Hiroki Saito2
 Khin Thuzar Win3
 Juan Pariasca-Tanaka1
Rice with a black-colored pericarp (hereafter, black rice) has attracted considerable attention because of its high nutritional value. It is traditionally grown in infertile agroecosystems, where soil nutrient deficiency would affect grain yield and nutritional quality of the rice. This study examined the effects of phosphorus (P) application (0, 100, 250, 500, 1,000, and 1,300 mg P2O5 pot−1) on the growth, grain yield, and certain quality parameters of unpolished black (“Asamurasaki”) and white (“Takanari”) rice. The results showed that black rice grew poorly under P limitation, resulting in fewer tillers and a lower grain yield, while maintaining higher photosynthetic efficiency than white rice. However, black rice produced under P stress exhibited higher levels of Zn, Fe, and antioxidant (total phenolic and flavonoid content) than white rice, making it more nutritious. The optimal P application rates for black and white rice were 250 and 500 mg P2O5 pot−1, respectively, to achieve high yields. At the optimal rate, black rice exhibited high Fe, Zn and antioxidant levels compared to that at higher P application rates and had lower phytic acid levels, which could alleviate its inhibition of mineral absorption in the digestive tract. Moreover, low grain P due to P stress decreased the lightness L* value in the CIE-Lab system, improving the visual grain quality. Therefore, optimal P management is crucial for maintaining optimal grain yield with low phytic acid concentration and enhancing the nutritional quality of black rice for human consumption.
Black rice, a pigmented rice variety predominantly cultivated in Asia, is gaining popularity due to its significant nutritional value and numerous health benefits. It is consumed as unpolished rice having a purple pericarp rich in fiber, anthocyanins, antioxidants, vitamins, and other minerals (Goufo and Trindade, 2014; Kushwaha, 2016). Black rice powder is one of the most well-balanced superfoods, with truly remarkable properties (Kushwaha, 2016). Owing to the high nutritional value of black rice, its development as a functional food would be feasible to support the advancement of the agroindustry (Yodmanee et al., 2011). Both whole grain and powder of black rice have various feasible applications in the agroindustry such as functional food, natural food colorant, animal feed, etc.
Black rice is generally grown as a traditional medicine by resource-poor farmers in agroecosystems with low inputs and unfavorable conditions, which is a characteristic of developing regions, especially in most tropical countries. Furthermore, areas where black rice is dominantly grown are remote and located in mountainous regions with less market accessibility (Kushwaha, 2016). Previous studies have shown that black rice grown under stress can accumulate flavonoids, such as anthocyanins, as high levels of anthocyanins potentially improve stress tolerance (Napar et al., 2022) and antioxidant levels of mature grains, as reported under drought (Emam, 2012), cold (Kushwaha, 2016; Purwanto et al., 2018), and high salt conditions (Chunthaburee et al., 2015). Therefore, black rice grown under abiotic stress conditions would have higher nutritional value than that grown without any stress condition; however, stress conditions would inevitably reduce grain yield, which directly affects smallholder farmers’ income and food security.
Among the various abiotic stresses, phosphorus (P) deficiency in soil, especially in weathered tropical soils, is a major yield-limiting factor in rice production. Moreover, the available P amount is usually low in most rice soils because of high soil P fixation (Batjes, 2011). The growth and yield of black rice is thought to be affected when grown in P-deficient soils; however, only a few studies have been conducted on this topic yet. Abiotic stresses, including P stress, may enhance antioxidant activities in black rice. However, this requires further clarification. The improved stress tolerance triggered by anthocyanin accumulation might be responsible for the superior adaptability of black rice to soil P deficiency compared with that of white rice. Furthermore, soil P deficiency may be beneficial to obtain valuable rice products enriched in antioxidant activities. In addition, soil P availability also might influence the mineral content of black rice, which is one of the key parameters determining the nutritional quality of black rice. Some studies on wheat (Ryan et al., 2008) and sorghum (Watts Williams et al., 2021) reported that P fertilization increased the grain mineral content, via the development of arbuscular mycorrhizae. However, other studies have reported negative correlation between P fertilizer treatments and the mineral content of wheat and barley grains (Huang et al., 2019; Jordan-Meille et al., 2021). These contradictory observations warrant further investigation of how soil P deficiency affects the grain mineral content.
P fertilizer application could be the primary solution for overcoming P deficiency to improve productivity. High P input could improve rice grain yield; however, previous studies have reported that rice yield response to P application rate was a quadratic response (Fageria et al., 2013), and emphasized that excess P supply would not always enhance rice yield; it can also degrade the nutritional quality of the grains, partly because of the high concentration of phytic acid in the grain as P is mainly stored in the seeds in the form of phytic acid (myoinositol 1,2,3,4,5,6-hexakis dihydrogen phosphate), an antinutritional component (Vats and Banerjee, 2004).
Phytic acid is negatively charged and chelates strongly with other mineral elements, such as iron and zinc. It usually exists as mixed salts (Raboy, 2003), which prevents the absorption of essential minerals in the human gut (Mitchikpe et al., 2008). More than 60–90% of P taken up by rice accumulates in the grains at harvest (Rose et al., 2013; Somaweera et al., 2015), thus being exported from the fields and leading to the continuous removal of P from rice soils. Of the total amount of P in the grains, 65–80% is present in the form of phytate, a salt form of phytic acid (InsP6) (Raboy, 2001). Previous studies have focused on reducing phytate levels in grains through breeding programs because of human and animal health concerns; however, the total P amount in the seeds remains unchanged (Dorsch et al., 2003; Bryant et al., 2005; Raboy, 2009). Recently, Yamaji et al. (2017) discovered a SULTR-like P distribution transporter (SPDT) that controls the allocation of P to the white rice grain, resulting in decreased P levels in the grains but increased P levels in the leaves. However, reports on an agronomic approach to control the level of phytic acid concentration in the rice grain are scarce. Since the P of phytic acid stored in grain originated from soil or fertilizer, agronomic P management by optimizing the amount of P fertilizer is expected to reduce phytic acid levels in grains without yield loss.
Based on these considerations, black rice cultivation should be evaluated in terms of both productivity and grain nutritional value such as antioxidant activity, mineral content, and phytic acid level. Furthermore, these parameters are expected to respond differently to soil P availability. Therefore, evaluation of multiple traits is necessary to better understand the optimal P management and effect of soil P deficiency on black rice. This pilot study was conducted to investigate the effects of varying P supply on the grain yield and nutritional quality of black rice compared with those of white rice. The objectives of this study were to (1) evaluate the adaptability of black rice to soil P deficiency compared with white rice through agronomic and physiological studies, (2) evaluate how soil P deficiency affects yield and nutritional parameters, and (3) identify the optimal P level that would improve grain yield and antioxidant activity of black rice while reducing grain phytic acid concentration. We hypothesized that producing black rice at low P stress increases nutritional quality but reduces grain yield, whereas optimal P supply results in optimal grain yield, high antioxidant and mineral content, and low phytic acid concentration in the grains, thereby providing both yield and nutritional quality for human consumption.
The experiment was conducted in a greenhouse with an automatic ventilation system at the Japan International Research Center for Agricultural Science (JIRCAS), Tsukuba, Japan (36 °03′N, 140 °05′ E, 22 m above sea level). The temperature during the rice-growing period between June and October 2021 ranged from 20.3 to 31.6°C (Thermo Recorder TR-50 U2, T&D Corporation, Nagano, Japan).
The soil used for the pot experiment was collected from the experimental farm at JIRCAS. The soil composition was as follows: 69.2% sand, 29.4% silt, 1.4% clay, pH (H2O) of 5.78, electrical conductivity (EC) of 3.82 mS m−2, and available oxalate P content of 400 mg kg−1 soil. The soil was air-dried and passed through an 8 mm sieve before the experiment. Our previous study showed that the soil had a high P retention capacity of up to 99% (Oo et al., 2020). Therefore, the soil was partially mixed with commercial sand at a ratio of 2:1 (v/v) to increase soil P availability. The pots (1/5,000 Wenger pot, height 20 cm, and diameter 16 cm) were filled with 3 kg of the prepared soil.
Six P application rates were factorially combined with two rice varieties (black and white rice) in a five-replicate randomized complete block design. The black rice “Asamurasaki” is a hybrid of Japanese sticky rice and Bali black rice. Asamurasaki black rice is a medium-tall variety with a growth duration of around 110–120 days. The high-yielding Indica rice variety “Takanari” was used as the white rice for comparison with black rice. Takanari white rice is also a medium-tall variety with a growth duration of around 120–130 days and tolerance to heat stress (Takai et al., 2019).
The effect of P fertilizer (triple superphosphate commonly used in rice cultivation, TSP: 42% P2O5) application on rice growth and grain quality parameters were assessed. The P application rates were 0, 100, 250, 500, 1,000, and 1,300 mg P2O5 pot−1 for P0, P100, P250, P500, P1000, and P1300 treatments, respectively. For P100 to P1000 treatments, TSP was mixed with the soil as a basal application during soil puddling. The P1300 treatment received 1,000 mg P2O5 as a basal TSP application and an additional 300 mg in the form of a phosphate solution at flowering, which facilitated assessment of the effects of late P application on grain yield and functionality.
For all the treatments, NH4NO3 (300 mg N pot−1) and K2SO4 (300 mg K2O pot−1) were mixed with soils during puddling to develop uniform and N- and K-sufficient conditions. Then, 20 days-old seedlings were transplanted, with two seedlings per pot. The water table was continuously flooded throughout the rice growing period.
Chlorophyll fluorescence, absorbance, and environmental variables were measured 30 days after transplanting using a MultispeQ v2.0 handheld device (PhotosynQ LLC, East Lansing, MI, United States) according to the “Photosynthesis RIDES 2.0” protocol, controlled by the PhotosynQ platform software (Kuhlgert et al., 2016). At the time of measurement, both rice varieties were at active tillering stage. The PhotosynQ application and MultispeQ v2.0 were connected via Bluetooth using the HUAWEI MediaPad M5 lite (HUAWEI Technologies Co. Ltd., Shenzhen, China). Measurements were performed on the topmost fully expanded leaves on clear days from 10:00 am to 12:00 pm using two MultispeQ devices to reduce the sampling times. Photosynthetic parameters were measured and calculated according to the method described by Fernández Calleja et al. (2020). Among the photosynthetic parameters, the quantum efficiency of Photosystem II (light to photosystem II output, FII), non-photochemical quenching (FNPQ), and light lost to non-regulated processes (FNO) were determined in this study. The three light-adapted parameters indicated the proportions of allocation of the energy absorbed by photosystem II. The sum of the three light-adapted parameters was one (FII + FNPQ + FNO = 1) (Kramer et al., 2004).
Thirty days after transplanting, plant height and tiller number were recorded. During the reproductive growth stage, flowering date was recorded as the number of days required to achieve 50% flowering after transplanting by frequent visual observation.
All plants were harvested at the physiological maturity stage and plant materials were separated into grains, rachises, flag leaves, other leaves, stems, and roots. Grains were air-dried and expressed as the rough grain weight per pot. The filled spikelets were separated from the unfilled spikelets using water, and the percentage of filled grains was calculated. Other plant materials were oven-dried at 70°C for 2 days to determine the shoot and root dry weights. The harvest index (HI) was calculated as grain yield divided by straw plus grain yield. The P harvest index (PHI) was calculated as P accumulation in the grain divided by P in the grain plus straw. The P concentration in grains and other plant parts was analyzed using the molybdate blue method (Murphy and Riley, 1962) after dry ashing at 550°C for 2 h and digesting with 0.5 M HCl. Phosphorus uptake was calculated by multiplying the P concentration by the dry weight.
Grain color was measured using a Grain Scanner (Satake Engineering Co., Ltd., Tokyo, Japan). Approximately 5 g of grains from each sample were scanned as an image and the color values per sample were averaged. The color of the rice grain samples was measured using the CIE-Lab system, an internationally recognized color system adopted by the Commission Internationale d’Eclairage (CIE). The CIE-Lab system is expressed in terms of tristimulus parameters—L*, a*, and b*. The CIE value of L* represents the “lightness” or “luminance” component, wherein a score of 100 implies white and 0 implies black. The a∗ values indicate red to green chromatic colors, with “+” and “–” values indicating “redness” and “greenness,” respectively. The b∗ values indicate yellow to blue colors, with “+” and “–” values indicating “yellowness” and “blueness,” respectively.
Dehulled rice grains (0.2 g, oven-dried at 70°C) were digested in a 3-ml solution of nitric and perchloric acid (3:1) under sequential thermal conditions: 105°C for 40 min, 140°C for 30 min, and 165°C for 30 min. The final volume was made up to 20 mL using Milli-Q water. The Zn and Fe concentrations in the extractant were determined with an inductively coupled plasma emission spectrometer (ICPE-9000, Shimadzu, Japan) using a calibration curve based on Zn and Fe standard solutions (Wako, Japan).
Phytic acid analysis was conducted according to the method reported by Matsuo et al. (2005) with some modifications. Dehulled rice grains (3 g) were ground using an Automill TK-AM5 (Tokken Inc., Chiba, Japan). The grains were set in the grinding container and chilled in a freezer at −80°C prior to the grinding. The ground powder samples were stored at −20°C until analysis. The sample (0.3 g) was mixed with 1.2 mL of 0.8 N HCl in a 5-ml microcentrifuge tube and vortexed at 2,400 rpm for 1 h at 4°C using a Multi-Tube Vortexer BSR-MTV100 (Bio Medical Science, Tokyo, Japan), followed by centrifugation at 18,000 × g for 15 min at 4°C. The clear supernatant (15 μL) was mixed with 285 μL of sterilized reverse osmosis water in a 1.5-ml microcentrifuge tube and heated at 100°C for 20 min, followed by centrifugation at 18,000 × g for 15 min at 4°C. The clear supernatant was filtered through a 0.22 μm membrane filter and subjected to high performance liquid chromatography (HPLC) using a binary HPLC system equipped with an anion-exchange column, TSKgel DEAE-5PW (7.5 mm φ × 75 mm, Tosoh Corporation, Tokyo, Japan). Phytic acid, in an injected sample (100 μL), was eluted with a linear gradient of 0.01 M HNO3 to 0.4 M NaNO3 and 0.01 M NaNO3 in 40 min at a flow rate of 1.0 mL/min. Eluted phytic acid was reacted with Wade reagent (0.06% FeCl3∙6H2O, 0.3% sulfosalicylic acid) in a post-column tube at a flow rate of 0.5 mL/min, and the decrease in absorbance at 500 nm due to phytic acid was measured. The phytic acid concentration in an injected sample was calculated using standard solutions at concentrations of 0.1, 0.2, 0.3, and 0.5 mg/mL.
Black rice contains numerous flavonoids such as cyanidin 3-glucoside, which belong to a large family of phenolic compounds (Yawadio et al., 2007). For cereal crops, the antioxidant activities were reported to be correlated with total phenol (Velioglu et al., 1998) and flavonoid content (Qui et al., 2009). Therefore, we analyzed the total flavonoid and phenol content to estimate antioxidant activity.
The dehulled rice grain powder (0.1 g) was transferred to a microtube containing 1 mL of 80% methanol. After centrifugation at 10,000 × g for 10 min, the supernatant was pooled and used to determine the total phenolic and flavonoid content.
The total phenolic content of the dehulled grains was measured following the method described by Dewanto et al. (2002). Briefly, the extract (0.1 mL) was mixed with 0.2 mL Folin–C iocalteu’s phenol reagent at room temperature. Subsequently, 3 mL of 5% Na2CO3 was added to the mixture and allowed to stand for 1 h in the dark. Absorbance was measured at 760 nm using a microplate reader (Multiskan GO, Thermo Scientific, Tokyo, Japan). Gallic acid was used as a standard, and the total phenolic content was expressed as milligram gallic acid equivalents (GAE) per gram of flour weight.
The total flavonoid content of dehulled grains was measured following the method described by Jia et al. (1999). First, the extracted sample (0.5 mL) was mixed with 75 μL of 5% NaNO2 and incubated for 5 min at room temperature. The mixture was then sequentially mixed with 150 μL of 10% AlCl3, 500 μL of 1 M NaOH, and 275 μL of distilled water. Absorbance was measured at 510 nm using a microplate reader. Quercetin was used as a standard, and the total flavonoid content was expressed as milligram quercetin equivalents (QE) per gram of flour weight.
To assess the reproducibility of the effect of P application on the grain yield and functionality of black rice, a similar pot experiment was performed in the second year (2022). In this experiment, we tested four P treatments (P100, P250, P500, and P1000). We omitted the P0 treatment which showed no difference from the P100 treatment, and the additional top dressing of P with the P1000 treatment (P1300) which showed no difference from the P1000 treatment. The measured parameters were determined in the same manner as described for the first year (2021).
Analysis of variance (ANOVA) was performed using the JMP software (v14.0.0, SAS Institute Inc., Japan). Two-way ANOVA was performed for all the measured parameters (n = 60) with P application and variety as fixed factors and replicates as a random factor. One-way ANOVA was performed to assess the response of each rice cultivar to different P application rates. The treatment means were compared at the 5% probability level using Tukey’s honestly significant difference (HSD) test.
Under P-deficient conditions, the grain yield of black rice (3.5 g pot−1) was significantly lower than that of white rice (14.6 g pot−1) (Figure 1A). Phosphorus fertilization significantly increased the grain yield of both rice varieties. The minimum P application rate required to achieve a high grain yield in black rice was 250 mg P2O5 pot−1, which was considered the optimal rate. Subsequent P additions beyond the optimal level resulted in no statistical difference in grain yield and were considered as excess P supply in black rice (Supplementary Figure S1). White rice required twice the optimal P application rate, that is 500 mg P2O5 pot−1, to achieve a high grain yield. Black rice grain yield was significantly lower than that of white rice for all P treatments. The results of the second experiment confirmed that the grain yield at the optimal P250 treatment was statistically similar to that at higher P application rates in black rice (Supplementary Table S1).
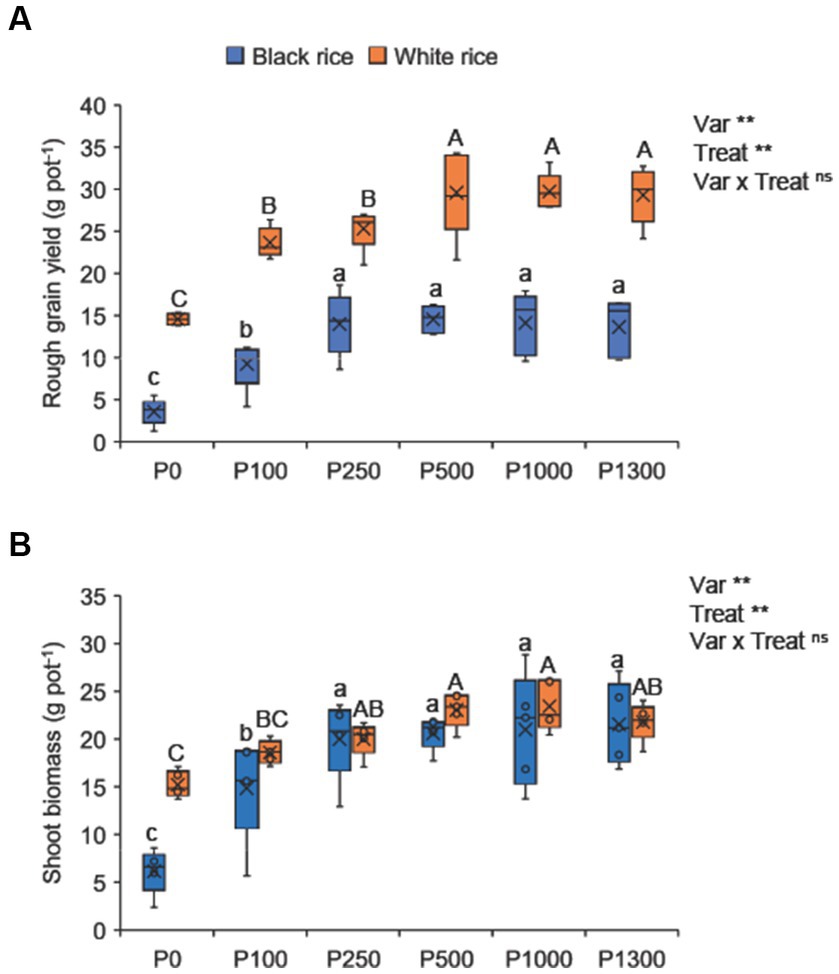
Figure 1. Effect of P application rates on grain yield (A) and shoot biomass (B) of black and white rice. A one-way ANOVA was also performed to assess the response of each rice cultivar to the different P application rates. Different lowercase and uppercase letters above the bars represent significant differences within each variety at 5% of Turkey’s HSD test. The *, **, and ns indicate significance at p < 0.05, p < 0.01, and non-significant, respectively. P0: no P application, P100: 100 mg P2O5 pot−1, P250: 250 mg P2O5 pot−1, P500: 500 mg P2O5 pot−1, P1000: 1000 mg P2O5 pot−1, P1300: 1300 mg P2O5 pot−1.
Under low P supply, the shoot biomass of black rice was relatively lower than that of white rice (Figure 1B). Phosphorus application considerably increased the shoot biomass in black rice, which was comparable to that of white rice at all P application rates. Most applied P was apparently used for high biomass production in black rice. Consequently, the HI of black rice was lower than that of white rice (Supplementary Table S2).
Low P supply significantly reduced the number of panicles and filled grains, filled grain rate, and 1,000 grain weight, and the effect was more pronounced for black rice than for white rice (Supplementary Table S2). In contrast, P application increased panicle and filled grain number and rate, and 1,000 grain weight. However, P supply beyond the optimal rate did not further improve the measured yield component parameters.
In black rice, P application significantly increased plant height compared to that of the control; however, plant height did not differ significantly under different P application rates (Supplementary Table S3). In contrast, P application did not affect plant height in white rice. Although P application significantly increased the tiller number in both the rice varieties, the average tiller number for black rice (2.6) was lower than that for white rice (7.2) in P-deficient soil (P0). An increase in tiller number was observed up to P250 treatment in black rice and up to P500 treatment in white rice; however, further response beyond these rates was not observed.
Low P supply delayed phenological development, requiring up to 54 and 74 days for 50% flowering in black and white rice, respectively (Supplementary Table S3). Moreover, P application significantly reduced the number of days to heading by 5–7 days for black rice and 13–16 days for white rice.
Phosphorus application significantly affected the quantum efficiency of Photosystem II (FII) and quantum yield of regulated energy dissipation of photosystem II (FNPQ) in both the rice varieties (Figure 2). The treatment had no effect on the quantum yield of non-regulated energy dissipation of photosystem II (FNO). Moreover, low P supply substantially reduced FII and increased FNPQ compared to that by high P supply. Black rice showed higher FII values with a narrower range (ranging from 0.53 to 0.61) than white rice (ranging from 0.48 to 0.60), indicating its superior adaptability to the P-deficient environment in terms of photosynthetic efficiency.
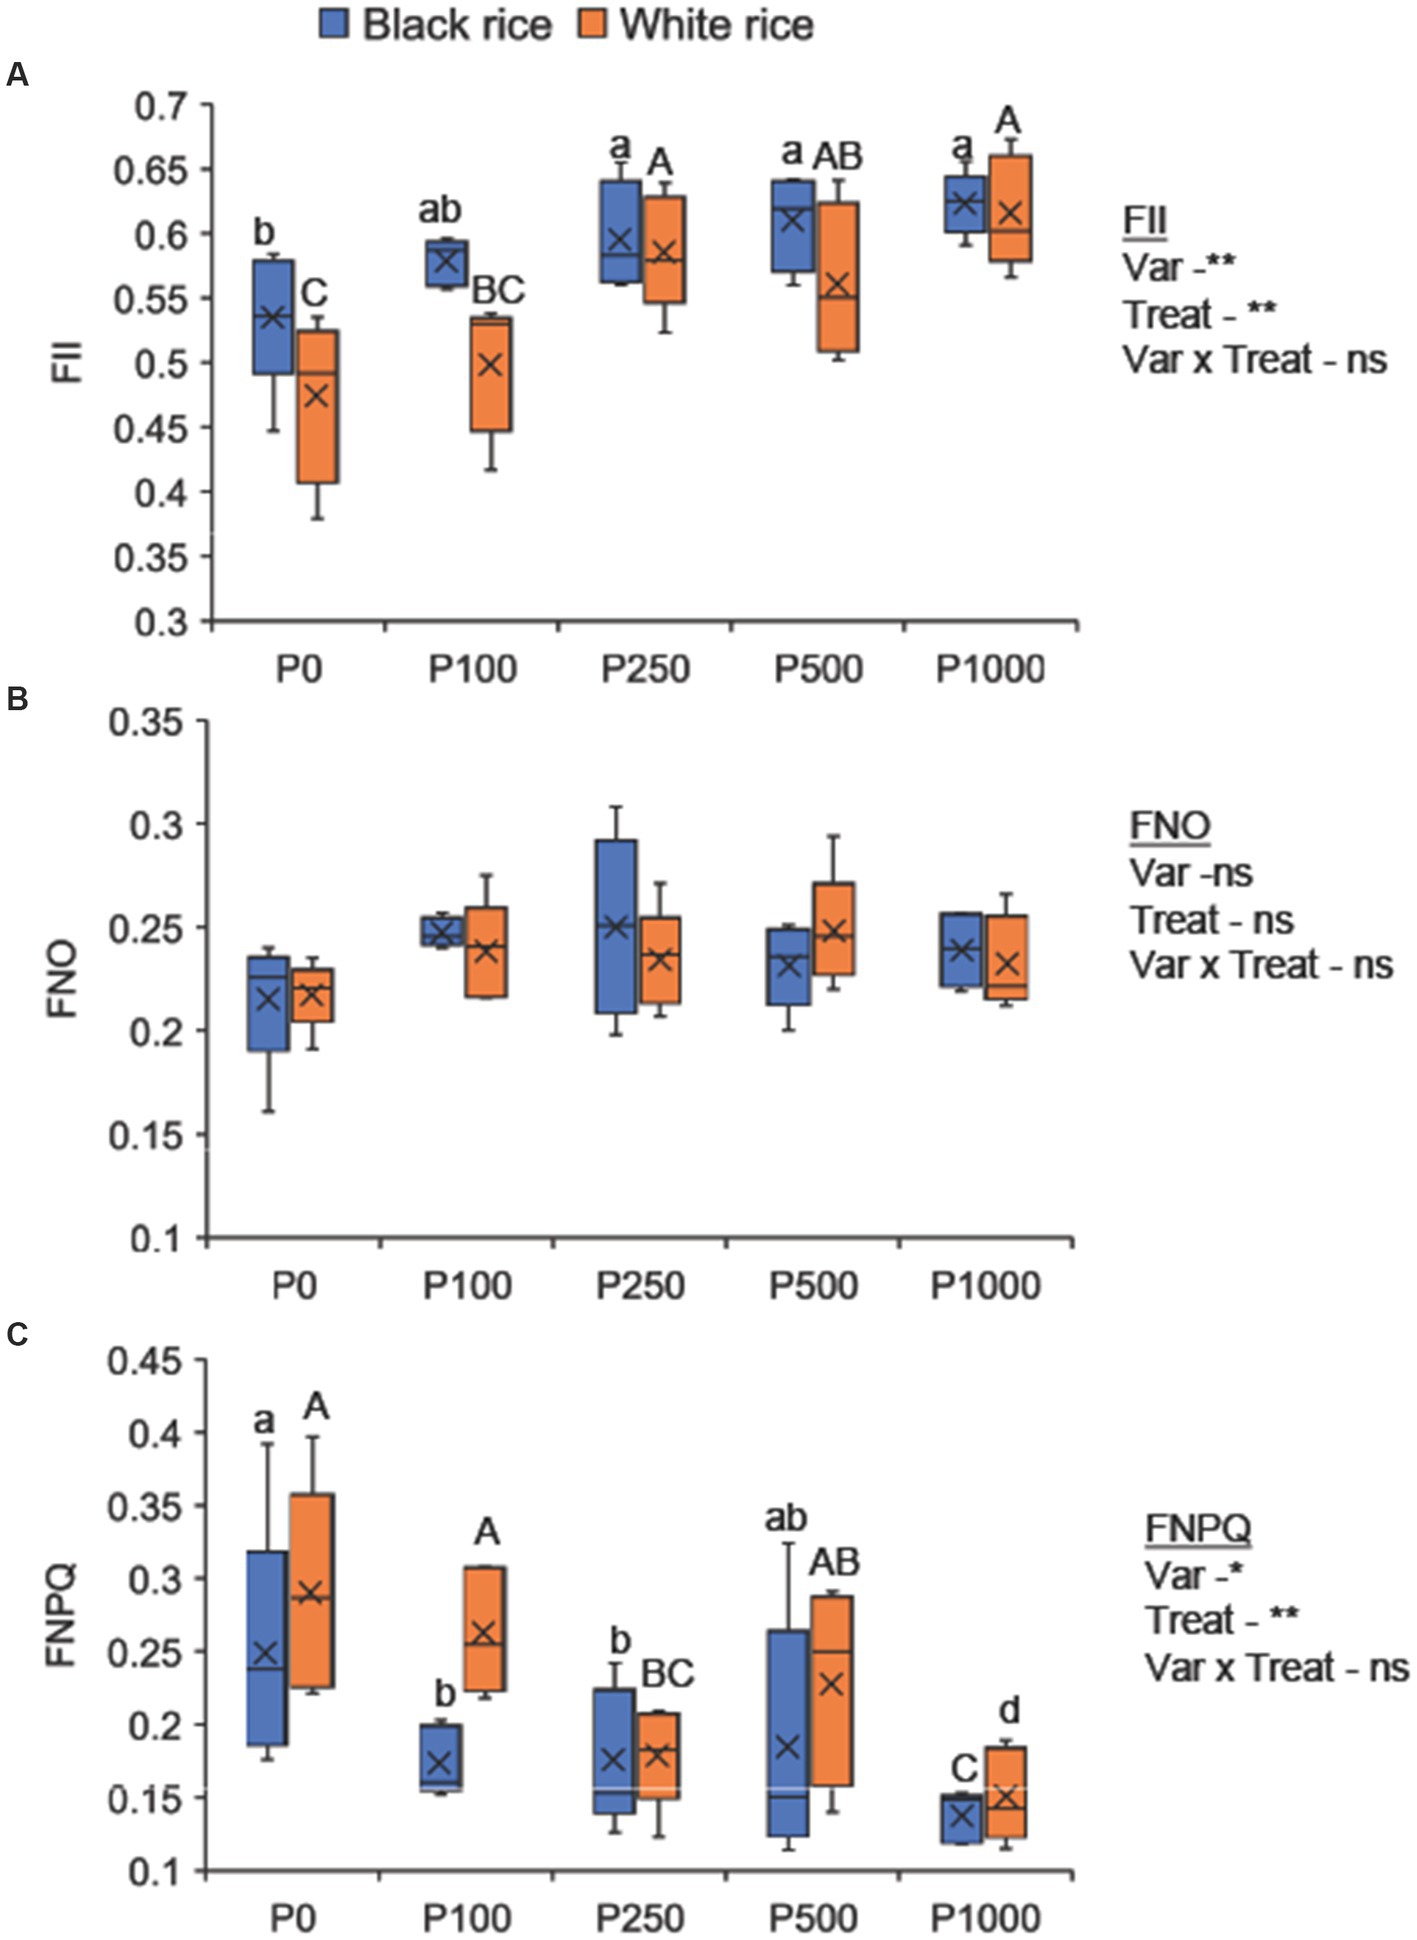
Figure 2. Effect of P application rates on FII (A), FNO (B), and FNPQ (C) of black and white rice after 30 days of transplanting. A one-way ANOVA was also performed to assess the response of each rice cultivar to the different P application rates. Different lowercase and uppercase letters above the bars represent significant differences within each variety at 5% of Turkey’s HSD test. P0: no P application, P100: 100 mg P2O5 pot−1, P250: 250 mg P2O5 pot−1, P500: 500 mg P2O5 pot−1, P1000: 1000 mg P2O5 pot−1. P1300 treatment was excluded assuming that it was the same as P1000 treatment due to the application of an additional 300 mg P2O5 at flowering time. The *, **, and ns indicate significance at p < 0.05, p < 0.01, and non-significant, respectively.
Phosphorus concentrations of various tissues differed between the two rice varieties at maturity (Supplementary Table S4). Phosphorus concentrations were higher in all plant parts of black rice than those of white rice. In black rice, tissue P concentrations were in the order of grain > leaves (flag leaves + other leaves) > stem > roots, and those in white rice were grain > leaves (flag leaves + other leaves) > roots > stem. The amount of P accumulated in the grains was higher under low to moderate P application rates (P0–P500), and 71.8–77.3% of the aboveground P was present in the grains of black rice (Figure 3). Higher P application rates (1000–P1300) led to the reduced total P content in the grains (45.8–62.9% of the aboveground P was present in the grains) and increased P content in the stem and leaves.
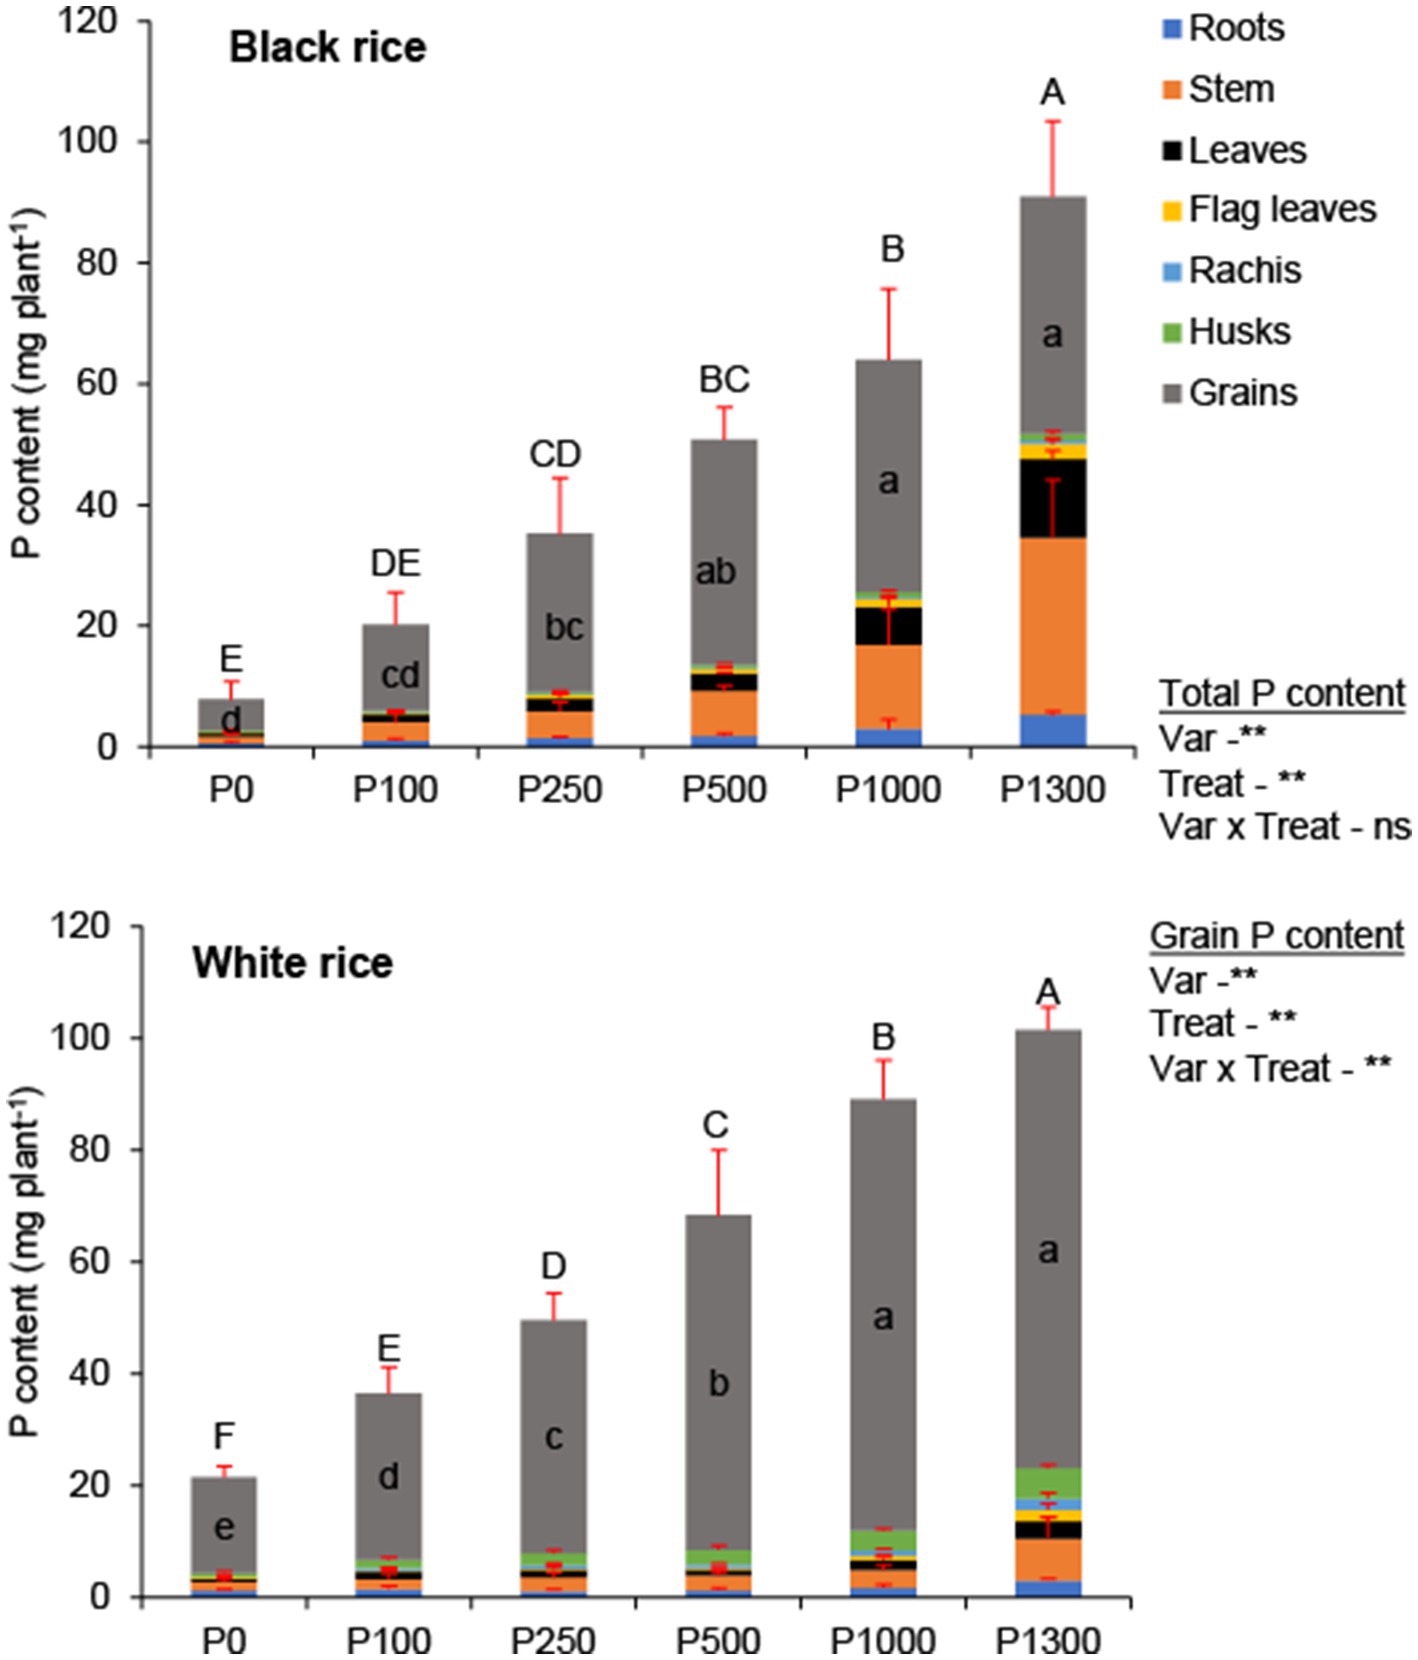
Figure 3. Effect of P application rates on P content of seven different rice tissues at maturity of black and white rice. Error bars represent the standard deviation. A one-way ANOVA was also performed to assess the response of each rice cultivar to the different P application rates. Different small and capital letters represent significant differences for grain and total P content, respectively, at 5% of Turkey’s HSD test. The *, **, and ns indicate significance at p < 0.05, p < 0.01, and non-significant, respectively. P0: no P application, P100: 100 mg P2O5 pot−1, P250: 250 mg P2O5 pot−1, P500: 500 mg P2O5 pot−1, P1000: 1000 mg P2O5 pot−1, P1300: 1300 mg P2O5 pot−1.
In white rice, the proportion of total P in the grains was high under all P treatments, and 79.6–89.2% of the aboveground P was accumulated in the grains. Owing to the high P loading in the grains of white rice than that in the grains of black rice, PHI was greater for the former than that for the latter at all P application rates (Supplementary Table S2). In contrast, the PHI showed a decreasing trend in black rice at rates greater than the optimal application rate (P250).
Under no P supply, the grain phytic acid concentration of black rice was 40% higher than that of white rice (Figure 4). Phosphorus application significantly increased grain phytic acid concentration by 12–156% in black rice and by 8–225% in white rice. At the optimal P rate (P250), high grain yield and low grain phytic acid concentration were observed in black rice (Supplementary Figures S1A,B). Subsequent P additions, beyond the optimal level, substantially increased the grain phytic acid and P concentrations (Supplementary Figures S1B, S3). Black rice consistently showed significantly higher grain phytic acid concentrations than white rice at all P application rates. The repeated experiments confirmed a similar trend in the grain phytic acid concentration in black rice (Supplementary Table S1).
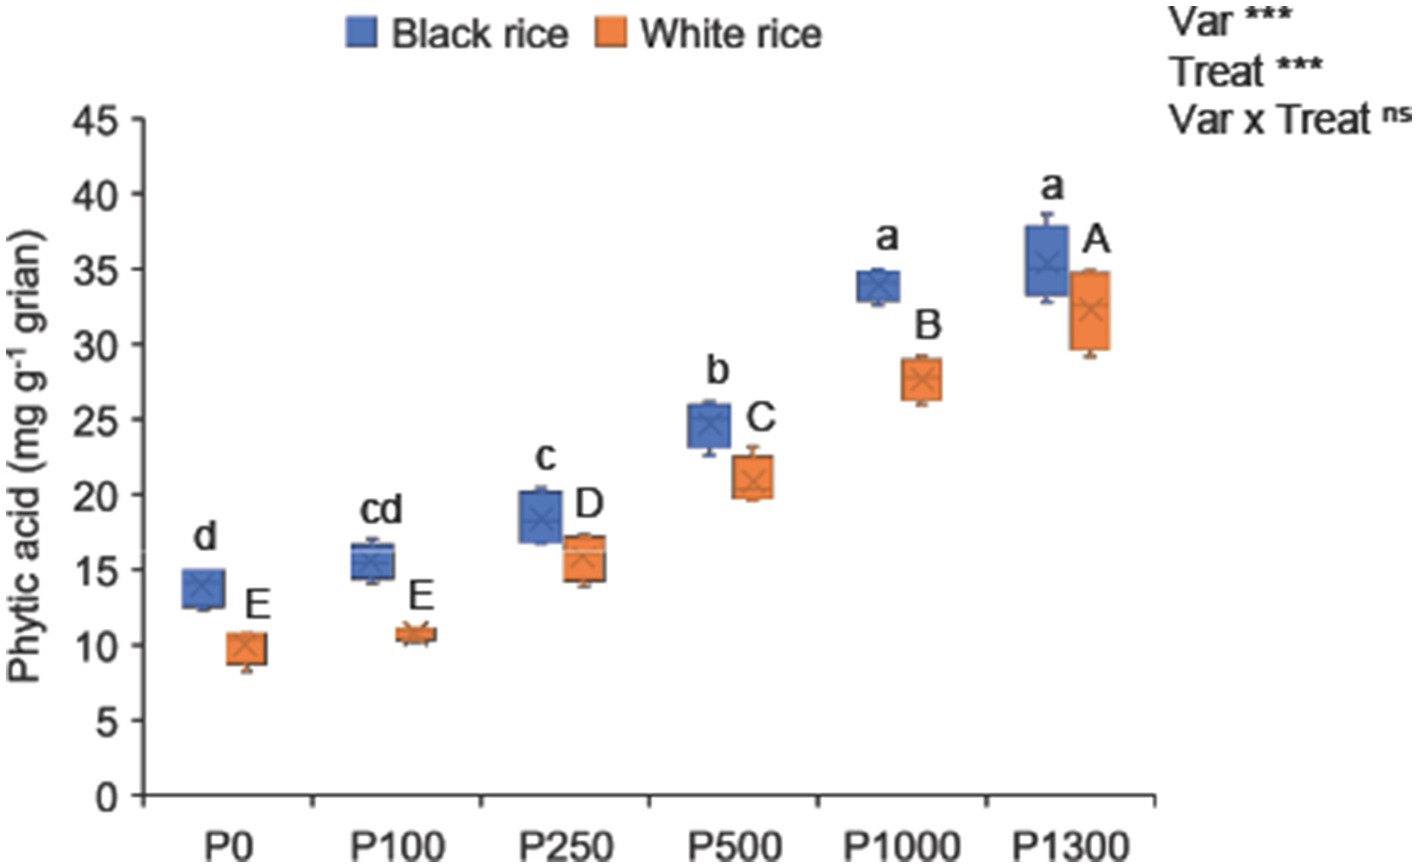
Figure 4. Effect of P application rates on grain phytic acid concentration of black and white rice. A one-way ANOVA was also performed to assess the response of each rice cultivar to the different P application rates. Different lowercase and uppercase letters above the bars represent significant differences within each variety at 5% of Turkey’s HSD test. The *, **, and ns indicate significance at p < 0.05, p < 0.01, and non-significant, respectively. P0: no P application, P100: 100 mg P2O5 pot−1, P250: 250 mg P2O5 pot−1, P500: 500 mg P2O5 pot−1, P1000: 1000 mg P2O5 pot−1, P1300: 1300 mg P2O5 pot−1.
In black rice, low P supply caused darker grain color, thereby resulting in lower lightness values (L*) (Figure 5 and Supplementary Figure S2). Phosphorus application significantly increased the lightness value (L*); the higher the P rate, the greater the lightness value. Phosphorus application over 100 mg P2O5 pot−1 significantly increased the red-green chromatic color (a*) of black rice and tended to enhance red color formation. Similarly, P application also significantly increased the yellow-blue chromatic color (b*) of black rice, indicating the formation of a light-yellow color under excessive P application. In contrast, no significant differences were observed in grain color parameters (L*, a*, and b*) in white rice under the different P application rates.
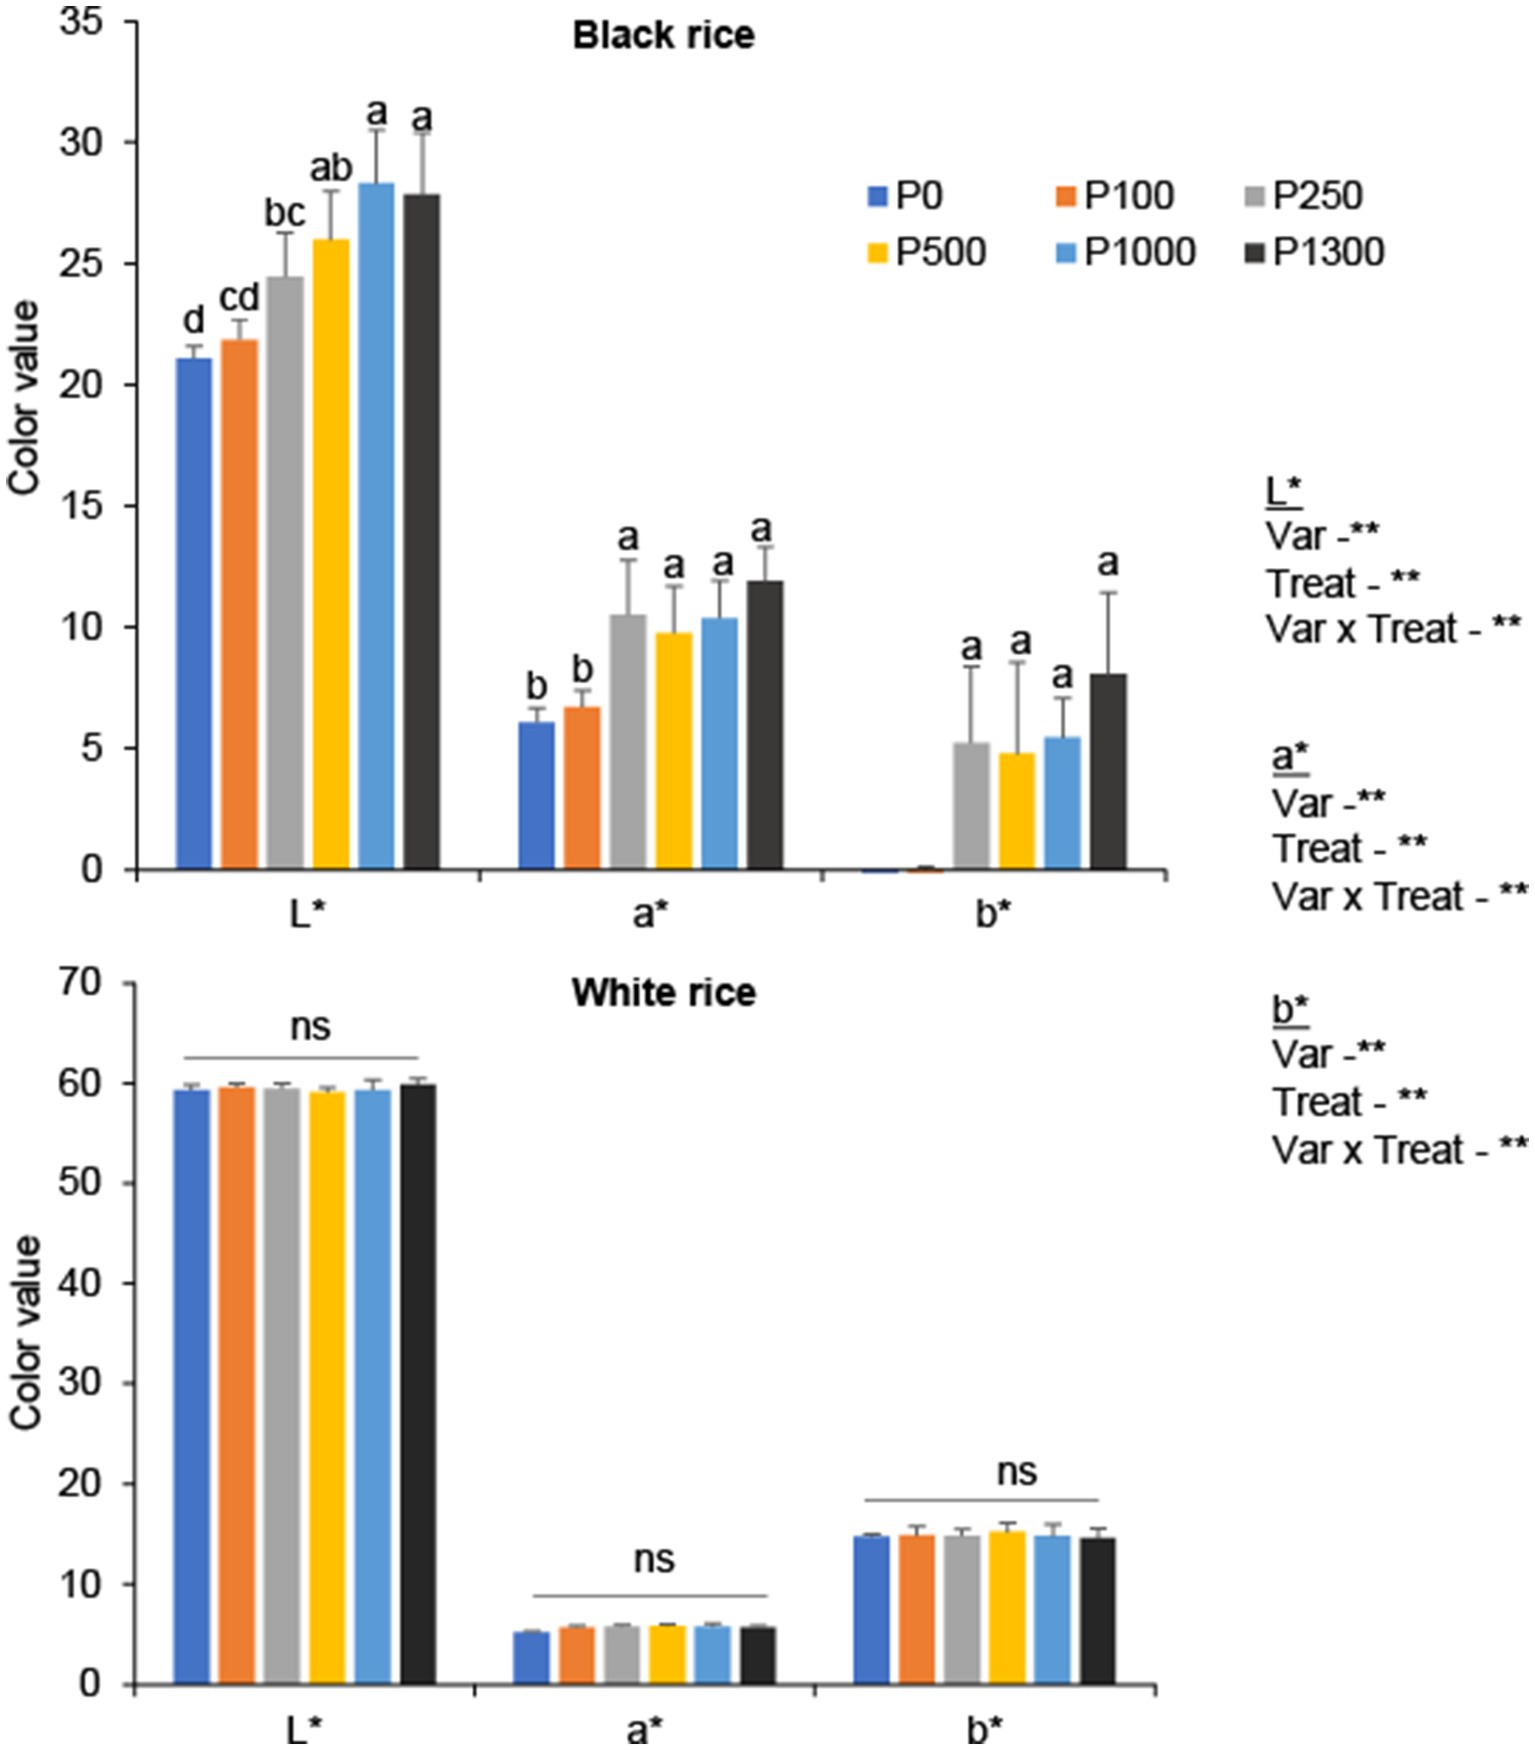
Figure 5. Grain color parameters (L*: the lightness (100 = white, 0 = black), a*: redness-greenness, b*: yellowness – blueness) of black and white rice in response to P application rates. Error bars represent the standard deviation. A one-way ANOVA was also performed to assess the response of each rice cultivar to the different P application rates. Different letters above the bars represent significant differences among the treatments at 5% of Turkey’s HSD test. The *, **, and ns indicate significance at p < 0.05, p < 0.01, and non-significant, respectively. P0: no P application, P100: 100 mg P2O5 pot−1, P250: 250 mg P2O5 pot−1, P500: 500 mg P2O5 pot−1, P1000: 1000 mg P2O5 pot−1, P1300: 1300 mg P2O5 pot−1.
In black rice, low P (P0–P100) application rate resulted in the highest grain phenolic content (9.0–10.2 mg GAE g−1), followed by 6.9–7.4 mg GAE g−1 under moderate P application rates (P250–P500) and 5.6–5.8 mg GAE g−1 under higher P application rates (Figure 6A). Although the magnitude was small, P application increased the phenolic content in white rice grains. The total phenolic content of black rice was 2.2 times higher than that of white rice.
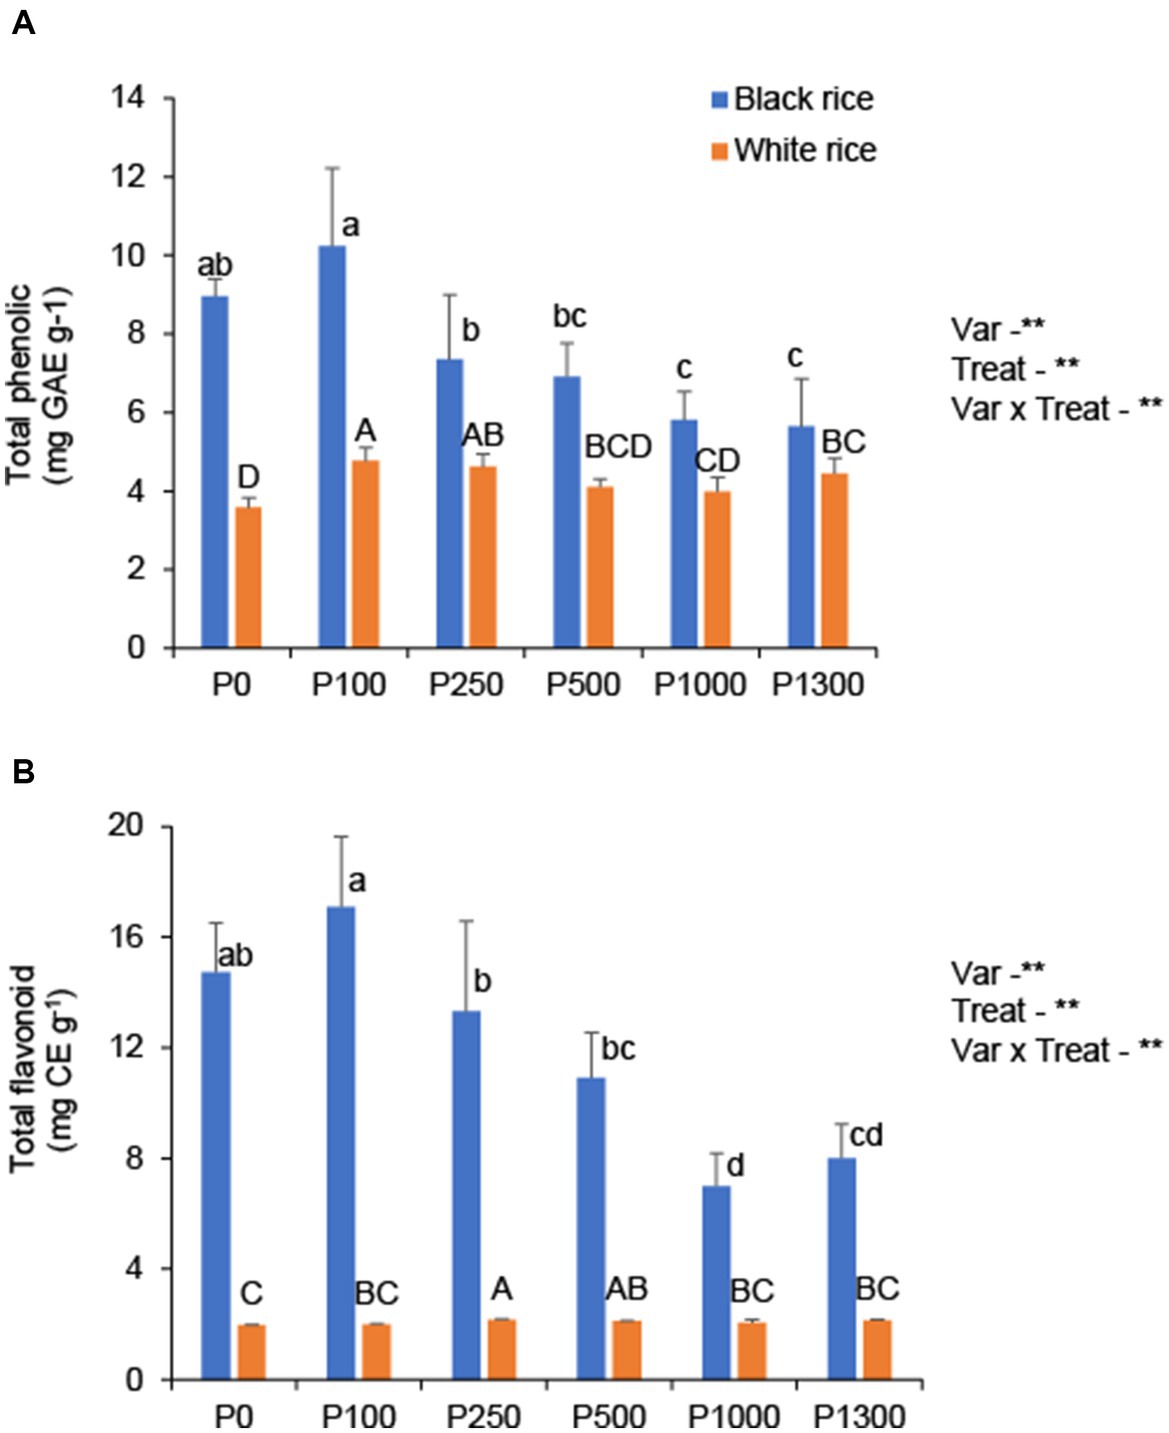
Figure 6. Effect of P application rates on grain total phenolic (A) and flavonoid content (B) of black and white rice. Error bars represent the standard deviation. A one-way ANOVA was also performed to assess the response of each rice cultivar to the different P application rates. Different lowercase and uppercase letters above the bars represent significant differences within each variety at 5% of Turkey’s HSD test. The *, **, and ns indicate significance at p < 0.05, p < 0.01, and non-significant, respectively. P0: no P application, P100: 100 mg P2O5 pot−1, P250: 250 mg P2O5 pot−1, P500: 500 mg P2O5 pot−1, P1000: 1000 mg P2O5 pot−1, P1300: 1300 mg P2O5 pot−1.
In black rice, low P supply (P0–P100) resulted in the highest grain flavonoid content (14.7–17.1 mg QE g−1), followed by 10.9–13.3 mg QE g−1 under moderate P supply (P250–P500) and 7.0–8.0 mg QE g−1 at high P application rates (Figure 6B). However, the opposite trend was observed in white rice, where P application increased the flavonoid content; however, the increase was negligible. The flavonoid content of black rice was 4.2 times higher than that of white rice. In addition, a lighter grain color negatively affected the grain phenolic and flavonoid contents in black rice, as the L* value increased with higher P application rates (Supplementary Figure S4). The repeated experiments confirmed a similar trend in the total phenolic and flavonoid contents in black rice (Supplementary Table S1).
Phosphorus application did not affect the grain Zn content, and no interaction effect between variety and P application was observed (Table 1). Black rice had a higher grain Zn content (53%) than white rice. A significant effect of variety and P treatment on the grain Fe content was observed; however, there was no interaction between the two. Grain Fe content increased at low to optimal P rates, and the effect was significant in black rice. Conversely, Fe content decreased at higher P application rates in both rice varieties. At different P application rates, the Fe content of black rice, on average, was 24% higher than that of white rice.
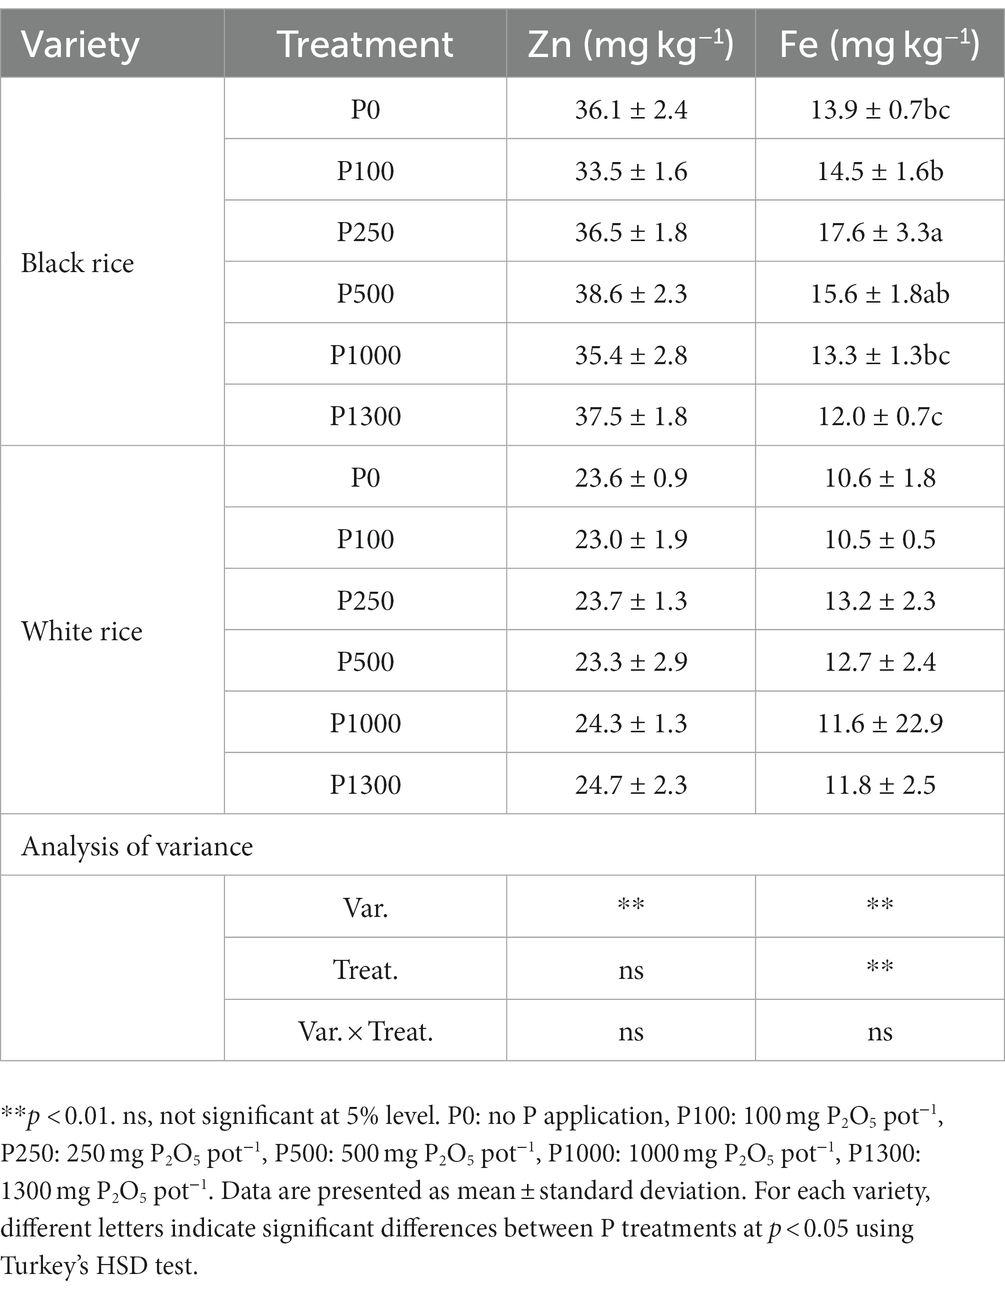
Table 1. Effect of P application rates on grain Zn and Fe content of black and white rice.
Our findings clarified that P application strongly influenced yield and growth parameters as well as the grain nutrient parameters, namely antioxidant activity parameters and phytic acid content, except for the Zn and Fe content. These results suggest that soil P management is a key factor in the sustainable production of high-quality black rice.
The application of P accelerates phenology development in both black and white rice, with higher P rates resulting in faster flowering. Phosphorus deficiency delayed heading by 5–16 days, consistent with that reported by other authors (Rakotoarisoa et al., 2020; Andrianary et al., 2021). This is because P plays a critical role in the development of reproductive tissues. The extended growth period due to the delayed flowering should allow the plant to continue to accumulate biomass when not exposed to biotic and abiotic stresses (Rakotoarisoa et al., 2020). Therefore, an extended growing season could favor an increased rice yield under field conditions. However, Van Oort (2018) stipulated that a longer growth period would only extend the vegetative phase of rice growth, and a longer duration for a sink-limited crop would provide little yield gain. This was also observed in the current study. Moreover, as the production costs (irrigation and weeding) are often highly related to crop duration, a longer duration due to low nutrient (P) supply may not be profitable.
In both black and white rice, P application significantly increased shoot biomass, tiller number, and photosynthetic efficiency, resulting in improved grain yield (Figure 1), as has been reported in many previous studies (Fageria et al., 2013; Taliman et al., 2019; Andrianary et al., 2021; Kurnia, 2021). In this study, varietal difference was observed in the optimal P rate. The P amount required to achieve high yield was lower for black rice (250 mg P2O5) than that for white rice (500 mg P2O5). However, black rice was inferior in grain yield and growth parameters at all P rates than white rice. The P requirement could be partially related to the yield potential, and it is empirically known that black rice has lower grain yield than white rice. The high P requirement of high-yielding white rice is a result of their high growth rate, and numerous grains, which require more nutrients to grow and mature properly. Considering the high P requirement for white rice, the low P requirement for black rice is highly desirable for adaptation to infertile and low-input environments where P supply is limited. From an agronomic perspective, this could be one of the reasons why black rice is traditionally grown in infertile environments. However, due to the limited number of varieties tested, further surveys are needed to verify the adaptability of black rice to soil P deficiency.
The oversupply of P fertilizer beyond the optimal P rate contributed poorly to yield improvement and biomass accumulation in both black and white rice (Figure 1). However, it accelerated P uptake by the plants, especially via an increase in grain P storage (Figure 3 and Supplementary Table S4), of which the majority is conserved as phytic acid (Raboy, 2001). Consequently, a rapid increase in grain phytic acid content was observed (Figure 4). This trend was more pronounced in black rice than in white rice. This varietal difference may be partially explained by the process of P translocation (Supplementary Table S4). A considerable amount of P is remobilized from vegetative tissues to grains at the grain-filling stage (Julia et al., 2016). The observed patterns of P partitioning clearly demonstrated a larger P source in the vegetative tissues to mobilize more P to the grain (Figure 3). Thus, a high grain P concentration was related to high grain phytic acid concentration in black rice (Figure 4 and Supplementary Table S4).
Phytic acid inhibits the absorption of micronutrients (Gupta et al., 2015). Therefore, the lower phytic acid accumulation observed in black rice grown under P deficient conditions is highly favorable for producing nutrient-rich black rice. To date, scientific efforts have been made to reduce the grain phytic acid content. Yamaji et al. (2017) first succeeded in achieving a 20–30% reduction in the grain phytic acid content by creating knockout lines of P distribution transporters. In contrast to molecular approach, the present study showed that agronomic manipulation to control soil P availability resulted in a 37–44% reduction in grain phytic acid content at low P application rates (0–100 mg P2O5). Also, it achieved a 25% reduction in grain phytic acid content at the optimal P rate (250 mg P2O5) without a decrease in yield compared to the yield at a P application rate of 500 mg P2O5 (Figure 4). Black rice growers could easily accept this agronomic approach, because it has great potential for reducing grain phytic acid concentration, it can be easily practiced without new variety adoption, and the optimal application of P fertilizer is beneficial for cost savings. For grain quality improvement, further reduction in grain phytic acid level might be achievable with the combination of agronomic and molecular approaches. On the contrary to grain quality perspective, phytic acid is an essential P source for plant growth at germination stage (White and Veneklaas, 2012; Oo et al., 2023). Therefore, further survey is required to assess how the grain phytic acid reduction influenced the seed germination and the initial growth in terms of productivity.
In black rice, the Fe concentration of the grain improved at the optimal P application rate but decreased with the increase in P fertilizer rate (Table 1). Moreover, it will further reduce the bioavailability of Fe to the grain (Lazarte et al., 2015; Zhang et al., 2017), partly due to excessive grain P/phytic acid concentration. However, the Zn concentration of the grain was not affected by P application rates in this study, which is consistent with the results of the meta-analysis by Zhang et al. (2021). They reported that P application did not reduce the Zn concentration in rice; however, reduction in the Zn concentration was more remarkable in the grain of upland crops. This difference is because the mobilization of P and Zn in lowland rice soils is greater than that in the soils of upland crops (Faye et al., 2006). Given the limited supply of micronutrients in most agricultural soils, increasing the Fe and Zn concentrations in black rice grains compared with that in white rice would further improve the nutritional quality of black rice.
The negative relationship of P application rate with total flavonoid and phenolic contents clearly suggested that less P availability enhanced antioxidant parameters. Flavonoid accumulation is related to the plant tolerance-defense response mechanism to abiotic stress conditions (Morcuende et al., 2007; Tominaga Wada et al., 2018; He et al., 2021), which is consistent with our photosynthesis data that showed a decline in the quantum efficiency of Photosystem II at low P application rates (Figure 2), indicating that the observed flavonoid accumulation could be promoted by abiotic stress of soil P deficiency. This result was further supported by grain color analysis, which showed that high P application rate increased the lightness value (L*), thus leading to lighter grain color and instability of black rice (Supplementary Figure S2). Therefore, oversupply of P negatively affected the accumulation of anthocyanins in black rice grains. Conversely, low P conditions decreased the lightness value and the grain color darkened owing to the increased accumulation of anthocyanins.
In addition to the antioxidant and nutrient content of rice grains, visible grain color is an important characteristic that determines the market value of the grains. The results showed that P application significantly affected the grain color parameters (L*, a*, and b*) in black rice (Figure 5). Under low soil P conditions, black rice may experience a stress response that triggers the production of anthocyanins, a type of flavonoids. Thus, black rice may produce more anthocyanins in response to P stress, thereby decreasing the lightness value. This is because anthocyanins have been shown to have a protective effect on plants under P stress conditions as shown in other studies under abiotic stress conditions such as low N availability, drought, and high light intensity (Li et al., 2017; Liang and He, 2018). As grain color is a measure of visual quality, the lighter color of black rice produced under high P application would reduce grain quality, thus affecting the market price and directly affecting growers’ income. Therefore, this study underscores that low-to-optimal P addition would improve the visual quality of the grain, thereby increasing the market value of black rice.
The results showed that the growth of black rice in P-deficient soils was poorer than that of white rice, exhibiting stunted growth, low tillering capacity, and low photosynthetic efficiency, even with high anthocyanin content. Although the grain yield was significantly affected, P stress significantly increased grain antioxidant levels and decreased phytic acid accumulation in black rice, resulting in a high nutritional quality. Black rice required a low optimal P application rate (250 mg P2O5) to achieve a high grain yield while maintaining high levels of antioxidants and Fe in the grains. In contrast, white rice required a high optimal P input (500 mg P2O5) to produce high grain yield. High P application rates should be avoided, as they lead to increased grain phytic acid accumulation without increasing the grain yield and antioxidant levels, particularly in black rice. The results indicate that effective P fertilizer management is crucial to reduce grain phytic acid content while improving grain yield and nutrient bioavailability of black rice to enhance its nutritional quality for human consumption. However, the present study only performed greenhouse trials on specific rice varieties. Furthermore, although the pot trials confirm the need for P management, optimization needs to be practiced site-specifically because of the on-site heterogeneity of soil P availability. Therefore, further studies to test more varieties and site-specific P management are warranted to optimize P fertilization and improve the grain yield and nutritional quality of black rice grown under P-deficient field conditions.
The original contributions presented in the study are included in the article/Supplementary materials, further inquiries can be directed to the corresponding authors.
AZ, HA, JM, TT, and HS designed the research. AZ and HA performed the experiment. AZ, HA, KK, JM, KN, and JP-T took samples and performed the laboratory work. AZ and KW performed data analysis. AZ and HA wrote the manuscript. All authors contributed to the article and approved the submitted version.
This research was funded by the JIRCAS research program “Indigenous crops and food design” and JSPS KAKENHI Grant Number “JP22K05942”.
The authors thank Ms. Mayumi Yonemura, Ms. Emiko Kojima, and Ms. Mari Momma, Japan International Research Center for Agricultural Sciences (JIRCAS), for performing the plant and grain analysis.
The authors declare that the research was conducted in the absence of any commercial or financial relationships that could be construed as a potential conflict of interest.
All claims expressed in this article are solely those of the authors and do not necessarily represent those of their affiliated organizations, or those of the publisher, the editors and the reviewers. Any product that may be evaluated in this article, or claim that may be made by its manufacturer, is not guaranteed or endorsed by the publisher.
The Supplementary material for this article can be found online at: https://www.frontiersin.org/articles/10.3389/fsufs.2023.1200453/full#supplementary-material
Andrianary, B. H., Tsujimoto, Y., Rakotonindrinaa, H., Oo, A. Z., Rabenarivoa, R., Ramifehiarivoa, N., et al. (2021). Phosphorus application affects lowland rice yields by changing phenological development and cold stress degrees in the central highlands of Madagascar. Field Crops Res. 271:108256. doi: 10.1016/j.fcr.2021.108256
Batjes, N. H. (2011). Global distribution of soil phosphorus retention potential. Wageningen, ISRIC—World Soil Information (with dataset), ISRIC Report 2011/06.
Bryant, R. J., Dorsch, J. A., Peterson, K. L., Rutger, J. N., and Raboy, V. (2005). Phosphorus and mineral concentrations in whole grain and milled low phytic acid (lpa)1-1 rice. Cereal Chem. 82, 517–522. doi: 10.1094/CC-82-0517
Chunthaburee, S., Sanitchon, J., Pattanagul, W., and Theerakulpisut, P. (2015). Effects of salt stress after late booting stage on yield and antioxidant capacity in pigmented rice grains and alleviation of the salt-induced yield reduction by exogenous spermidine. Plant Prod. Sci. 18, 32–42. doi: 10.1626/pps.18.32
Dewanto, V., Wu, X., Adonm, K. K., and Liu, R. H. (2002). Thermal processing enhances the nutritional value of tomatoes by increasing total antioxidant activity. J. Agric. Food Chem. 50, 3010–3014. doi: 10.1021/jf0115589
Dorsch, J. A., Cook, A., Young, K. A., Anderson, J. M., Bauman, A. T., Volkmann, C. J., et al. (2003). Seed phosphorus and inositol phosphate phenotype of barley low phytic acid genotypes. Phytochemistry 62, 691–706. doi: 10.1016/S0031-9422(02)00610-6
Emam, M. M. (2012). Antioxidant defense system of black rice grown under drought. Egypt. J. Exp. Biol. Bot. 8, 261–269.
Fageria, N. K., Knupp, A. M., and Moraes, M. (2013). Phosphorus nutrition of lowland rice in tropical lowland soil. Commun. Soil Sci. Plant Anal. 44, 2932–2940. doi: 10.1080/00103624.2013.829485
Faye, I., Diouf, O., Guissé, A., Sène, M., and Diallo, N. (2006). Characterizing root responses to low phosphorus in pearl millet [Pennisetum glaucum (L.) R. Br.]. Agron. J. 98, 1187–1194. doi: 10.2134/agronj2005.0197
Fernández Calleja, M., Monteagudo, A., Casas, A. M., Boutin, C., Pin, P. A., Morales, F., et al. (2020). Rapid on-site phenotyping via field fluorimeter detects differences in photosynthetic performance in a hybrid-parent barley germplasm set. Sensors 20:1486. doi: 10.3390/s20051486
Goufo, P., and Trindade, H. (2014). Rice antioxidants: phenolic acids, flavonoids, anthocyanins, proanthocyanidins, tocopherols, tocotrienols, γ-oryzanol, and phytic acid. Food Sci. Nutr. 2, 75–104. doi: 10.1002/fsn3.86
Gupta, R. K., Gangoliya, S. S., and Singh, N. K. (2015). Reduction of phytic acid and enhancement of bioavailable micronutrients in food grains. J. Food Sci. Technol. 52, 676–684. doi: 10.1007/s13197-013-0978-y
He, Y., Zhang, X., Li, L., Sun, Z., Li, J., Chen, X., et al. (2021). SPX4 interacts with both PHR1 and PAP1 to regulate critical steps in phosphorus-status-dependent anthocyanin biosynthesis. New Phytol. 230, 205–217. doi: 10.1111/nph.17139
Huang, T., Huang, Q., She, X., Ma, X., Huang, M., Cao, H., et al. (2019). Grain zinc concentration and its relation to soil nutrient availability in different wheat cropping regions of China. Soil Tillage Res. 191, 57–65. doi: 10.1016/j.still.2019.03.019
Jia, Z., Tang, M., and Wu, J. (1999). The determination of flavonoid contents in mulberry and their scavenging effects on superoxide radicals. Food Chem. 64, 555–559. doi: 10.1016/S0308-8146(98)00102-2
Jordan-Meille, L., Holland, J. E., McGrath, S. P., Glendining, M. J., Thomas, C. L., and Haefele, S. M. (2021). The grain mineral composition of barley, oat and wheat on soils with pH and soil phosphorus gradients. Eur. J. Agron. 126:126281. doi: 10.1016/j.eja.2021.126281
Julia, C., Wissuwa, M., Kretzschmar, T., Jeong, K., and Rose, T. (2016). Phosphorus uptake, partitioning and redistribution during grain filling in rice. Ann. Bot. 118, 1151–1162. doi: 10.1093/aob/mcw164
Kramer, D. M., Johnson, G., Kiirats, O., and Edwards, G. E. (2004). New fluorescence parameters for the determination of QA redox state and excitation energy fluxes. Photosynth. Res. 79, 209–218. doi: 10.1023/B:PRES.0000015391.99477.0d
Kuhlgert, S., Austic, G., Zegarac, R., Osei-Bonsu, I., Hoh, D., Chilvers, M. I., et al. (2016). MultispeQ Beta: a tool for large-scale plant phenotyping connected to the open PhotosynQ network. R. Soc. Open Sci. 3:160592. doi: 10.1098/rsos.160592
Kurnia, N. H. (2021). The effect of phosphate and potassium application on the growth and production of black rice grain in rainfed areas. Jurnal Lipida: Teknologi Pangan Dan Industri Perkebunan. 1:1.
Kushwaha, U. K. S. (2016). Black rice anthocyanin content increases with increase in altitude of its plantation. Adv. Plants Agric. Res. 5:00170. doi: 10.15406/apar.2016.05.00170
Lazarte, C. E., Carlsson, N., Almgren, A., Sandberg, A., and Granfeldt, Y. (2015). Phytate, zinc, iron and calcium content of common Bolivian food, and implications for mineral bioavailability. J. Food Compos. Anal. 39, 111–119. doi: 10.1016/j.jfca.2014.11.015
Li, P., Li, Y., Zhang, F., Zhang, G., Jiang, X., Yu, H., et al. (2017). The Arabidopsis UDP-glycosyltransferases UGT79B2 and UGT79B3, contribute to cold, salt and drought stress tolerance via modulating anthocyanin accumulation. Plant J. 89, 85–103. doi: 10.1111/tpj.13324
Liang, J., and He, J. (2018). Protective role of anthocyanins in plants under low nitrogen stress. Biochem. Biophys. Res. Commun. 498, 946–953. doi: 10.1016/j.bbrc.2018.03.087
Matsuo, A., Sato, K., Nakamura, Y., and Ohtsuki, K. (2005). Hydrolysis of phytic acid in brown-rice bread by aspergillus Niger phytase. J. Jpn. Nutr. Food Sci. 58, 267–272. doi: 10.4327/jsnfs.58.267
Mitchikpe, E. C. S., Dossa, R. A. M., Ategbo, E. A. D., Vanraaij, J. M. A., Hulshof, P. J. M., and Kok, F. J. (2008). The supply of bioavailable iron and zinc may be affected by phytate in Beninese children. J. Food Compos. Anal. 21, 17–25. doi: 10.1016/j.jfca.2007.06.006
Morcuende, R., Bari, R., Gibon, Y., Zheng, W., Plant, B. D., Blasing, O., et al. (2007). Genome-wide reprogramming of metabolism and regulatory networks of Arabidopsis in response to phosphorus. Plant Cell Environ. 30, 85–112. doi: 10.1111/j.1365-3040.2006.01608.x
Murphy, J., and Riley, J. P. (1962). A modified single solution method for the determination of phosphate in natural waters. Anal. Chim. Acta 27, 31–36. doi: 10.1016/S0003-2670(00)88444-5
Napar, W. P. F., Kaleri, A. R., Ahmed, A., Nabi, F., Sajid, S., Cosic, T., et al. (2022). The anthocyanin-rich tomato genotype LA-1996 displays superior efficiency of mechanisums of tolerance to salinity and drought. J. Plant Physiol. 271:153662. doi: 10.1016/j.jplph.2022.153662
Oo, A. Z., Asai, H., Win, K. T., Marui, J., and Saito, H. (2023). Seed phytic acid concentration affects rice seedling vigor irrespective of soil phosphorus bioavailability. Physiol. Plant. 175:e13913. doi: 10.1111/ppl.13913
Oo, A. Z., Tsujimoto, Y., Rakotoarisoa, N. M., Kawamura, K., and Nishigaki, T. (2020). P-dipping of rice seedlings increases applied P use efficiency in high P-fixing soils. Sci. Rep. 10, 1–10. doi: 10.1038/s41598-020-68977-1
Purwanto, E., and Hidayati, W. Nandariyah (2018). The yield and quality of black rice varieties in different altitudes. IOP Conf. Series: earth and environmental. Science 142:0112037.
Qui, Y., Liu, Q., and Beta, T. (2009). Antioxidant activity of commercial wild rice and identification of flavonoid compounds in active fractions. J. Agric. Food Chem. 57, 7543–7551. doi: 10.1021/jf901074b
Raboy, V. (2001). Seeds for a better future; “low phytate” grains help to overcome malnutrition and reduce pollution. Trends Plant Sci. 6, 458–462. doi: 10.1016/S1360-1385(01)02104-5
Raboy, V. (2003). Myo-Inositol-1,2,3,4,5,6-hexakisphosphate. Phytochemistry 64, 1033–1043. doi: 10.1016/S0031-9422(03)00446-1
Raboy, V. (2009). Approaches and challenges to engineering seed phytate and total phosphorus. Plant Sci. 177, 281–296. doi: 10.1016/j.plantsci.2009.06.012
Rakotoarisoa, N. M., Tsujimoto, Y., and Oo, A. Z. (2020). Dipping rice seedlings in P-enriched slurry increases grain yield and shortens days to heading on P-deficient lowlands in the central highlands of Madagascar. Field Crops Res. 254:107806. doi: 10.1016/j.fcr.2020.107806
Rose, T. Y., Liu, L., and Wissuwa, M. (2013). Improving phosphorus efficiency in cereal crops: is breeding for reduced grain phosphorus concentration part of the solution?. Front. Plant Sci.. doi: 10.3389/fpls.2013.00444
Ryan, M. H., Mclnerney, J. K., Record, I. R., and Angus, J. F. (2008). Zinc bioavailability in wheat grain in relation to phosphorus fertilizer, crop sequence, and mycorrhizal fungi. Sci. Food Agric. 88, 1208–1216. doi: 10.1002/jsfa.3200
Somaweera, K. A. T. N., Suriyagoda, L. D. B., Sirisena, D. N., and De Costa, W. A. J. M. (2015). Accumulation and partitioning of biomass, nitrogen, phosphorus, and potassium among different tissues during the life cycle of rice grown under different water management regimes. Plant Soil 401, 169–183. doi: 10.1007/s11104-015-2541-2
Takai, T., Lumanglas, P., and Simon, E. V. (2019). Genetic mechanism of heat stress tolerance at anthesis among three different rice varieties with different fertilities under heat stress. Plant Prod. Sci. 23, 529–538. doi: 10.1080/1343943X.2020.1766363
Taliman, N. A., Dong, Q., Echigo, K., Raboy, V., and Saneoka, H. (2019). Effect of phosphorus fertilization on the growth, photosynthesis, nitrogen fixation, mineral accumulation, seed yield, and seed quality of a soybean low-Phytate line. Plan. Theory 8:119. doi: 10.3390/plants8050119
Tominaga Wada, R., Masakane, A., and Wada, T. (2018). Effect of phosphate deficiency-induced anthocyanin accumulation on the expression of Solanum lycopersicum GLABRA3 (SlGL3) in tomato. Plant Signal. Behav. 13:e1477907. doi: 10.1080/15592324.2018.1477907
Van Oort, P. A. J. (2018). Mapping abiotic stresses for rice in Africa: drought, cold, iron toxicity, salinity and sodicity. Field Crops Res. 219, 55–75. doi: 10.1016/j.fcr.2018.01.016
Vats, P., and Banerjee, U. C. (2004). Production studies and catalytic properties of phytases (myo-inositol-hexakis-phosphate phosphohydrolases): an overview. Enzym. Microb. Technol. 35, 3–14. doi: 10.1016/j.enzmictec.2004.03.010
Velioglu, Y. S., Mazza, G., Gao, L., and Oomah, B. D. (1998). Antioxidant activity and total phenolics in selected fruits, vegetables, and grain products. J. Agric. Food Chem. 46, 4113–4117. doi: 10.1021/jf9801973
Watts Williams, S. J., Gill, A. R., Jewell, N., Brien, C. J., Berger, B., Tran, B. T. T., et al. (2021). Enhancement of sorghum grain yield and nutrition: a role for arbuscular mycorrhizal fungi regardless of sol phosphorus availability. Plants People Planet. 4, 143–156. doi: 10.1002/ppp3.10224
White, P. J., and Veneklaas, E. J. (2012). Nature and nurture: the importance of seed phosphorus content. Plant Soil 357, 1–8. doi: 10.1007/s11104-012-1128-4
Yamaji, N., Takemoto, Y., Miyaji, T., Mitani-Ueno, N., Yoshida, K. T., and Ma, J. F. (2017). Reducing phosphorus accumulation in rice grains with an impaired transporter in the node. Nature 541, 92–95. doi: 10.1038/nature20610
Yawadio, R., Tanimori, S., and Morita, N. (2007). Identification of phenolic compounds isolated from pigmented rice and their aldose reductase inhibitory activities. Food Chem. 101, 1616–1625. doi: 10.1016/j.foodchem.2006.04.016
Yodmanee, S., Karrila, T. T., and dan Pakdeechanuan, P. (2011). Physical, chemical and antioxidant properties of pigmented rice grown in southern Thailand. Int. Food Res. J. 18, 901–906.
Zhang, W., Liu, D., Liu, Y., Chen, X., and Zou, C. (2017). Overuse of phosphorus fertilizer reduces the grain and flour protein contents and zinc bioavailability of winter wheat (Triticum aestivum L.). J. Agric. Food Chem. 65, 1473–1482. doi: 10.1021/acs.jafc.6b04778
Keywords: antioxidants, pigmented rice, grain color, ion uptake, phosphorus
Citation: Oo AZ, Asai H, Kawamura K, Marui J, Nakahara K, Takai T, Saito H, Win KT and Pariasca-Tanaka J (2023) Optimizing phosphorus management to increase grain yield and nutritional quality while reducing phytic acid concentration in black rice (Oryza sativa L.). Front. Sustain. Food Syst. 7:1200453. doi: 10.3389/fsufs.2023.1200453
Edited by:
Mumtaz Cheema, Memorial University of Newfoundland, CanadaReviewed by:
Poonam Yadav, Banaras Hindu University, IndiaCopyright © 2023 Oo, Asai, Kawamura, Marui, Nakahara, Takai, Saito, Win and Pariasca-Tanaka. This is an open-access article distributed under the terms of the Creative Commons Attribution License (CC BY). The use, distribution or reproduction in other forums is permitted, provided the original author(s) and the copyright owner(s) are credited and that the original publication in this journal is cited, in accordance with accepted academic practice. No use, distribution or reproduction is permitted which does not comply with these terms.
*Correspondence: Aung Zaw Oo, YXVuZ3phd29vQGFmZnJjLmdvLmpw; Hidetoshi Asai, YXNhaTA4MTdAYWZmcmMuZ28uanA=
†Present address: Kensuke Kawamura, Obihiro University of Agriculture and Veterinary Medicine, Obihiro, Hokkaido, Japan
Disclaimer: All claims expressed in this article are solely those of the authors and do not necessarily represent those of their affiliated organizations, or those of the publisher, the editors and the reviewers. Any product that may be evaluated in this article or claim that may be made by its manufacturer is not guaranteed or endorsed by the publisher.
Research integrity at Frontiers
Learn more about the work of our research integrity team to safeguard the quality of each article we publish.