
95% of researchers rate our articles as excellent or good
Learn more about the work of our research integrity team to safeguard the quality of each article we publish.
Find out more
ORIGINAL RESEARCH article
Front. Sustain. Food Syst. , 23 June 2023
Sec. Crop Biology and Sustainability
Volume 7 - 2023 | https://doi.org/10.3389/fsufs.2023.1194867
This article is part of the Research Topic ‘Save Soil’ by Managing Soil Nutrient Losses, Agronomic Practices and Crop-Microbial Interaction: World Soil Day 2022 View all 12 articles
 Ramesh Kumar Singh1,2
 Pravin Kumar Upadhyay1*
 Shiva Dhar1*
 G. A. Rajanna3*
 Vinod Kumar Singh4*
 Rakesh Kumar5
 Rajiv Kumar Singh1
 Subhash Babu1
 Sanjay Singh Rathore1
 Kapila Shekhawat1
 Anchal Dass1
 Amit Kumar6
 Gaurendra Gupta7Gaurav Shukla1Sudhir Rajpoot8
 Ved Prakash8Bipin Kumar1*Vinod Kumar Sharma1
 Sharmistha Barthakur9
The major challenge of growing soybean, other than unfavorable weather and small farm size, is the non-availability of quality inputs at the right time. Furthermore, in soybean growing regions, crop productivity and soil environment have deteriorated due to the use of traditional varieties and conventional methods of production. Soybean crop intensification or system of crop intensification in soybean (SCI) is an agricultural production system that boosts soybean yields, improves the soil environment, and maximizes the efficiency of input utilization, although the contribution of SCI to crop productivity is not well understood as different genotypes of soybean exhibit different physiological responses. Therefore, a field study was conducted in 2014–2015 and 2015–2016 using three crop establishment methods (SCI at a 45 cm × 45 cm row spacing, SCI at 30 cm × 30 cm, and a conventional method at 45 cm × 10 cm) assisted in vertical strips with four genotypes (Pusa 9,712, PS 1347, DS 12–13, and DS 12–5) using a strip-plot design with three replications. Compared with standard methods of cultivation, the adoption of SCI at 45 cm × 45 cm resulted in a significantly higher stomatal conductance (0.211 mol H2O m−2 s−1), transpiration rate (7.8 mmol H2O m−2 s−1), and net photosynthetic rate (398 mol CO2 m−2 s−1). The implementation of an SCI at 30 cm × 30 cm had significantly greater intercepted photosynthetic active radiation (PAR) (1,249 mol m−2 s−1) than the conventional method system, increasing crop yield from 9.6 to 13.3% and biomass yield from 8.2 to 10.7%. In addition, under an SCI at 30 cm × 30 cm, there were more nodules, significantly larger root volume and surface density, and increased NPK uptake compared with the other methods. Significantly greater soil dehydrogenase activity, alkaline phosphatase activity, acetylene-reducing assay, total polysaccharides, microbial biomass carbon, and soil chlorophyll were found with SCI at 45 cm × 45 cm (13.63 g TPF g−1 soil hr.−1, 93.2 g p-nitro phenol g−1 soil hr.−1, 25.5 n moles ethylene g−1 soil hr.−1, 443.7 mg kg−1 soil, 216.5 mg kg−1 soil, and 0.43 mg g−1 soil, respectively). Therefore, the adoption of an SCI at 30 cm × 30 cm and/or 45 cm × 45 cm could provide the best environment for microbial activities and overall soil health, as well as the sustainable productivity of soybean aboveground.
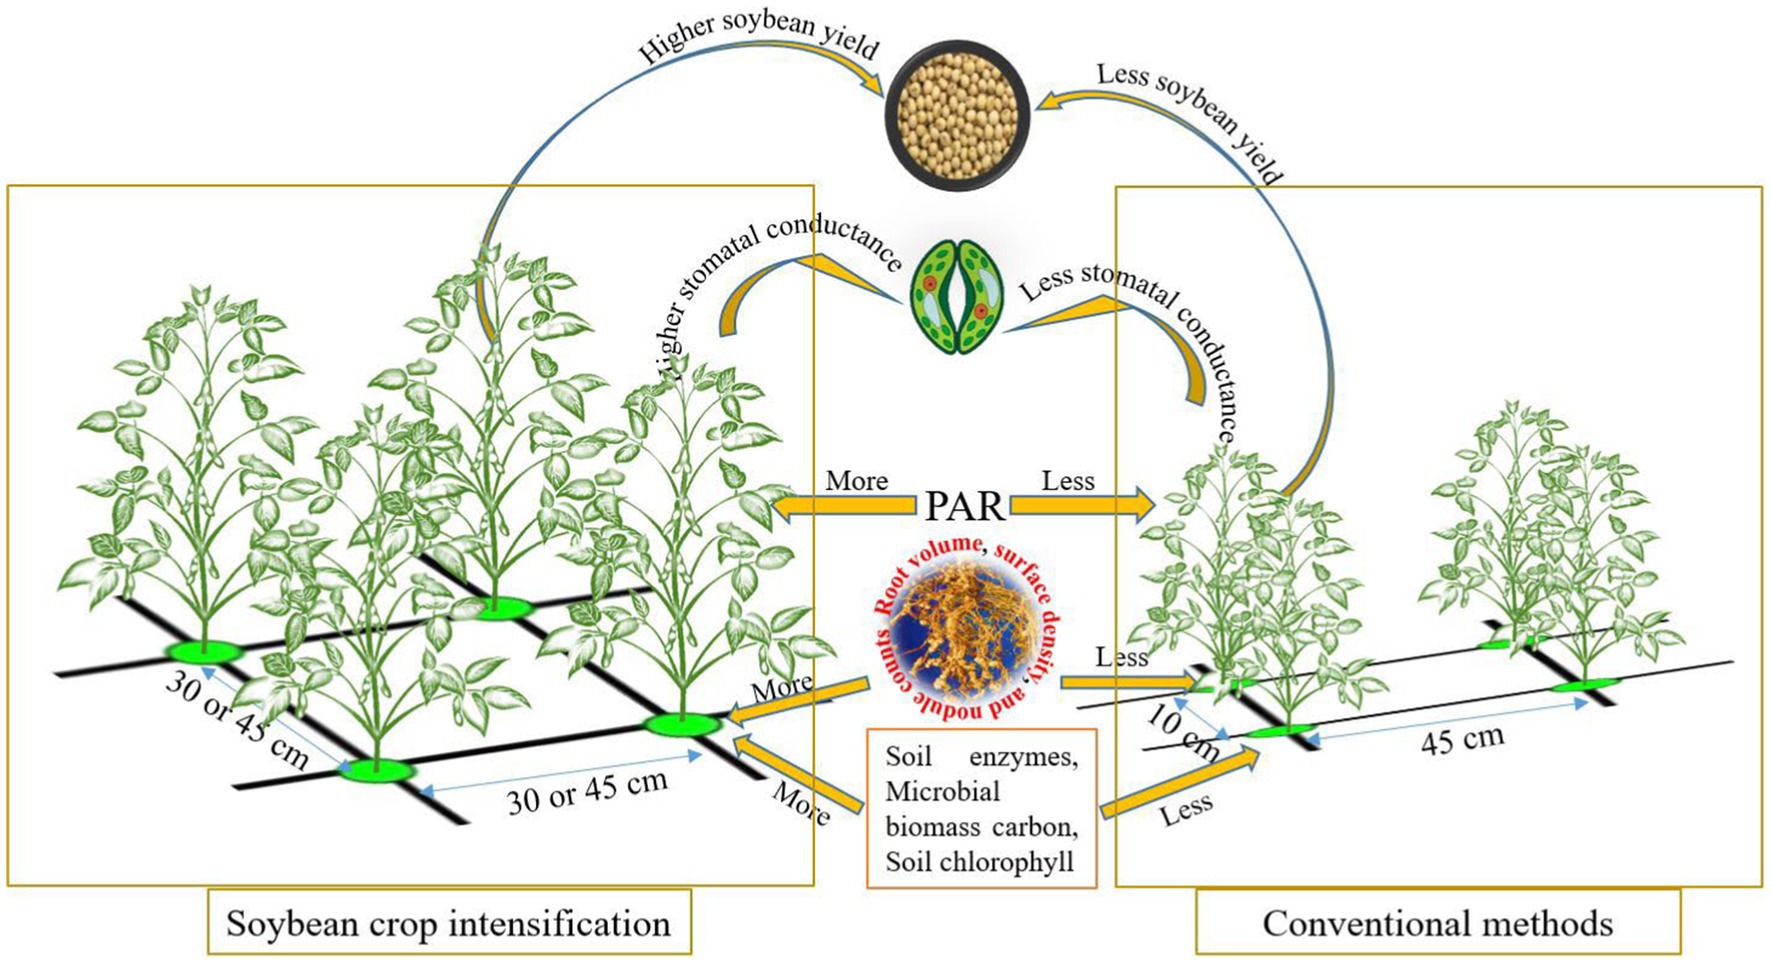
Graphical abstract
The cultivation of traditional/local cultivars and conventional tillage production systems in the Western Indo-Gangetic Plains (IGP) has led to decreased crop productivity (Fatima et al., 2023), soil erosion (Cárceles Rodríguez et al., 2022), nutrient depletion (FAO, 2017; Dutta et al., 2022), and water loss (Jat et al., 2019), resulting in degraded soils (Radosavljevic et al., 2020) with low organic matter content (Singh et al., 2019) and a fragile physical structure (Rajanna et al., 2022). Soybean cultivation using traditional cultivars under conventional crop establishment methods have had the same impact. However, owing to soybean’s wide range of uses and health advantages, it is the most widely cultivated oilseed crop worldwide. The production of 369.5 million tons (mt) of soybeans worldwide each year is evidence of the crop’s importance on a global scale (USDA, 2018). Owing to its high levels of protein and edible oil content (Dass et al., 2018), soybean products are widely consumed in India and throughout the world. The world’s soybean production, yield, and area were 120.4 million hectares, 313.7 million tons, and 2.67 tons ha−1, respectively, in 2015–16 (FAO, 2021). In India, it covered an area of 11.66 million ha, and in the fiscal year 2015–16, an average yield of 737 kg/ha was recorded (Anonymous, 2017). However, soybean’s poor average productivity (1.0 Mg ha−1) restricts its wider expansion in this potentially productive region (Dass and Bhattacharyya, 2017). The demand for locally produced soybean oilseed has decreased because of the lower productivity of these traditional production systems.
The System of Rice Intensification (SRI), which evolved from Madagascar (Upadhyay et al., 2022), as well as conservation agriculture (CA), integrated pest management (IPM), agroforestry, and other good combinations of practices that alter crop management, soil, water, and nutrients, are examples of agroecological management. Among other things, these modifications increase soil microbial activity (Adhikari et al., 2018) and abundance in the rhizosphere (root zone) and even the phyllosphere of plants (Uphoff et al., 2013). Soybean crop intensification or system of crop intensification (SCI) in soybean is fundamentally derived from the SRI with slight modifications (Araya et al., 2013). SCI is based on productive efficiencies that are derived from plants (Abraham et al., 2014) with larger more efficient longer-lived root systems (Adhikari et al., 2018) and their symbiotic relationships (Uphoff et al., 2013) with more abundant (Singh et al., 2018), diverse, and active soil biota (Dhar et al., 2016). Crops with more proliferated root systems with profuse and healthy life inside the soil are more resilient (Singh et al., 2018) when exposed to any aberrant weather, such as drought, a sudden increase in temperature, and heavy rainfall (Dass et al., 2015; Adhikari et al., 2018). Therefore, such innovative technology can boost the pace of modern agriculture practices for sustaining crop productivity even under climate change.
Practicing SCI can eliminate the application of agrochemicals on a wider scale and improve the quality of the soil as well as the produce (Upadhyay et al., 2018). Reducing the agrochemical load in the soil positively impacts microorganisms and root proliferation (Gupta et al., 2022). By altering the crop geometry, the symbiotic relationship between microorganisms and the root rhizosphere (Rajanna et al., 2022) can be enhanced which constitutes the sound plants micro-biomes (Kong and Liu, 2022). The SCI offers square planting with wider row-to-row and plant-to-plant spacing along with organic nutrient supplementation, which provides a better environment for the growth and development of above-ground-under-ground plant parts (Singh et al., 2018). Jiang et al. (2015) and Dass et al. (2015) reported that 45-cm row-to-row-spaced soybean sowing resulted in greater stomatal conductance, chlorophyll content, and net photosynthetic and transpiration rate, whereas narrow spacing causes a ceiling effect (Rahman et al., 2004) in the plant canopy, which leads to less growth and development of the plant above and below ground. In summary, proper crop geometry is one of the most important agronomic traits and varies with different cultivars in terms of obtaining optimal productivity with soybean. Therefore, crop intensification, including the alteration of existing crop management practices, is needed to meet the food demand of the ever-increasing population. Considering these facts, the present investigation entitled “Soybean crop intensification for sustainable above-ground-under-ground plant–soil interactions” has been carried out with the following hypotheses in mind: (1) to evaluate the conventional cultivation and SCI methods of soybean genotypes for a better yield, quality, and profitability; and (2) to comparatively analyze the morphophysiological changes in soybean under conventional and SCI methods of cultivation.
The study was undertaken in two consecutive rainy seasons from 2014 to 2015 to 2015 to 2016 at a research farm belonging to the Indian Agricultural Research Institute (Pusa Institute), New Delhi (28.38° latitude and 77.09° longitude). The soil of the experimental unit had sandy clay loam texture in the upper 30-cm layer with a nearly level to gently sloping topography. The initial soil was slightly alkaline (pH 7.8), low in soil organic carbon (0.39%), low in available nitrogen (N) (155.4 kg ha−1), high in available potassium (K) (311.4 kg ha−1), and had a medium level of available phosphorus (P) (14.2 kg ha−1). The climate of the study site is semi-arid to subtropical, with maximum temperatures ranging from 40 to 45°C during the cropping season. Rainfall of 390.8 mm (2014–2015) and 633.1 mm (2015–2016) was received during the crop growth period.
The study consisted of three crop establishment methods [Conventional (45 cm × 10 cm), SCI: 45 cm × 45 cm, and SCI: 30 cm × 30 cm] assisted in the horizontal strips, and four soybean varieties (Pusa-9712, PS-1347, DS-12-13, and DS-12-5) assisted in the vertical strips under a strip plot design with three replications. After obtaining a proper tilth in the soil, one plowing was carried out using a tractor-drawn double disc followed by harrowing. At the time of sowing, the recommended doses for nutrients for soybean (N, 25 kg; P2O5, 60 kg; and K2O, 40 kg ha−1), were applied through FYM (contained 0.50% N, 0.23% P2O5, and 0.56% K2O) at 5.0 t/ha treated with Trichoderma (2.5 kg t−1), and the remaining potassium and phosphorus doses were applied through muriate of potash and single super phosphate (SSP), respectively. The two sprouted seeds per hill were carefully sown at a spacing of 45 × 45 cm and 30 cm × 30 cm spacing without damaging the seed coat, and the respective seed rates of the desired row spacing were 15 and 25 kg ha−1. Seed treatment was carried out according to the SCI protocol (Plate 1). During both study years, the soybean crop was established using the standard agronomic practices listed in Table 1.

Plate 1. Seed treatment protocol of SCI.
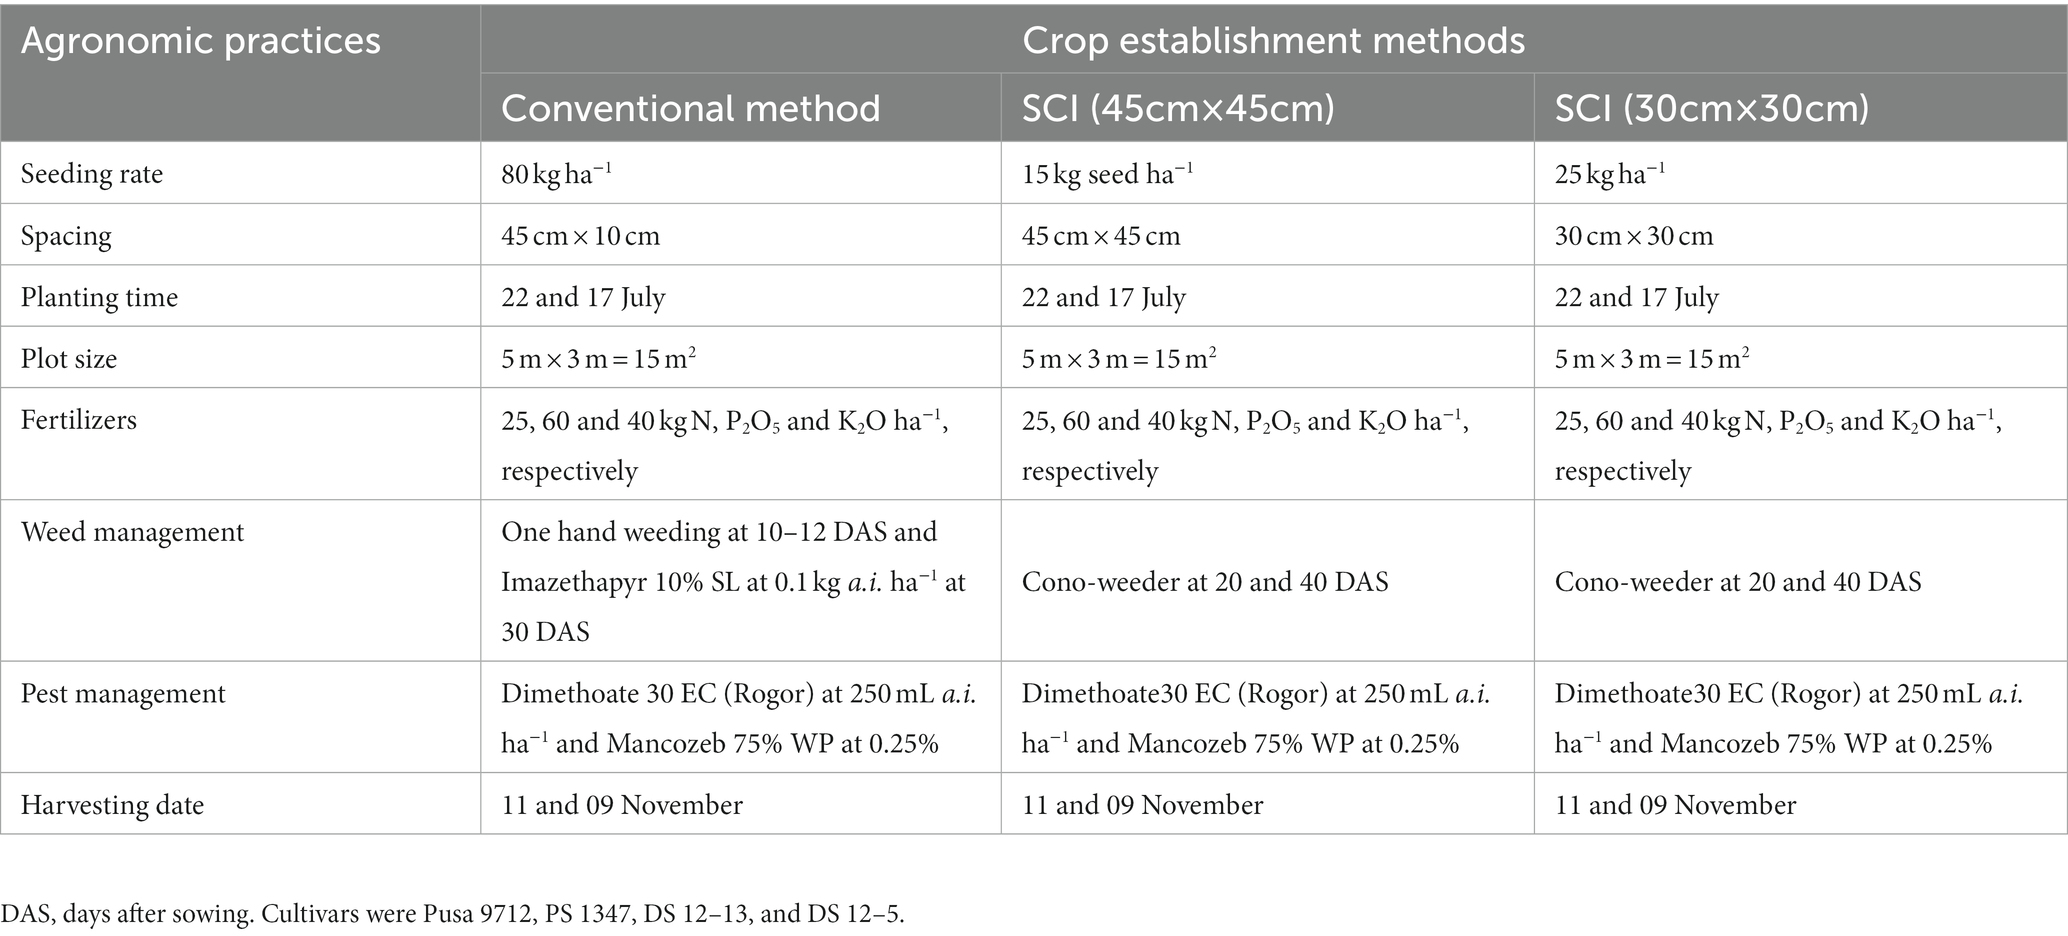
Table 1. Agronomic management practices followed and inputs applied during the experimentation (2014–2016).
Five soybean plants were randomly selected at intervals of 30, 60, and 90 days after planting (DAP) for the measurement of leaf area index (LAI), crop growth rate (CGR), and net assimilation rate (NAR) from the plant dry matter. Soybean was harvested manually using sickles during the second fortnight of October in both the years of study. After the harvesting bundles were left in the field for 2–3 days for drying, threshing was carried out using a Pullman thresher. Seed and straw yields were calculated from a 15.0 m2 (5.0 × 3.0 m) plot at crop maturity. Yields were reported on a dry weight basis (12% moisture w/w), and the moisture content of the grain and straw was evaluated on an oven dry basis (70°C). The oil content of the soybean seed was estimated by using a grain analyzer (FOSS Infratec™ 1241) based on the technology of near-infrared transmittance using a non-destructive method of oil estimation. Leaf area (cm2) was measured with the help of a leaf area meter (LI-3100C) and was further converted into LAI using the following formula (Equation 1):
The computation of mean growth rate was performed using Equation 2, as provided by Watson (1952).
Where, W1 and W2 are the dry weight (g) of plants at time interval T1 and T2, respectively; S is land area (m2) covered by the plants.
The computation of the mean net assimilation rate was performed using Equation 3, as provided by Watson (1958):
Where,W1 and W2 are the dry weight (g) of plants at time T1 and T2, respectively; Ln is the natural logarithm; T2- T1 is the interval of time in days; LA1 and LA2 are the leaf area (m2) covered by plants at time T1 and T2, respectively.
Three plants were selected and pulled from the soil for root nodule examination at the 50% flowering stage of the soybean crop. The rhizosphere soil was then gently shaken from the root systems into a sterilized bag. The number of nodules per plant was then determined after carefully washing the roots with distilled water. Soybean roots were sampled at the 50% flowering stage and root samples were collected from the top 15 cm of soil using a root auger of 8.0 cm in diameter and 15 cm in length (core volume = 754.3 cm3). The roots were placed in a container with sieves to remove the soil debris and were then stored in a refrigerator at 4°C for preservation. Scanning and image analysis using the WIN-RHIZO system measured the root characteristics, such as root length and root volume (Costa et al., 2000).
An infrared gas analyzer (IRGA) was used to measure physiological parameters, such as photosynthetic rate (photo, mole CO2 m2 s−1), stomatal conductance (cond, mole H2O m2 s−1), transpiration rate (Tr, m. mol, H2O m2 s−1), and intercellular CO2 concentration (Ci, mole CO2 mol−1). The physiological indicators were measured at the flowering stage of soybean. Two CO2 and H2O infrared gas analyzers each are used in the LI-COR 6400, which provide estimates using the method described by Pandey et al. (2017). Photon (quantum) flux in radiant energy between 400 and 700 nm is used to describe photosynthetic active radiation (PAR). The PAR was determined using a LI-COR Line Quantum Sensor (1 m long) connected to a LI-1000 data logger. PAR was recorded at 1,200- and 1,300-h standard time on a sunny day.
Grain and straw samples were processed for nutrient analyses. First, samples were oven dried (70°C) until a constant weight was achieved followed by grinding using a Willey mill with stainless steel blades. A modified version of the Kjeldahl method was used to estimate nitrogen (%) in grain and straw (Prasad et al., 2006). Nitrogen (N) uptake was determined using Equations 4 and 5:
Grain and straw phosphorus (P) content was assessed using the vanado-molybdophosphoric acid yellow color method, as suggested by Prasad et al. (2006). Total P uptake (kg ha−1) was determined using the following equations:
Grain and straw K content was estimated using a flame photometer (Prasad et al., 2006) and uptake (grain/straw and total) was computed using the following equations:
To estimate soil microbial dynamics, soil samples obtained from a depth of 0–15 cm were collected from each experimental plot using a core sampler. Collected soil samples were processed (air-dried, powdered, passed through a 2 mm mesh sieve, etc.) to estimate microbial parameters, such as soil microbial biomass carbon (MBC), enzymatic activities (dehydrogenase, alkaline phosphatase, and nitrogenase), and total polysaccharides. Soil MBC was evaluated using the method described by Nunan et al. (1998) with 70 mL of 0.5 M potassium sulfate (K2SO4). Dehydrogenase enzyme activity was assessed using the processes described by Casida et al. (1964) and a spectrophotometer at a wavelength of 485 nm. Alkaline phosphate activity, which represents free enzymes, was estimated using the technique suggested by Tabatabai and Bremner (1969) and 1.0 mL of p-ntro-phenyl phosphate disodium and 0.25 mL of toluene. Soil nitrogenase activity was estimated using the method suggested by Prasanna et al. (2003) and gas chromatography (GC) (Hewlett Packard 5890 series II) (using ethylene gas) and expressed as acetylene reducing activity (ARA). ARA was calculated using Equation (10):
Soil chlorophyll was examined using the techniques suggested by Nayak et al. (2004) with pre-weighed soil-cores (0–20 cm soil depth) and acetone: dimethyl sulfoxide (DMSO) in a 1:1 ratio with 4 m L g−1 of soil. For soil chlorophyll determination, optical densities at 630, 645, 663, and 775 nm were taken (Equation 11).
The depth of irrigation water from each plot was measured using a meter scale. Crop water productivity (CWP) and water use efficiency (WUE) were calculated with the help of the formula published by Rajanna et al. (2019).
Soybean seed oil content was estimated using a grain analyzer (FOSS Infratec™ 1241) based on near-infrared transmittance technology using a non-destructive method of oil estimation. It is expressed as a percentage. Oil yield was calculated using Equation (15):
The research data recorded during the present study was evaluated using the “analysis of variance” (ANOVA) of the strip plot design (SPD) approach, as suggested by Gomez and Gomez (1984). The “F” test was used to determine the significance of treatments (variance ratio). When the “F” test revealed significant differences between means, differences in the treatment means were evaluated using Duncan’s multiple range test (DMRT) and least significant difference (LSD) at a 5% probability level. Standard error (SE) was used (in Figures 1–6) to measure the degree of variability between the individual data values.
Growth indices, such as LAI, CGR, and NAR, were significantly influenced by the different cultivation methods and soybean genotypes (Table 2). At 30, 60, and 90 days after sowing (DAS), the conventional method of soybean planting exhibited a significantly higher LAI under both systems of intensification methods (SCI). Similarly, with the conventional method of sowing at 45 × 10 cm, CGR and NAR were considerably greater than both SCI methods from the 0–30-day period to the 30–60-day period. However, for 60–90 days, CGR and NAR were significantly higher in SCI at a spacing of 30 × 30 cm compared with conventional methods and SCI at 45 cm × 45 cm. Among the genotypes, in all phases of development, DS 12–13 had a higher LAI than all the other tested genotypes, followed by DS 12–5 and Pusa 9712. Similarly, DS 12–13 soybean genotypes had the highest CGR across all the time periods (0–30, 30–60, and 60–90 days), while NAR was the highest for PS 1347 and Pusa 9,712 between 30–60 and 60–90 days, respectively.
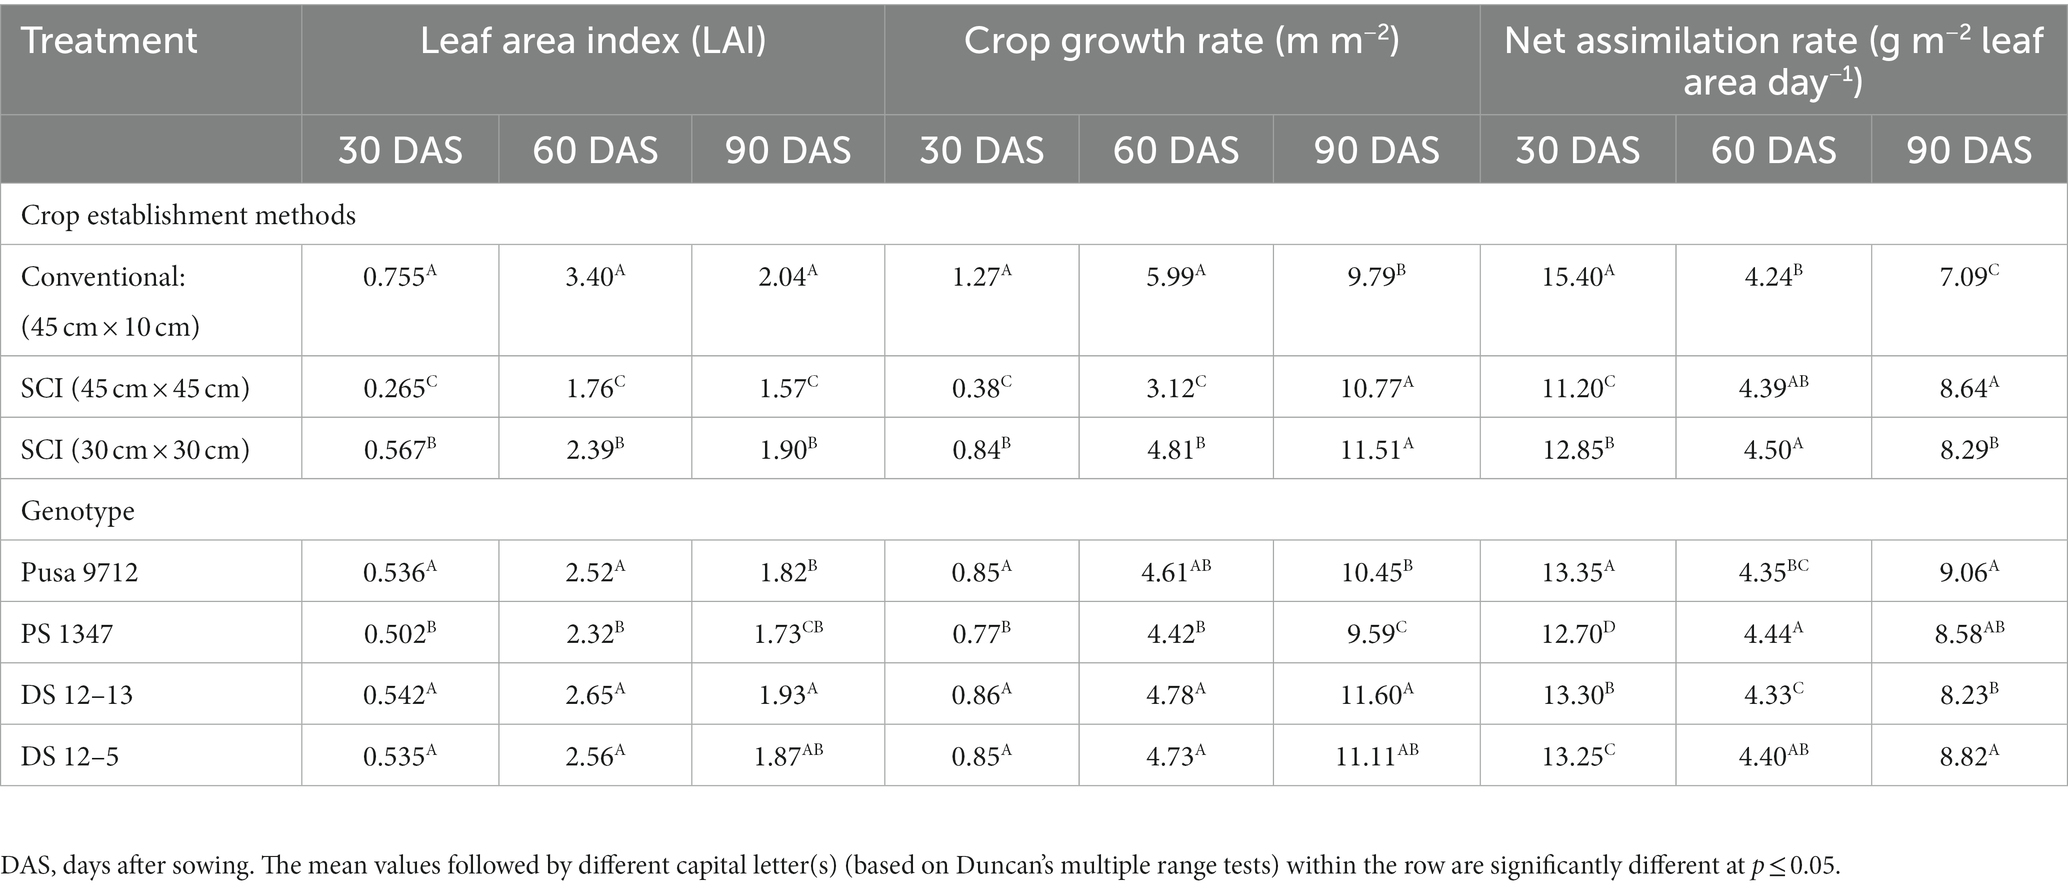
Table 2. Effect of crop establishment methods and cultivars on the leaf area index, crop growth rate (g m−2), and net assimilation rate (g m−2 leaf area day−1) of soybean at different growth stages (mean of 2 years).
Cultivation methods and soybean genotypes significantly influenced flowering-stage stomatal conductance, intercellular CO2 concentration, and net photosynthetic rates during 2015–16 (Table 3). The highest intercellular CO2 concentration among cultivation methods was produced by SCI at 30 cm × 30 cm (260.1 μmol CO2 mol−1), which was significantly greater than the conventional method of soybean cultivation. Likewise, SCI at 45 cm × 45 cm exhibited significantly higher stomatal conductance (0.211 mol H2O m−2 s−1) and transpiration rate (7.8 m mol H2O m−2 s−1) than other cultivation techniques, whereas the net photosynthetic rate was substantially higher with the conventional method (398 μmol CO2 m−2 s−1) than with SCI techniques. Among the soybean genotypes, DS 12–13 had a higher stomatal conductance (0.22 mol H2O m−2 s−1), intercellular CO2 concentration (250.3 μ mol CO2 mol−1), and rate of transpiration (7.5 mmol H2O m−2 s−1) than other soybean genotypes. There was no significant difference between DS 12–13 and DS 12–5. However, the Pusa 9712 genotype had a significantly higher rate of net photosynthesis (353 μmol CO2 m−2 s−1) than the other genotypes.
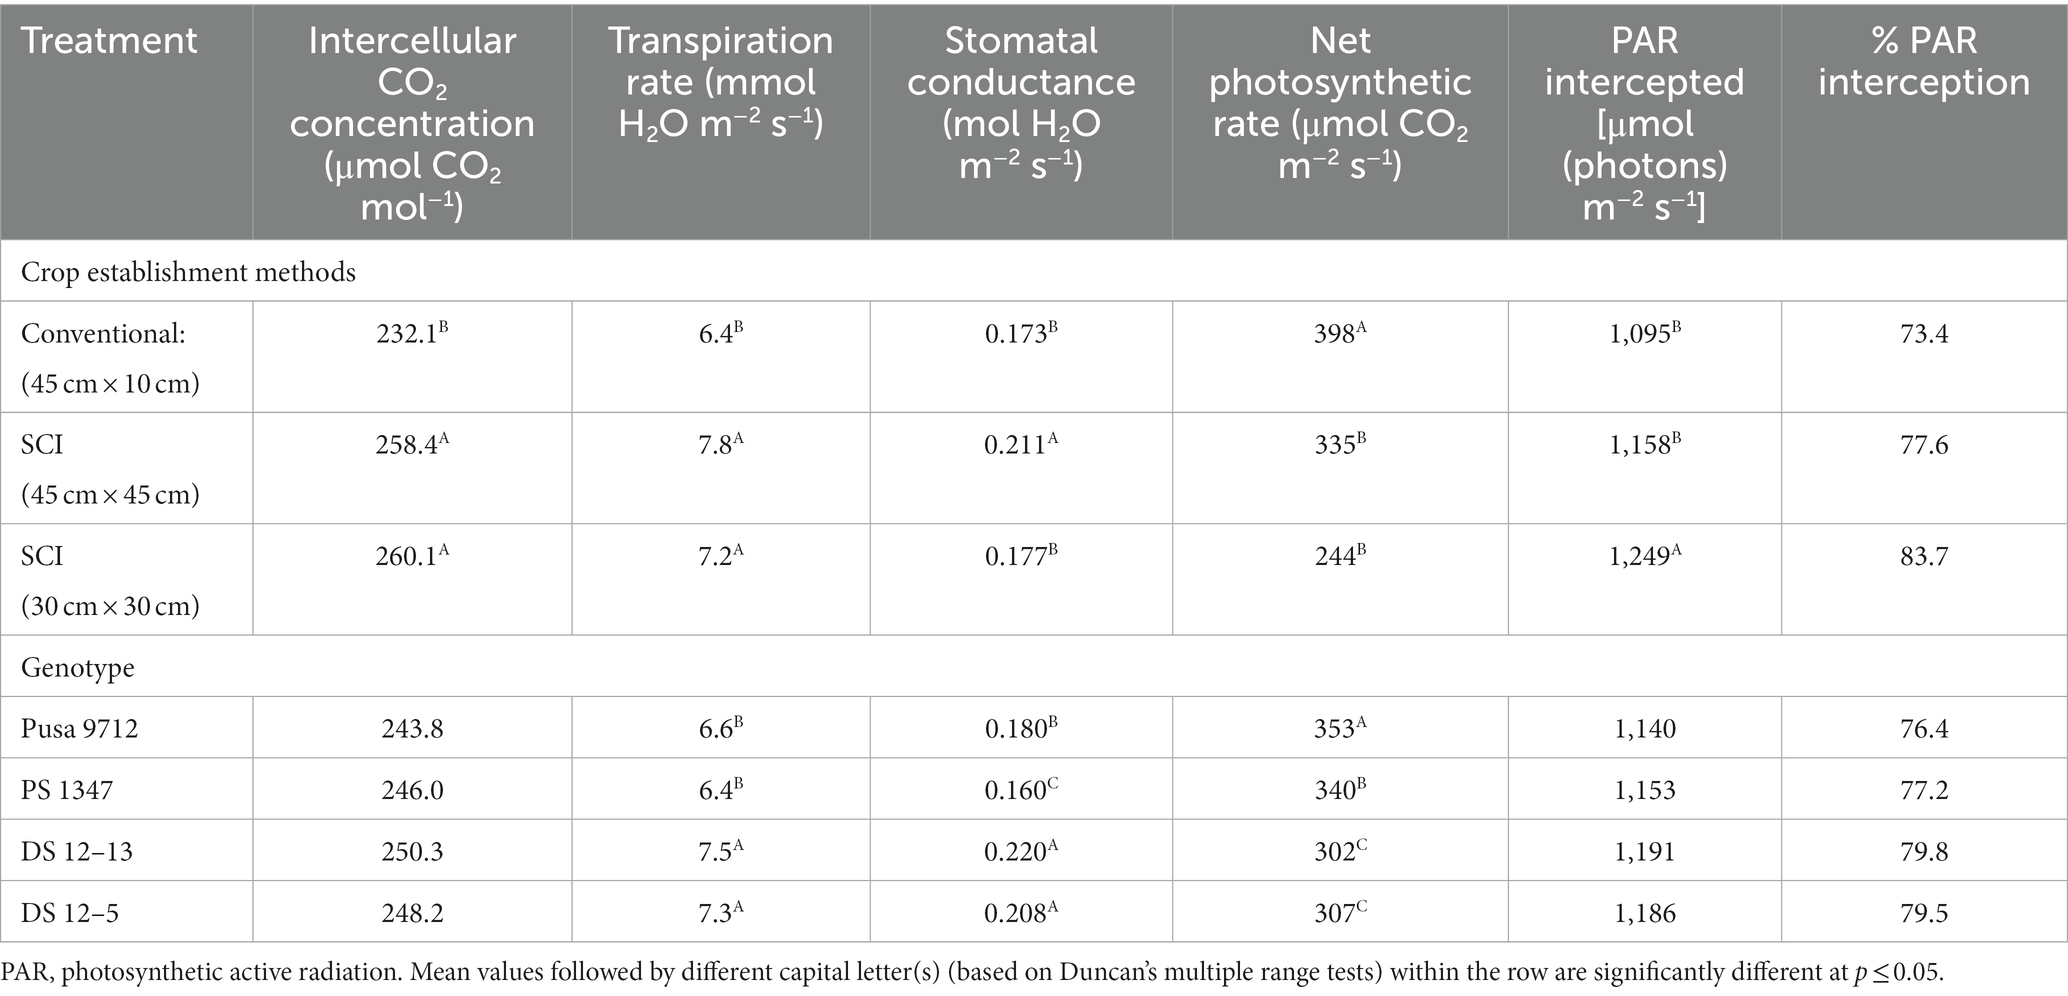
Table 3. Effect of crop establishment methods and cultivars on the physiological parameters of soybean at the flowering stage (mean data of 2 years).
Intercepted photosynthetically active radiation (PAR) of the soybean genotypes was also significantly influenced by the cultivation method and genotype. The adoption of SCI at 30 cm × 30 cm soybean establishment resulted in a significantly higher intercepted PAR (1,249 μ mol m−2 s−1) than other SCI methods (45 cm × 45 cm) and the conventional method of crop establishment. Increases were 14.1 and 8.5% with SCI at 30 cm × 30 cm compared with the conventional method and SCI at 45 cm × 45 cm, respectively. As a result, the PAR interception rate was 83.7% higher in SCI at 30 cm × 30 cm than the other methods. However, soybean genotypes have little impact/no significant effect on the interception of PAR. Comparatively, DS 12–13 intercepted more PAR than DS 12–5, PS 1347, and Pusa 9712.
Cultivation methods and genotypes significantly influenced nodules per plant−1, total nodule dry weight, and root characteristics of soybeans at the blooming stage (Table 4). The SCI method of cultivation at 45 cm × 45 cm produced significantly more nodules per plant (41.1) and higher nodule dry weight (176.5 mg plant−1) than the conventional method of cultivation (45 cm × 10 cm); however, the SCI method at 30 cm × 30 cm produced a similar number of nodules. Among the genotypes, DS 12–13 produced the maximum nodules per plant−1 (35.8) and nodule dry weight (179.1 mg plant−1), making it substantially more productive than the PS 1347 genotype. However, it was on a par with the Pusa 9712 and DS 12–5 genotypes. DS 12–13 had the most characteristics with the highest values, followed by Pusa 9712 and DS 12–5, all of which were comparable with one another.
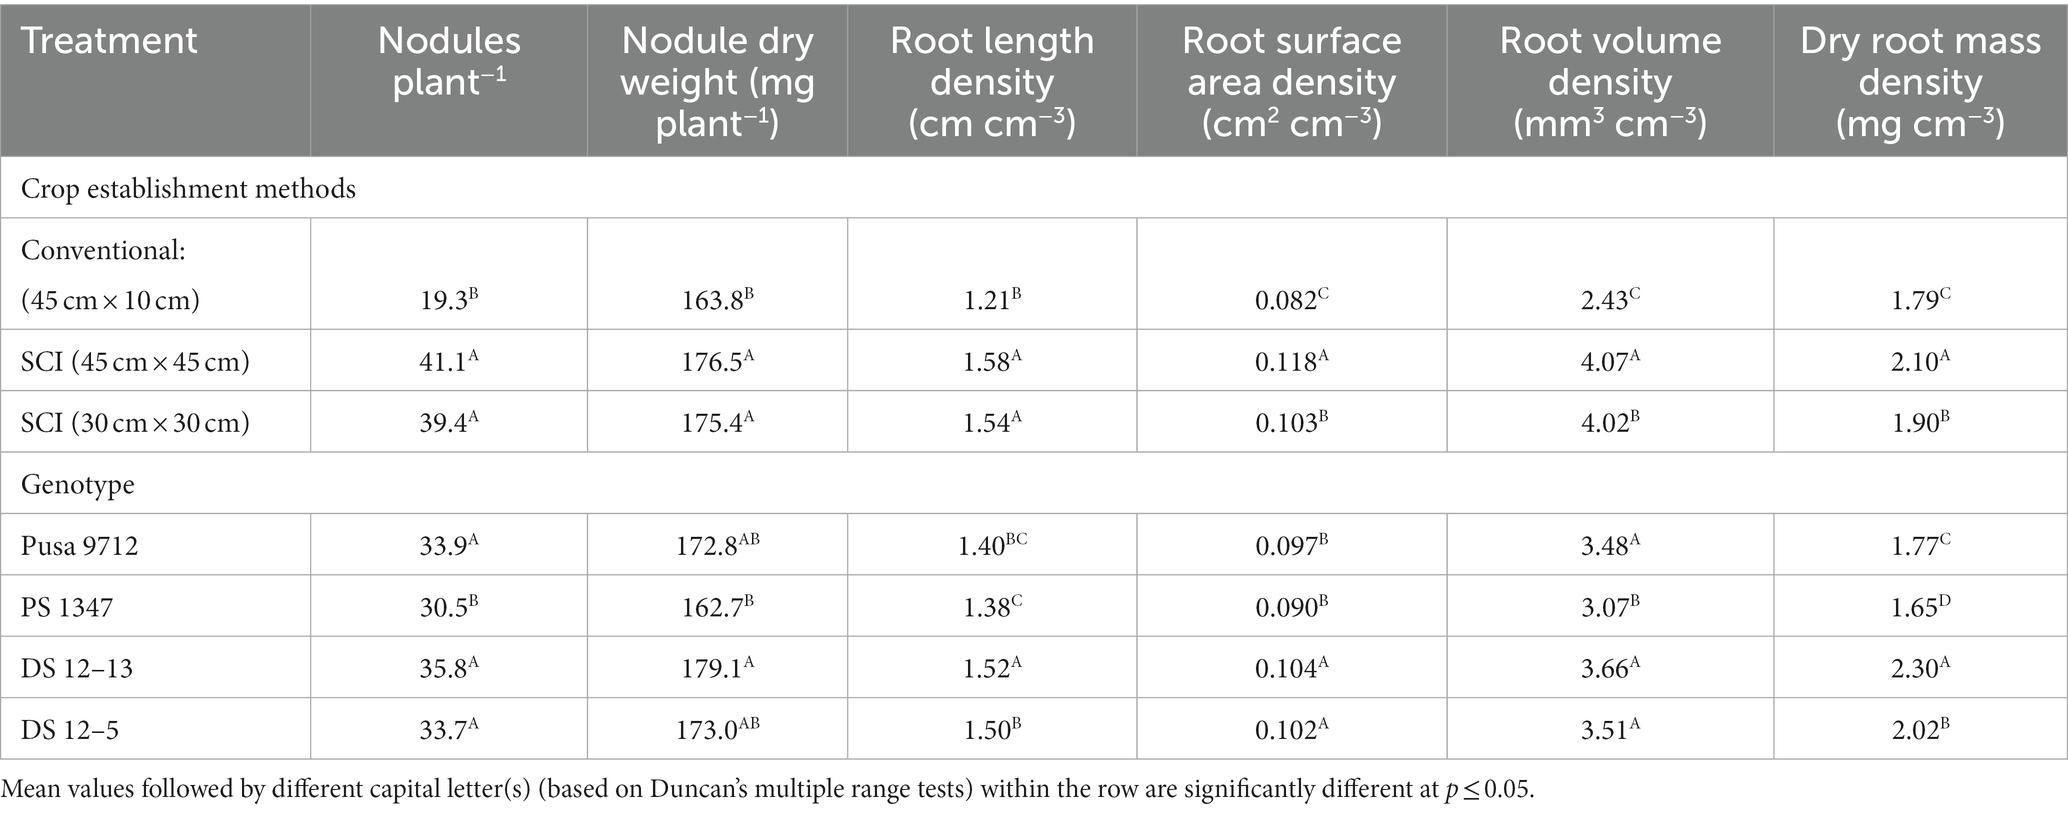
Table 4. Effect of crop establishment methods and cultivars on the root attributes of soybean (mean data of 2 years).
Similarly, density of root length (1.58 cm cm−3), root volume (4.07 mm3 cm−3), surface area (0.118 cm2 cm−3), and dry root mass (2.30 mg cm−3) were significantly higher in the SCI at 45 cm × 45 cm than the conventional method of cultivation. However, differences between both of the SCI methods were not significant. Among the genotypes, DS 12–13 produced a significantly higher density of root length (1.52 cm cm−3), root volume (3.66 mm3 cm−3), surface area (0.104 cm2 cm−3), and dry root mass (2.30 mg cm−3) than Pusa 9712 and PS 1347 but it was on a par with DS 12–5.
During the 2014–2015 and 2015–2016 cropping seasons, the method of cultivation and varieties had a significant effect on soybean seed yields, as well as aboveground biomass yields and harvest index (Table 5). Among the cultivation methods, SCI at 30 cm × 30 cm had a considerably greater seed yield (1.99–2.13 t ha−1), above-ground biomass yield (5.82–6.07 t ha−1), and harvest index (34.2–35.1%) than the conventional method of cultivation (45 × 10 cm). The magnitude of increase in seed yields ranged from 9.6 to 13.3%, and the increases in biomass yields ranged from 8.2 to 10.7%. However, compared with the conventional method of cultivation, yields from both SCI methods were almost identical. Among the genotypes, DS 12–13 produced a significantly higher seed yield (1.97–2.15 t ha−1) and aboveground biomass yield (5.86–6.15 t ha−1) than the PS 1347 and Pusa 9,712 genotypes.
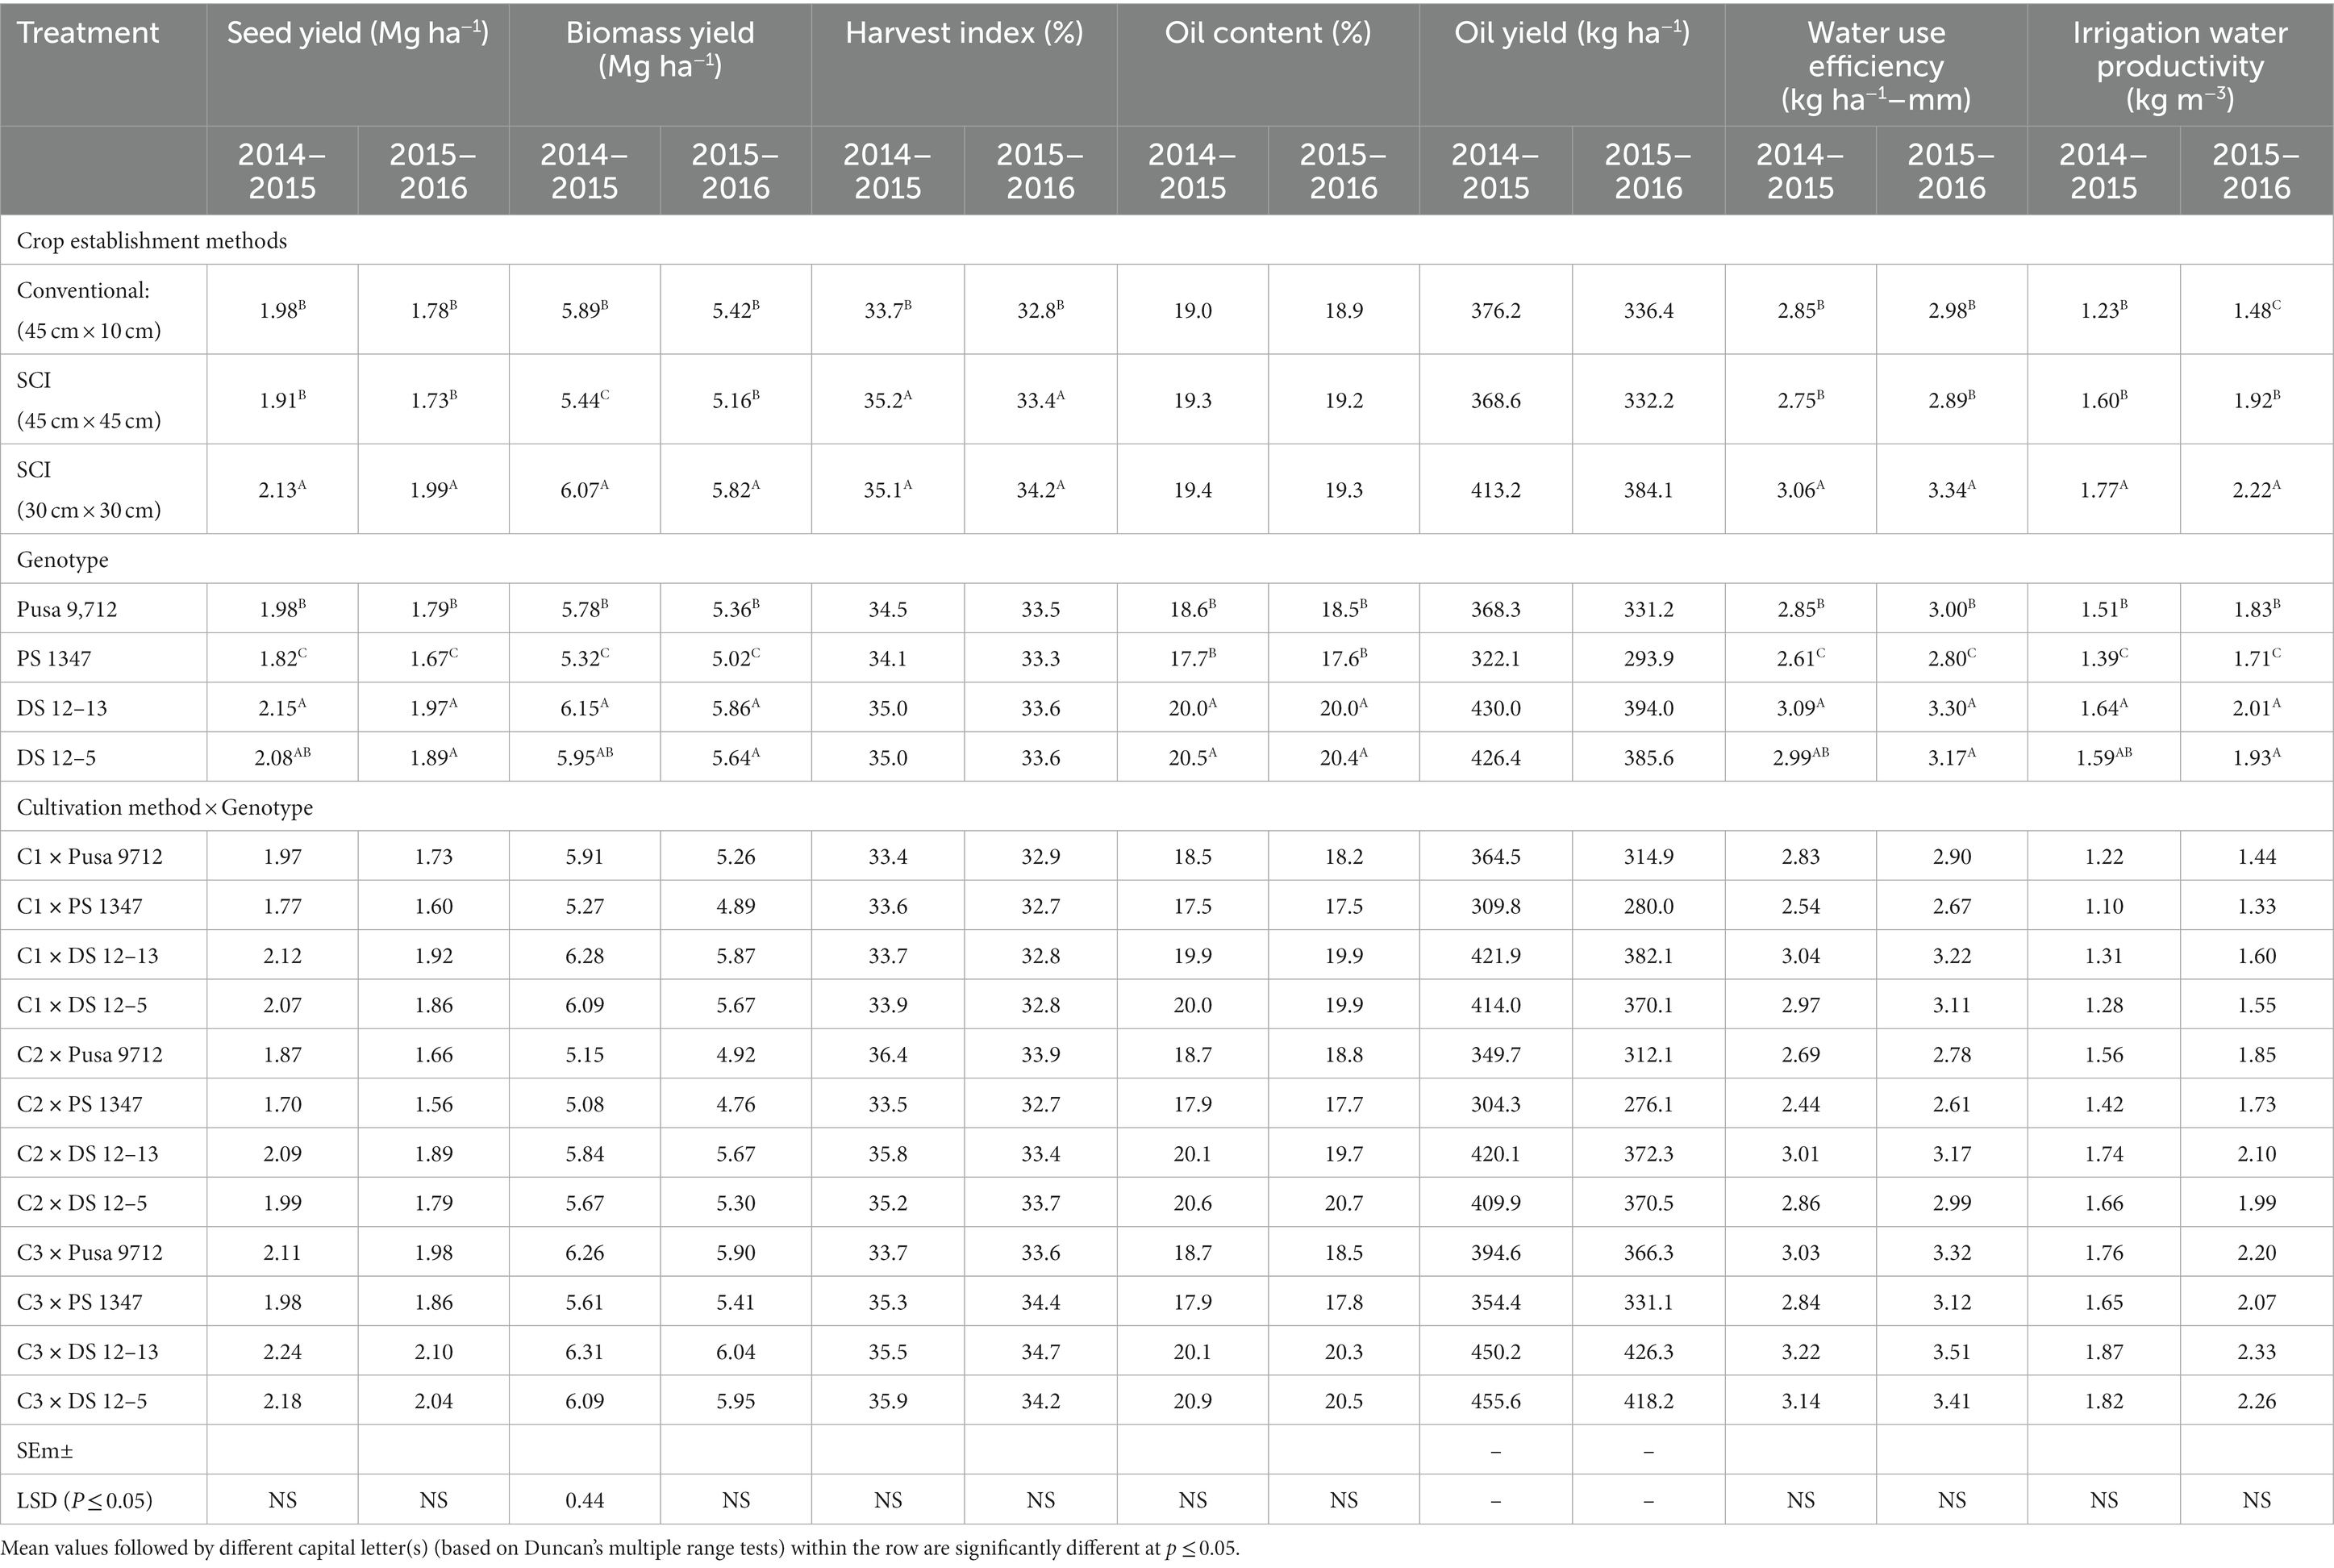
Table 5. Effect of crop establishment methods and cultivars on soybean crop yields, oil yields, and water use efficiency (mean data of 2 years).
The interaction effect of crop establishment methods and genotypes significantly influenced soybean seed and biomass yields (Table 5). The combination of the DS 12–13 genotype with SCI at 30 cm × 30 cm produced a significantly higher seed yield (2.1–2.24 t ha−1) and aboveground biomass yield (6.04–6.31 t ha−1) than other combinations. Interestingly, all the studied genotypes produced significantly higher seed and biomass yields under an SCI at 30 cm × 30 cm than other SCI methods and conventional methods of cultivation.
Irrigation water productivity (IWP) and water usage efficiency (WUE) were considerably influenced by the different cultivation techniques and genotypes (Table 5). SCI at 30 cm × 30 cm yielded significantly higher WUE (3.06–3.34 kg ha−1 mm−1) and IWP (1.77–2.22 kg m−3) than conventional practice. Among the genotypes, DS 12–13 recorded significantly higher WUE (3.09–3.30 kg ha−1 mm−1) and IWP (1.64–2.01 kg m−3) than Pusa 9,712 and PS 1347. Among the interactions, the combination of DS 12–13 with an SCI at 30 cm × 30 cm produced significantly higher WUE (3.22–3.51 t ha−1) and IWP (1.87–2.33 t ha−1) than other combinations. All genotypes produced significantly higher WUE and IWP with an SCI at 30 cm × 30 cm.
Among the cultivation methods, an SCI at 30 cm × 30 cm had a considerably higher oil yield of 384.1 kg ha−1 (2015–2016) and 413.2 kg ha−1 (2014–2015) than the conventional method of cultivation (45 cm × 10 cm), whereas soybean genotypes significantly influenced soybean oil content and yield. Cultivation of the DS 12–13 soybean variety resulted in a statistically higher oil yield (394–430 kg ha−1) than that of PS 1347 and Pusa 9712, but it was statistically on a par with DS 12–5, while soybean DS 12–5 produced a significantly higher oil content (20.4–20.5%) than other genotypes, but it was on a par with DS 12–13.
Perusal of data revealed that NPK concentration and their uptake in grain and straw of soybean influenced statistically due to cultivation methods during the study period (Table 6). However, the genotypes did not have any significant effect on NPK content. Statistically higher N content in grain (5.94%) and straw (2.61%) was noted in SCI at 45 cm × 45 cm compared with other methods of cultivation. Similarly, grain, straw, and total nitrogen uptake was statistically higher with SCI at 30 cm × 30 cm (108.1, 90.59, and 198.7 kg ha−1, respectively) over the rest of the treatments. By contrast, crop establishment methods had no significant effect on P and K concentrations in soybean plant parts, whereas P and K uptake was significantly influenced by cultivation techniques and genotypes. SCI at 30 cm × 30 cm had a significantly greater P uptake in grain, straw, and total P uptake (9.38, 5.72, and 15.10 kg ha−1, respectively) and K uptake in grain, straw, and total P uptake (15.5, 70.3, and 85.8 kg ha−1, respectively) than other cultivation methods. Among the genotypes, the highest P uptake in grain and straw and total P uptake was recorded with DS 12–13 (9.33, 5.79, and 15.12 kg ha−1, respectively), as was K uptake in grain and straw and total P uptake (15.6, 72.2, and 87.8 kg ha−1, respectively) compared with the other genotypes.
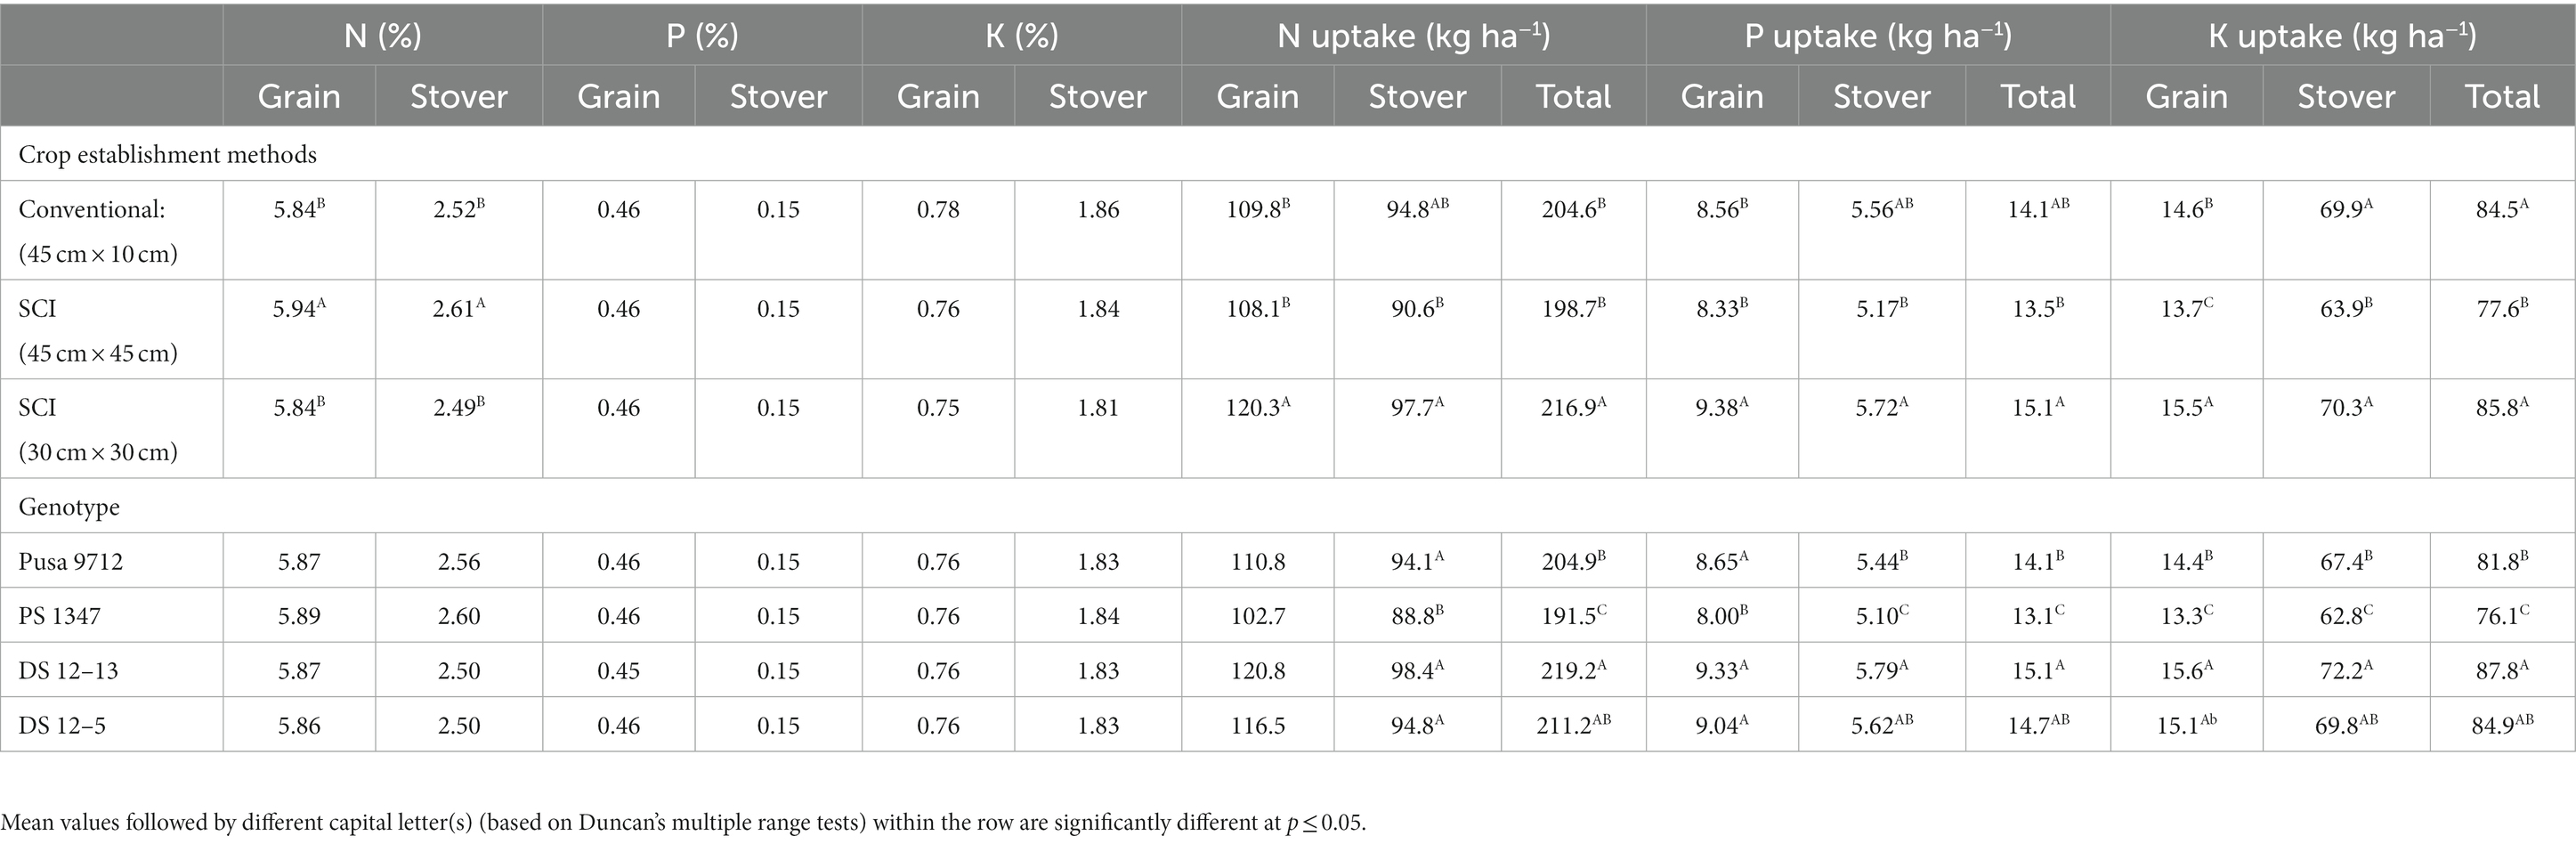
Table 6. Effect of crop establishment methods and cultivars on NPK concentration and their uptake in soybean (mean data of 2 years).
Soil biological properties, such as dehydrogenase activity (DHA) (Figure 1), alkaline phosphatase activity (APA) (Figure 2), acetylene reduction assay (ARA) (Figure 3), total polysaccharides (Figure 4), microbial biomass carbon (MBC) (Figure 5), and soil chlorophyll (Figure 6), were significantly influenced by different methods of cultivation. Significantly higher soil DHA, APA, ARA, total polysaccharides, MBC, and soil chlorophyll were recorded in the SCI at 45 cm × 45 cm (13.63 μg TPF g−1 soil hr.−1, 93.2 μg p–nitro phenol g−1 soil hr.−1, 25.5 n moles ethylene g soil hr.−1, 443.7 mg kg−1 soil, 216.5 mg kg−1 soil, and 0.43 mg g−1 soil, respectively) compared with the conventional method. Among the genotypes, APA and ARA were considerably impacted by soybean genotypes over the study seasons. However, genotypes had no apparent impact on the levels of DHA, total polysaccharides, MBC, and soil chlorophyll. Among the soybean genotypes, DS 12–13 exhibited significantly higher APA (90.0 μg p–nitro phenol g−1 soil hr.−1) and ARA (18.8 n moles ethylene g soil hr.−1) than the other genotypes.
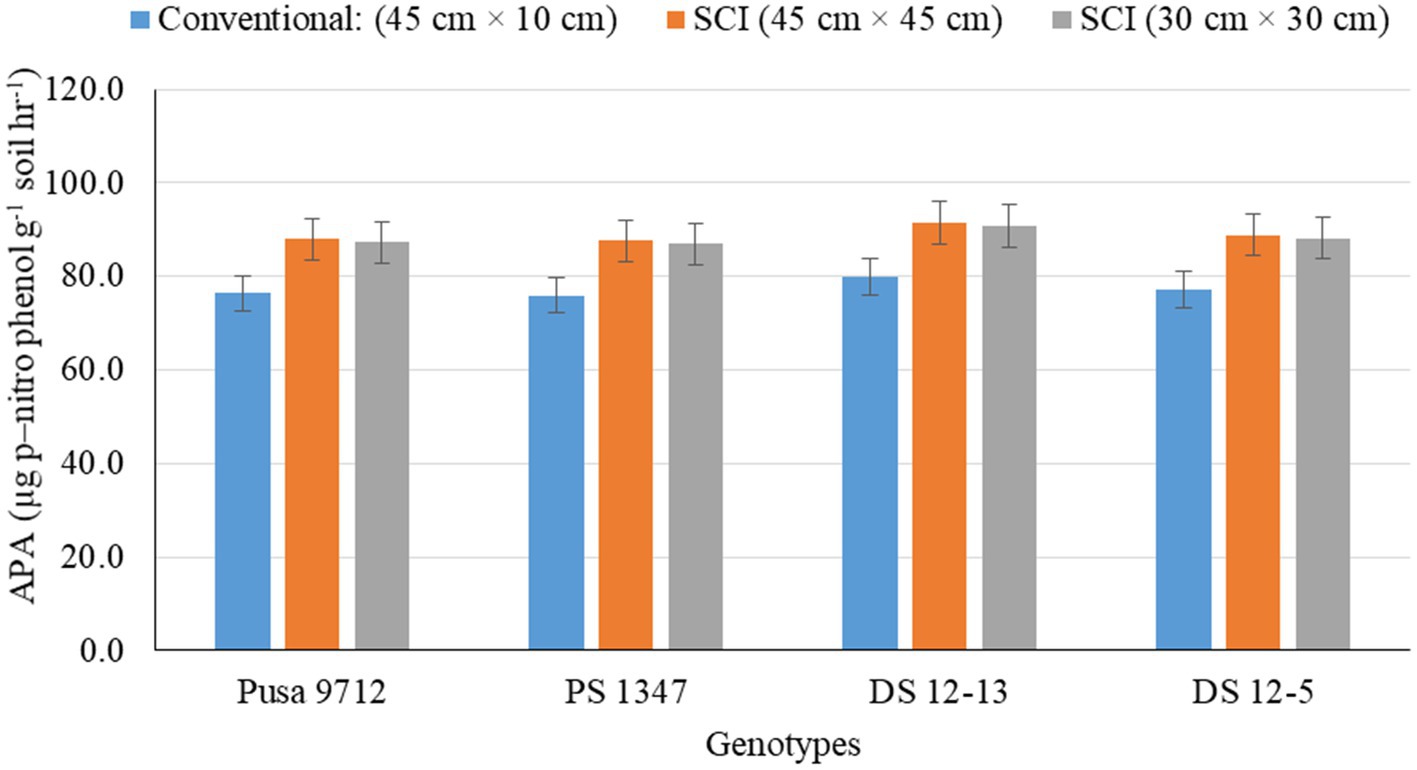
Figure 1. Effect of crop establishment methods and soybean cultivars on dehydrogenase activity (DHA) (mean data of 2 years).
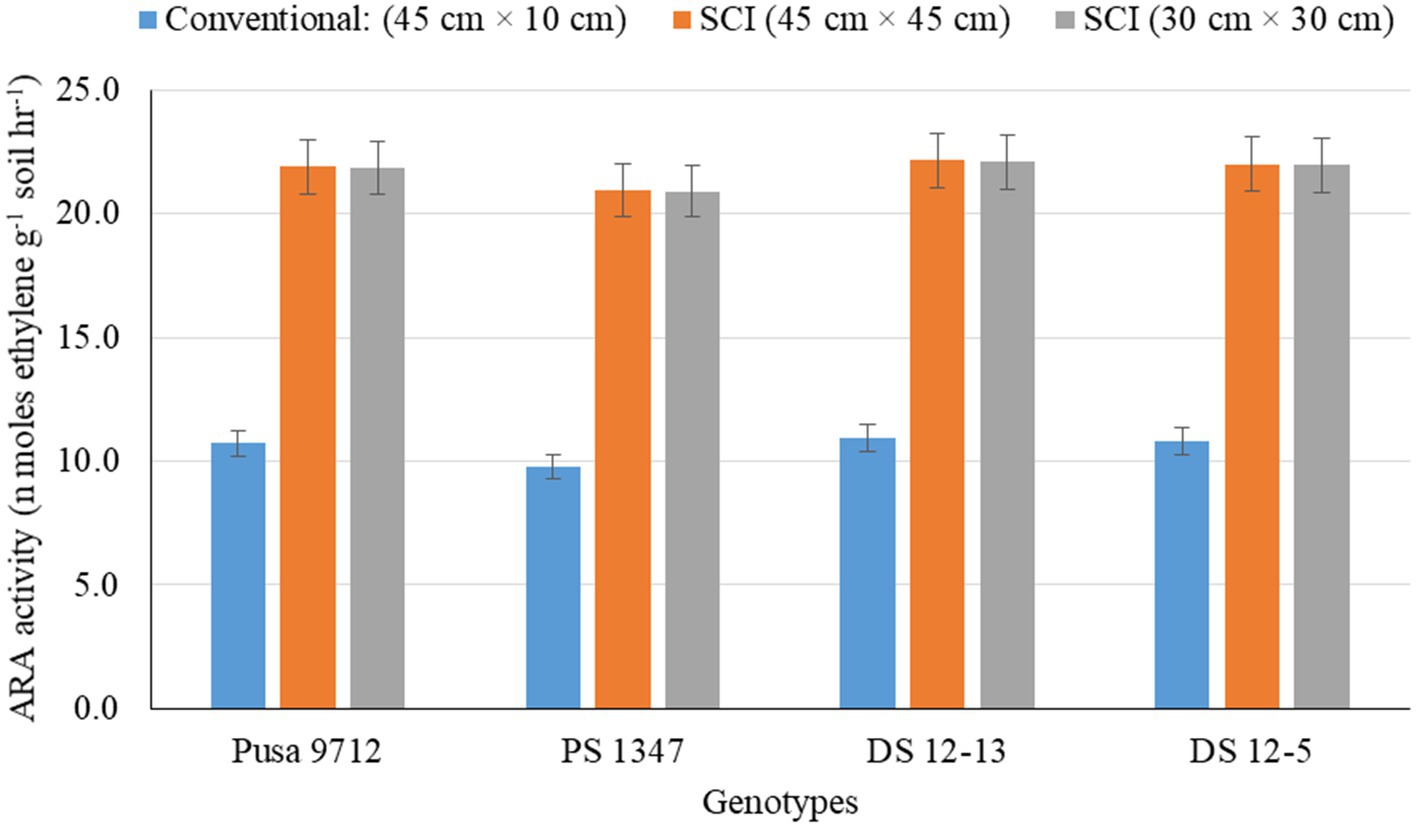
Figure 2. Effect of crop establishment methods and soybean cultivars on alkaline phosphatase activity (APA) (mean data of 2 years).
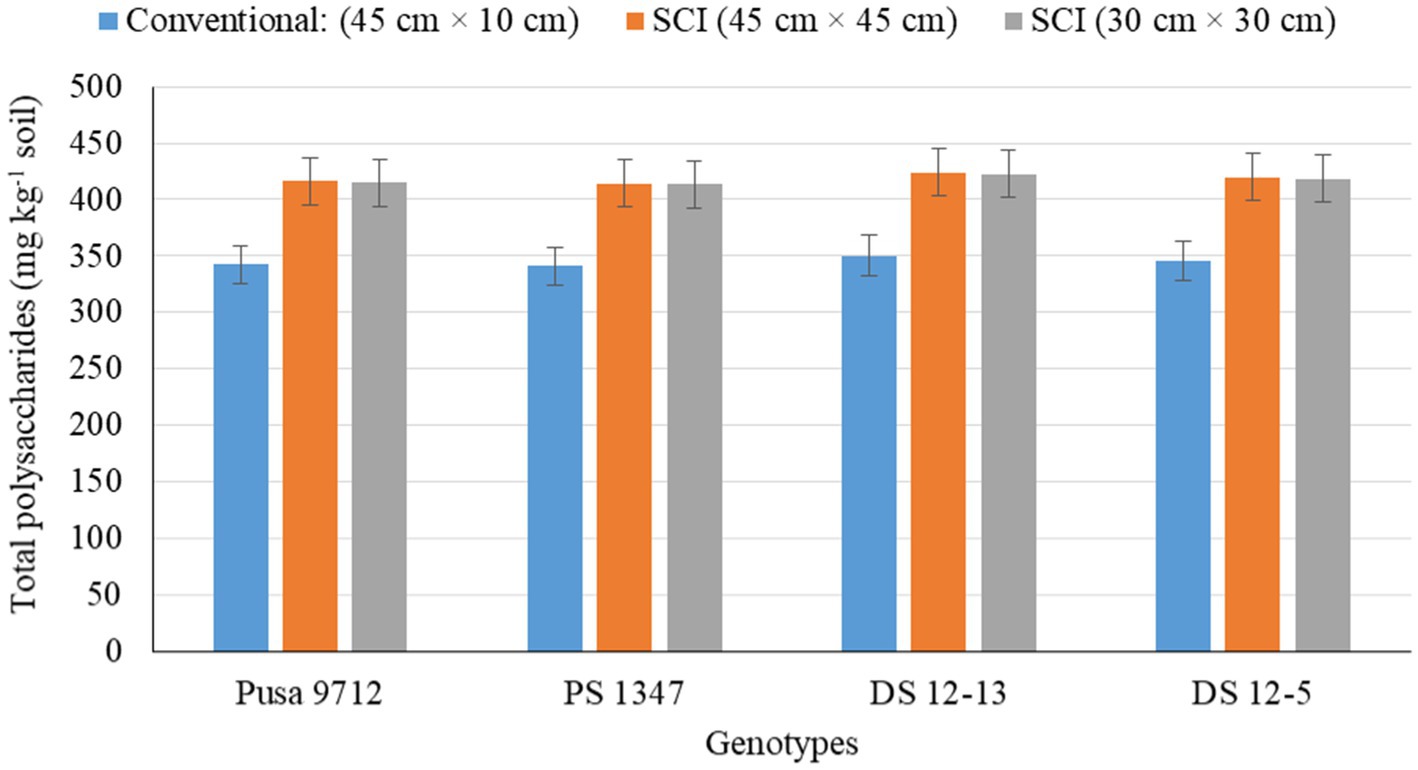
Figure 3. Effect of crop establishment methods and soybean cultivars on acetylene reducing assay (ARA) (mean data of 2 years).
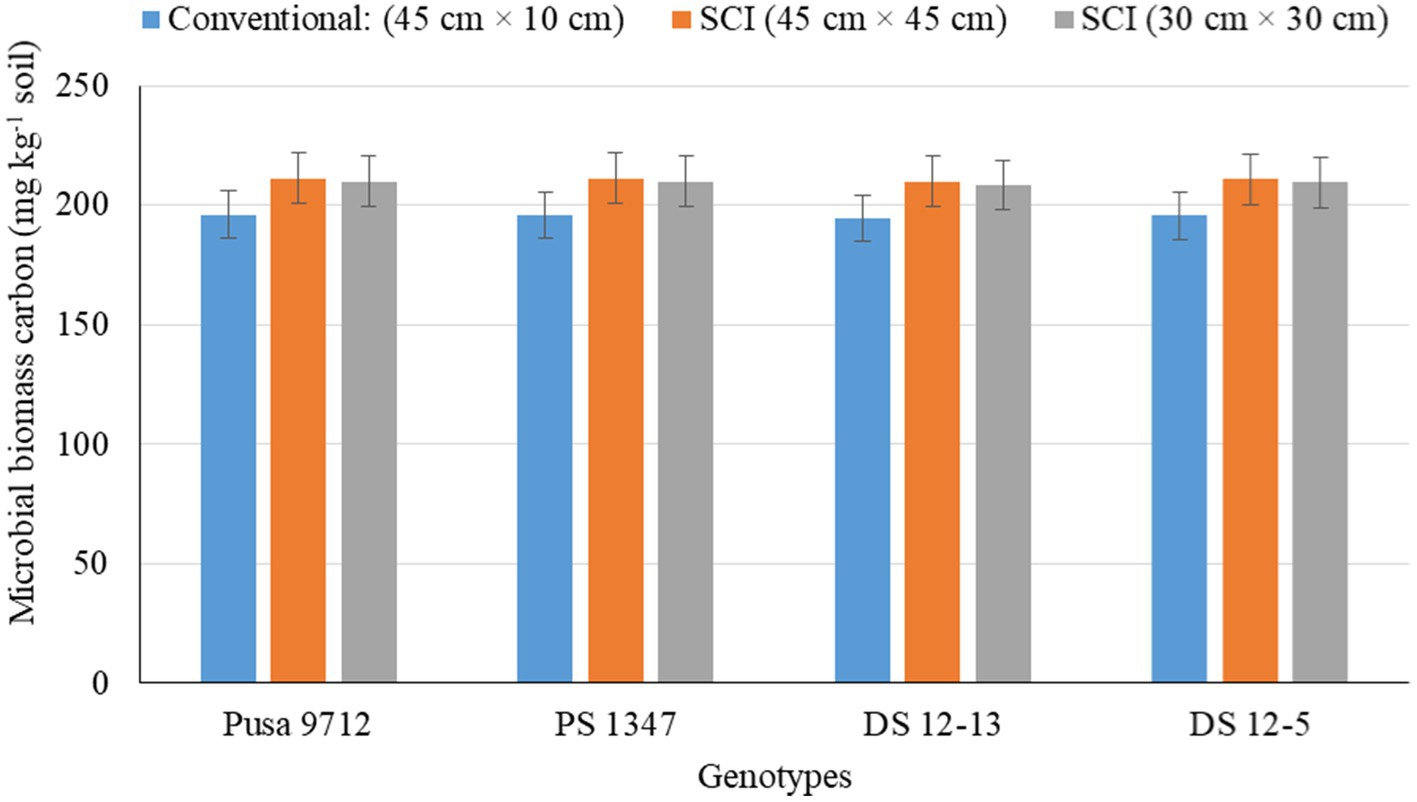
Figure 4. Effect of crop establishment methods and soybean cultivars on total polysaccharides (mean data of 2 years).
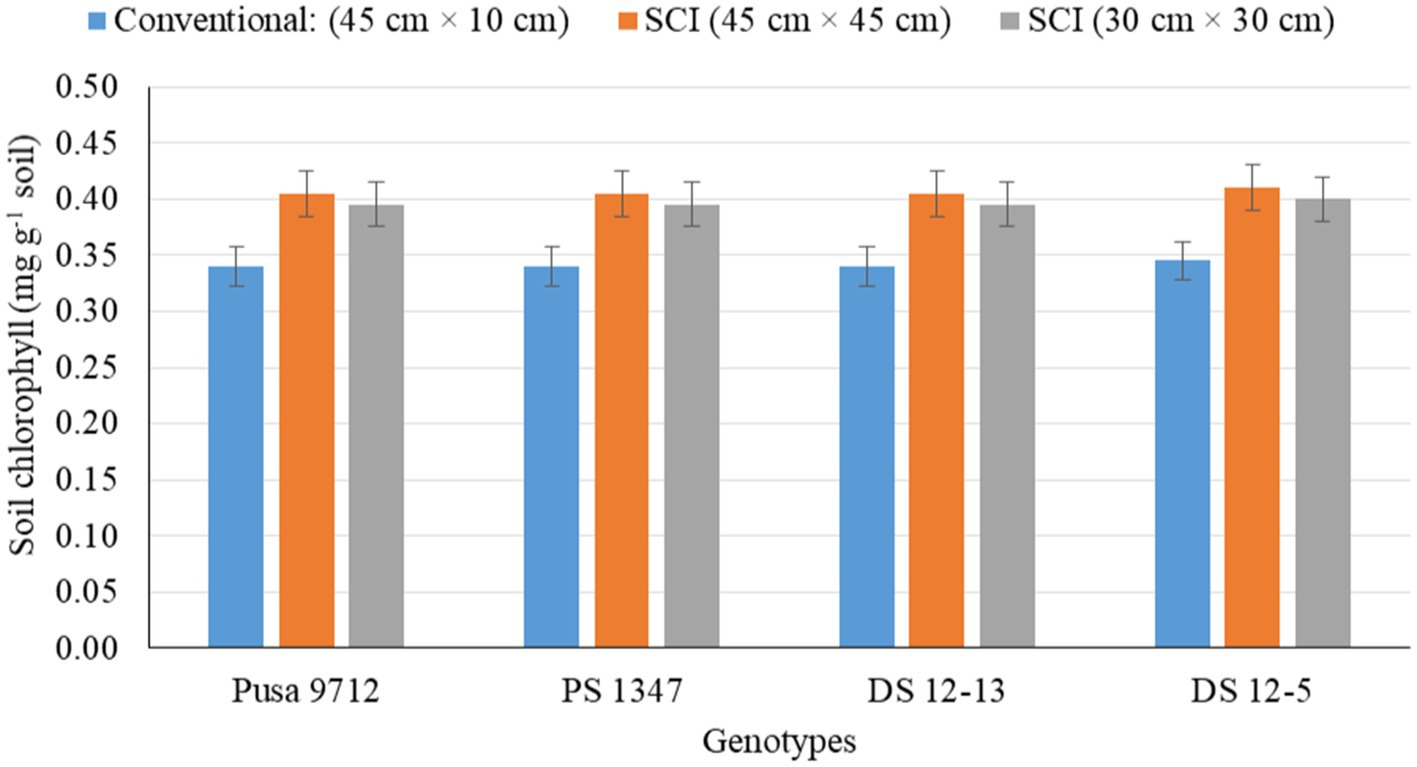
Figure 5. Effect of crop establishment methods and soybean cultivars on microbial biomass carbon (mean data of 2 years).
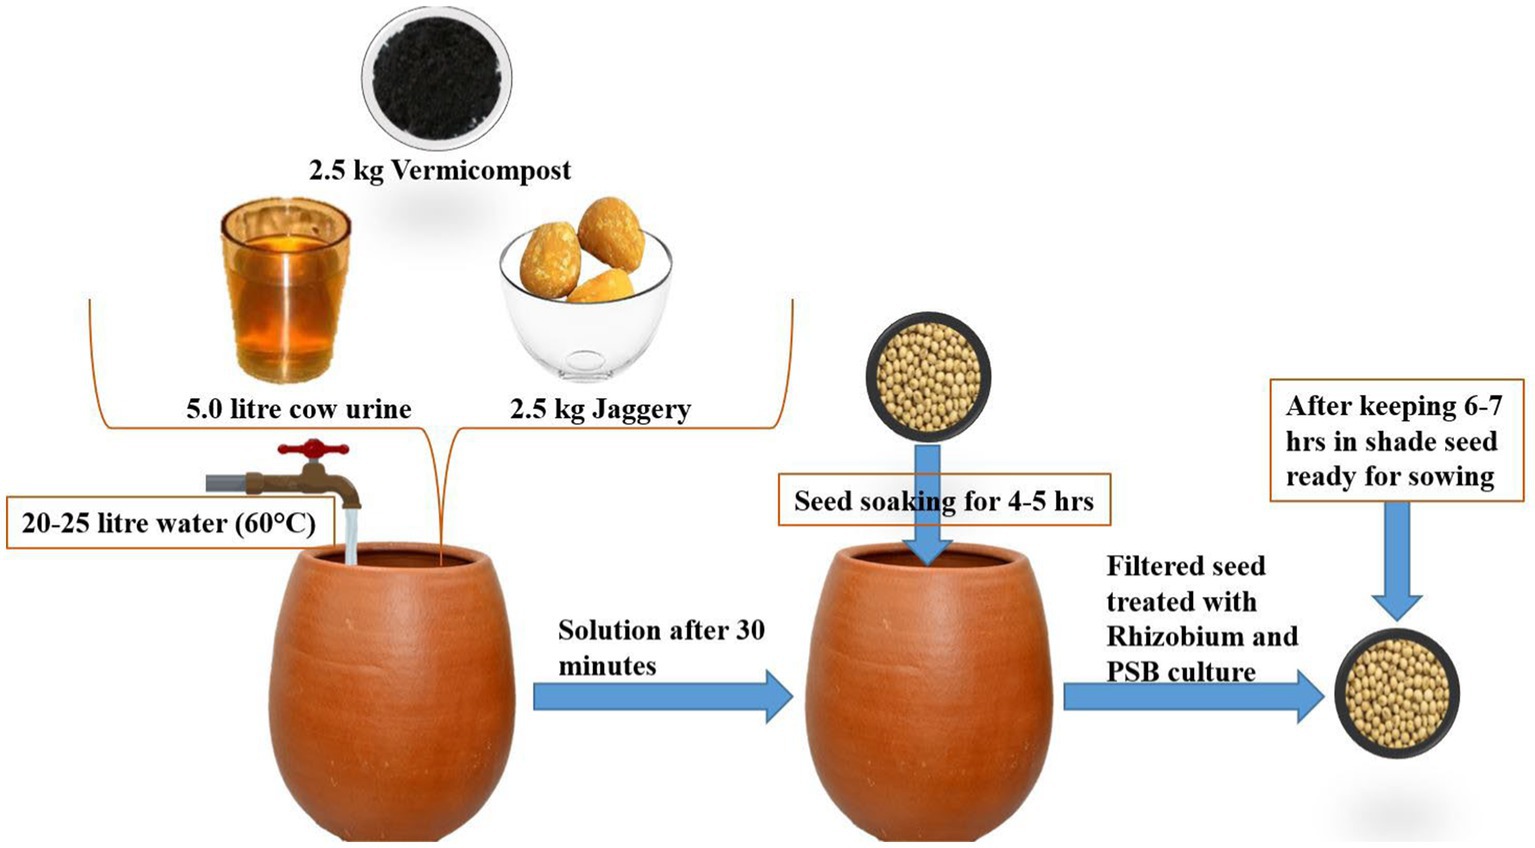
Figure 6. Effect of crop establishment methods and soybean cultivars on soil chlorophyll (mean data of 2 years).
A linear increase in growth indices, such as LAI, CGR, and NAR, was observed with the advancement in the growth stage of the soybean crop under the different cultivation methods and varieties. SCI either at 30 cm × 30 cm or 45 cm × 45 cm exhibited significantly higher LAI, CGR, and NAR over the conventional method (45 cm × 10 cm) due to less competition for growth factors, such as solar radiation interception, root growth, soil aeration, and microbial activity. Ball et al. (2000) reported that an optimum plant population is required for the maximum interception of light for a higher crop growth rate, LAI, NAR, and dry matter accumulation (Berger-Doyle et al., 2014) in the crop.
In the current study, growth indices were higher with the conventional method up to 60 DAS; however, with the advancement of growth stages, LAI, CGR, and NAR increased with the SCI at 30 cm × 30 cm compared with the other cultivation methods. Greater leaf area per plant was observed due to the higher growth performance of the plants that were more widely spaced. A higher population density with the conventional method caused the ceiling effect in the plant canopy, resulting in greater stem elongation leading to increased plant height (Rahman et al., 2004). Rehman et al. (2014) concluded that narrow row spacing (30–40 cm) significantly increased NAR, CGR, RGR, and LAI of soybean compared with wider spacing (70 cm). Among the genotypes, growth attributes were higher in DS 12–13 and DS 12–5 than in other tested cultivars. The growth attributes were significantly influenced by the genetic makeup of plants.
Leaf is the prime plant part to receive incident solar radiation (PAR) and transform it into photosynthates. Therefore, better soybean growth attributes resulted in better physiological parameters. In the current study, the highest intercellular CO2 concentration was produced by an SCI at 30 cm × 30 cm (260.1 μmol CO2 mol−1), and the SCI at 45 cm × 45 cm exhibited a significantly higher stomatal conductance (0.211 mol H2Om−2 s−1) and rate of transpiration (7.8 mmol H2O m−2 s−1) than the other cultivation techniques. The net photosynthetic rate for soybean was substantially higher with the conventional method (398 μmol CO2 m−2 s−1) than with the SCI techniques. A higher transpiration rate and stomatal conductance was observed in the SCI due to the greater leaf surface area and higher temperature (26–36°C). An increased transpiration rate leads to high stomatal conductance, thereby increasing CO2 influx into the chloroplasts, possibly leading to a higher net photosynthetic rate. These findings are corroborated by Moreira et al. (2015) who reported that low planting densities and N rates increased the greenness index (SPAD value), concentration of intercellular carbon dioxide (Ci), and inherent WUE.
Among the soybean genotypes, DS 12–13 had the highest intercellular CO2 concentration (250.3 μmol CO2 mol−1), rate of transpiration (7.5 mmol H2O m−2 s−1), and stomatal conductance (0.220 mol H2O m−2 s−1). There was no significant difference between DS 12–13 and DS 12–5. However, the Pusa 9,712 genotype had a significantly higher rate of net photosynthesis (353 μmol CO2 m−2 s−1) than other genotypes. An increased transpiration rate leads to high stomatal conductance, thereby increasing CO2 influx into the chloroplasts. A significantly higher chlorophyll content, net photosynthetic rate, and stomatal conductance in JS 95–60 than in JS 97–52 was also reported by Vyas and Khandwe (2014).
The PAR interception and transmission by soybean in SCI at 30 cm × 30 cm was 14.05 and 8.5%, respectively, and it was greater than the values obtained with the conventional method and the SCI at 45 cm × 45 cm (Table 5). PAR radiation was intercepted more with the SCI due to the green leaf coverage per unit area. Thereby, SCI at 30 cm × 30 cm intercepted 83.65% of incident PAR compared with 73.35% with the conventional method. High foliage surface aids a higher transpiration rate with a high maximum temperature (22–26°C) at the anthesis stage of soybean; furthermore, an increased transpiration rate leads to high stomatal conductance, thus increasing CO2 entry into the chloroplasts, which might be the reason behind the higher net photosynthetic rate with the SCI method. The density of plants significantly influenced the economic yield in soybean by altering leaf area and therefore light interception and photosynthesis (Wells, 1991) and increasing plant spacing and decreasing row spacing, chlorophyll content (SPAD value), LAI, and the rate of photosynthesis (Jiang et al., 2015). With narrow plant spacing and wider row SPAD, LAI and Pn were higher. The use of wheat straw mulch and wider spacing by Dass and Bhattacharyya (2017) improved leaf SPAD values, PAR interception, the net photosynthetic rate, stomatal conductance, and WUE of soybean in dryland areas. There was a non-significant variation noted among all soybean cultivars with respect to intercepted PAR.
Wide space sowing decreases aboveground competition and ground competitiveness between roots for the absorption of water and nutrients and provides the adequate arena for nodulation and root growth of the crop plants. Therefore, in the current study, wider spacing at 45 cm × 45 cm with an SCI method of cultivation recorded statistically higher nodule counts, higher nodule dry weight (176.5 mg plant−1), better root length, volume, and mass density than the conventional method of cultivation (45 cm × 10 cm). Seed inoculation using Rhizobium culture might have enhanced the population of the effective and healthy Rhizobium strain in the root nodules, which had a better ability to fix atmospheric N. Improved nodulation with the SCI was due to the slow release of nitrogen from FYM, which tends to form more nodules to meet the nitrogen demand of the crop (Salvagiotti et al., 2008). Mondal et al. (2014) showed that plant population had a significant effect on root length, root surface area, and the number of lateral roots/plant at a broader spacing of 20 cm × 30 cm followed by 15 cm × 30 cm.
Among the genotypes, DS 12–13 genotype produced a significantly higher density of root length (1.52 cm cm−3), root volume (3.66 mm3 cm−3), surface area (0.104 cm2 cm−3), and dry root mass (2.30 mg cm−3) Pusa 9712 and PS 1347, but it was on a par with DS 12–5. Varietal root growth performance depends upon the cultivation practice. Additionally, leaf area/plant might be due to the higher growth of individual plants at a wider arrangement than the narrow arrangement. Imtiyaz et al. (2014) observed that DS 9712 had a greater reduction in root dry weight and fresh weight; however, the greatest reduction in shoot fresh and dry weight was noted in PS-1347 and DS-9712, respectively.
The above- and below-ground part of the soybean plant proliferated with the SCI because it provides broader spacing and square planting. Broader spacing leads to the improved growth of specific plants due to the availability of proper space, light, and moisture, which ultimately resulted in higher productivity of the crop (Dass et al., 2015). In the current study, SCI at 30 cm × 30 cm considerably increased seed yields from 9.6 to 13.3% and biomass yields from 8.2 to 10.7% compared with the conventional method of ‘cultivation and the SCI at 45 cm × 45 cm during 2014–2015 and 2015–2016. The increase in yield attributing parameters due to better plant growth and vigor brings out higher yield. More widely spaced soybean sowing resulted in higher seed and straw yield than with narrow row spacing (Pandya et al., 2005). However, compared with the conventional method of cultivation, the yields from both SCI methods were almost identical. Among the genotypes, DS 12–13 produced a significantly higher seed yield (1.97–2.15 t ha−1) and aboveground biomass yield (5.86–6.15 t ha−1) than PS 1347 and Pusa 9712 during both the study seasons. Different genotypes of soybean failed to affect the harvest index significantly during 2014–2015 and 2015–2016. The combination of the DS 12–13 genotype with the SCI at 30 cm × 30 cm produced a significantly higher seed yield (2.10–2.24 t ha−1) and aboveground biomass yield (6.04–6.31 t ha−1) than other combinations. Interestingly, all the studied genotypes produced significantly higher seed and biomass yields with the SCI at 30 cm × 30 cm than other SCI methods and the conventional method of cultivation. The SCI offers wider spacing, square planting, and microbe-loaded organic sources of nutrients, which provide better options for the development of aboveground parts of plants. A similar finding was reported by Abbas et al. (1994) who reported that an optimal plant population boosts the plant to improve yield and yield-attributing characteristics in plants (Abbas et al., 1994).
The SCI at 30 cm × 30 cm yielded significantly higher WUE (3.06–3.34 kg ha−1 mm−1) and IWP (1.77–2.22 kg m−3) than the conventional method (Table 5). Among the genotypes, DS 12–13 recorded significantly higher WUE (3.09–3.30 kg ha−1 mm−1) and IWP (1.64–2.01 kg m−3) than Pusa 9712 and PS 1347. Among the interactions, the combination of DS 12–13 with the SCI at 30 cm × 30 cm produced significantly higher WUE (3.22–3.51 t ha−1) and IWP (1.87–2.33 t ha−1) than the other combinations.
Oil yield is the function of its content and seed production. Among the cultivation methods, SCI at 30 cm × 30 cm had a considerably higher oil yield than the conventional method of cultivation (45 cm × 10 cm) and the SCI at 45 cm × 45 cm. Relatively higher oil yields of 19.38 and 19.27% were obtained with the SCI at 30 cm × 30 cm, followed by the SCI at 45 cm × 45 cm with 19.29 and 19.21%, compared with the conventional method during 2014 and 2015, respectively (Table 5). Improvements in oil content and oil yields with the SCI might be due to increased N and S content in grain on account of enhanced soil nitrogen and S through FYM and single super phosphate. Significantly higher oil content and yield were recorded in DS 12–5 (20.5 and 20.4%) and DS 12–13 (431 and 394 kg/ha) compared with other varieties in both years. A similar finding was reported by Moreira et al. (2015) who reported that plant population, row spacing, and nitrogen rates did not influence oil content in soybean seeds. Diep et al. (2016) reported that biofertilizer application in soybean significantly increased seed oil content and oil yield compared with the control, but remained on a par with 400 kg ha−1 NPK 15-15-15.
Cultivation methods and genotypes significantly affected NPK content in grain and straw, and NPK uptake. Statistically higher NPK content in grain and straw was reported in SCI at 45 cm × 45 cm compared with other methods of cultivation. Similarly, NPK grain and straw and total uptake was statistically higher with SCI at 30 cm × 30 cm. The higher concentration of nutrients in SCI might be due to the microbial breakdown of organic manures, resulting in a release of nutrients into the soil (Prajapati et al., 2014) and, therefore, faster absorption and translocation into plants. Nutrient uptake is a function of nutrient concentration and biomass, and an increase in yield coupled with increased nutrient content resulted in a higher total uptake (Upadhyay et al., 2019) of nutrients with SCI at 30 × 30 cm. The greater microbial and enzymatic activities observed in the present investigation (Table 6) might also be responsible for the release of nutrients, ensuring an adequate supply to the plants. Among the genotypes, DS 12–13 had the highest NPK uptake in grain and straw and total P.
Soil biological properties, such as dehydrogenase activity (DHA) (Figure 1), alkaline phosphatase activity (APA) (Figure 2), ARA (Figure 3), total polysaccharides (Figure 4), MBC (Figure 5), and soil chlorophyll (Figure 6), were significantly higher with the SCI at 45 cm × 45 cm than with the conventional method of cultivation. Improved soil biological properties with the SCI might be due to the application of FYM and split application of vermicompost, which increased soil moisture availability, and the addition of nutrient and organic carbon through the decomposition of organic residue. The availability of easily decomposable carbon (C) sources in soil allows a significant relationship between microbial and enzyme activity and improves the soil water status (Shen et al., 2016). However, carbon is positively correlated with the microbial biomass carbon (Almeida et al., 2011). Hoeing practice in the SCI created a soil mulch, which reduced evaporation and improved soil moisture and, thus, enhanced soil enzymatic activities compared with the conventional method. Among the genotypes, APA and ARA were considerably impacted by soybean genotype. However, genotypes had no apparent impact on the levels of DHA, total polysaccharides, MBC, or soil chlorophyll. Thus, DS12-13 exhibited significantly higher APA (90.0 μg p–nitro phenol g−1 soil hr.−1) and ARA (18.8 n moles ethylene g soil hr.−1) than the other genotypes.
From the present study, the following conclusions have been drawn for the farming community, research planners, and policy makers:
• In soybean growing regions, soybean crop intensification (SCI) exhibits higher growth and physiological attributes, such as stomatal conductance, intercellular CO2 concentration, and net photosynthetic rates, than conventional methods of cultivation.
• Thus, enhanced physiological attributes increased soybean seed yields from 9.6 to 13.3% and biomass yields from 8.2 to 10.7% through the adoption of SCI at 30 cm × 30 cm over the conventional method of cultivation (45 cm × 10 cm).
• Concurrently, intercoalition operation using a hand hoe in SCI plots resulted in reduced weed infestation, thereby increasing the number of root nodules and improving root attributes and crop water productivity.
• Wider spacing at 30 cm × 30 cm or 45 cm × 45 cm with SCI exhibited higher photosynthetically active radiation (PAR) interception and transmittance by soybean genotypes than with the conventional method.
• Soybean genotypes DS 12–13 and DS 12–5 were superior in increasing soybean yields than the other genotypes.
• Concurrently, soil biological properties, such as dehydrogenase activity (DHA), alkaline phosphatase activity (APA), acetylene reduction assay (ARA), total polysaccharides, microbial biomass carbon (MBC), and soil chlorophyll, were also significantly enhanced with SCI compared with the conventional method of soybean establishment.
• Therefore, the adoption of SCI either at 30 cm × 30 cm and/or 45 cm × 45 cm could provide the best environment for microbial activities beneath the soil and sustainable productivity of the soybean aboveground.’
The original contributions presented in the study are included in the article/Supplementary material, further inquiries can be directed to the corresponding author.
RamS: methodology, statistical analysis, investigation, writing—original draft. SD and VSi: conceptualization, supervision, writing—review and editing, funding acquisition. PU, GR, and RajS: statistical analysis and writing—original draft. RK and KS: writing—review and editing. SuB: investigation, formal analysis and writing—original draft. SSR: editing final manuscript. AD and SR: data tabulation and statistical analysis. AK: investigation, writing—original draft. GG: statistical analysis of data. GS: statistical analysis and tabulation. VP: statistical analysis. BK and ShB: manuscript editing. VSh: soil analysis. All authors contributed to the article and approved the submitted version.
This study was undertaken by inhouse project of ICAR-Indian Agricultural Research Institute, New Delhi.
The authors declare that the research was conducted in the absence of any commercial or financial relationships that could be construed as a potential conflict of interest.
All claims expressed in this article are solely those of the authors and do not necessarily represent those of their affiliated organizations, or those of the publisher, the editors and the reviewers. Any product that may be evaluated in this article, or claim that may be made by its manufacturer, is not guaranteed or endorsed by the publisher.
The Supplementary material for this article can be found online at: https://www.frontiersin.org/articles/10.3389/fsufs.2023.1194867/full#supplementary-material
Abbas, M., Singh, H. P., Nigam, K. B., and Kandalkar, V. S. (1994). Effect of phosphorus, plant density and plant type on different growth and physiological characters of soybean [Glycine max (L.) Merrill]. Indian J. Agron. 88, 1407–1412. doi: 10.56093/ijas.v88i9.83500
Abraham, B., Araya, H., Berhe, T., Edwards, S., Gujja, B., Khadka, R. B., et al. (2014). The system of crop intensification: reports from the field on improving agricultural production, food security, and resilience to climate change for multiple crops. Agric. Food Secur. 3, 1–12. doi: 10.1186/2048-7010-3-4
Adhikari, P., Araya, H., Aruna, G., Balamatti, A., Banerjee, S., Baskaran, P., et al. (2018). System of crop intensification for more productive, resource-conserving, climate-resilient, and sustainable agriculture: experience with diverse crops in varying agroecologies. Int. J. Agric. Sustain. 16, 1–28. doi: 10.1080/14735903.2017.1402504
Almeida, D. D. O., Klauberg Filho, O., Almeida, H. C., Gebler, L., and Felipe, A. F. (2011). Soil microbial biomass under mulch types in an integrated apple orchard from southern Brazil. Sci. Agric. 68, 217–222. doi: 10.1590/S0103-90162011000200012
Anonymous (2017). Directorate of Economics and Statistics, Department of Agriculture, and Farmers Welfare. (2017).
Araya, H., Edwards, S., Asmelash, A., Legesse, H., Zibelo, G. H., Assefa, T., et al. (2013). SCI: planting with space. Farm. Matt. 29, 34–37.
Ball, R. A., Purcell, L. C., and Vories, E. D. (2000). Short-season soybean yield compensation in response to population and water regime. Crop Sci. 40, 1070–1078. doi: 10.2135/cropsci2000.4041070x
Berger-Doyle, J., Zhang, B., Smith, S. F., and Chen, P. (2014). Planting date, irrigation, and row spacing effects on agronomic traits of food-grade soybean. Adv. Crop. Sci. Technol. 2:149. doi: 10.4172/2329-8863.1000149
Cárceles Rodríguez, B., Durán-Zuazo, V. H., Soriano Rodríguez, M., García-Tejero, I. F., Gálvez Ruiz, B., and Cuadros Tavira, S. (2022). Conservation agriculture as a sustainable system for soil health: a review. Soil Syst. 6:87. doi: 10.3390/soilsystems6040087
Casida, L. E. J., Klein, D. A., and Santoro, T. (1964). Soil dehydrogenase activity. Soil Sci. 98, 371–376. doi: 10.1097/00010694-196412000-00004
Costa, C., Dwyer, L. M., Hamilton, R. I., Hamel, C., Nantais, L., and Smith, D. L. (2000). A sampling method for measurement of large root systems with scanner-based image analysis. Agron. J. 92, 621–627. doi: 10.2134/agronj2000.924621x
Dass, A., and Bhattacharyya, R. (2017). Wheat residue mulch and anti-transpirants improve productivity and quality of rainfed soybean in semi-arid north-Indian plains. Field Crop Res. 210, 9–19. doi: 10.1016/j.fcr.2017.05.011
Dass, A., Chandra, S., Choudhary, A. K., Singh, G., and Sudhishri, S. (2015). Influence of field re-ponding pattern and plant spacing on rice root-shoot characteristics, yield and water productivity of two modern cultivars under SRI management in Indian Mollisols. Paddy Water Environ. 14, 45–59. doi: 10.1007/s10333-015-0477-z
Dass, A., Dey, D., Lal, S. K., and Rajanna, G. A. (2018). Tank-mix insecticide and herbicide application effects on weeds, insect-pest menace and soybean productivity in semi-arid Northern Plains of India. Legum. Res. 42, 385–391. doi: 10.18805/LR-3855
Dhar, S., Barah, B. C., Vyas, A. K., and Uphoff, N. (2016). Comparing system of wheat intensification (SWI) with standard recommended practices in the north-western plain zone of India. Arch. Agron. Soil Sci. 62, 994–1006. doi: 10.1080/03650340.2015.1101518
Diep, C. N., Duong, B. T., and Nguyen, P. V. (2016). Effects of rhizobia and phosphate-solubilizing bacteria on soybean (Glycine max L.) cultivated on ferralsols of daklak province, Vietnam. World J. Phar. Pharm. Sci. 5, 318–333.
Dutta, D., Singh, V. K., Upadhyay, P. K., Meena, A. L., Kumar, A., Mishra, R. P., et al. (2022). Long-term impact of organic and inorganic fertilizers on soil organic carbon dynamics in a rice-wheat system. Land Degrad. Dev. 33, 1862–1877. https://doi:10.1002/ldr.4267. doi: 10.1002/ldr.4267
Fatima, A., Singh, V. K., Babu, S., Singh, R. K., Upadhyay, P. K., Rathore, S. S., et al. (2023). Food production potential and environmental sustainability of different integrated farming system models in Northwest India. Front. Sustain. Food Syst. 7:959464. doi: 10.3389/fsufs.2023.959464
Gomez, K. A., and Gomez, A. A. (1984). Statistical Procedures for Agricultural Research. 2nd Edition. New York: John Wiley and Sons, 680.
Gupta, G., Dhar, S., Kumar, A., Choudhary, A. K., Dass, A., Sharma, V. K., et al. (2022). Microbes-mediated integrated nutrient management for improved rhizo-modulation, pigeonpea productivity, and soil bio-fertility in a semi-arid agro-ecology. Front. Microbiol. 13:924407. doi: 10.3389/fmicb.2022.924407
Imtiyaz, S., Agnihotri, R. K., Ahmad, S., and Sharma, R. (2014). Effect of cobalt and lead induced heavy metal stress on some physiological parameters in Glycine max. Int. J. Agric. Crop Sci. 7, 26–34.
Jat, S. L., Parihar, C. M., Singh, A. K., Nayak, H. S., Meena, B. R., Kumar, B., et al. (2019). Differential response from nitrogen sources with and without residue management under conservation agriculture on crop yields, water-use and economics in maize-based rotations. Field Crop Res. 236, 96–110. https://doi:10.1016/j.fcr.2019.03.017. doi: 10.1016/j.fcr.2019.03.017
Jiang, L., Hu, S., Wang, Y., Su, S., Sun, L., Xu, B., et al. (2015). Catalytic effects of inherent alkali and alkaline earth metallic species on steam gasification of biomass. Int. J. Hydrog. Energy 40, 15460–15469. doi: 10.1016/j.ijhydene.2015.08.111
Kong, Z., and Liu, H. (2022). Modification of rhizosphere microbial communities: a possible mechanism of plant growth promoting Rhizobacteria enhancing plant growth and fitness. Front. Plant Sci. 13:920813. doi: 10.3389/fpls.2022.920813
Mondal, M. M. A., Puteh, A. B., Kashem, M. A., and Hasan, M. M. (2014). Effect of plant density on canopy structure and dry matter partitioning into plant parts of soybean (Glycin max). Life Sci. J. 11, 67–74.
Moreira, A., Moraes, L. A. C., Schroth, G., and Mandarino, J. M. G. (2015). Effect of nitrogen, row spacing, and plant density on yield, yield components, and plant physiology in soybean-wheat intercropping. Agron. J. 107, 2162–2170. doi: 10.2134/AGRONJ15.0121
Nayak, S., Prasanna, R., Pabby, A., Dominic, T. K., and Singh, P. K. (2004). Effect of urea, blue green algae and Azolla on nitrogen fixation and chlorophyll accumulation in soil under rice. Biol. Fertil. Soils 40, 67–72. doi: 10.1007/s00374-004-0738-2
Nunan, N., Morgan, M. A., and Herlihy, M. (1998). Ultraviolet absorbance (280 nm) of compounds released from soil during chloroform fumigation as an estimate of the microbial biomass. Soil Biol. Biochem. 30, 1599–1603. doi: 10.1016/S0038-0717(97)00226-5
Pandey, R., Paul, V., and Singh, M. P. (2017). Measurement of photosynthesis using infrared gas analyzer. Manual of ICAR sponsored training programme for technical staff of ICAR Institutes on physiological techniques to analyze the impact of climate change on crop plants. IIFSR. 19–22.
Pandya, N., Chouhan, G. S., and Nepalia, V. (2005). Effect of varieties, crop geometries and weed management on nutrient uptake by soybean [Glycine max (L.) Merrill] and associated weeds. Indian J. Agron. 50, 218–220.
Prajapati, K., Vyas, A. K., and Dhar, S. (2014). Productivity, profitability and land-use efficiency of soybean (Glycine max)-based cropping systems under different nutrient-management practices. Indian J. Agron. 59, 229–234.
Prasad, R., Shivay, Y. S., Kumar, D., and Sharma, S. N. (2006). Learning by doing exercises in soil fertility (a practical manual for soil fertility). Indian Agricultural Research Institute, New Delhi.
Prasanna, R., Tripathi, U., Dominic, T. K., Singh, A. K., Yadav, A. K., and Singh, P. K. (2003). An improvized technique for measurement of nitrogen fixation by blue green algae and Azolla using moist soil cores from rice fields. Exp. Agric. 39, 145–150. doi: 10.1017/S0014479702001187
Radosavljevic, S., Haider, L. J., Lade, S. J., and Schlüter, M. (2020). Effective alleviation of rural poverty depends on the interplay between productivity, nutrients, water and soil quality. Ecol. Econ. 169:106494. doi: 10.1016/j.ecolecon.2019.106494
Rahman, M., Gul, S., and Ahmad, A. (2004). Effects of water stress on growth and photosynthetic pigments of corn (Zea mays L.) cultivars. Int. J. Agric. Biol. 6, 652–655.
Rajanna, G. A., Dass, A., Suman, A., Babu, S., Paramesh, V., Singh, V. K., et al. (2022). Co-implementation of tillage, irrigation, and fertilizers in soybean: impact on crop productivity, soil moisture, and soil microbial dynamics. Field Crop Res. 288:108672. doi: 10.1016/j.fcr.2022.108672
Rajanna, G. A., Dhindwal, A. S., Rawal, S., and Pooniya, V. (2019). Energetics, water and crop productivity of wheat (Triticum aestivum)–cluster bean (Cyamopsis tetragonoloba) sequence under land configuration and irrigation regime in semi-arid agro-ecosystem. Indian J. Agron. 64, 450–457.
Rehman, M., Khaliq, T., Ahmad, A., Wajid, S. A., Rasul, F., Hussain, J., et al. (2014). Effect of planting time and cultivar on soybean performance. Acad. J. Agric. Res. 2, 134–138.
Salvagiotti, F., Cassman, K. G., Specht, J. E., Walters, D. T., Weiss, A., and Dobermann, A. (2008). Nitrogen uptake, fixation and response to fertilizer N in soybeans: a review. Field Crops Res. 108, 1–13. doi: 10.1016/j.fcr.2008.03.001
Shen, Y., Chen, Y., and Li, S. (2016). Microbial functional diversity, biomass and activity as affected by soil surface mulching in a semiarid farmland. PLoS One 11:e0159144. doi: 10.1371/journal.pone.0159144
Singh, R. K., Dhar, S., Dass, A., Sharma, V. K., Kumar, A., Gupta, G., et al. (2018). Productivity and profitability of soybean (Glycine max) and wheat (Triticum aestivum) genotypes grown in sequence under system of crop intensification. Indian J. Agric. Sci. 88, 1407–1412. doi: 10.56093/ijas.v88i9.83500
Singh, V. K., Dwivedi, B. S., Mishra, R. P., Shukla, A. K., Timsina, J., Upadhyay, P. K., et al. (2019). Yields, soil health and farm profits under a rice-wheat system: long-term effect of fertilizers and organic manures applied alone and in combination. Agronomy 9, 1–22. doi: 10.3390/agronomy9010001
Tabatabai, M. A., and Bremner, J. M. (1969). Use of p-nitrophenyl phosphate for assay of soil phosphatase activity. Soil Biol. Biochem. 1, 301–307. doi: 10.1016/0038-0717(69)90012-1
Upadhyay, P. K., Sen, A., Prasad, S. K., Singh, Y., Srivastava, J. P., Singh, S. P., et al. (2018). Effect of panchagavya and recommended dose of fertilizers on growth, nutrient content and productivity of transplanted rice (Oryza sativa) under middle Gangetic plain of India. Indian J. Agric. Sci. 88, 931–936. doi: 10.56093/ijas.v88i6.80650
Upadhyay, P. K., Sen, A., Rathore, S. S., Kumar, B., Singh, R. K., Prasad, S. K., et al. (2019). Scientific validation of indigenous organic formulation-panchagavya for sustaining rice productivity and residual effect in rice-lentil system under hot semi-arid eco-region of middle indo-gangetic plains. Indian J. Trad. Knowl. 18, 104–113.
Upadhyay, P. K., Sen, A., Singh, Y., Singh, R. K., Prasad, S. K., Sankar, A., et al. (2022). Soil health, energy budget, and rice productivity as influenced by cow products application with fertilizers under south Asian eastern indo-gangetic plains zone. Front. Agron. 3:758572. doi: 10.3389/fagro.2021.758572
Uphoff, N., Chi, F., Dazzo, F. B., and Rodriguez, R. J. (2013). “Soil fertility as a contingent rather than inherent characteristic: considering the contributions of crop-symbiotic soil biota” in Principles of sustainable soil management in agroecosystems. eds. R. Lal and B. Stewart (Boca Raton FL: Taylor & Francis), 141–166.
Vyas, M. D., and Khandwe, R. (2014). Effect of row spacing and seed rate on morphophysiological parameters, yield attributes and productivity of soybean [Glycine max (L.) Merrill] cultivars under rainfed condition of Vindhyan plateau of Madhya Pradesh. Soybean Res. 10, 82–91.
Watson, D. J. (1952). The physiological basis of variation in yield. Adv. Agron. 4, 101–145. doi: 10.1016/S0065-2113(08)60307-7
Watson, D. J. (1958). The dependence of net assimilation rate on leaf-area index. Ann. Bot. 22, 37–54. doi: 10.1093/oxfordjournals.aob.a083596
Keywords: seed yield, soil biology, soybean physiology, soybean crop intensification, water productivity
Citation: Singh RK, Upadhyay PK, Dhar S, Rajanna GA, Singh VK, Kumar R, Singh RK, Babu S, Rathore SS, Shekhawat K, Dass A, Kumar A, Gupta G, Shukla G, Rajpoot S, Prakash V, Kumar B, Sharma VK and Barthakur S (2023) Soybean crop intensification for sustainable aboveground-underground plant–soil interactions. Front. Sustain. Food Syst. 7:1194867. doi: 10.3389/fsufs.2023.1194867
Edited by:
Arnab Majumdar, Jadavpur University, IndiaReviewed by:
Mohamed Anli, Universitédes Comores, ComorosCopyright © 2023 Singh, Dhar, Upadhyay, Rajanna, Singh, Kumar, Singh, Babu, Rathore, Shekhawat, Dass, Kumar, Gupta, Shukla, Rajpoot, Prakash, Kumar, Sharma and Barthakur. This is an open-access article distributed under the terms of the Creative Commons Attribution License (CC BY). The use, distribution or reproduction in other forums is permitted, provided the original author(s) and the copyright owner(s) are credited and that the original publication in this journal is cited, in accordance with accepted academic practice. No use, distribution or reproduction is permitted which does not comply with these terms.
*Correspondence: Pravin Kumar Upadhyay, cHJhdmluLm5kdUBnbWFpbC5jb20=; Shiva Dhar, ZHJzZG1pc3JhQGdtYWlsLmNvbQ==; G. A. Rajanna, cmFqYW5uYS5nYTZAZ21haWwuY29t; Vinod Kumar Singh, dmt1bWFyc2luZ2hfMDFAeWFob28uY29t; Bipin Kumar, YmlwaW5pYXJpQGdtYWlsLmNvbQ==
Disclaimer: All claims expressed in this article are solely those of the authors and do not necessarily represent those of their affiliated organizations, or those of the publisher, the editors and the reviewers. Any product that may be evaluated in this article or claim that may be made by its manufacturer is not guaranteed or endorsed by the publisher.
Research integrity at Frontiers
Learn more about the work of our research integrity team to safeguard the quality of each article we publish.