 You Wu
 Shuhan Meng
 Chaoshun Liu
 Wei Gao
 Xin-Zhong Liang1,6
95% of researchers rate our articles as excellent or good
Learn more about the work of our research integrity team to safeguard the quality of each article we publish.
Find out more
SYSTEMATIC REVIEW article
Front. Sustain. Food Syst. , 06 July 2023
Sec. Climate-Smart Food Systems
Volume 7 - 2023 | https://doi.org/10.3389/fsufs.2023.1191305
This article is part of the Research Topic Agricultural Production in a Warmer World: Challenges and Sustainable Development Strategies View all 8 articles
Climate anomalies and changes have complex and critical impacts on agriculture. Given global warming, the scientific community has dramatically increased research on these impacts. During 1996–2022, over 3,000 peer-reviewed papers in the Web of Science Core Collection database have investigated the fields. This study conducted a bibliometric analysis of these papers for systematic mapping and inductive understanding to comprehensively review the research’s status, focus, network, and funding. After almost 30 years, the research is now centered in quantifying climate impacts on crop yields and agriculture productivity while seeking effective adaptation solutions. The hot keywords recently emerged include poverty, food security, water resource, climate service, climate-smart agriculture, sustainability, and policy. They suggest increasing concerns on global food and water shortage and pressing needs for action to adapt to climate change and sustain agricultural productivity. Given the uncertainty of climate change and the complexity of agriculture systems, most current studies are interdisciplinary research combining various agricultural fields with climate, environmental, and socioeconomic sciences. The United States, as the world’s leading food commodity producer, has the most diverse funding agencies and provides the largest number of awards to support the research. Future priority research should take the coupled earth system approach with the food-energy-water nexus principles to provide effective, actionable decision supports at local-regional scales to sustain national agricultural productivity and quantify climate-smart agricultural practices to mitigate global warming.
Climate is the long-term average of weather conditions. It includes statistical characteristics of temperature, precipitation, weather patterns, and their extremes such as heat waves, cold spells, floods, droughts, and storms. Climate anomalies in years or climate changes in decades to centuries have critical, complex impacts on agricultural productivity, food security, and societal well-being. Global climate change and impacts have certainly occurred and are likely to be enhanced by anthropogenetic activities (IPCC, 2021). As such, the Paris Agreement that for the first time legally binds international treaty on climate change was adopted by 196 Parties on 12 December 2015 and entered into force on 4 November 2016 (UNFCCC, 2016). This agreement brings all nations to undertake joint efforts to combat climate change and adapt to its impacts. To support the pressing needs, the scientific community has been sustaining research in climate change, impacts, and adaptations. It is imperative to conduct a comprehensive review of the status, focus, network, and funding of the research on the fields. This study focuses on agriculture.
Agriculture is most sensitive to climate variations (Walsh et al., 2020), while it also relies on land and other natural resources that climate affects (Gowda et al., 2018). In addition to nutrient and field management, crop production strongly depends on the cumulative effects of soil, water, weather conditions during a sufficient growing season (Nolte et al., 2018). Frequent and severe droughts have negative effects on plant growth, physiology, and reproduction to reduce crop yields substantially (Barnabas et al., 2008; Satoh et al., 2020; Yordanov et al., 2020; Pokhrel et al., 2021). Crop yield reduction can lead to food supply shortages. Exchange rate fluctuations or new trade restrictions can cause crop price volatility. These climate-induced or market-caused variations directly affect agricultural economic returns and farmers’ livelihood. Global average temperatures have been reaching new records every year with less reliable rainfall and more extremes (Global Climate Report for 2022). Agriculture is expected to face increasing risks of heat and water stresses. Extreme weather events, such as large-scale droughts, floods, and storms, that severely damage crop production have become more common (USGCRP, 2017). Accompanying climate change, wider spreading pests, weeds, viruses, and diseases cause severe crop failures (Ziska et al., 2016; EPA, 2022). Climate change and impacts differ significantly by regions with diverse agriculture systems. North and South America have abundant arable land and become major agricultural exporters, while the Middle East and North Africa have very limited cropland and water resources. Different crops may grow only in certain climates or soils, causing large spatiotemporal variations in growing conditions/seasons and agricultural product distributions. Climate change is altering these production patterns: future crop productivity may become better or worse depending on regions. Nonetheless, climate change has been affecting agricultural productivity regionally and globally (Wu et al., 2015; Liang et al., 2017; Ortiz-Bobea et al., 2021; Liang, 2022). The literature review must cover all these varying aspects of climate change impacts and agricultural adaptations.
The scientific community has dramatically increased the efforts in exploring climate impacts on agriculture. Over the decades, there are increasingly more transdisciplinary studies to address the uncertainty of climate change projections and the complexity of agricultural systems responses. Researchers with expertise in multiple fields, including atmospheric, oceanic, and environmental sciences, hydrology, geoscience, agriculture, economy, public health, and policy, have published their findings and recommended solutions in response to the changing impacts. To better steer this subject’s research, scientists need to master the existing comprehensive knowledge in their fields before extending that knowledge through further investigations. Bibliometric analysis is a key approach to get a thorough knowledge review from relevant literature reading and thinking that are essential for developing and elaborating research questions and hypotheses so to draw the big picture of future exploration (Porter et al., 2022). Such an analysis is currently not available on climate impacts and adaptations for agriculture. This study aims to conduct a bibliometric review for systematic mapping and inductive assessing the priority research activities needed for strategic planning to effectively adapt to climate change and sustain agriculture production. It is the first visualization-based review about the research status and progress of the subject. It helps to identify the core research focus areas and understand their evolution by keywords and countries using the cluster analysis. It presents the effects of funding supports and international connections. Thus, this study provides insights for scientists, agricultural producers, funding agencies, and policy makers on the major achievements and future priorities in the research on climate impacts and adaptations to sustain agricultural productivity in a changing climate.
The rest of the paper is structured as follows: Section 2 describes the data source and methodology; Section 3 presents the time evolution of relevant publications; Section 4 shows the evolution of keywords and subject categories; Section 5 analyzes the effects of the funding supports; Section 6 illustrates the research activeness and international collaborations; and Section 7 gives summary and conclusions.
Most recently, bibliometric review papers are emerging to provide quantitative and visualization-based analysis of scientific publications. Bibliometrics is an analytical approach to evaluate the related documents by topic or source using various indicators to overview the research domain (Nicholas and Ritchie, 1978). The bibliometric analysis provides different visual outcomes to present the relationships between various key features of research papers like authors, citations, and keywords. This study conducts a bibliometric analysis to quantitatively review the research’s status, focus, network, and funding on the topic of climate impacts on agriculture.
Various software tools are freely available to support the bibliometric analysis (Zupic and Cater, 2015), each having pros and cons (Donthu et al., 2021). This paper uses first the scientific visualization technology software CiteSpace (Chen, 2004, 2006) to screen and analyze literature information (such as keywords, research categories, publication countries) and then VOSviewer (Van Eck and Waltman, 2010) for social network and hierarchical clustering analyses to quantify the research activities for climate impacts on agriculture. The research hotspots and the keyword strategy matrix are compared in different periods to evaluate the research trends and explore future research priorities.
This study uses the Web of Science Core Collection database. For this bibliometric review, the term for the topic search is “climate impact on agriculture,” and the document types include peer-reviewed articles and review articles. A list of 3,154 documents has been retrieved in the study period from 1996 to 2022.
The publication records on climate impact on agriculture have been increasing since 1996 with a dramatic burst in recent years. Below we analyze the chronological sequence of the keywords’ frequency and emergence and their citation burst and density to identify the key research interests and hotspots in different periods of characteristic trends.
Figure 1 shows the variations of the annual total publications about climate impact on agriculture during 1996–2022. It reveals a significant overall increasing trend. The variations can be roughly separated into three characteristic periods of publication increases. The first period (1996–2007) is an initial exploration stage with only 101 publications. The second period (2008–2016) shows a steady development stage with 946 publications. The third period (2017–2022) marks a rapid growth stage with explosion of 2,107 publications. Note that the publication counts have an apparent drop in 2022, which is likely due to the COVID-19 pandemic slowing down the overall non-covid research activities (Raynaud et al., 2021; Riccaboni and Verginer, 2022).
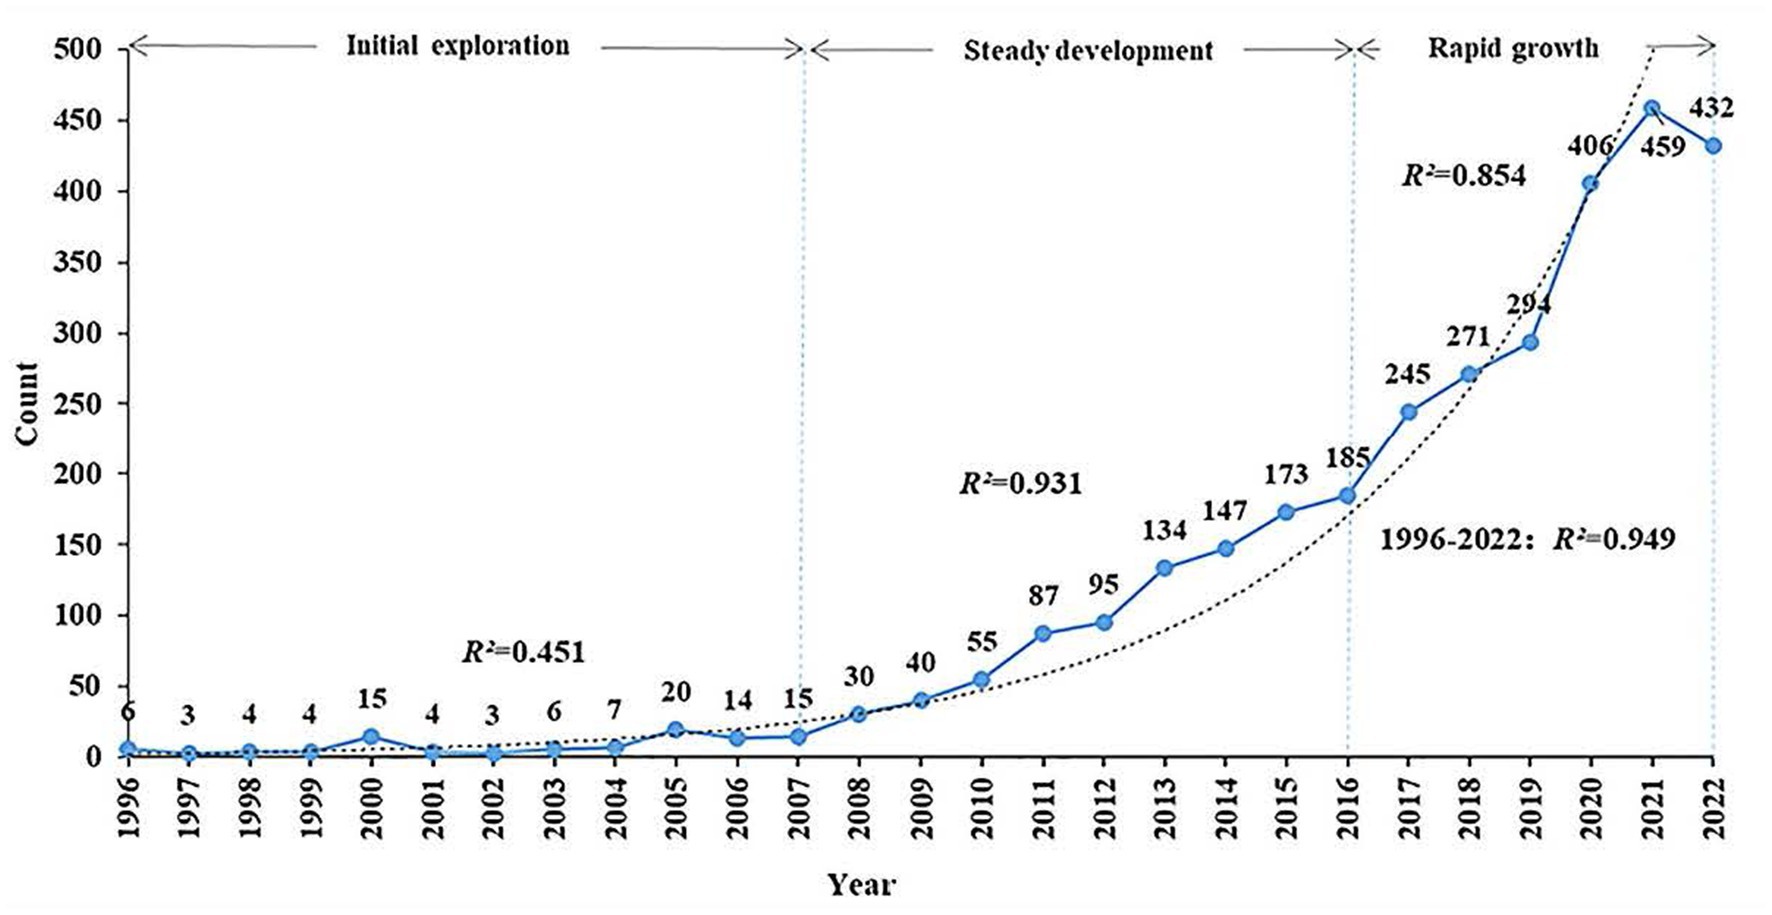
Figure 1. Time distribution of publications in 1996-2022.
Increasing publications suggests more scientists are researching on the topic. It is important to identify the varying hotpots of research interest and focus in each characteristic period. Figure 2 shows the time zone map of author’s keywords based on the year when they first appeared, while Supplementary Figures S1–S3 visualize their density distributions in the three periods. In the initial exploration period, there were 954 keywords, with the most frequent occurrences including agriculture, impact, adaptation, climate change, variability, vulnerability, response, and temperature & sensitivity. In the steady development period, there emerged a total of 10,465 keywords, with a number of new high-frequency keywords, including food security, yield, drought, land use, irrigation, maize, mitigation, wheat, and productivity. In the rapid growth period, the total number of keywords burst to 27,058, with more recent appearances of new keywords such as climate-smart agriculture, crop yield, crop production, resilience, adaptation strategies, and sustainability.
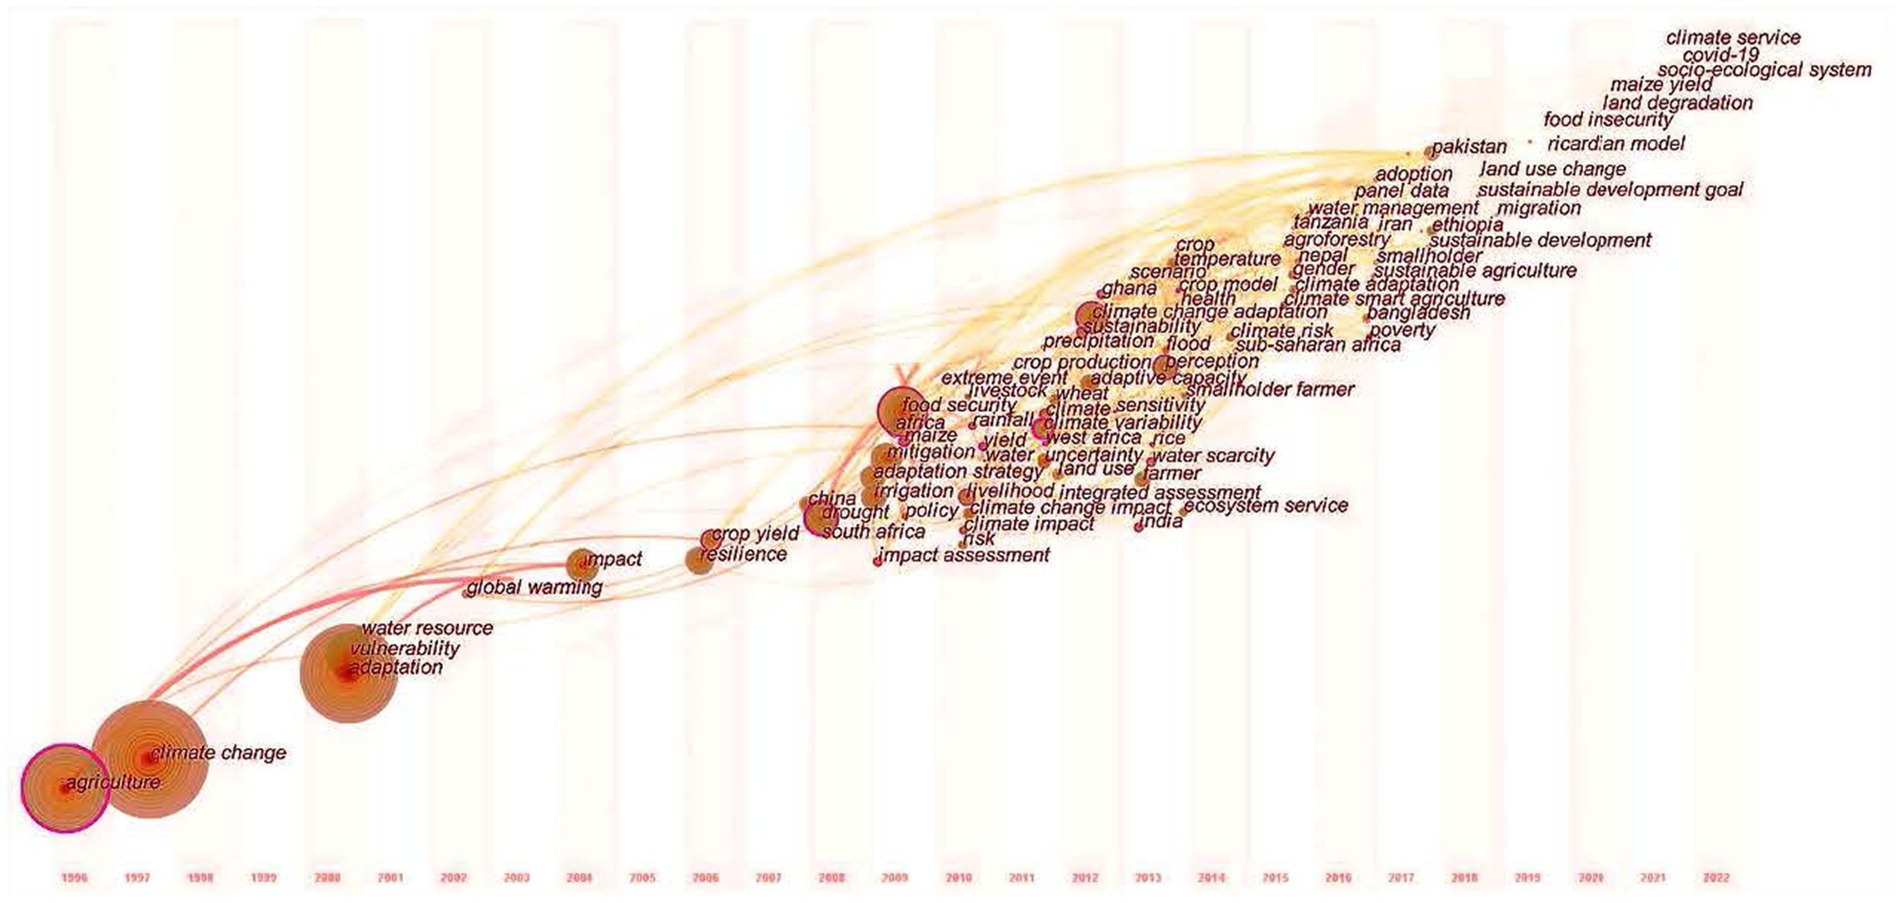
Figure 2. Time zone of author keywords’ co-occurrence in 1996-2022.
Figure 3 lists the top 20 author’s keywords with strongest citation burst during 1996–2022. The keywords with high citation intensity all appeared in the initial exploration stage, including agriculture (5.17, 1996), adaptation (12.25, 2000), impact (4.32, 2004), and vulnerability (3.75, 2006). The first three keywords were the base in our topic search, while the last keyword suggests that researchers considered agricultural vulnerability together with climate impact and adaption. The newly emerged keywords in the steady development stage were uncertainty (9.11, 2011), poverty (5.06, 2016), policy (4.19, 2009), hydrology (4.10, 2013), global change (3.19, 2011), and irrigation (3.15, 2014). The result indicates that scientists started concerning more about the future uncertainty, resulting poverty, policy making, water shortage, global perspective, and irrigation practice associated with climate impacts on agriculture. In fact, how to handle large uncertainty and poverty escalation were the research hotspots during 2008–2016. Among total citation counts of 946 in this period, the high-frequency keywords that appeared for the first time included food security (183), drought (110), irrigation (77), climate-smart agriculture (70), and climate variability (64). The scientific community was gearing toward research on more actionable solutions for real problems.
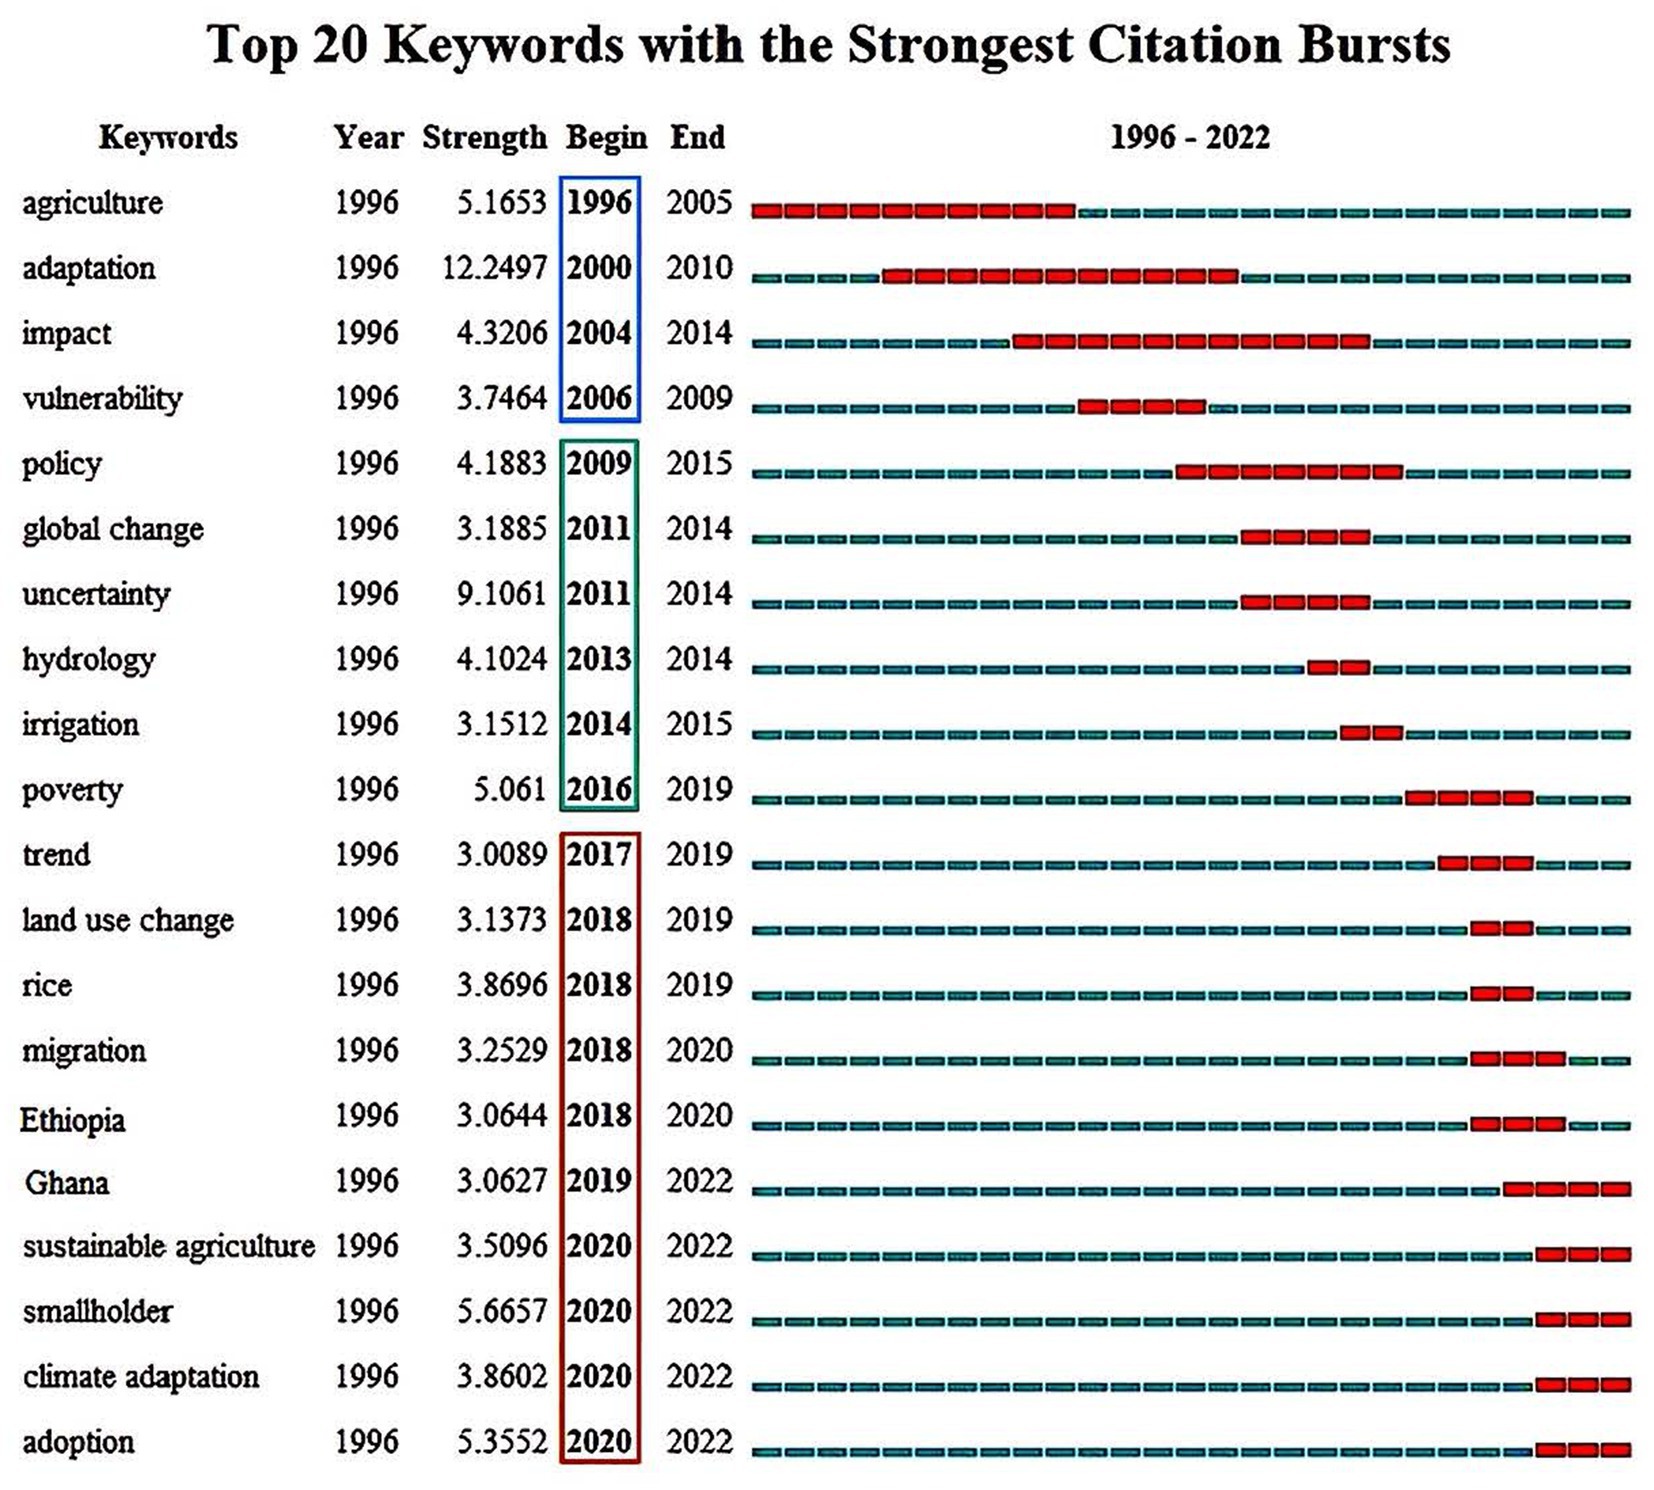
Figure 3. Top 20 author’s keywords with the strongest citation bursts. The red line indicates the period when the citation burst occurred.
During the rapid growth stage since 2017, the keywords with high citation intensity were smallholder (5.67, 2020), adoption (5.36, 2020), rice (3.87, 2018), climate adaptation (3.86, 2020), migration (3.25, 2018), land use change (3.14, 2018), Ethiopia (3.06, 2018), Ghana (3.06, 2019), sustainable agriculture (3.51, 2020), and trend (3.01, 2017). There has been a growing scientific focus on addressing specific issues related to poverty-stricken regions, particularly in Africa where food insecurity is a significant concern. Ethiopia and Ghana become the hotspots. In Ethiopia, a large portion of the population relies on subsistence agriculture, which is vulnerable to climate change and natural disasters, leading to food shortages and malnutrition. Similarly, Ghana experiences high levels of poverty and food insecurity, particularly in rural areas. With approximately 24.2% of the national population living below the poverty line and around 2.99 million people in extreme poverty, the need for effective solutions is pressing. Limited access to resources, inadequate infrastructure, and the impact of climate variability further exacerbate the difficulties faced by vulnerable communities. Consequently, scientists have directed their attention to studying regional and local issues, focusing on agricultural sustainability, adaptation strategies, and finding ways to address these pressing problem. Other new keywords included climate service, land degradation, socio-ecological system, forestry, and coping strategy. Although their citation frequency was still low as they just appeared, they are pointing to new research hotspots – solving problems in the coupled earth system approach.
The keyword explosion also shows that the subject of research has changed rapidly over time, and many branches of research on climate impacts and adaptations for agriculture have also flourished. Multiple keywords may simultaneously appear in a single publication and a same keyword may occur in multiple papers. It is useful to identify the major groups of relevant keywords and the master or representative keyword of each group. This is accomplished here by a clustering analysis. Figure 4 illustrates a cluster diagram of the author’s keywords, while Supplementary Table S1 lists the clustering details including keywords in each group. The cluster labels (i.e., the group’s master keywords) are determined by the logarithmic maximum likelihood ratio algorithm. The Silhouette score is greater than 0.8 for all 15 clusters, indicating that this clustering is convincing. As the group label increases from 1 to 15, the number of relevant keywords included in that cluster is getting smaller. Table 1 lists all the keywords that clustered into each group. The first group “migration” is the largest cluster with 26 relevant keywords. The second group “wheat” links 24 keywords. The third group “water resources” contains 20 keywords. The other groups (relevant keywords) are “resilience” (19), “societal impacts” (18), “adaptation strategies” (18), “adaptation” (18). “exposure” (17), “ISIMIP” (17), “organic agriculture” (17), “sustainability” (17), “food security” (16), “decision support systems” (12), “land degradation” (10), and “temperature” (8). Here ISIMIP is the Inter-Sectoral Impact Model Intercomparison Project established by the World Climate Research Programme to consistently project the impacts of climate change across affected sectors and spatial scales; it provides an organized framework and comprehensive databases for future projection. All other 14 groups are easily understandable for their direct relevance to our central research subject. They indicate how scientists have been addressing the subject through clustered multitude factors of the complex climate-agricultural system at the local, regional, to global levels.
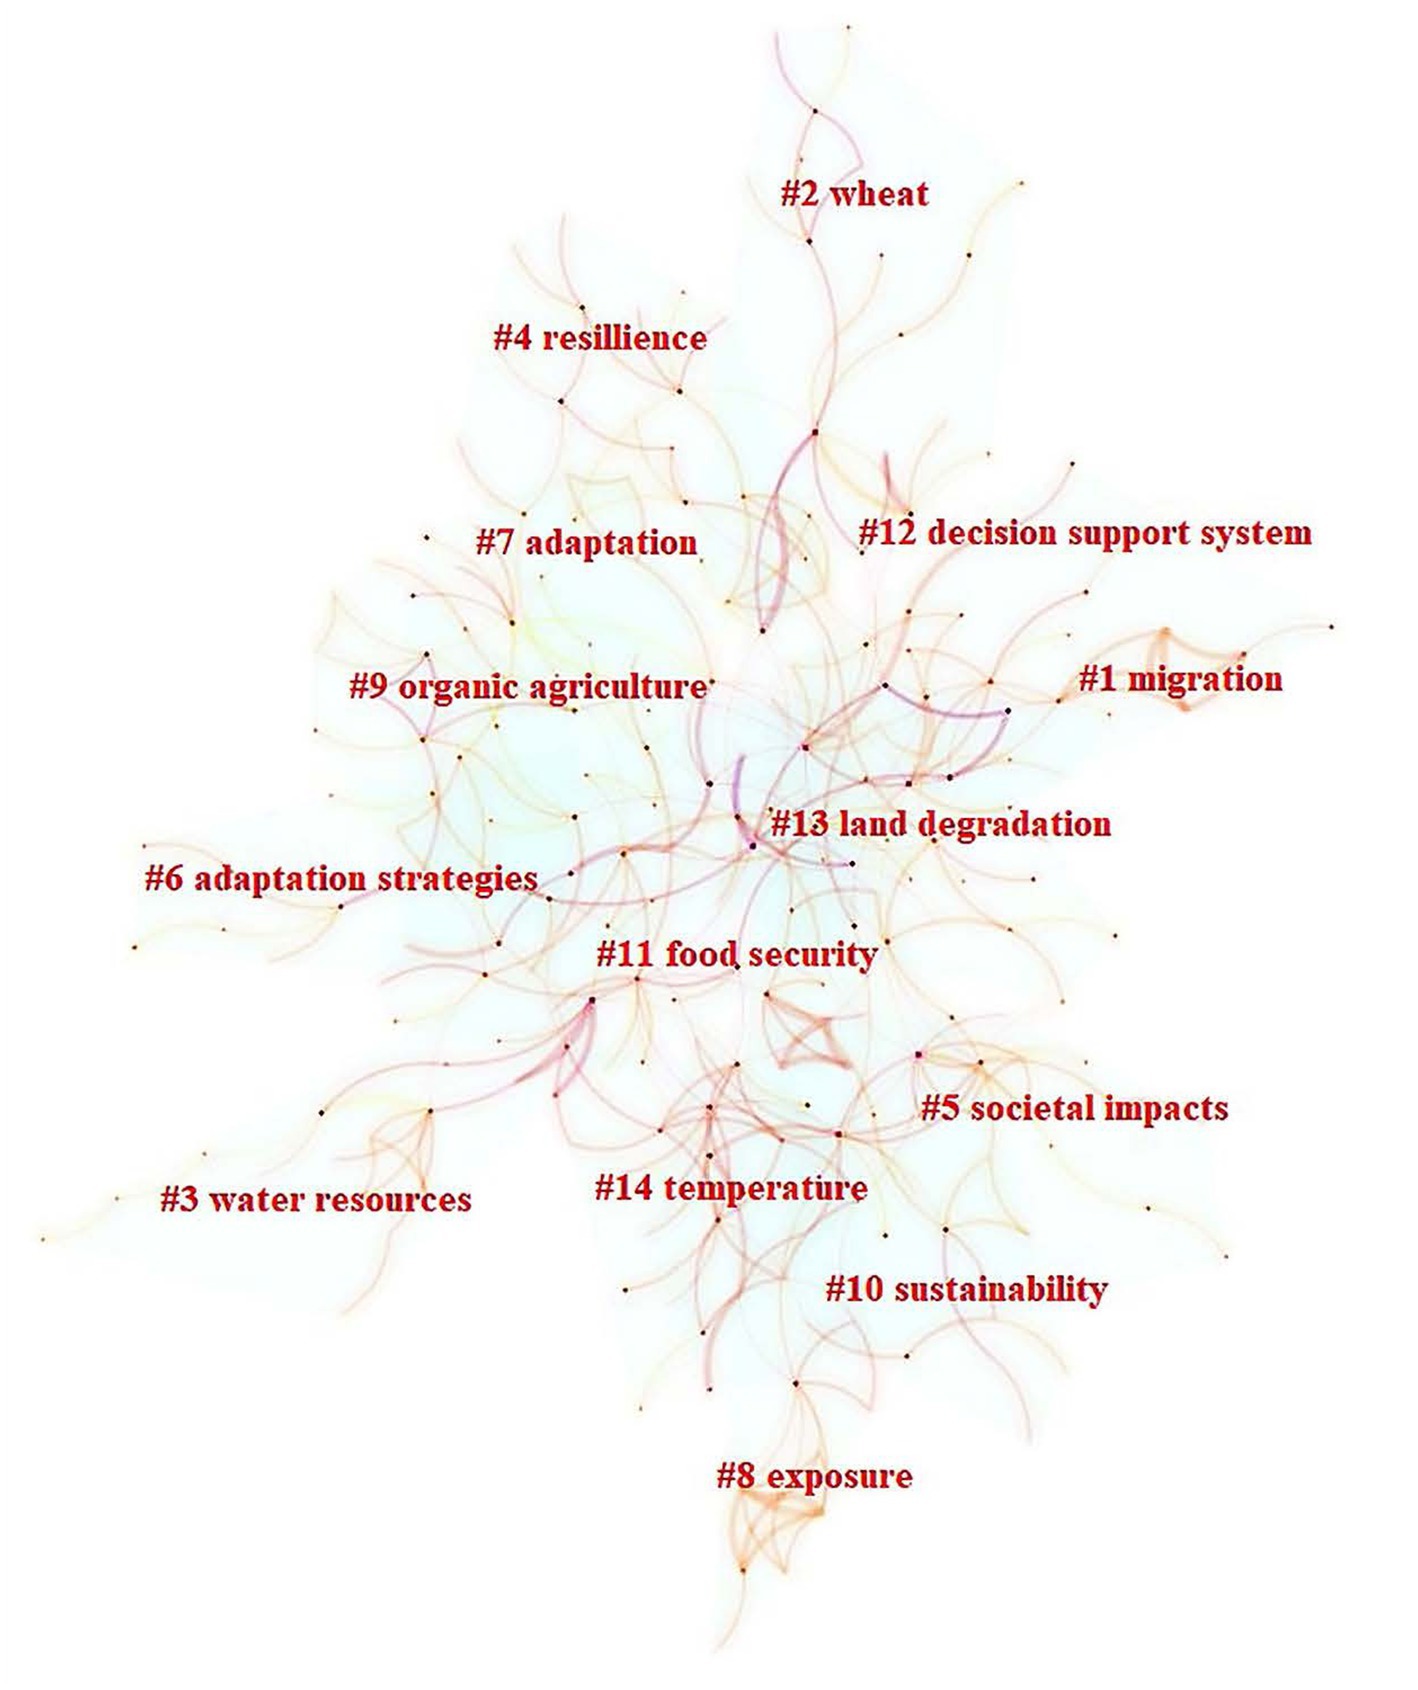
Figure 4. Author keywords clustering in 1996-2022.
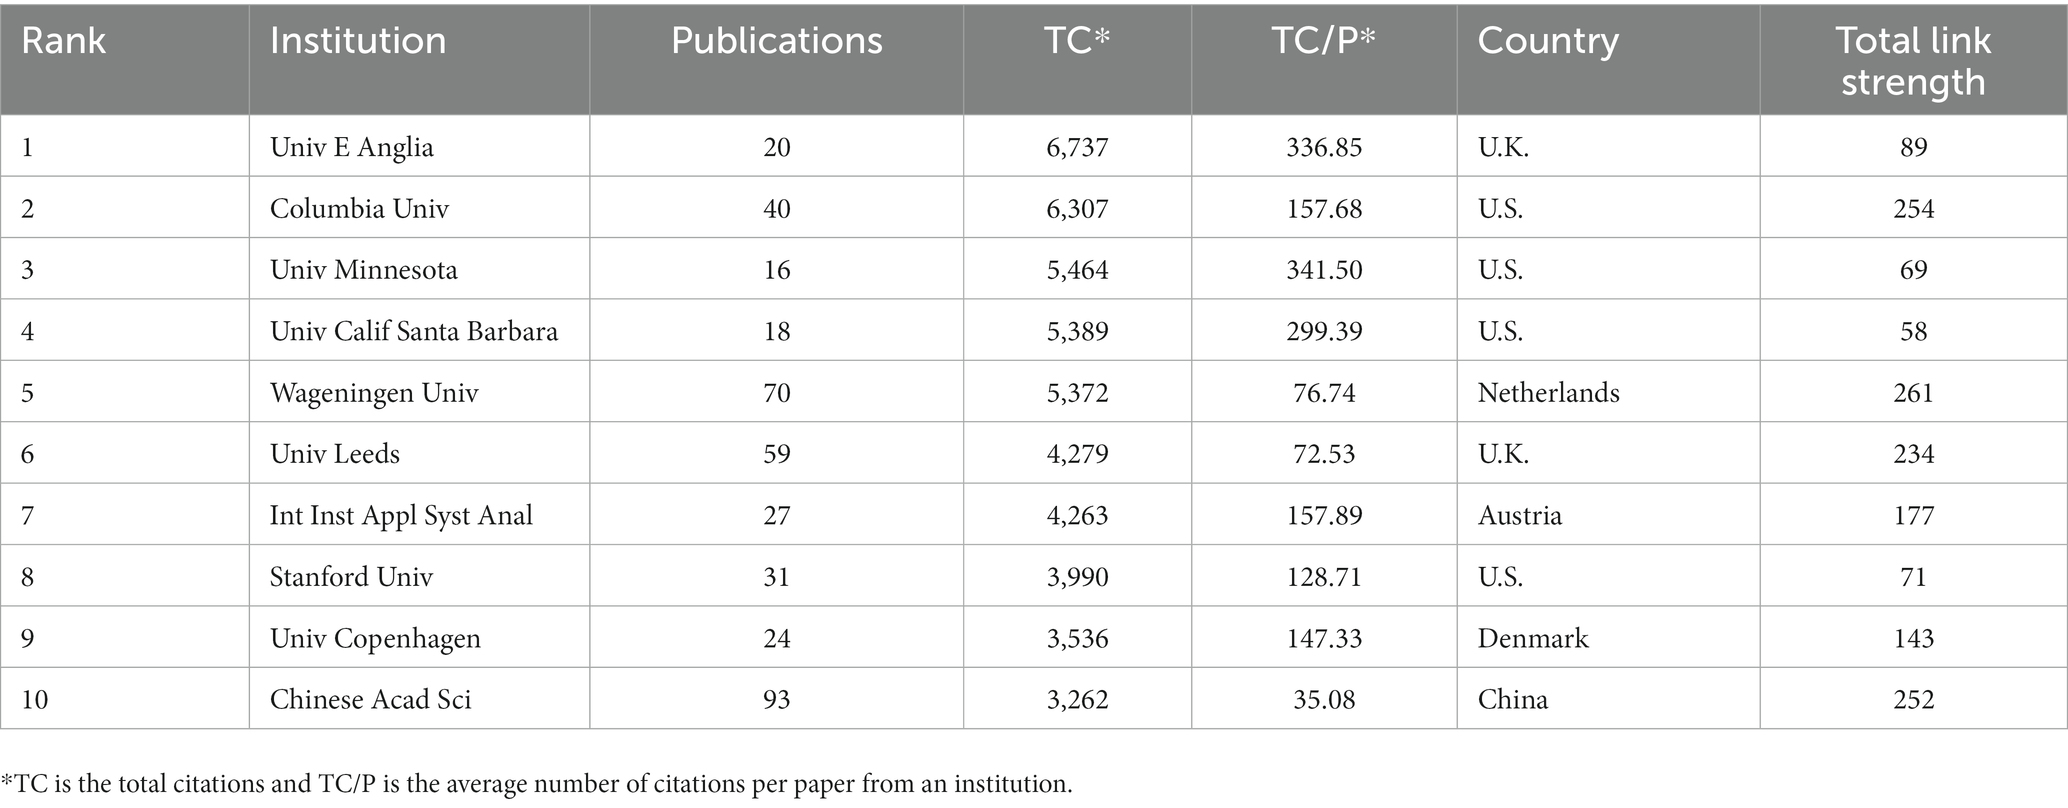
Table 1. Top 10 influential research institutions.
Thousands of keywords were recorded in numerous subject categories by Web of Science for this bibliometric analysis. Some keywords appeared in all three stages, while others newly emerged in each stage. The evolution of the keywords and subject categories can help understanding the development of the research interest and focus.
Figure 5 depicts the evolution of keywords in the three developmental stages of climate impact on agriculture research. The keywords directly present in the base topic search have been removed, including agriculture (50, 196, 358) and climate impact (33, 248, 393). The numbers in the parathas are the total occurrences of the keyword in the three sequential periods. The primary keywords, including food security (2, 70, 119), vulnerability (16, 55, 91), land use (4, 6, 29), water resource (2, 14, 17), crop yield (2, 17, 35), wheat (4, 11, 11), and policy (5, 13, 6), continue to explode across all three stages. Among these, food security and vulnerability are most frequent and their occurrences increase in the last two stages by ~1.7 times. Some keywords, including climate-smart agriculture (0, 8, 83), resilience (0, 17, 80), drought (0, 36, 74), adaptation strategy (0, 13, 49), irrigation (0, 36, 41), perception (0, 19, 40), livelihood (0, 18, 38), and maize (0, 14, 18), only emerged in the second stage and their frequencies have since rapidly grow by 2–10 times. Other keywords, including smallholder farmer, sustainable agriculture, and climate risk, had relatively low frequencies in the second phase but high occurrences in the rapid growth phase. The rapid growth stages also exploded with new high-frequent keywords that had never appeared in the previous two stages, such as sustainable development (31), socio-ecological system (13), and climate resilience (7). These keywords are consistent with the identified research hotspots in Figure 3 of Section 3.2. All indicate seeking for effective solutions to address regional-local food insecurity issues.
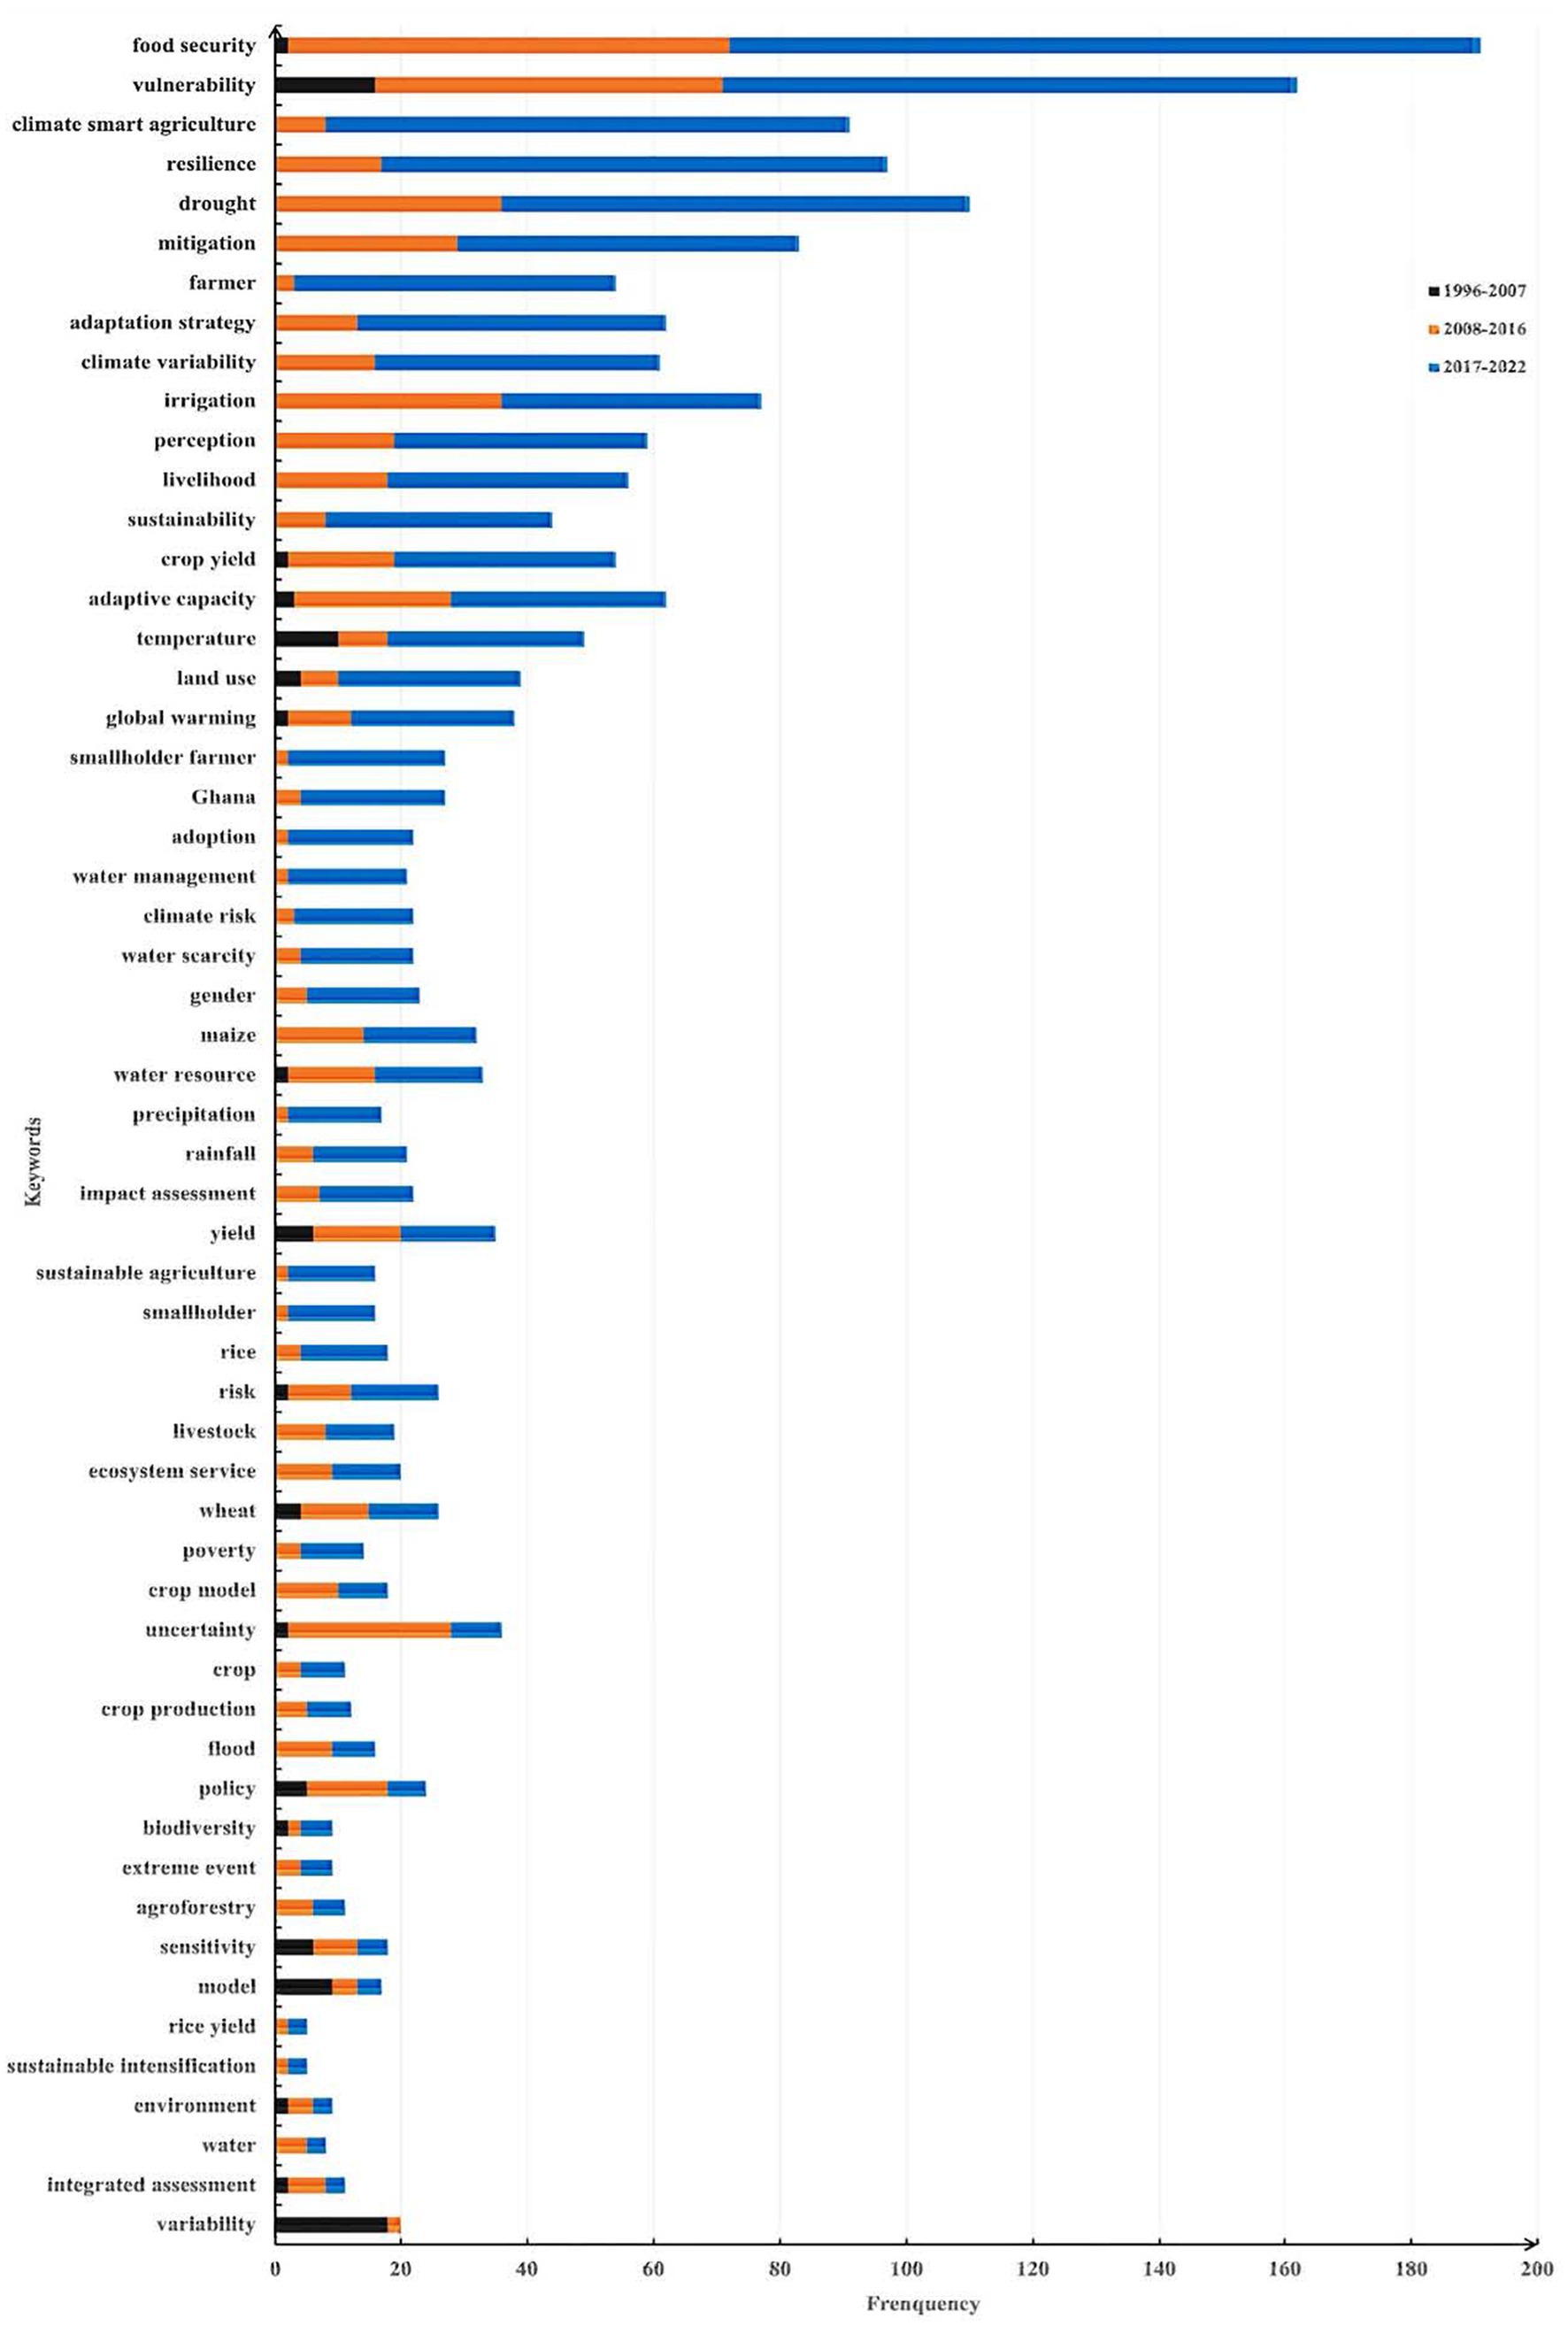
Figure 5. The frequency of keyword in each stage.
Total 3,154 papers with 5,749 author’s keywords have been published for climate impact on agriculture during 1996–2022. These papers fall in varying subject categories by Web of Science (WoS). Figure 6 shows the network of co-occurrences among the WoS categories. The categories that publish the most numerous papers are Environmental Sciences (1759), followed by Environmental Studies (718), Agriculture Multidisciplinary (646), and Meteorology and Atmospheric Sciences (621). The categories with the largest centralities are Water Resources (0.94), followed by Environmental Sciences (0.93) and Meteorology and Atmospheric Sciences (0.7). Thus, most papers have focused on water, climate, and environment issues, although multidisciplinary problems around agriculture emerged to be the key topics.
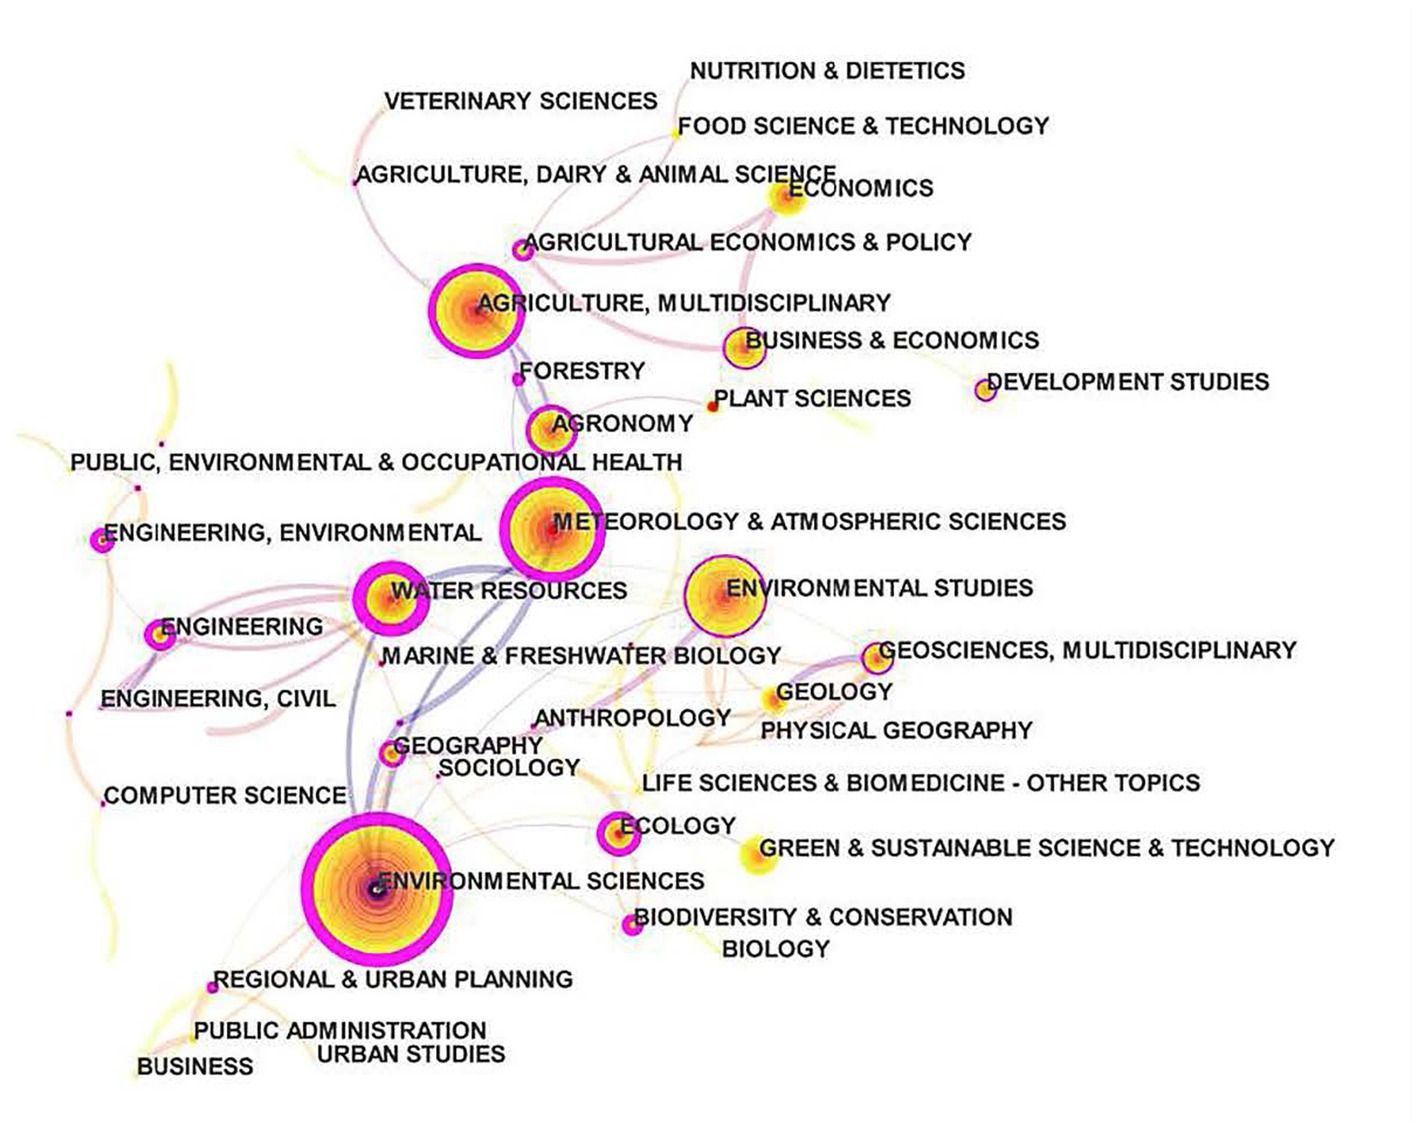
Figure 6. The Web of Science category distribution. The size of a node depicts the breadth of disciplinary background in the field, and the thickness of a purple circle suggests the convergence of disciplinary crossover.
Figure 7 shows that 19 WoS subject categories have been strongly cited during 1996–2022. The strongest citation subject is Meteorology and Atmospheric Sciences (23.90) in 1996–2011. The subject with the longest duration is Civil Engineering, which started in 2000 and ended in 2017. However, its citation strength is only 2.68. The new subjects emerging after 2019 are Biodiversity and Conservation (3.75), Biochemistry and Molecular Biology (2.12), Plant Sciences (4.49), Remote Sensing (2.70), and Environmental Engineering (1.79), although their citations are still relatively low as the research topics in these disciplines just emerged. The result indicates that scientists are conducting increasingly more transdisciplinary research to address the complex issues related to climate impacts and adaptations for agriculture.
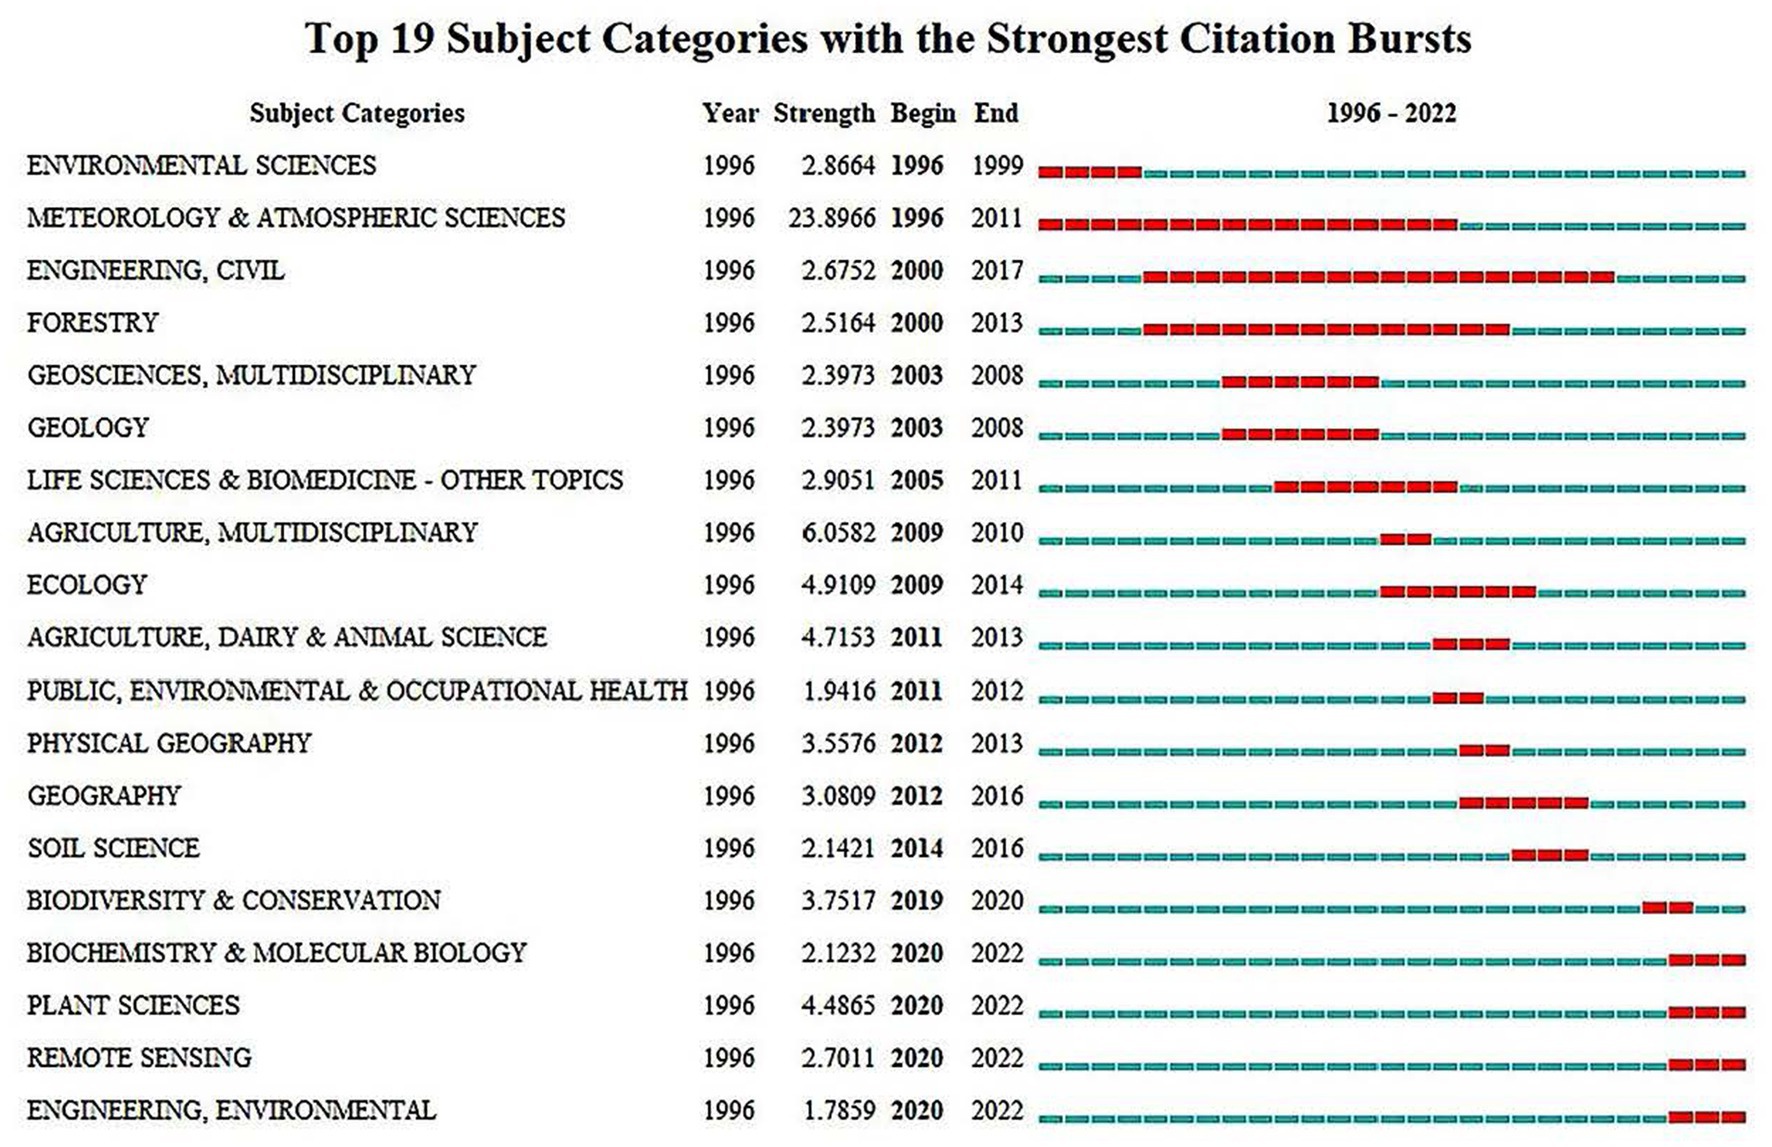
Figure 7. Top 19 subject categories with strongest citation bursts. The red line indicates the period when the citation burst occurred.
There were 3,154 funding awards acknowledged in the 3,154 publications included in this analysis. These awards came from various funding agencies in different countries, including national or local government grants, research institutions, universities, industries, private foundations, as well as international or regional organizations. Figure 8 compares the total number of the relevant research awards funded by region. All U.S. funding agencies granted a total of 533 awards, ranking the biggest worldwide. All European Union (EU) funding agencies granted 452 awards, ranking the second. China granted 325 awards, ranking the third. They were followed by the U.K. and Australia, granted 171 and 105 awards, respectively. Figure 9 compares the total number of the research awards among the main funding agencies and by the major countries. The top-rank countries (agencies) are the U.S. (13), EU (12), U.K. (9), and China (8). While China (NSFC), EU (EC), and U.K. (UKRI) all have one agency granted >100 awards, the U.S. has the most diverse funding sources, with two agencies (CGIAR, NSF) each granted >100 awards and three others granted 50–99 awards. The funding agencies granted 20–49 awards are from EU (7), China (4), Australia (3), U.K. (2), and U.S. (1). The rest agencies granted 10–19 awards are EU (4), U.S. (4), and China (3). The comparison indicates that the U.S., EU, China, and U.K. are the most active countries that have strongly supported the research on climate impacts and adaptations for agriculture. Among all funding agencies, NSFC, NSF, UKRI, and EC have established strong links with other countries (Supplementary Figure S5).
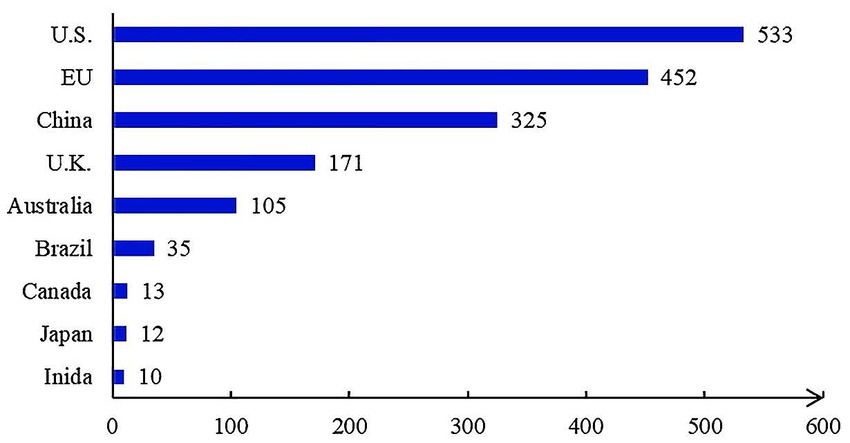
Figure 8. The total number of awards by major countries. European countries are members of the European Union (EU) and each has one government funding agency, except for Germany having three. Thus, all funding awards from the European countries are counted as the EU total.
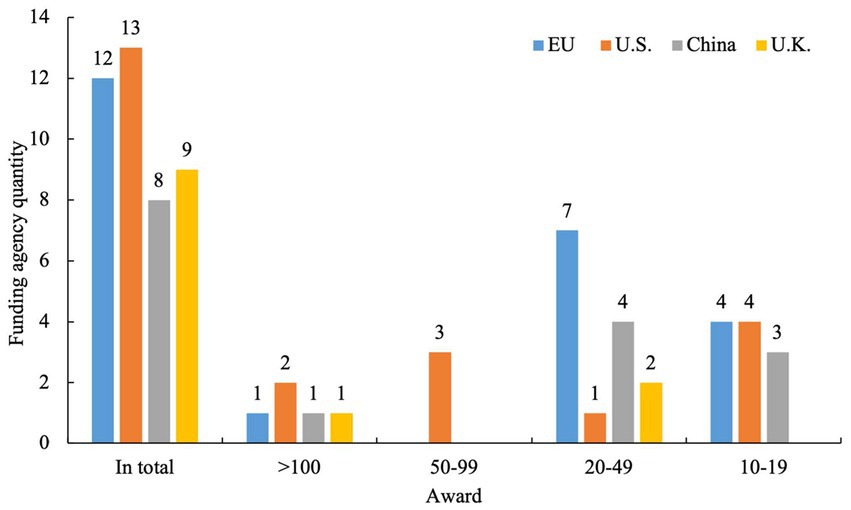
Figure 9. The total number of funding agencies by region.
Figure 10 shows the award quantity of all relevant funding agencies and their relative shares. Among them, most are government agencies and research institutions. In particular, five agencies from China, Europe, U.S., and U.K. provided the strongest funding supports to the research on climate impacts and adaptations for agriculture. Each of them granted more than 100 awards. The National Natural Science Foundation of China (NSFC) is the biggest, granted 177 awards with a total share of 5.61%. The European Commission is the second, granted 163 awards with a share of 5.17%. The U.S. Consultative Group for International Agricultural Research (CGIAR) is the third, granted 140 awards with a share of 4.44%. They are followed by the U.S. Natural Science Foundation (NSF) and the U.K. Research Innovation (UKRI), granted 118 and 115 awards with a share of 3.74 and 3.65%, respectively. The U.S. has three additional funding agencies each provided more than 50 awards. They are the Natural Environment Research Council (NERC), the U.S. Department of Agriculture (USDA), and the U.S. Agency for International Development (USAID), granted 70, 63, and 53 awards with a share of 2.22, 2, and 1.68%, respectively.
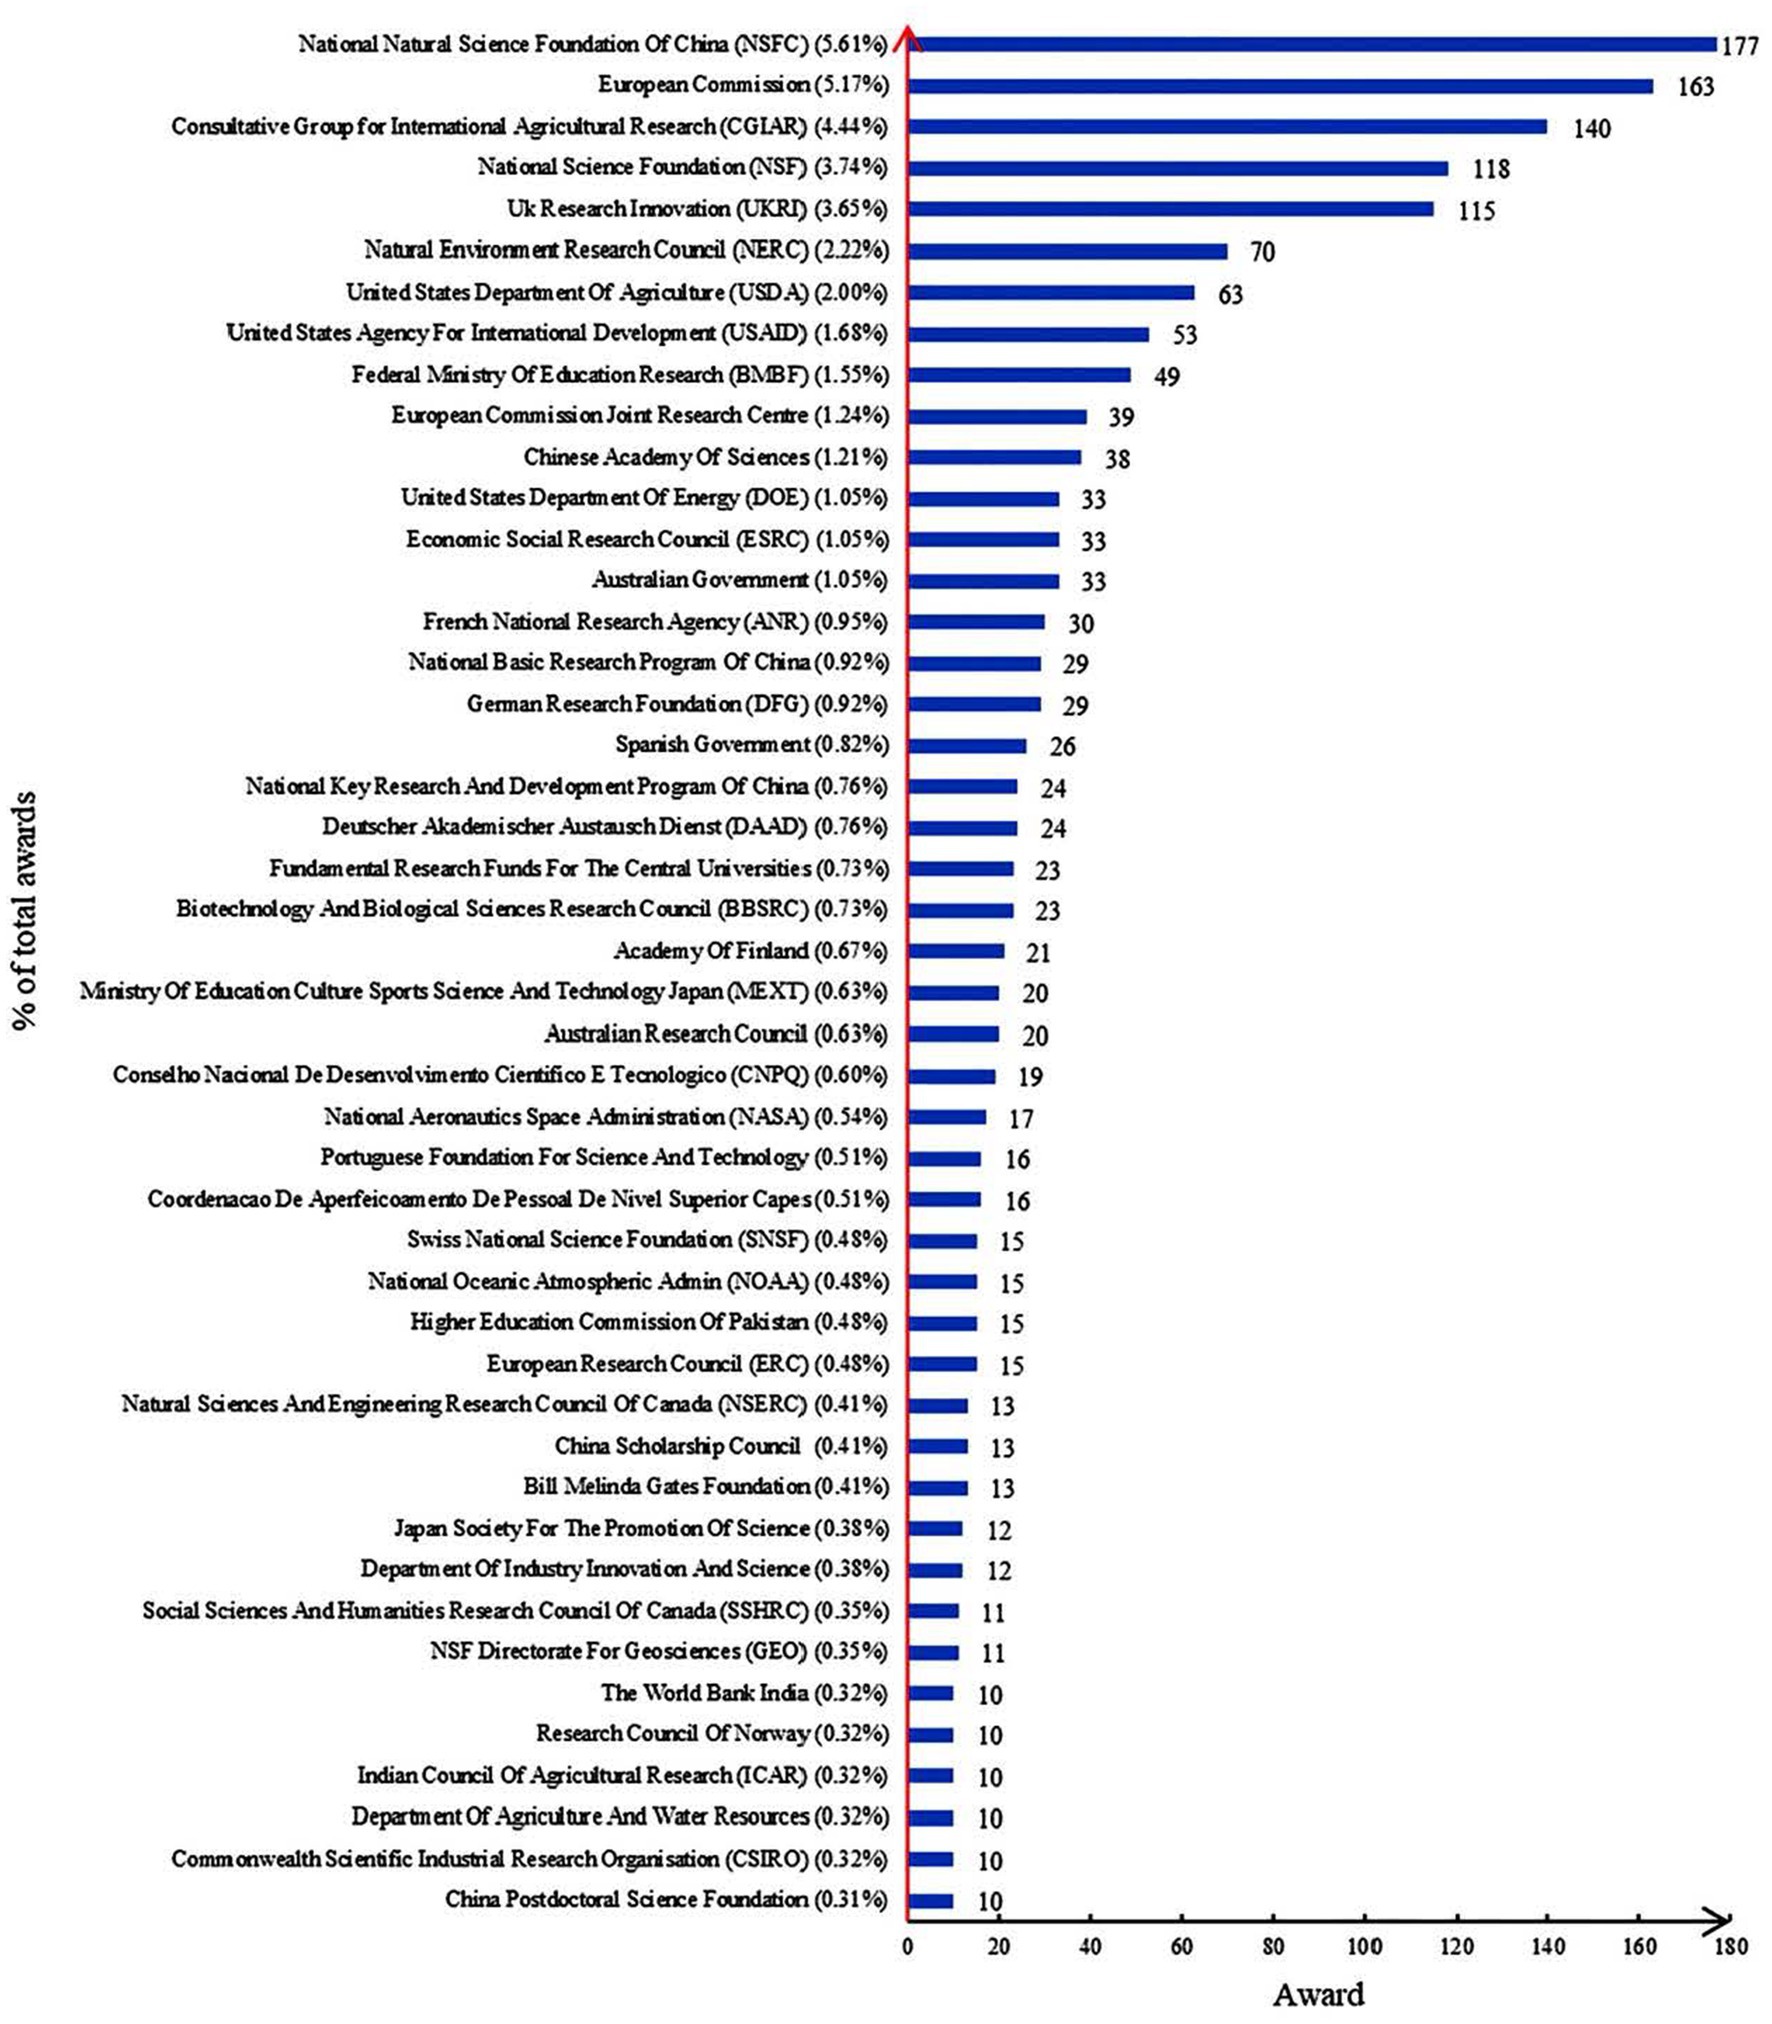
Figure 10. The total number of awards and their global share of the funding agencies. The shares are based on the total awards shown in Figure 10.
Funding supports foster research activities, increase publications, and enhance result influences. This section identifies the most active and influential countries, institutions, and journals on the research of climate impacts and adaptations for agriculture.
Figure 11 shows the distribution of the relevant research publications by years and countries. The U.S., China, U.K., Australia, Germany, and India have (in the decreasing order) the largest number of publications and are the key pioneers carrying out the research on climate impacts and adaptations for agriculture. The centralities of Germany (0.19), Australia (0.13), and the U.K. (0.12) are relatively high, indicating that these countries have closer academic collaboration with other countries. The U.S. has the highest citation burst (22.46) in 1997–2008, taking the first place with a large advantage, followed by the U.K. (11.78) in 2005–2013 and Pakistan (11.10) in 2020–2022. These three countries played an academic leading role in three different periods of the research development. Figure 12 clearly demonstrates that the U.S. is the world leader in the research of climate impacts on agriculture.
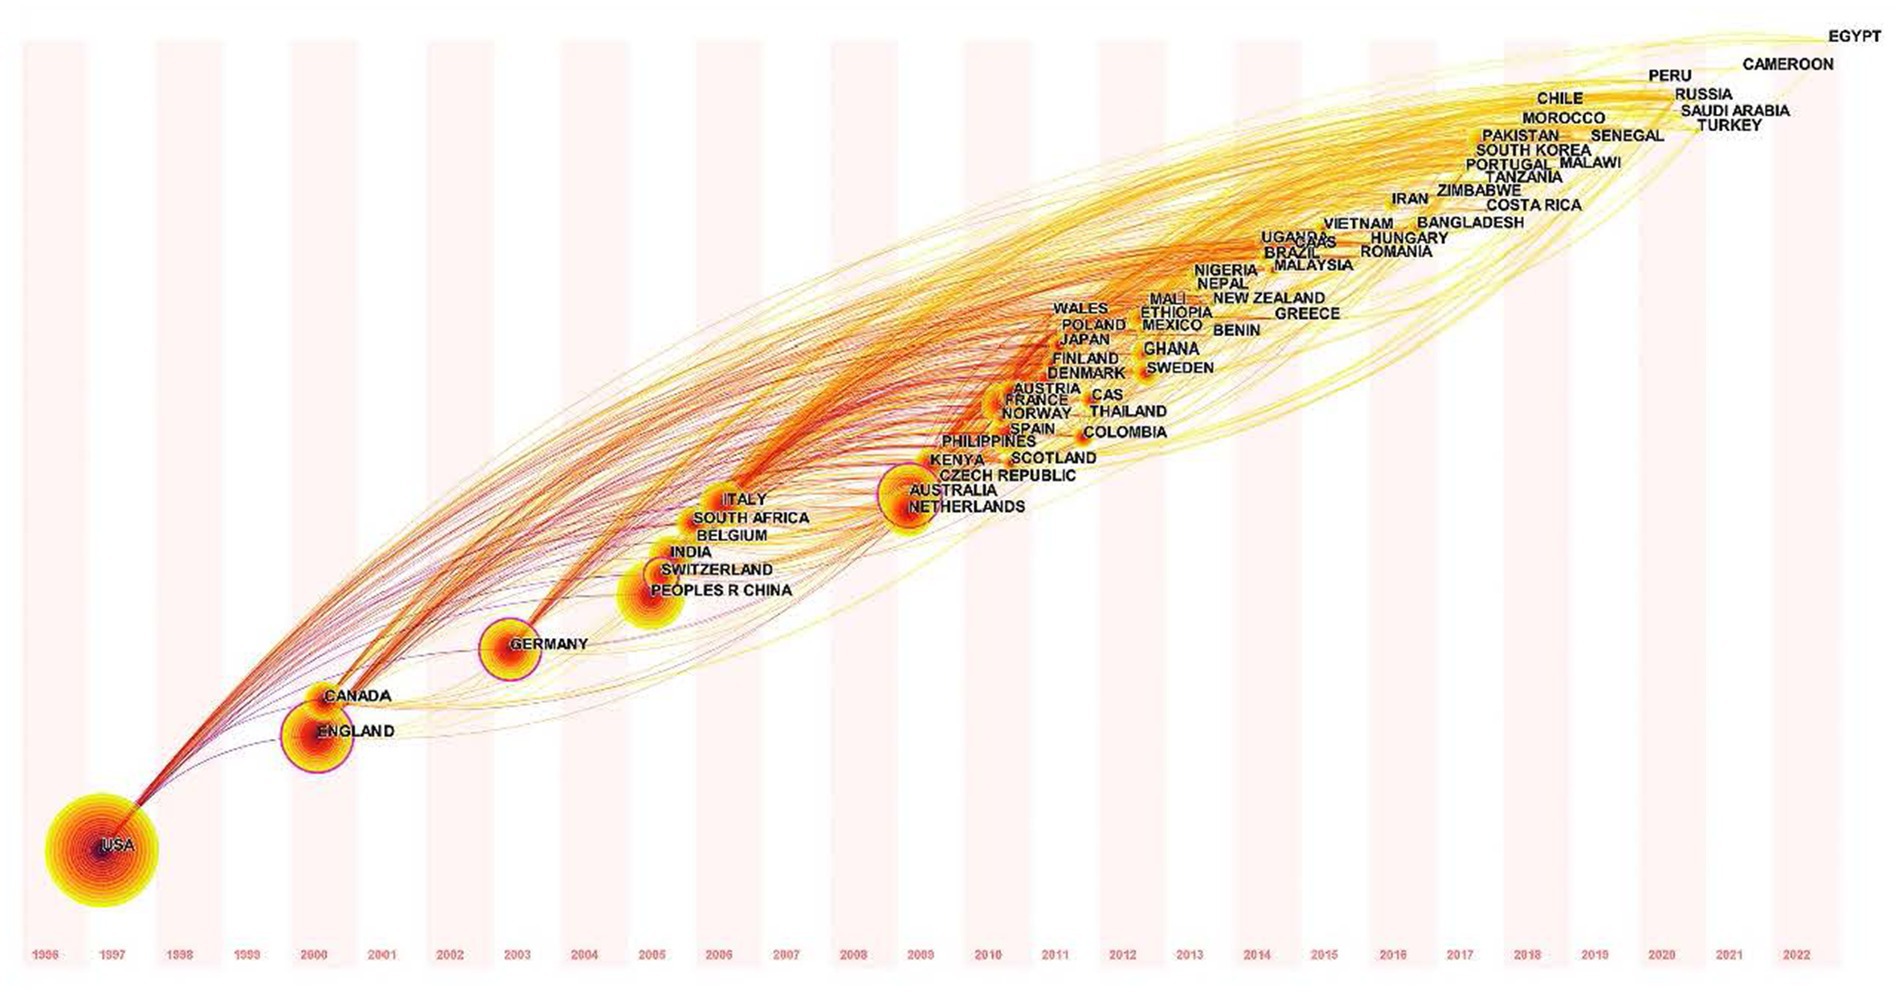
Figure 11. Distribution of the relevant research publications by years and countries. The size of a node depicts the breadth of quantity, and the thickness of an outside circle suggests the convergence of centrality.
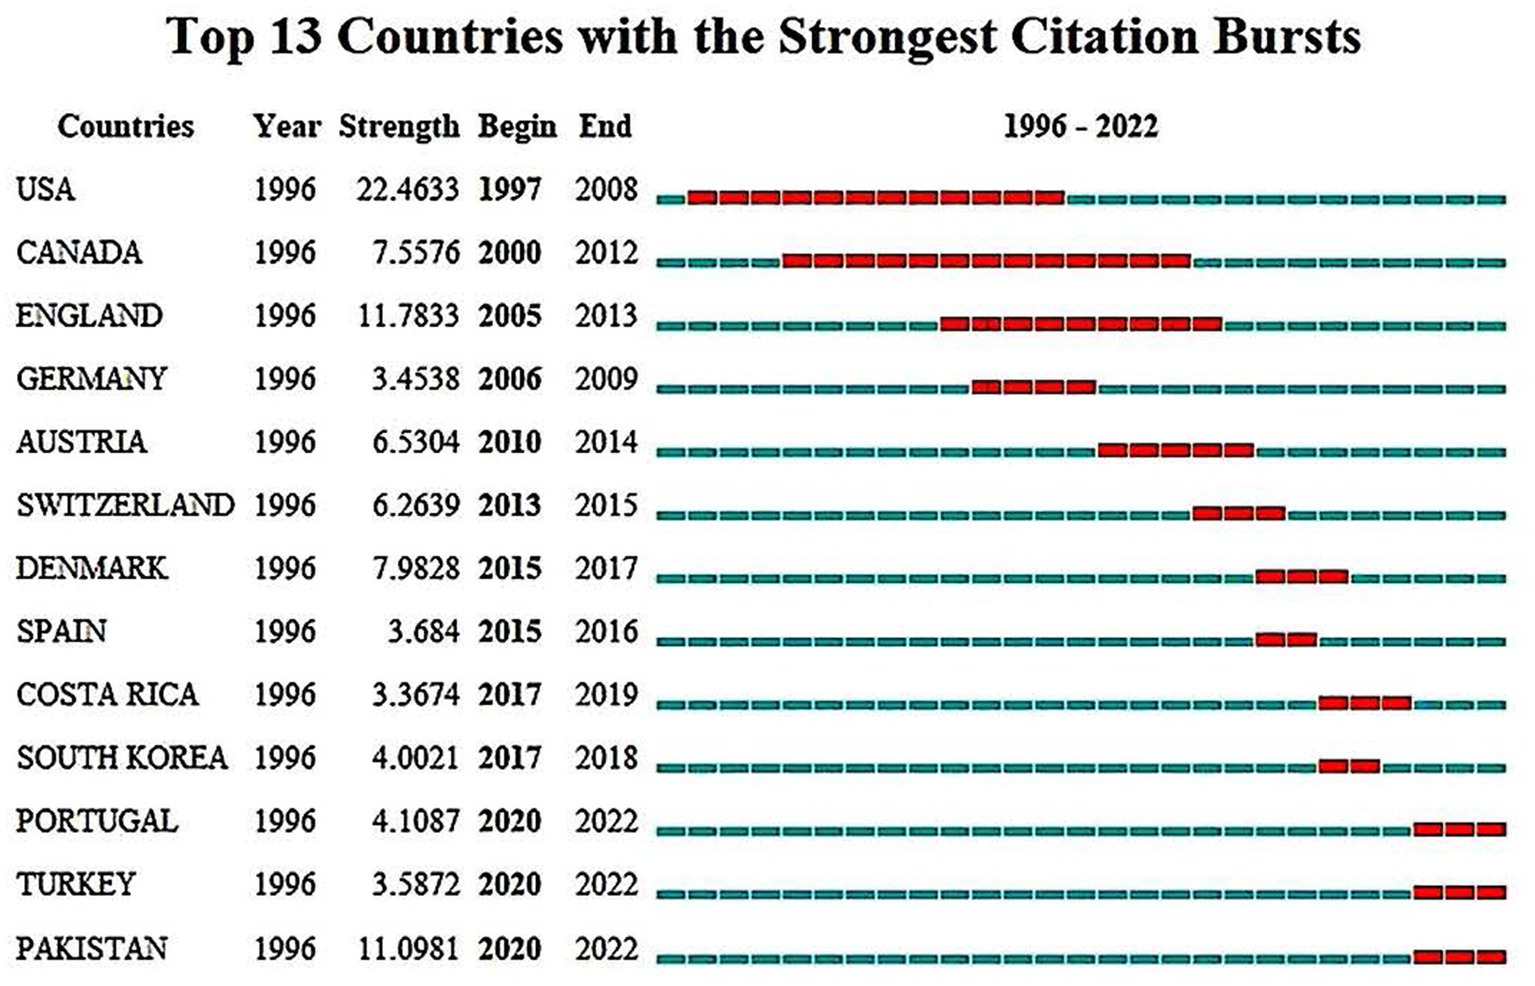
Figure 12. Top 13 countries with the strongest citation bursts. The red line indicates the period when the citation burst occurred.
Total 3,612 institutions worldwide have conducted the research of climate impacts on agriculture. The institution with the largest number of publications is Chinese Academy Science (93), followed by Wageningen University (70) and University of Leeds (59). They are also among the top 10 influential institutions on the research topic (Table 1).
Figure 13 illustrate the network of the total 181 institutions having over 10 publications. A clustering analysis divides these institutions into four core groups, each with a leader. The Chinese Academy of Sciences leads the largest group (red cluster) including 54 institutions. It is followed by Wageningen University (green), the University of Agriculture Faisalabad (blue), and the University of Leeds (yellow) clusters including 47, 42, and 38 institutions, respectively.
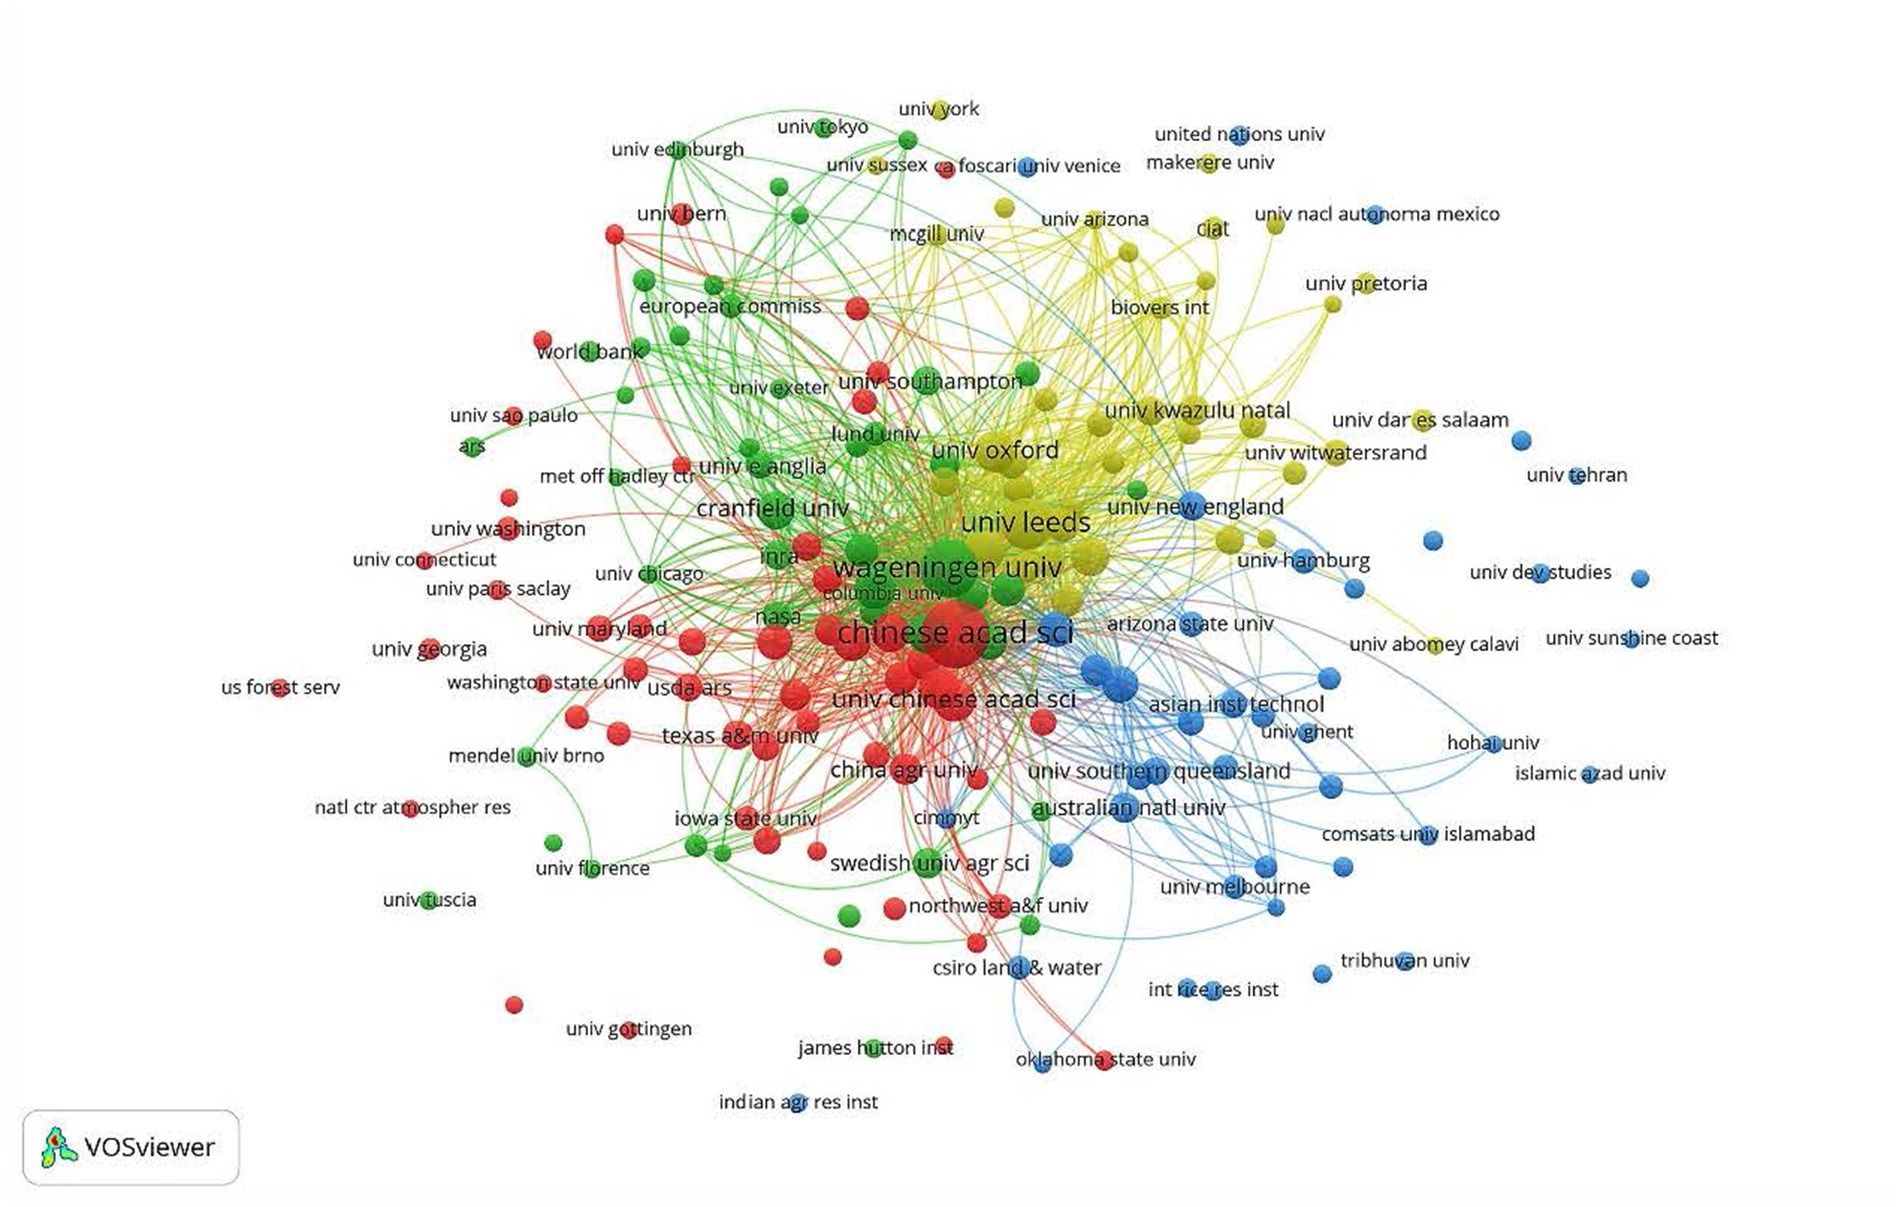
Figure 13. The network with the institutions having over 10 publications.
The total 3,154 articles were published in 592 journals. Figure 14 shows the network of the 75 journals having >10 publications, while Table 2 lists the top 10 journals ranked by the total number of publications together with the quality measures by the citation H-Index and Impact Factor (IF). “Climatic Change” is the most prominent journal, which published 5.39% of total articles with an average 40.10 citations per paper. It is followed by “Sustainability,” which published 4.6% of total articles with an average 8.48 citations per paper. The high influential journals are “Science of The Total Environment” (H-index = 275, IF = 9.4327) and “Global Environmental Change-Human and Policy Dimensions” (H-index = 192, IF = 10.5698). Among the scientific subjects focused by these top 10 journals, “Environmental Sciences” and “Environmental Studies” are most frequently targeted for publishing the research of climate changes on agriculture.
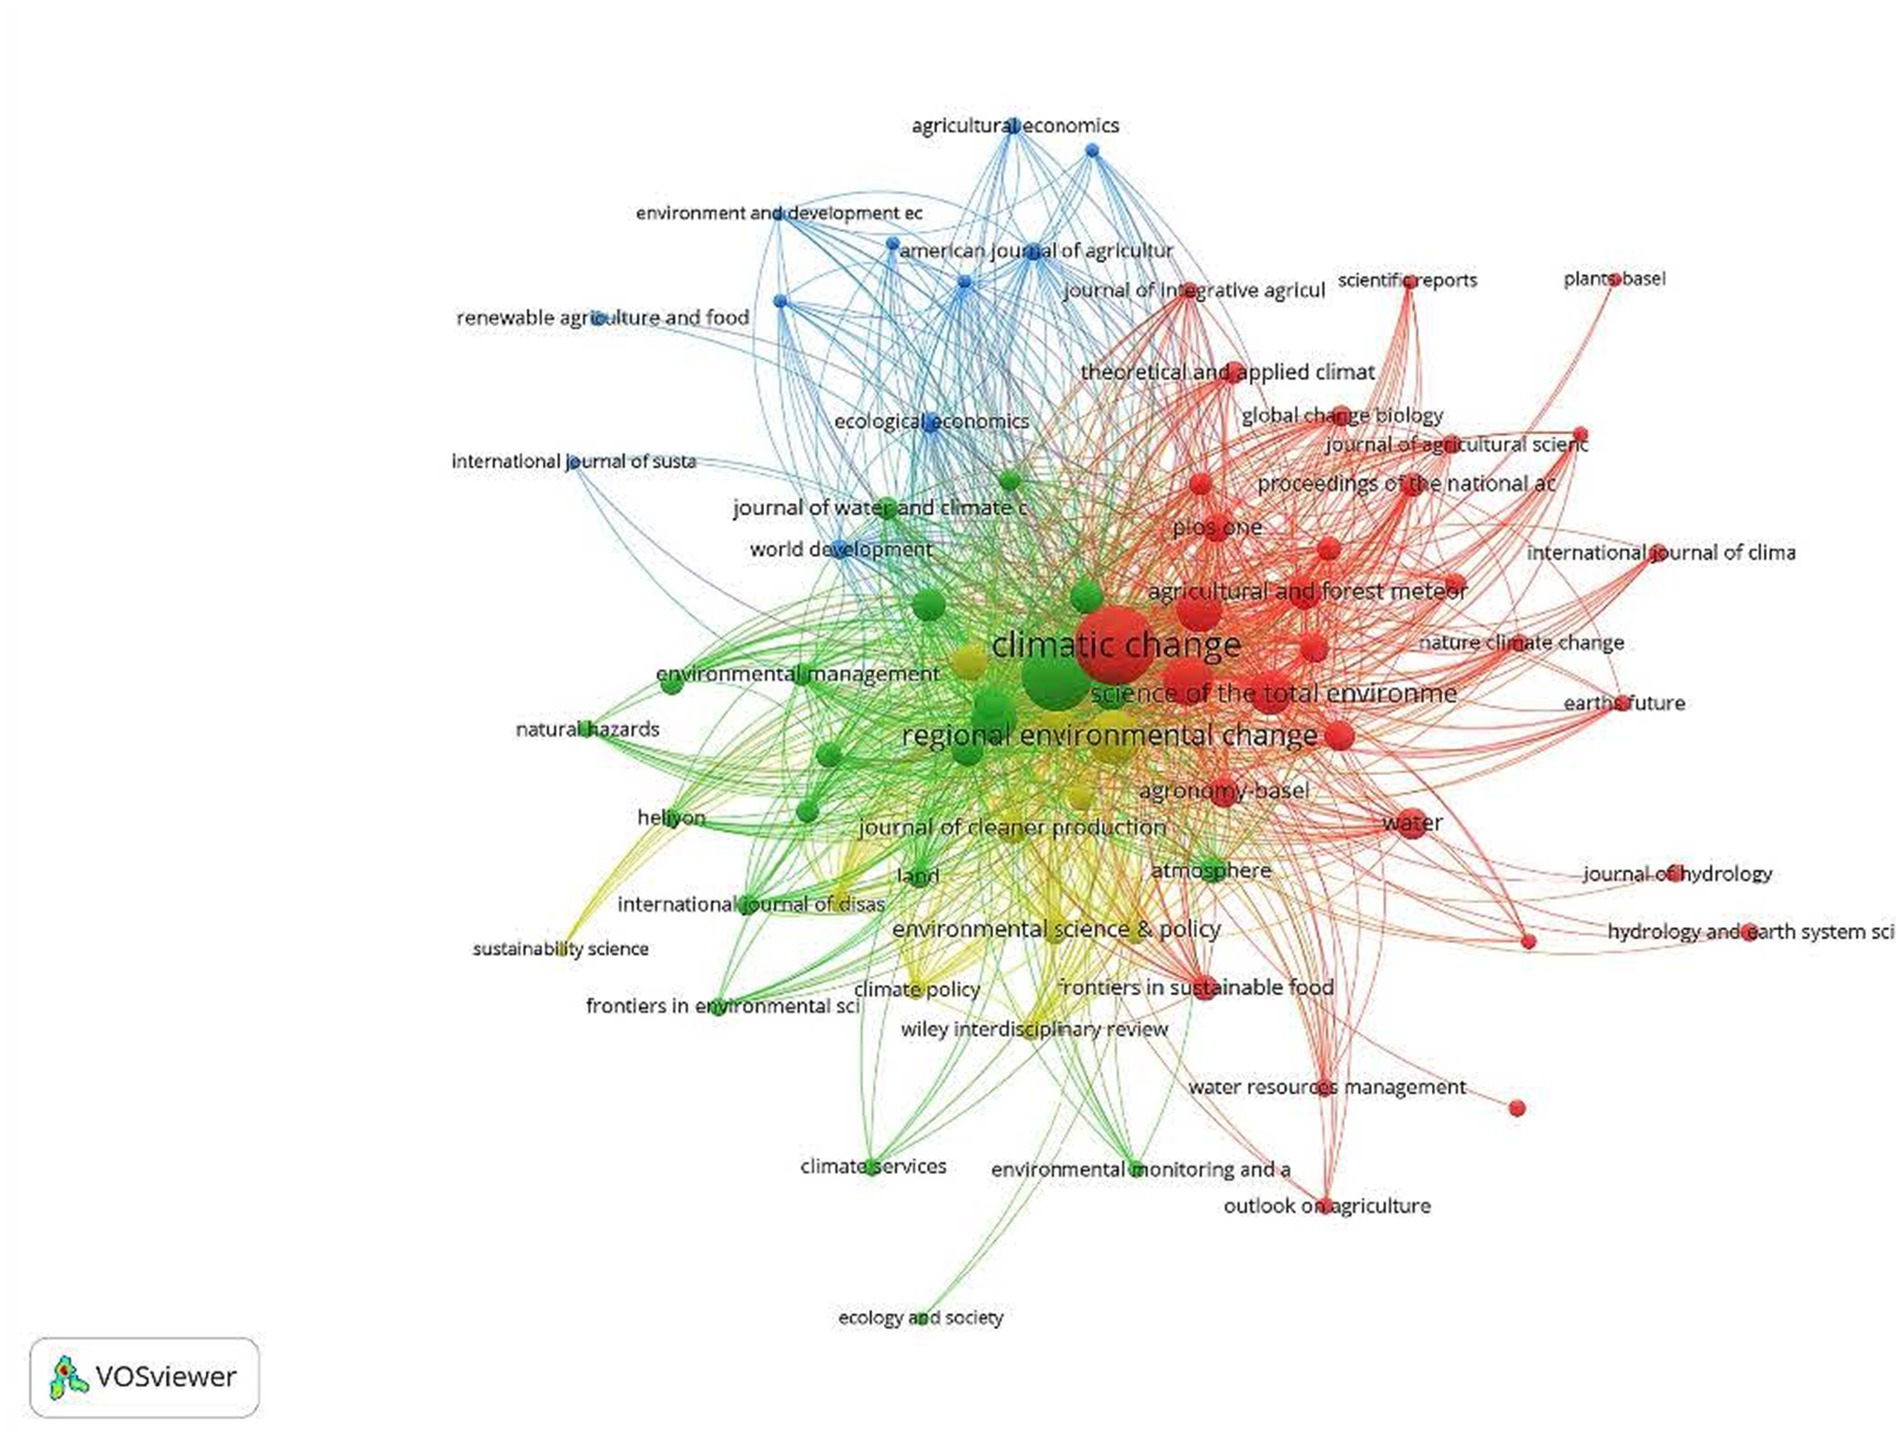
Figure 14. The network of the 75 journals having over 10 publications.
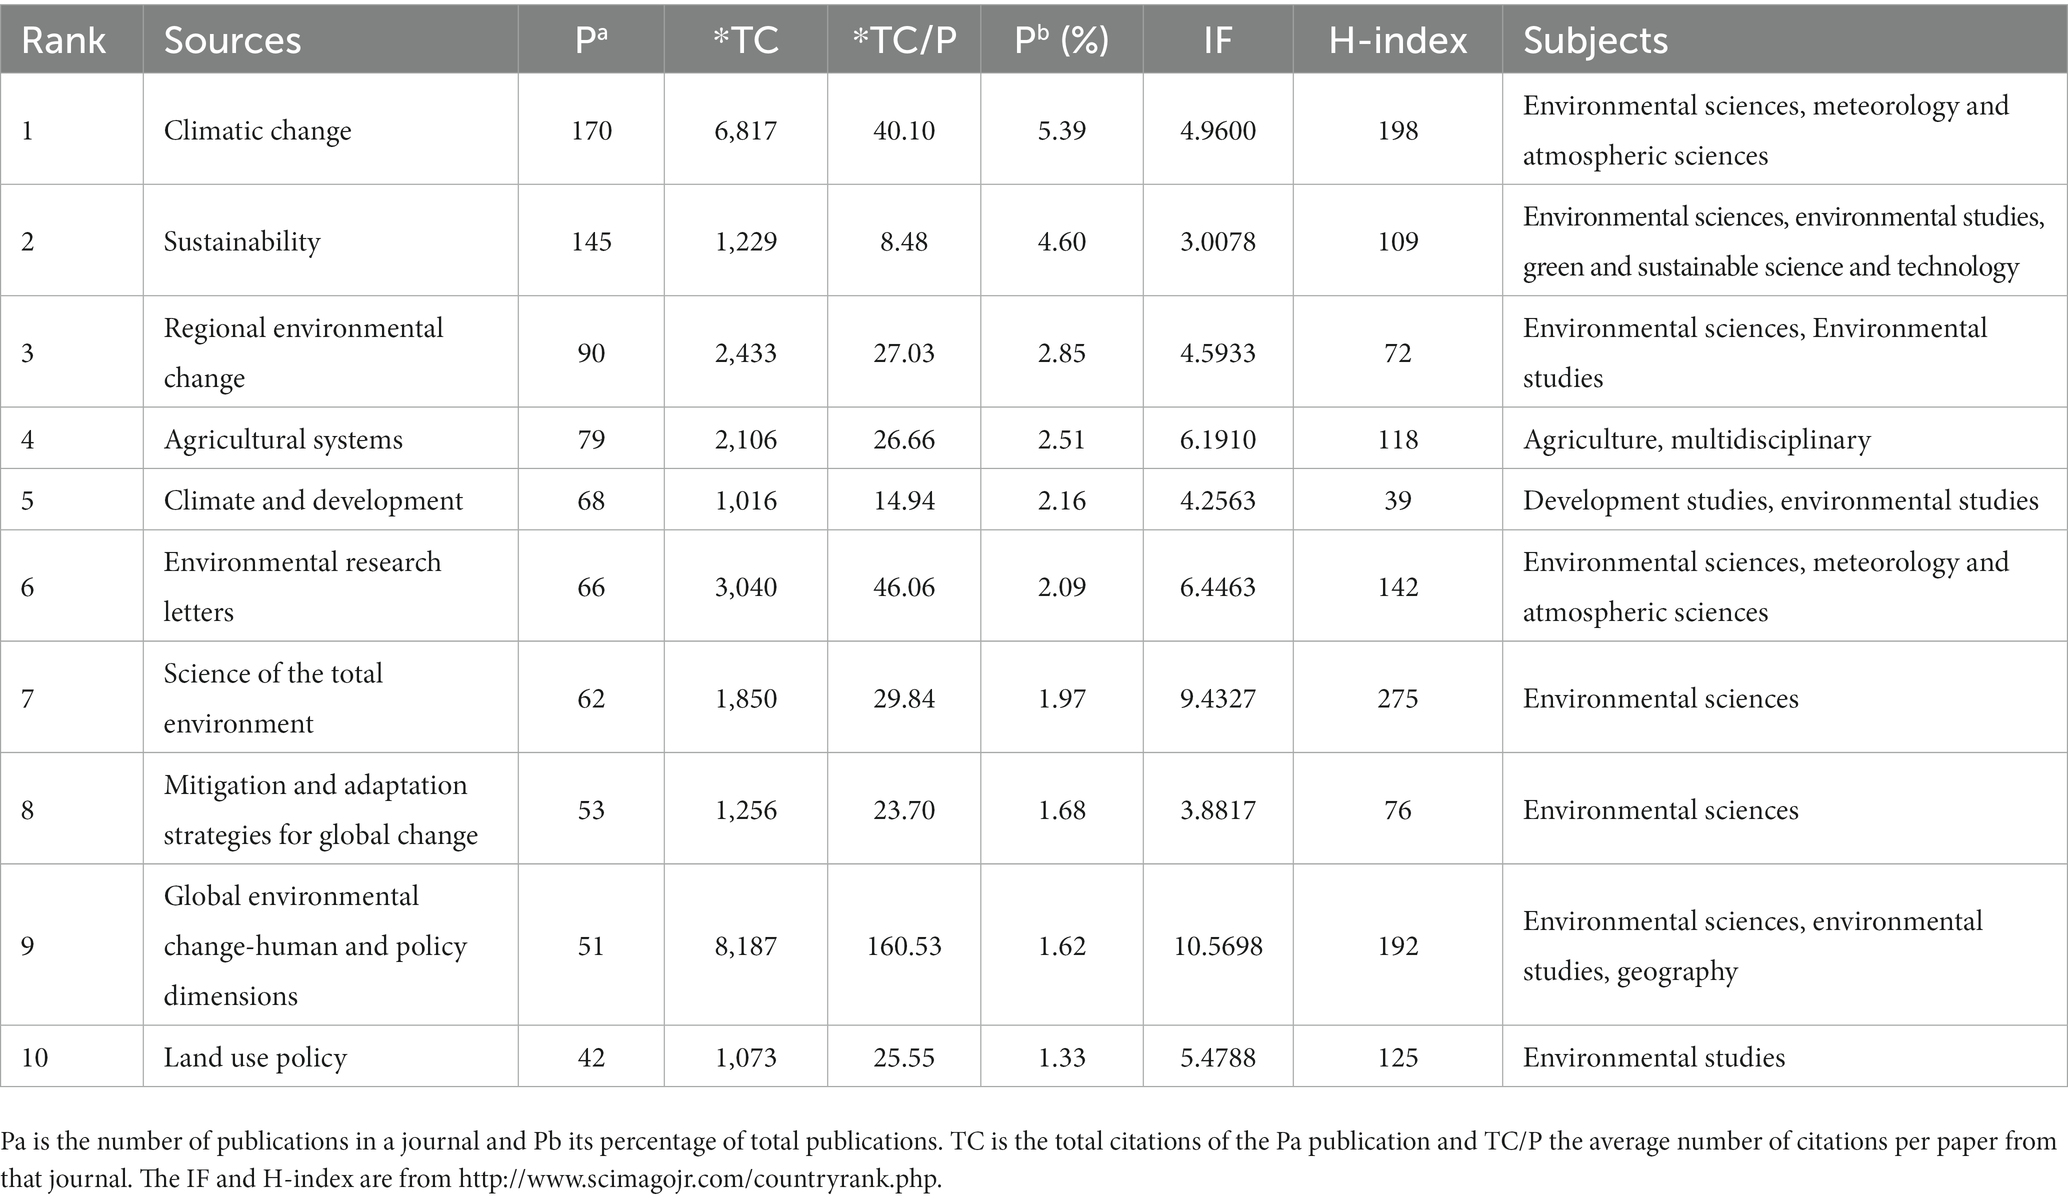
Table 2. Top 10 journals ranked by the total number of publications.
Agricultural economy is facing challenges from significant changes in prevailing climate patterns and more frequent or intense extreme weather events under global warming. Climate impact on agriculture has raised worldwide concerns of food supply, food security, equity, and sustainability (D’Odorico et al., 2018; Proctor et al., 2021). Over the last three decades, scientists have increasingly researched climate impacts on agriculture and are seeking adaptation solutions. Under this topic, a list of 3,154 peer-reviewed articles during 1996–2022 has been retrieved from the Web of Science Core Collection database. This bibliometric review quantifies the research activities by systematic mapping and inductive understanding for the status, focus, network, and funding. The analysis includes publication increase, author’s keywords development, subject category evolution, funding support sources, as well as active regions, institutions, and journals. The main results are summarized below:
1. The record of the publications can be roughly divided into the initial exploration stage (1996–2007), the steady development stage (2008–2016), and the rapid growth stage (2017–2022), with 101, 946 and 2,107 publications, respectively. There were 954, 10,465, and 27,058 keywords identified in the respective periods. More new keywords appeared in the rapid growth stage, including climate-smart agriculture, crop yield, crop production, resilience, adaptation strategies, smallholder farmers, and sustainability.
2. The categories for the most papers are Environmental Sciences, followed by Environmental Studies, Agriculture Multidisciplinary, and Meteorology & Atmospheric Sciences. The categories with the largest centralities are Water Resources, Environmental Sciences and Meteorology and Atmospheric Sciences. The strongest citation subject is Meteorology and Atmospheric Sciences. The subjects emerging after 2019 are Biodiversity & Conservation, Biochemistry & Molecular Biology, Plant Sciences, Remote Sensing and Engineering, Environmental with low strength.
3. A total of 3,154 funding awards were acknowledged in these papers. The U.S., EU, China, and U.K. are the most active funding bodies (in the decreasing order). The U.S., China, the U.K., Australia, Germany, and India account for the most publications, and they are also the key pioneers carrying out the research. Germany, Australia, and the U.K. are the relative centrioles for close academic cooperation with other countries. The U.S., U.K., and Pakistan played the academic leading role in the first, second, and third periods, respectively. Overall, the U.S. is the world leader in the research on climate impact on agriculture, while the Chinese Academy of Sciences, Wageningen University, and the University of Leeds are the most active research institutions.
The information provided from the review above will help prioritize future research focus, funding support, and institutional collaboration to maximize the scientific results’ impact on navigating agricultural adaptation and sustainability under climate change. The topics, however, are very complicated and challenging, where transdisciplinary research becomes necessary. Recently, scientists began quantifying climate impacts on agricultural economy (Wu et al., 2015; Liang et al., 2017; Ortiz-Bobea et al., 2021; Liang, 2022) and investigating agricultural adaptation to climate change (Pokhrel et al., 2021). Liang et al. (2017) found that U.S. agricultural total factor productivity (TFP) could fall to pre-1980 levels by 2050 even when accounting for present rates of innovation. Ortiz-Bobea et al. (2021) showed that anthropogenic climate change has reduced global TFP by about 21% since 1961 and will make global agriculture more vulnerable in the coming decades.
Agricultural productivity cannot function alone, but intrinsically relies on the ability and dynamics of the entire Earth system, in which food, energy, and water (FEW) systems are fully coupled. Climate change and population growth are crippling FEW resources, projected to increase global demand for food by 70%, water by 55%, and energy by 50% in 2050. This poses a grand challenge facing humanity, and bursts global research interest tackling agricultural problems through the FEW nexus framework (D’Odorico et al., 2018; Zhang et al., 2019; Liang, et al., 2020; Proctor, et al., 2021). Future priority research should take the FEW nexus approach to develop stakeholder-cantered, science-informed decision support systems and pave the optimal, adaptative pathways from local-regional actions to sustain national-worldwide agricultural productivity and quantify climate-smart agricultural practices to mitigate global warming.
Publicly available datasets were analyzed in this study. This data can be found at: https://www.webofscience.com/wos/woscc/basic-search.
YW: conceptualization, methodology, investigation, and writing—original draft preparation. SM: software. YW and SM: validation and formal analysis, and visualization. YW, X-ZL, CL, and WG: writing—review and editing. X-ZL: supervision. WG and X-ZL: funding acquisition. All authors have read and agreed to the published version of the manuscript.
This work was supported mainly by the U.S. Department of Agriculture (USDA) UV-B Monitoring and Research Program at Colorado State University under USDA National Institute of Food and Agriculture (NIFA) Grant 2019–34263-30552, and the USDA NIFA Project on developing the Dashboard for Agricultural Water use and Nutrient management (DAWN) at the University of Maryland under Grant 20206801231674.
The authors would like to thank the reviewers and editors for their comments which helped improve the paper.
The authors declare that the research was conducted in the absence of any commercial or financial relationships that could be construed as a potential conflict of interest.
All claims expressed in this article are solely those of the authors and do not necessarily represent those of their affiliated organizations, or those of the publisher, the editors and the reviewers. Any product that may be evaluated in this article, or claim that may be made by its manufacturer, is not guaranteed or endorsed by the publisher.
The Supplementary material for this article can be found online at: https://www.frontiersin.org/articles/10.3389/fsufs.2023.1191305/full#supplementary-material
Barnabas, B., Jäger, K., and Fehér, A. (2008). The effect of drought and heat stress on reproductive processes in cereals. Plant Cell Environ. 31, 11–38. doi: 10.1111/j.1365-3040.2007.01727.x
Chen, C. (2004). Searching for intellectual turning points: progressive knowledge domain visualization. Proc. Natl. Acad. Sci. 101, 5303–5310. doi: 10.1073/pnas.0307513100
Chen, C. (2006). CiteSpace II: detecting and visualizing emerging trends and transient patterns in scientific literature. J. Am. Soc. Inf. Sci. Technol. 57, 359–377. doi: 10.1002/asi.20317
D’Odorico, P., Davis, K. F., Rosa, L., Carr, J. A., Chiarelli, D., Dell’Angelo, J., et al. (2018). The global food-energy-water nexus. Rev. Geophys. 56, 456–531. doi: 10.1029/2017RG000591
Donthu, N., Kumar, S., Mukherjee, D., Pandey, N., and Lim, W. M. (2021). How to conduct a bibliometric analysis: an overview and guidelines. J. Bus. Res. 133, 285–296. doi: 10.1016/j.jbusres.2021.04.070
EPA. (2022). Ecosystem effects of ozone pollution. Available at: https://www.epa.gov/ground-level-ozone-pollution/ecosystem-effects-ozone-pollution. (Accessed March 18, 2022).
Gowda, P., Steiner, J. L., Olson, C., Boggess, M., Farrigan, T., and Grusak, M. A. (2018). “Agriculture and rural communities,” in Impacts, risks, and adaptation in the United States: fourth national climate assessment. eds. D. R. Reidmiller, C. W. Avery, D. R. Easterling, K. E. Kunkel, K. L. M. Lewis, and T. K. Maycock, et al., vol. II (U.S. global change research program, Washington, DC), 399–403.
IPCC (2021). “Summary for policymakers,” in Climate change 2021: the physical science basis. Contribution of working group I to the sixth assessment report of the intergovernmental panel on climate change. eds. V. Masson-Delmotte, P. Zhai, A. Pirani, S. L. Connors, C. Péan, and S. Berger, et al. (Cambridge University Press). Available at: https://www.ipcc.ch/report/ar6/wg1/chapter/summary-forpolicymakers.
Liang, X.-Z. (2022). Extreme rainfall slows the global economy. Nature 601, 193–194. doi: 10.1038/d41586-021-03783-x
Liang, X.-Z., Cai, X., Gao, W., Jonjak, A., Kenney, M., Long, S., et al., (2020). Improving agricultural water use and nutrient management to sustain food and energy crops production in the Corn Belt. Funded by United States Department of Agriculture – National Institute of Food and Agriculture. Available at: https://dawn.umd.edu.
Liang, X.-Z., Wu, Y., Chambers, R. G., Schmoldt, D. L., Gao, W., Liu, C., et al. (2017). Determining climate effects on US Total agricultural productivity. Proc. Natl. Acad. Sci. 114, E2285–E2292. doi: 10.1073/pnas.1615922114
Nolte, C. G., Dolwick, P. D., Fann, N. L., Horowitz, L. W., Naik, V., Pinder, R. W., et al. (2018). Air Quality. In Impacts, Risks, and Adaptation in the United States: Fourth National Climate Assessment, Volume II [Reidmiller, D.R., C.W. Avery, D.R. Easterling, K.E. Kunkel, K.L.M. Lewis, T.K. Maycock, and B.C. Stewart (eds.)]. U.S. Global Change Research Program, Washington, DC, USA, 512–538. doi: 10.7930/NCA4.2018.CH13
Ortiz-Bobea, A., Ault, T. R., Carrillo, C. M., Chambers, R. G., and Lobell, D. B. (2021). Anthropogenic climate change has slowed global agricultural productivity growth. Nat. Clim. Chang. 11, 306–312. doi: 10.1038/s41558-021-01000-1
Pokhrel, Y., Felfelani, F., Satoh, Y., Boulange, J., Burek, P., Gadeke, A., et al. (2021). Global terrestrial water storage and drought severity under climate change. Nat. Clim. Chang. 11, 226–233. doi: 10.1038/s41558-020-00972-w
Porter, A. L., Kongthon, A., and Lu, J. C. (2022). Research profiling: improving the literature review. Scientometrics 53, 351–370. doi: 10.1023/A:1014873029258
Proctor, K., Tabatabaie, S. M. H., and Murthy, G. S. (2021). Review gateway to the perspectives of the food-energy-water nexus. Sci. Total Environ. 764:142852. doi: 10.1016/j.scitotenv.2020.142852
Raynaud, M., Goutaudier, V., Louis, K., Al-Awadhi, S., Dubourg, Q., Truchot, A., et al. (2021). Impact of the COVID-19 pandemic on publication dynamics and non-COVID-19 research production. BMC Med. Res. Methodol. 21:255. doi: 10.1186/s12874-021-01404-9
Riccaboni, M., and Verginer, L. (2022). The impact of the COVID-19 pandemic on scientific research in the life sciences. PLoS One 17:e0263001. doi: 10.1371/journal.pone.0263001
Satoh, Y., Yoshimura, K., Pokhrel, Y., Kim, H., Shiogama, H., Yokohata, T., et al. (2020). The timing of unprecedented hydrological drought under climate change. Nat. Commun. 13:3287. doi: 10.1038/s41467-022-30729-2
UNFCCC. (2016). The Paris Agreement, Available at: https://unfccc.int/process-and-meetings/the-paris-agreement/the-paris-agreement.
USGCRP. (2017). Climate science special report: fourth national climate assessment, volume I. US Global Change Research Program, Washington, DC.
Van Eck, N. J., and Waltman, L. (2010). Software survey: VOSviewer, a computer program for bibliometric mapping. Scientometrics 84, 523–538. doi: 10.1007/s11192-009-0146-3
Walsh, M. K., Backlund, P., Buja, L., DeGaetano, A., Melnick, R., Prokopy, L., et al., (2020). Climate indicators for agriculture. USDA technical bulletin 1953. Washington, DC, pp. 1.
Wu, Y., Liang, X.-Z., and Gao, W. (2015). Climate change impacts on the U.S. agricultural economy. Proc. SPIE 9610, remote sensing and modeling of ecosystems for sustainability XII, 96100J. doi: 10.1117/12.2192469
Yordanov, I., Velikova, V., and Tsonev, T. (2020). Plant responses to drought, acclimation, and stress tolerance. Photosynthetica 38, 171–186. doi: 10.1023/A:1007201411474
Zhang, P., Zhang, L., Chang, Y., Xu, M., Hao, Y., Liang, S., et al. (2019). Food-energy-water (FEW) nexus for urban sustainability: a comprehensive review. Resour. Conserv. Recycl. 142, 215–224. doi: 10.1016/j.resconrec.2018.11.018
Ziska, L. H., Crimmins, A., Auclair, A., DeGrasse, S., Garofalo, J. F., Khan, A., et al. (2016). “Ch. 7: food safety, nutrition, and distribution,” in The impacts of climate change on human health in the United States: a scientific assessment (Washington, DC: U.S. Global Change Research Program), 197.
Keywords: climate impact, agricultural productivity, adaptation, sustainability, decision support, research priority
Citation: Wu Y, Meng S, Liu C, Gao W and Liang X-Z (2023) A bibliometric analysis of research for climate impact on agriculture. Front. Sustain. Food Syst. 7:1191305. doi: 10.3389/fsufs.2023.1191305
Edited by:
Dengpan Xiao, Hebei Normal University, ChinaReviewed by:
Tingju Zhu, Zhejiang University, ChinaCopyright © 2023 Wu, Meng, Liu, Gao and Liang. This is an open-access article distributed under the terms of the Creative Commons Attribution License (CC BY). The use, distribution or reproduction in other forums is permitted, provided the original author(s) and the copyright owner(s) are credited and that the original publication in this journal is cited, in accordance with accepted academic practice. No use, distribution or reproduction is permitted which does not comply with these terms.
*Correspondence: You Wu, eW91d3VAdW1kLmVkdQ==
Disclaimer: All claims expressed in this article are solely those of the authors and do not necessarily represent those of their affiliated organizations, or those of the publisher, the editors and the reviewers. Any product that may be evaluated in this article or claim that may be made by its manufacturer is not guaranteed or endorsed by the publisher.
Research integrity at Frontiers
Learn more about the work of our research integrity team to safeguard the quality of each article we publish.