 Muhammad Azrai1*Muhammad Aqil2Roy Efendi2Nining Nurini Andayani2Andi Takdir Makkulawu2Rafidah Neni Iriany2Suarni2Muhammad Yasin2Suwardi2Bunyamin Zainuddin2Salim2Trias Sitaresmi2Bahtiar3Paesal2Willy Bayuardi Suwarno4*
- 1Department of Agronomy, Faculty of Agriculture, Hasanuddin University, Makassar, Indonesia
- 2Research Center for Food Crops, National Research and Innovation Agency (BRIN), Bogor, Indonesia
- 3Research Center for Behavioral and Circular Economics, National Research and Innovation Agency (BRIN), Bogor, Indonesia
- 4Department of Agronomy and Horticulture, Faculty of Agriculture, IPB University, Bogor, Indonesia
Maize (Zea mays L.) production in tropical equatorial regions faces significant challenges due to agroclimatic and soil fertility variability, necessitating the evaluation of maize hybrid adaptability and phenotypic stability across diverse agroecosystems. This study compares the effectiveness of the additive main effects and multiplicative interaction (AMMI) and multi-trait genotype-ideotype distance (MGIDI) models for identifying superior maize hybrids well-suited to the equatorial climate. Fifteen genotypes, including 13 hybrid candidates and two popular commercial varieties (BISI 2 and NASA 29), were analyzed in 10 distinct environments in Indonesia over three consecutive years (2018–2020). The ANOVA method used in the AMMI model analyzed variance into three major components, with PCA analysis indicating that environments (E), genotypes (G), and their interaction (G × E) had a highly significant effect on yield (p < 0.001). Two hybrids, HM04 (CI301032/G102612) and HM02 (CI272022/G102612), displayed high adaptability and stability across various environments, with significantly higher yields than the grand mean by AMMI analysis. Additionally, HM10 (MAL03/CLYN231) and HM09 (G102612/CLYN231) were narrowly adapted to the ME-1 and ME-2 mega-environments, indicating they are best suited for these specific environments. Similar to AMMI, the MGIDI model suggested HM04 (MGIDI index = 1.74) and HM02 (MGIDI index = 1.76) as the two highest-performing hybrids, determined by their yield and nine other traits. Using the multiple trait combination index as a tool to assess the performance of these hybrids enabled researchers to determine the most effective traits for each genotype. The two models are recommended and may be integrated for comprehensive data interaction analysis, which simplifies the process of delineating genotypes with the environment and enables stakeholders to select desired traits while considering their strengths and weaknesses.
1. Introduction
Maize (Zea mays L.) production in Indonesia is highly influenced by the country’s topography and agroecosystem, where each region has different land and agroclimatic conditions. Maize production area encompasses a large proportion of the country’s rainfed land resources, both dryland and wetland. These conditions led to variations in the level of maize production among regions. In fertile regions such as Java Island, productivity gains can surpass 7 t ha−1, but in arid regions in the eastern part of the country, productivity gains can drop below 4 t ha−1 (Sulaiman et al., 2018). The different levels of land fertility, along with climate change, have a significant impact on maize cultivation patterns in Indonesia. Changes in precipitation patterns due to global warming have increased the potential of extended periods of erratic rainfall in the regions. As a result, many regions are experiencing drought conditions and are more vulnerable to severe weather events. Despite the high grain yield of improved hybrid varieties, there are still challenges to improving maize farming productivity, adaptability, and profitability. Thus, the development of varieties with broader adaptation and resistance to abiotic and biotic changes is critical for the sustainable growth of national maize production. An adaptation trial is a method in plant breeding that is commonly used to evaluate genotype-environment interactions and select genotypes with stable performance over a wide range of environmental conditions (stability) or well-adapted to a particular environment. The concept of stability in agronomy refers to a plant’s ability to maintain yield potential regardless of changing environmental conditions (Tollenaar and Lee, 2002).
The additive main effects and multiplicative interactions (AMMI) analysis and genotype main effect and genotype-environment (GGE) biplot model are among the most appropriate statistical methods for analyzing such complex multi-location datasets (Gauch, 2006; Yan et al., 2007) using principal component analysis (PCA); both methods can provide a straightforward graphical representation of a complex genotype. As part of the AMMI model, genotypes are explained and interpreted in response to environmental diversity, selecting the appropriate model, describing the interaction between genotypes × locations, and improving interactions estimate (Crossa, 1990). AMMI’s model combines variance analysis as a multiplying parameter with a single model. An overview of the results of the analysis is presented graphically for ease of interpretation and understanding (Yan et al., 2007). AMMI offers a more thorough evaluation of the genotype × environment interaction by taking into account both the genotype and the environment’s joint impact on the response, whereas the GGE biplot primarily concentrates on the genotype’s contribution. AMMI model is a powerful approach to dissecting GEI in multi-environment experiments. AMMI was positive and significantly correlated some statistic stability, and also showed a positive correlation with grain yield.
As an extension of the AMMI method, the GGE biplot allows a greater understanding of the sources of variation resulting from genotype × environment interactions (Roostaei et al., 2014). Specifically, the GGE biplot is composed of three components, namely an analysis of the mega environment, an analysis of the test site, and an analysis of the genotype. GGE biplots provide graphical representations of genotypes in specific environments, their adaptability in diverse environments, identification of the best genotypes in each environment, visualization of the mega-environment, and the average appearance of genotypes and their stability. The GGE biplot can be used to compare the performance of the environments with the performance of an ideal environment, as well as the performance of the genotypes with the performance of an ideal genotype. Additionally, the GGE biplot can highlight the genotypes with the highest grain yield and the ideal genotype and environment in each mega-environment (Farshadfar et al., 2011). Alizadeh et al. (2017) suggested that both AMMI and GGE biplot models are interrelated and could be used interchangeably. Both models are equally capable of providing insights into the genotype × environment interaction and could be used in conjunction with each other to yield a more comprehensive understanding of the GEI. By combining the strengths of both models, researchers can have a better grasp of the complex interplay between genotype and environment in determining the growth and development of crops.
Numerous strategies involving AMMI and GGE biplot have been proposed to evaluate the yield stability of plants under abiotic stress. These strategies have been applied to a wide range of abiotic stress scenarios, such as the complex nature of salinity (Krishnamurthy et al., 2021), hybrid adaptability under waterlogging (Azrai et al., 2022), and stress-prone environments in eastern Africa (Rezende et al., 2020). Other studies have used AMMI and GGE biplot to evaluate the genetic × environment interaction under high iron and zinc in common wheat, the adaptability of durum lines under dryland conditions (Sadeghzadeh et al., 2018), the yield adaptability of early maturity maize hybrid (Oyekunle et al., 2017), peanut yield stability under high levels of phosphorus content (Ajay et al., 2020), and also for identifying stability in diverse maturity group of rice (Siddi et al., 2022). These studies demonstrate the versatility of the AMMI and GGE biplot models in evaluating the yield stability of crops under a variety of abiotic stress conditions.
Similar applications of AMMI and GGE biplot have also been investigated in various biotic stress environments, including rice-blast pathosystem (Mukherjee et al., 2013), Agrotis spp. Cutworms vulnerable areas (Bocianowski and Wielkopolan, 2022), the response of cassava to various pests and diseases such as brown streak disease (Pariyo et al., 2015). Fotso et al. (2018) conducted a study that investigated the response of cassava to multiple pests and diseases, utilizing AMMI and GGE biplot to evaluate the impact of these biotic stresses on cassava growth and development. Besides being intended to evaluate the stability of genotypes against changes in environmental conditions, AMMI and GGE biplots are also commonly used in evaluating plant nutrient levels such as the stability test of high quality maize protein (lysine and tryptophan) under distinct environments (precipitation, soil and temperature range; Kumar et al., 2020), rich pro-vitamin A and dry matter contents (Esuma et al., 2016), enriched amylopectin content of waxy maize grown in a temperate climate (Ozata, 2021), yield stability of purple maize parental lines with a high level of anthocyanin content (Mufidah et al., 2021) as well as evaluation of green ear yield and green fodder yield of prospective baby corn (Choudhary et al., 2020).
The AMMI and GGE biplot methods typically focus on the analysis of single components, particularly grain yield under various environmental conditions. However, it is crucial to select an appropriate method that considers multiple traits since users’ preferences are not limited to a single factor. For example, farmers in dry areas of Indonesia prefer high-yielding and early-maturing varieties to mitigate the risk of drought, while those in middle elevation regions (>600 m) prioritize varieties that are both high-yielding and resistant to fusarium ear rot disease. Olivoto and Nardino (2021) proposed a new index named MGIDI (multi-trait genotype-ideotype distance) for the simultaneous selection of genotypes based on multiple traits. As reported in various trials, this index outperforms the widely-used base linear phenotypic selection index, the Smith-Hazel (SH) index. Moreover, the MGIDI index enables the identification of the strengths and weaknesses of genotypes or treatments, thereby facilitating the selection of preferred genotypes based on selected criteria.
The objective of this study was to compare the effectiveness of single trait and multiple trait based selection methods for identifying superior maize hybrids that are well-suited to the equatorial climate in Indonesia. Specifically, the study aimed to evaluate the performance of different maize hybrids under a range of environmental conditions, including the identification of which traits are most important for optimizing maize yield in equatorial regions. The impact of multiple trait selection on the overall yield of maize hybrids was also discussed.
2. Materials and methods
2.1. Genetic materials and setup locations
The genetic material used in the multilocation test included 13 single cross hybrids, namely HM01 (CI100422/G102612), HM02 (CI272022/G102612), HM03 (CI180515/Mal03), HM04 (CI301032/G102612), HM05 (CI820231/Mal03), HM06 (CI510752/Mal03), HM07 (CI190724/Mal03), HM08 (CI292431/CY16), HM09 (G102612/CLYN 231), HM10 (MAL03/CLYN231), HM11 (CLYN 231/AL-46), HM12 (DYW 10/CY 11), HM13 (DYW 24/CY 11), and two commercial hybrid maize varieties as checks, namely NASA 29 (MAL03/G102612) and BISI 2 (a commercial hybrid of BISI International; Table 1). CI lines were extracted from synthetic populations resulting from the recombination of India and China-introduced hybrids. G102612 is a good recombinant line derived from drought-tolerant lines trials in 2015. The MAL03 line was developed as a result of the Asian Biotechnology Maize Network (AMBIONET) initiative. It was derived from a base population of maize plants that were known to have resistance to downy mildew.
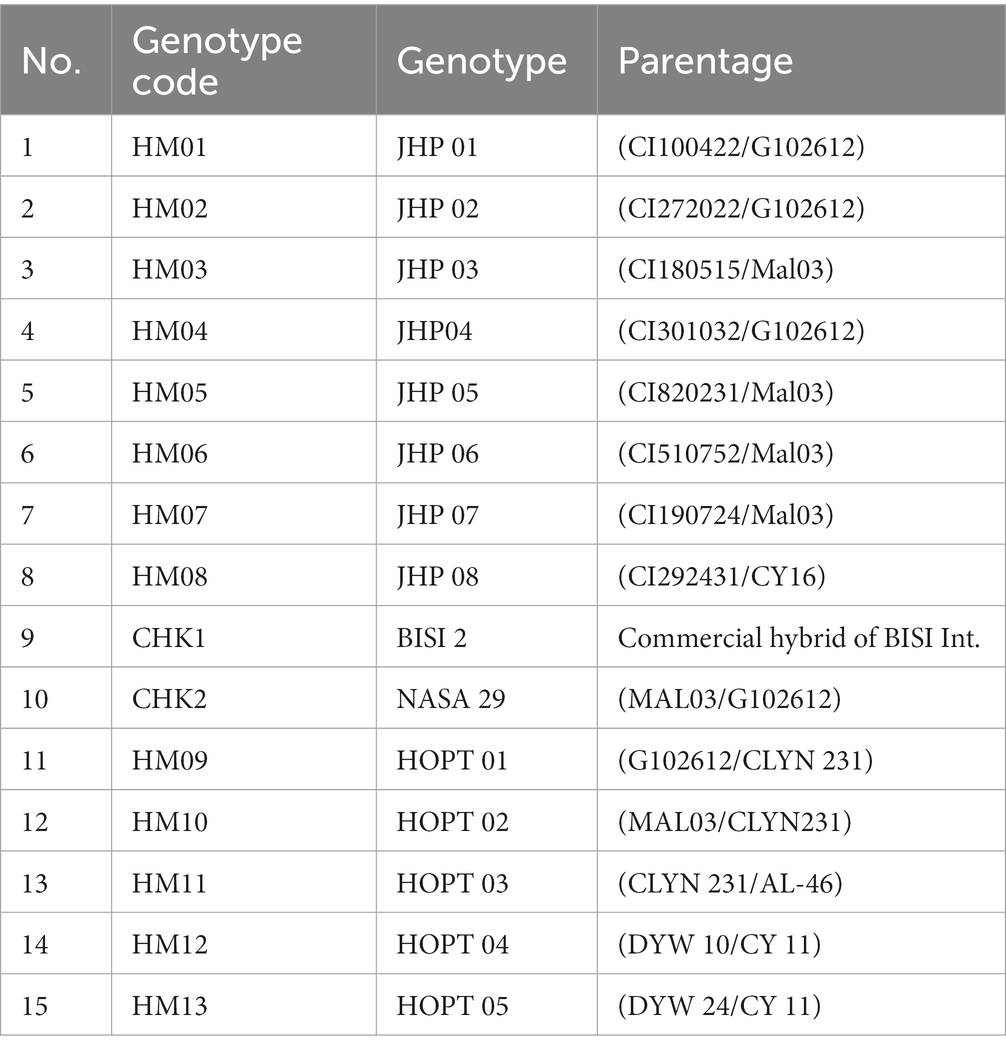
Table 1. List of genotypes and parentage used in the experiment.
The MAL03 line was selected for its downy mildew resistance and is expected to play an important role in future breeding efforts aimed at improving the resistance of maize crops to this disease. CLYN231 line was developed by the national research institute by extracting Downy mildew tolerant lines introduced from CIMMYT Nairobi in 2011. DYW lines were derived from a cross between the white drought tolerant CML505 line and the downy mildew tolerant Nei9008DMR line. The CY lines were extracted from populations of random crosses between drought-tolerant lines introduced by CIMMYT. These random crosses were made to generate a diverse range of genotypes with the potential for improved drought tolerance. The CY lines were selected based on their high yield potential under drought conditions and are a promising source of germplasm for future breeding efforts aimed at developing more drought-tolerant maize varieties.
Ten different locations were selected to evaluate prospective maize hybrid candidates during 2018–2020 cropping seasons. The trial locations included Gowa, Maros, Probolinggo, Malang, Tomohon, Minahasa, North Minahasa, Sigi, Poso, and Lombok Barat (Figure 1; Table 2). The experimental sites cover a wide range of geographic locations, stretching from 0°36’ North latitude to 124°49 East longitude. The typology of these sites is diverse, with some located in lowland areas at an elevation of below 100 meters above sea level (masl), while others are situated in highland areas above 1,000 masl. This range of elevations and topologies provides a comprehensive representation of the range of conditions and environments that can be encountered in this region. The precipitation and agroclimatic data were gathered from meteorological stations in close proximity to the experimental locations The three most probable soil types found in the trial areas are Andosol, Alluvial, and Regosol, each of which has different soil textures. The Andosol soil is characterized by a high content of volcanic ash and a dark color, while the Alluvial soil is formed from deposits of river water and is rich in minerals. Regosol soil has limited organic matter, often found in areas with sparse vegetation. The trial areas have a range of soil textures including clay loam, sandy loam, and clay. The presence of these different soil types and textures in the trial areas highlights the importance of considering soil factors in the evaluation of maize performance, as these factors can have a significant impact on plant growth and development.
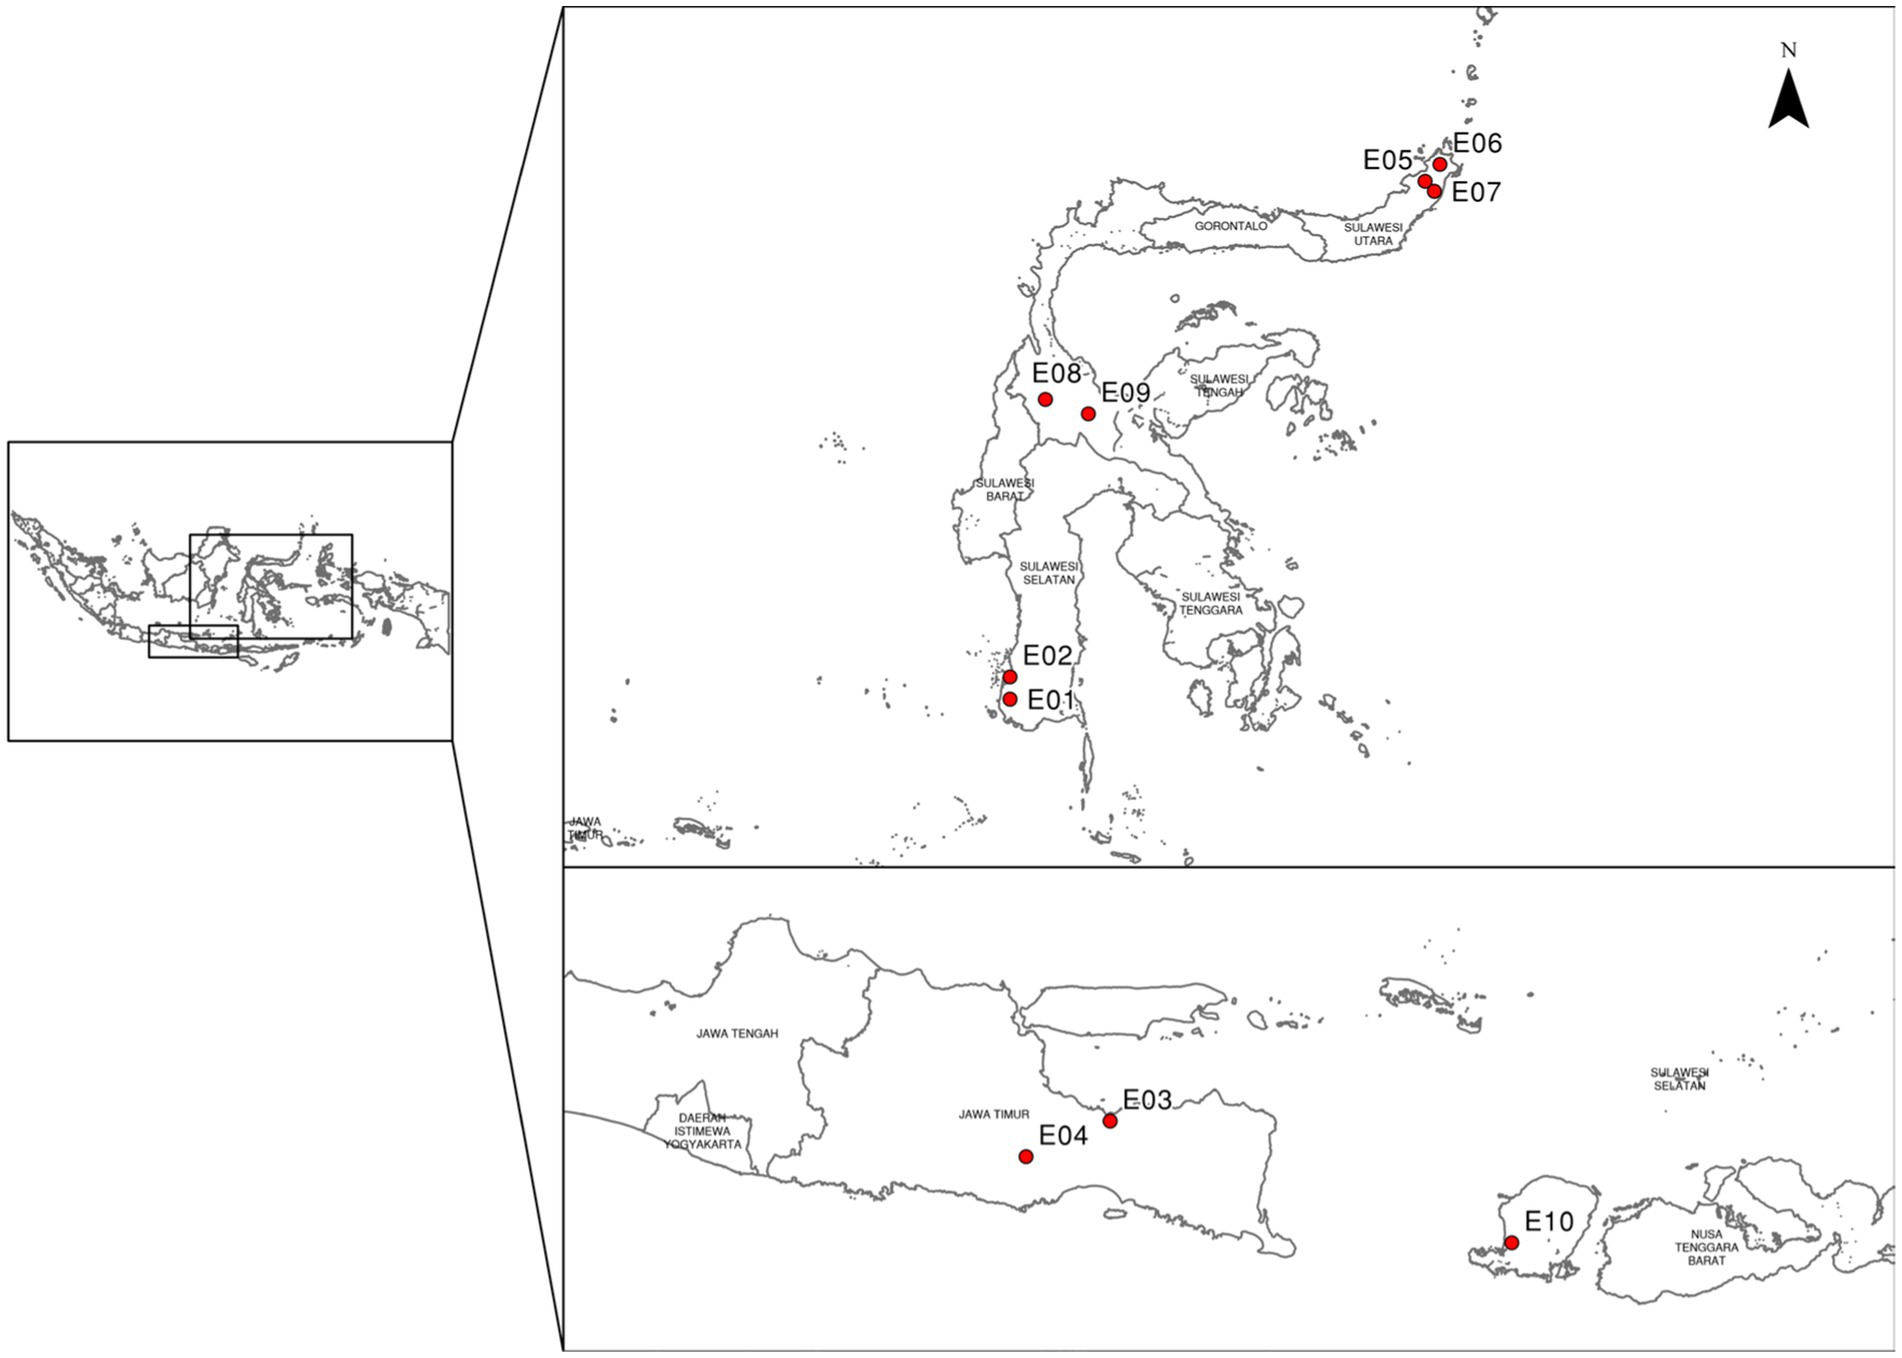
Figure 1. Map of the maize trial locations in Indonesia.
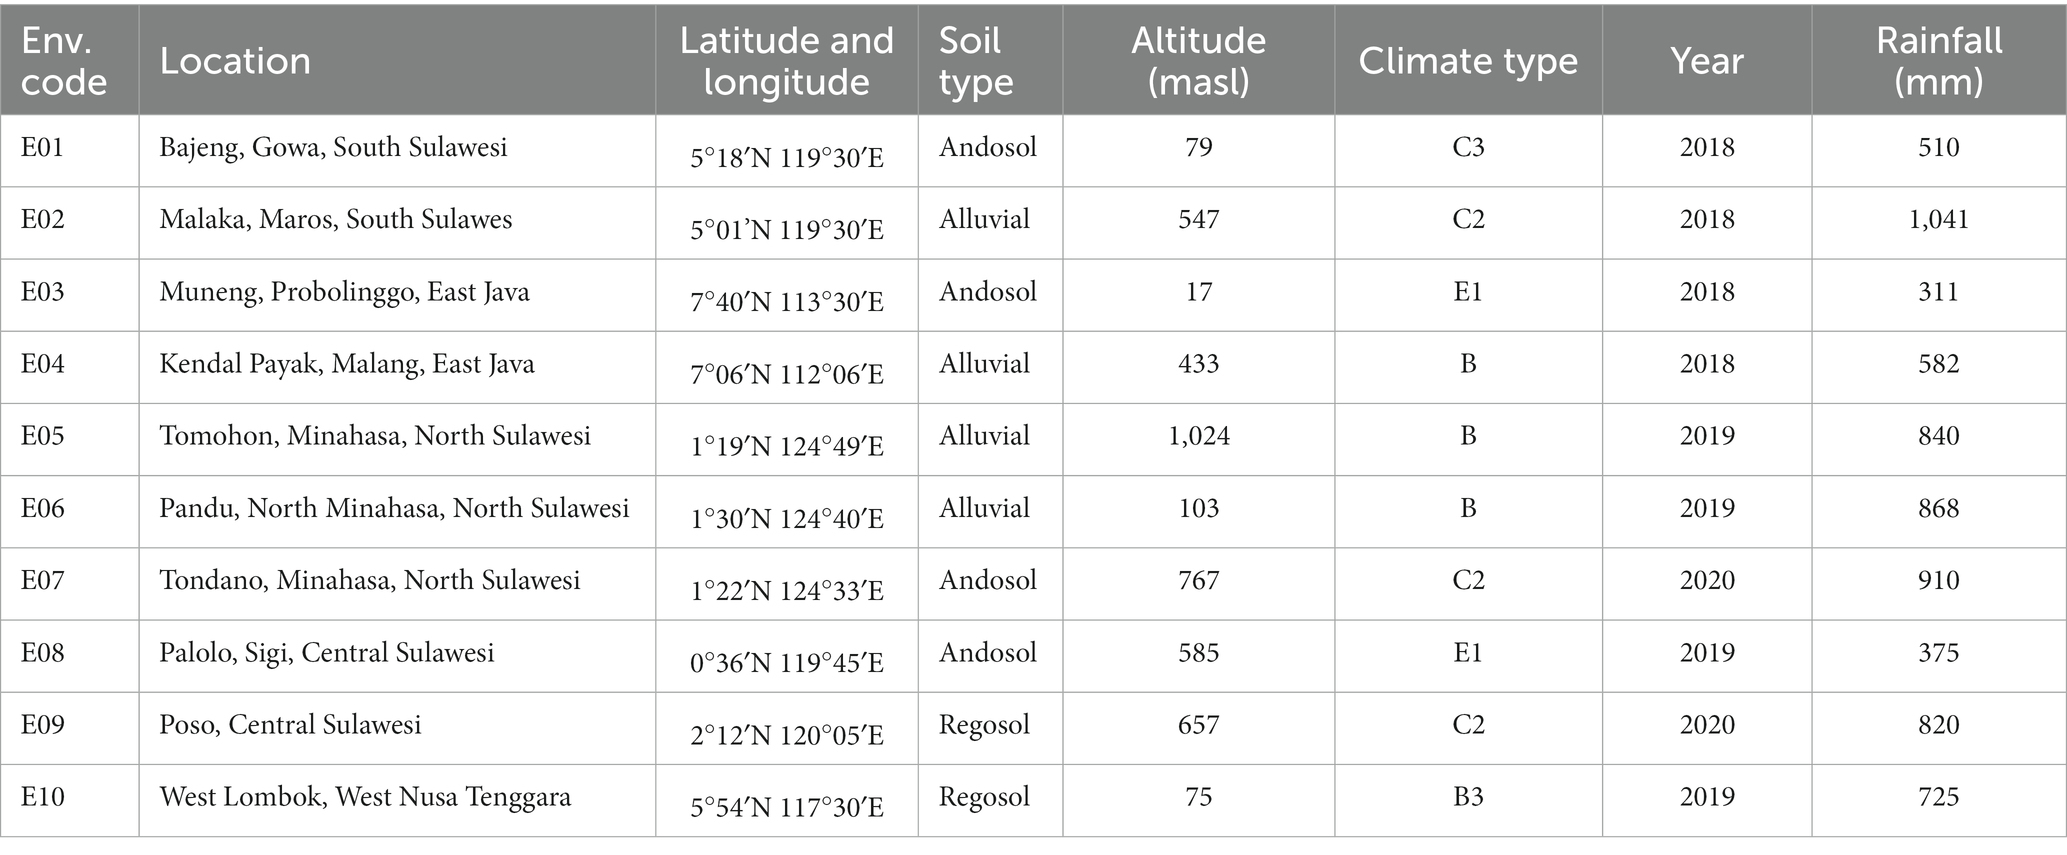
Table 2. Description of 10 environments used for maize hybrids evaluation in Indonesia.
According to Oldeman’s classification system, the study areas have been divided into three different climate types: B, C, and E. Each of these climate types has a different number of wet and dry months, with varying levels of rainfall and temperature, affecting the growth and development of crops in the study areas. During the experiment, the amount of rainfall experienced varied greatly, ranging from 311 mm, which was considered less sufficient, to more than 1,000 mm, which was considered very high. To compensate for the insufficient rainfall in some locations, additional irrigation was provided using groundwater pumped through a pump, ensuring that the maize crops received an adequate amount of water for optimal growth and development. Several locations, including Bajeng, Gowa District, and Malaka, Maros District, are also subject to water logging stress during rainy-season trials, thus it is crucial to construct a drainage system to drain out excess water.
The experimental design at each site was arranged using a randomized complete block design (RCBD) with three replications. Each plot was planted in four rows with a length of 5.0 m, and plant spacing of 70 cm between rows and 20 cm within a row. The land preparation process involved the use of a disk plow attached to a four-wheeled Kubota tractor. This tool was used to prepare the soil for planting by breaking up clumps, smoothing the soil surface, and creating furrows for planting. Maize was sown two seeds per hole and thinned leaving one plant per hole 10–12 days after planting. Fertilization was done twice, in the initial fertilization, 350 kg of NPK (15,15:15) and 150 kg of urea per hectare were applied to the field 10 days after planting (DAP). The second fertilization uses urea (46% N) only at a rate of 200 kg/ha at 30 DAPS. Other cultivation activities such as weeding, ridging, irrigation, pest, and disease control follow the Indonesian Ministry of Agriculture’s technical protocol. During the trial, there were no significant insect infestations, but the most prevalent disease on the plants was downy mildew, which was treated by a fungicide containing 35% metalaxyl active components.
Harvesting is carried out when the plants have entered a physiological maturity phase which is marked by the appearance of a black layer at the base of the kernels. To determine grain yield, a manual harvesting method was used, where a five-meter length of the middle rows in each replicate was harvested. This approach was selected to ensure that a representative sample of the plot was collected for yield calculation. The harvested ears per plot were weighed and recorded. This process was repeated for each replicate to ensure accurate and consistent yield data collection across all replicates. The kernel moisture content was measured at harvest using a PC-16A digital grain moisture meter.
2.2. Phenotypic data and statistical analysis
A variety of agronomic and yield-related traits were observed, namely plant height, ear height, plant aspect, days to maturity, ear diameter, ear length, number of kernel rows, number of kernels per row, shelling percentage, 1,000 kernel weights, and grain yield. Grain yield was calculated by using the standard procedure released by International Maize and Wheat Improvement Center (2004) as follows:
Where Yield is the grain yield (t ha−1) adjusted to 15% moisture content, Mo is the measured kernel moisture content during harvest (%), plot size is the area of the harvested plot (m2), EW is ear weight per plot (kg), and SP is shelling percentage. The average yield for each genotype-environment combination was then calculated from the yield data obtained from each replicate, allowing for the evaluation of the genotypes’ performance under different environmental conditions.
Grain yield data derived from different locations and years were pooled and analyzed using the AMMI model. The AMMI model is a statistical approach that considers both the main effects of genotype and environment, as well as their interaction, in predicting the yield of crops (Gauch, 2013). These methods were chosen due to their effectiveness and accuracy in predicting yield and understanding genotype-environment interactions in agricultural studies. The ANOVA method is used in the AMMI model to analyze the variance and divide it into three major components: genotype (G), environment (E), and the interaction between genotype and environment (G × E) to provide a more comprehensive understanding of how genotypes and environmental factors contribute to the observed response variable. Further, the G × E data are then subjected to principal component analysis (PCA).
A model diagnosis can be used to identify the top AMMI model family for a certain database, including additional F-tests in evaluating model analysis, as well as finding significant interaction principal components in the AMMI model by utilizing AMMI packages (Gauch, 2013). The AMMI family of models includes different versions, each represented by a different number of principal components. The versions range from AMMI0 with no principal components to AMMI1 with one principal component, AMMI2 with two principal components, AMMI3 with three principal components, and so on, up to AMMIF (the full model). The mathematical equation for each version is specified in the AMMI model family:
Where Yij is the mean yield of genotype g in environment e; μ is the overall mean of the yield; gi is the genotypic mean deviation from the overall mean; ej is the environmental mean deviation from the overall mean; S is the number of retained PCA axes; λk is the singular value for the PCA axis k; αik is genotype’s PCA score on the PCA axis k; γ jk is environment’s PCA score (eigenvector) on the PCA axis k; and εij is the error term (Gauch, 2013). The ratio is determined by comparing the performance of the overall genotype winner in a particular environment to its average performance across all environments. If the overall genotype winner performs the best in a particular environment, the ratio is set to 1, which indicates a strong adaptation to that environment. This ratio helps to identify the environments where the genotype performs particularly well or poorly and to understand the influence of GEI on the genotype’s performance.
The predictive accuracy of the AMMI models was evaluated using a cross-validation procedure based on the methodology outlined by (Piepho, 1994). In this procedure, the original dataset was divided into two sets: a training set and a validation set. The training set comprised two complete and randomly selected blocks per environment, while the validation set consisted of the remaining block per environment. Several AMMI models (AMMI0, AMMI1, and AMMIF), were fitted to the training data, and their predictive performance was comparatively assessed using the root mean square prediction difference (RMSPD) between the model estimates and validation data. In order to obtain a robust estimate of the model, this process was repeated 1,000 times, and a boxplot was used to represent the distribution of the RMSPD of each AMMI model.
The study also employed a multitrait genotype-ideotype distance index (MGIDI) to select the best genotypes based on information about multiple trait information (Olivoto and Nardino, 2021). In the first step, each trait was scaled using the following equation:
Where φoj and ηoj represent the minimum and maximum original values for the jth trait, respectively, while φnj and ηnj represent the new minimum and maximum values for the jth trait after rescaling, respectively. The original value for the jth trait of the ith genotype is represented by θij . The values of φnj and ηnj were selected based on the desired gains for each trait: for traits with positive gains, φnj = 0 and ηnj=100were used, while for traits with negative gains, φnj = 100 and ηnj=0were used, as suggested by (Olivoto and Nardino, 2021). In the subsequent step, we conducted a factor analysis (FA) to account for the dimensionality reduction of the data and relationship structure. This analysis was carried out using the following model:
F is a g × f matrix consisting of the factorial score, Z is a g × p matrix representing the rescaled means, A is a p × f matrix of canonical loading, and R is a p × p correlation matrix between the measured traits. The variables g, f, and p indicate the number of genotypes, factor retained, and measured traits, respectively. In the third step of the analysis, a [1 × p] vector was counted as the ideotype matrix. Finally, the multitrait genotype-ideotype distance index (MGIDI) was calculated as the Euclidean distance between the scores of the genotypes and the ideal genotypes. This index was computed using the following formula:
The score of the ith genotype in the jth factor (i = 1, 2,…,t; j = 1,2,…,f) is represented by γij , where t and f denote the number of genotypes and factors, respectively. The score of the jth trait for the ideal genotype is represented by γj . The MGIDI was calculated as the Euclidean distance between the scores of the genotypes and the ideal genotype. The genotype with the lowest MGIDI is considered closer to the ideal genotype and reflects the desired values for all the measured traits. The selection of genotypes involved all traits using a selection intensity of approximately 30%.
Running the AMMI model was done using the open-source software AMMISOFT, which is accessible at https://scs.cals.cornell.edu/people/hugh-gauch. Approximately 130 megabytes of disk space were required to download the packages. This software package requires about 256 MB of high-speed memory and is designed only for PCs with a Windows operating system installed. Users’ interfaces and graphs have been coded using Python, while AMMI computations and tables have been written in Fortran. In addition, the setup and all dependencies are also available at https://github.com/tequa/ammisoft. In addition to AMMISOFT, the R package “metan” was used within the R Studio environment to create genotype-versus-environment plots and MGIDI calculation (Olivoto et al., 2019). This was achieved by utilizing the gamem and mgidi functions from the ‘metan’ package. The package provides additional tools for analyzing and visualizing multi-environment trial data. The package can be found online at the following website: https://tiagoolivoto.github.io/metan/reference/ge_plot.
3. Results and discussion
3.1. Analysis of mean performance using AMMI model
3.1.1. Analysis of variance
The 15 hybrid maize genotypes that were evaluated in this study were developed through a crossbreeding process involving 13 female lines and 6 male lines. These hybrid varieties represent a combination of different genetic traits and characteristics from their parent lines, and their performance was tested at 10 different locations to determine their grain yield and other key characteristics. The homogeneity of error variance was evaluated through a residual versus fitted value plot (figure not shown) and no obvious pattern was observed, indicating that the homogeneity of variance assumption is approached and a combined ANOVA could be performed. The best genotypes were then selected based on their greatest mean yields within different environmental conditions. The results of the evaluation of the grain yield of 15 hybrid maize genotypes and two control varieties are displayed in Table 3. In addition, the genotype-versus-environment plot of maize hybrids during the 2018–2020 trials is shown in Figure 2.
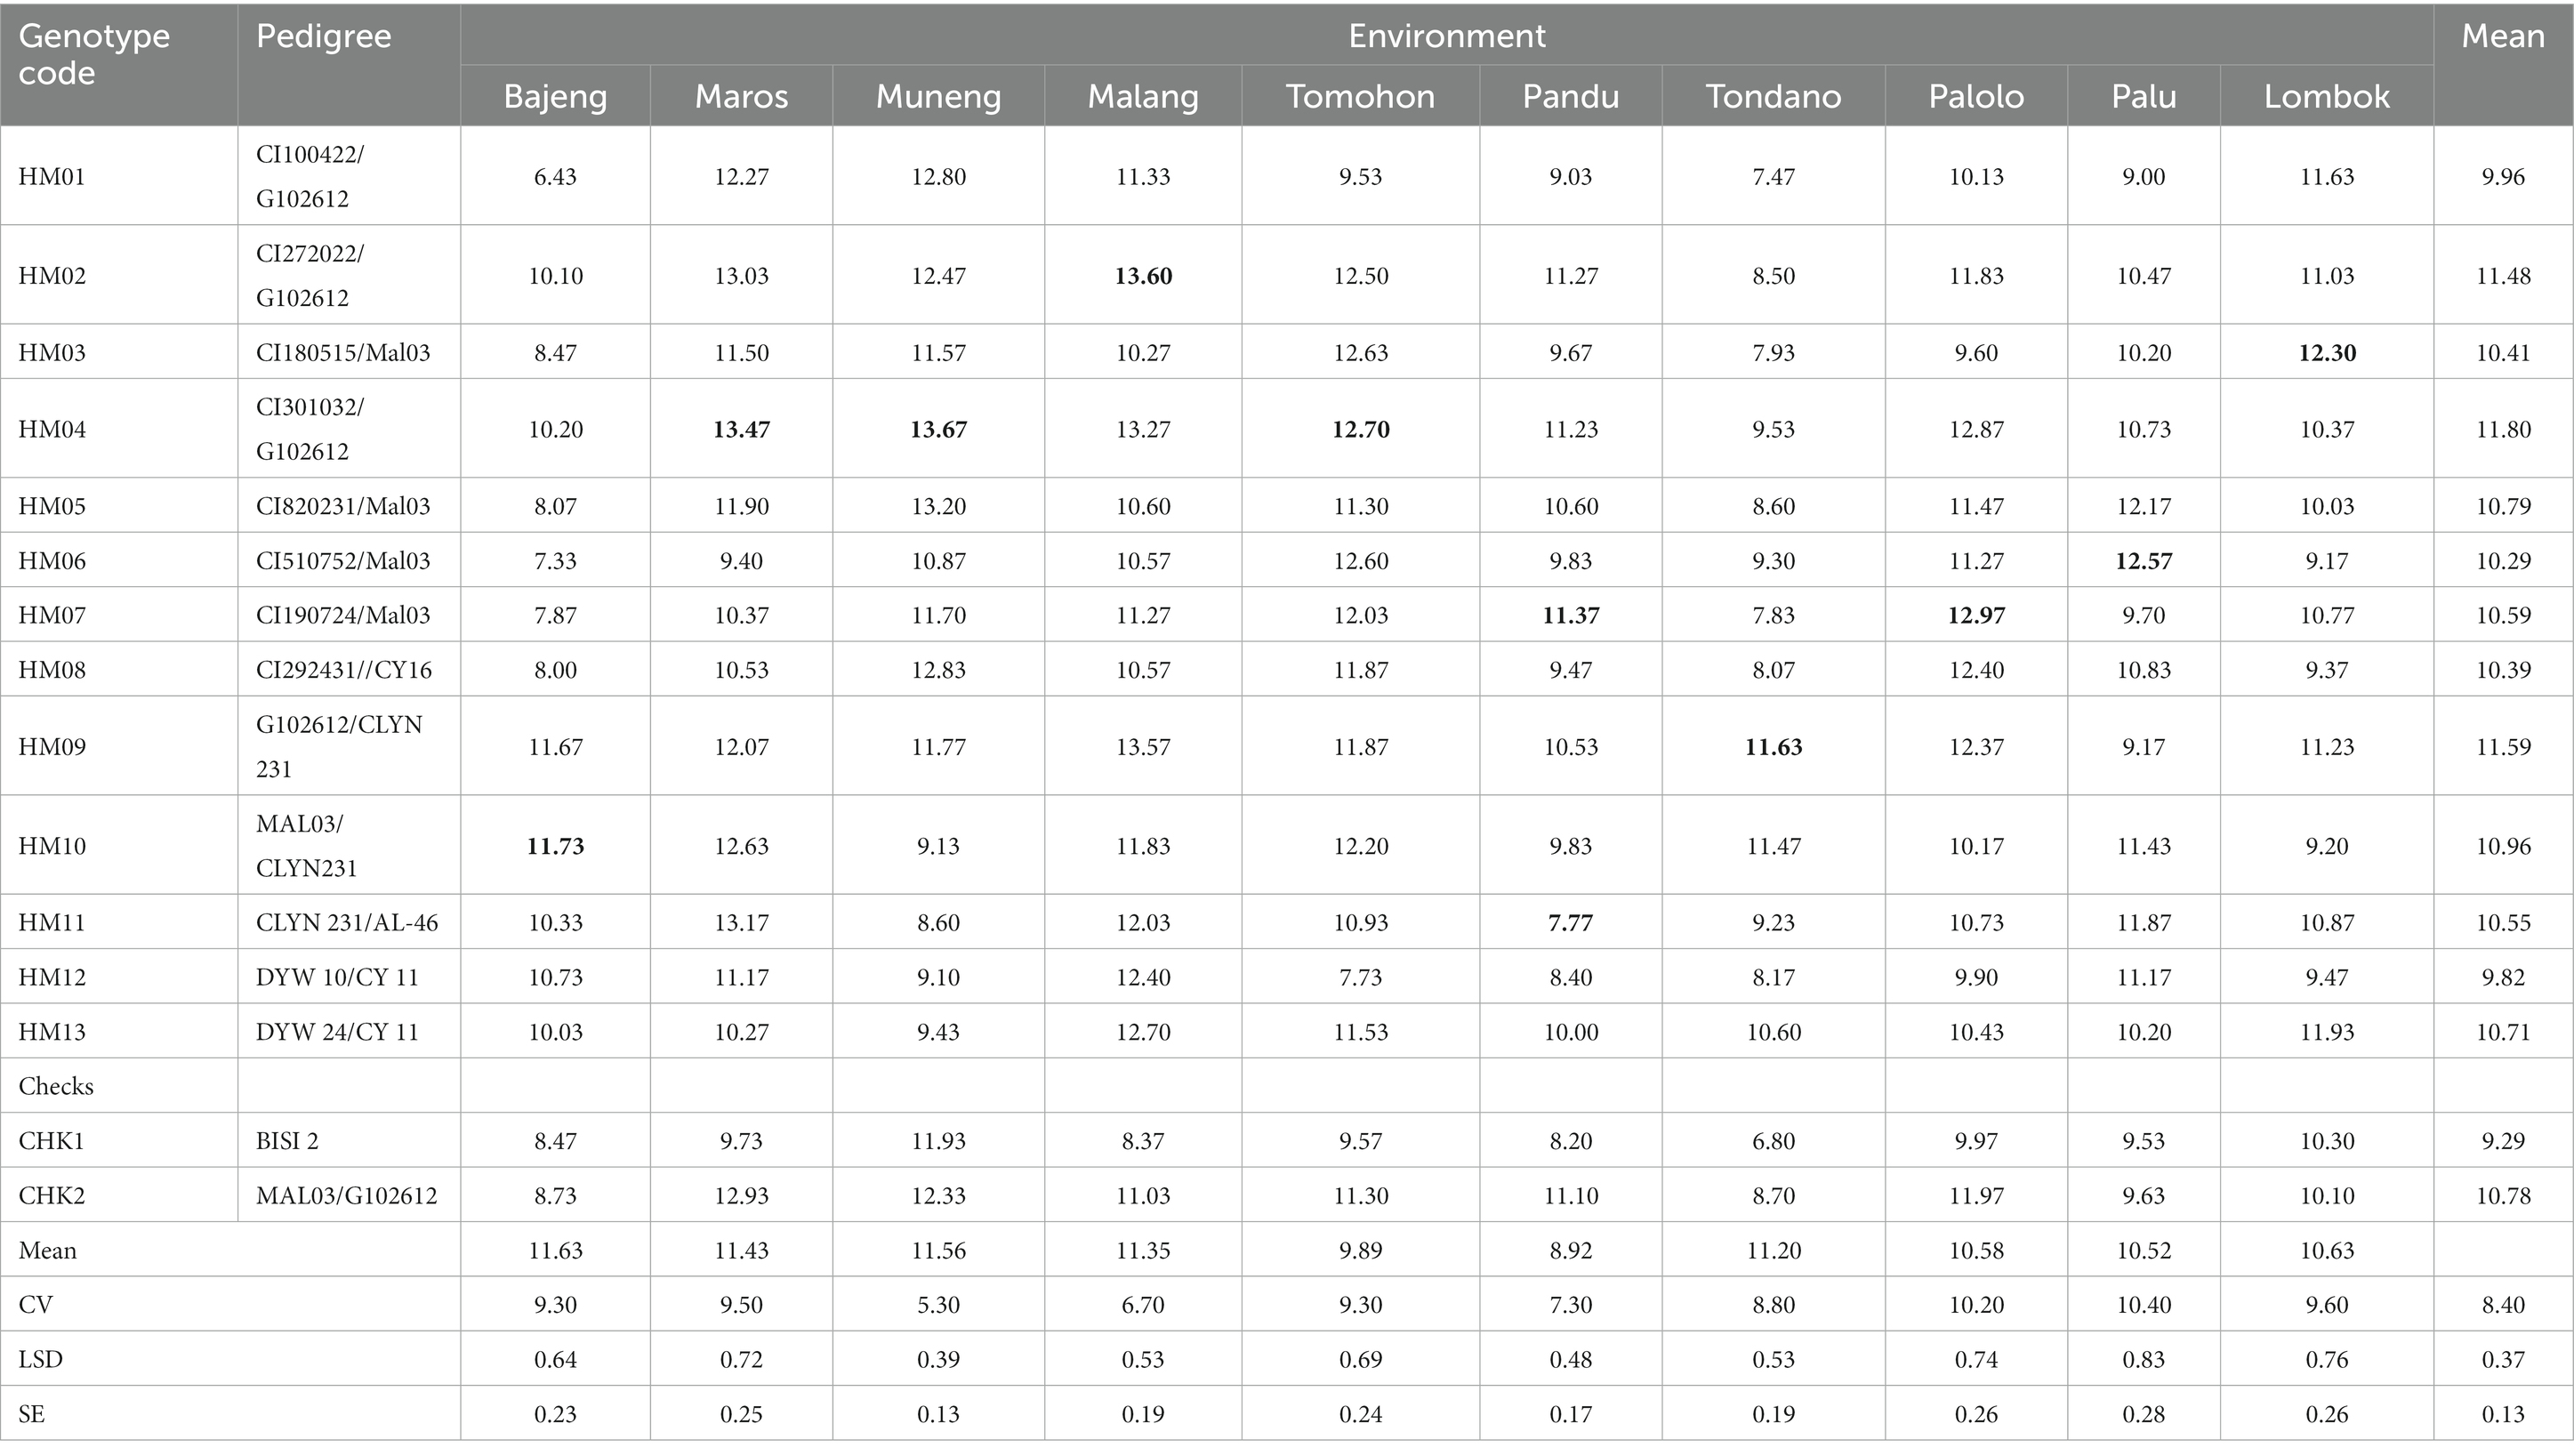
Table 3. Grain yield of 15 hybrid maize genotypes and two checks over 10 testing locations (2018–2020).
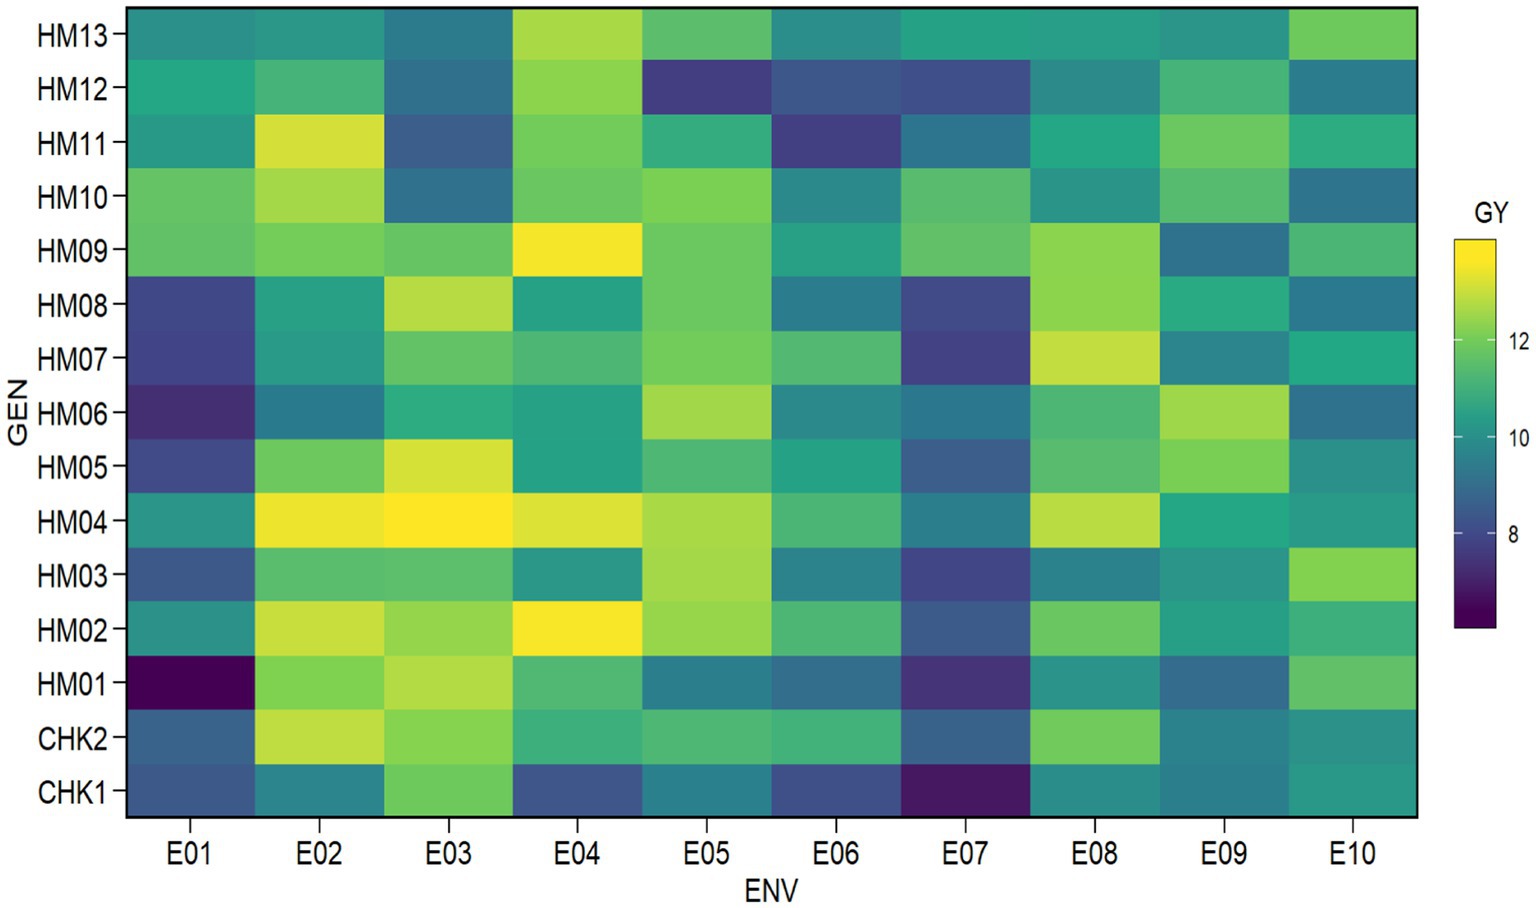
Figure 2. Genotype-versus-environment plot of 15 maize hybrids in 10 environments (2018–2020).
The average yields of the hybrids vary from 6.43 to 13.67 t ha−1 throughout the 10 sites, depending on the location. The genotype HM04 showed the highest grain yield across the different locations that were studied, with an average yield of 11.80 t ha−1. On the other hand, the genotype CHK1 had the lowest average grain yield, which was 9.29 t ha−1. This implies that the genetic material used in the experiment has some variability. There were also several hybrids that experienced a reduction in grain yield in medium and highland areas compared to low-land areas due to the impact of the Fusarium sp. fungal pathogen. The Fusarium sp. is known to flourish in areas of high humidity, particularly at middle and high elevations in Indonesia (ICERI, 2017).
The results of the analysis of variance, as presented in Table 4, indicate that the grain yield in hybrid maize genotypes is influenced by the factors of genotype (G), environment (E), and the interaction between genotype and environment (G × E). This was determined by analyzing both the additive main effects and the multiplicative interaction effects in the analysis of variance. The major effects of genotype and environment, as well as their interactions, were highly significant (p < 0.001). The statistically significant effects of genotype and environment on maize yields revealed that genetic diversity had a significant effect on the yield of maize, as well as the highly heterogeneous conditions of the 10 trial sites. Most of the variation is explained by the G × E interaction component (39.96%), followed by the environment component (28.68%), while the genotypic component (G) accounts for the least variation (13.58%). This suggests that the grain yield of the maize hybrids is highly influenced by the interaction between the genotypes and the environment, with the environment itself being the next largest factor, and the hybrid’s genetic makeup contributing the least to the variation. Thus, solely examining the genetic nature of the hybrid is not sufficient to determine its grain yield. The environment in which the hybrid is grown also has a substantial impact and must be considered. This interaction has a significant impact on various aspects of plant breeding, including the selection of testing environments, germplasm, and breeding strategies (de Leon et al., 2016). AMMI analysis indicated that the environment plays a key role in yield variability, indicating the presence of heterogeneous conditions. Related research has consistently shown that significant G × E interaction effects are common in multi-location trials of maize and rice production (Sitaresmi et al., 2019; Katsenios et al., 2021), aligning with the findings of (Mohammadi et al. (2017)).
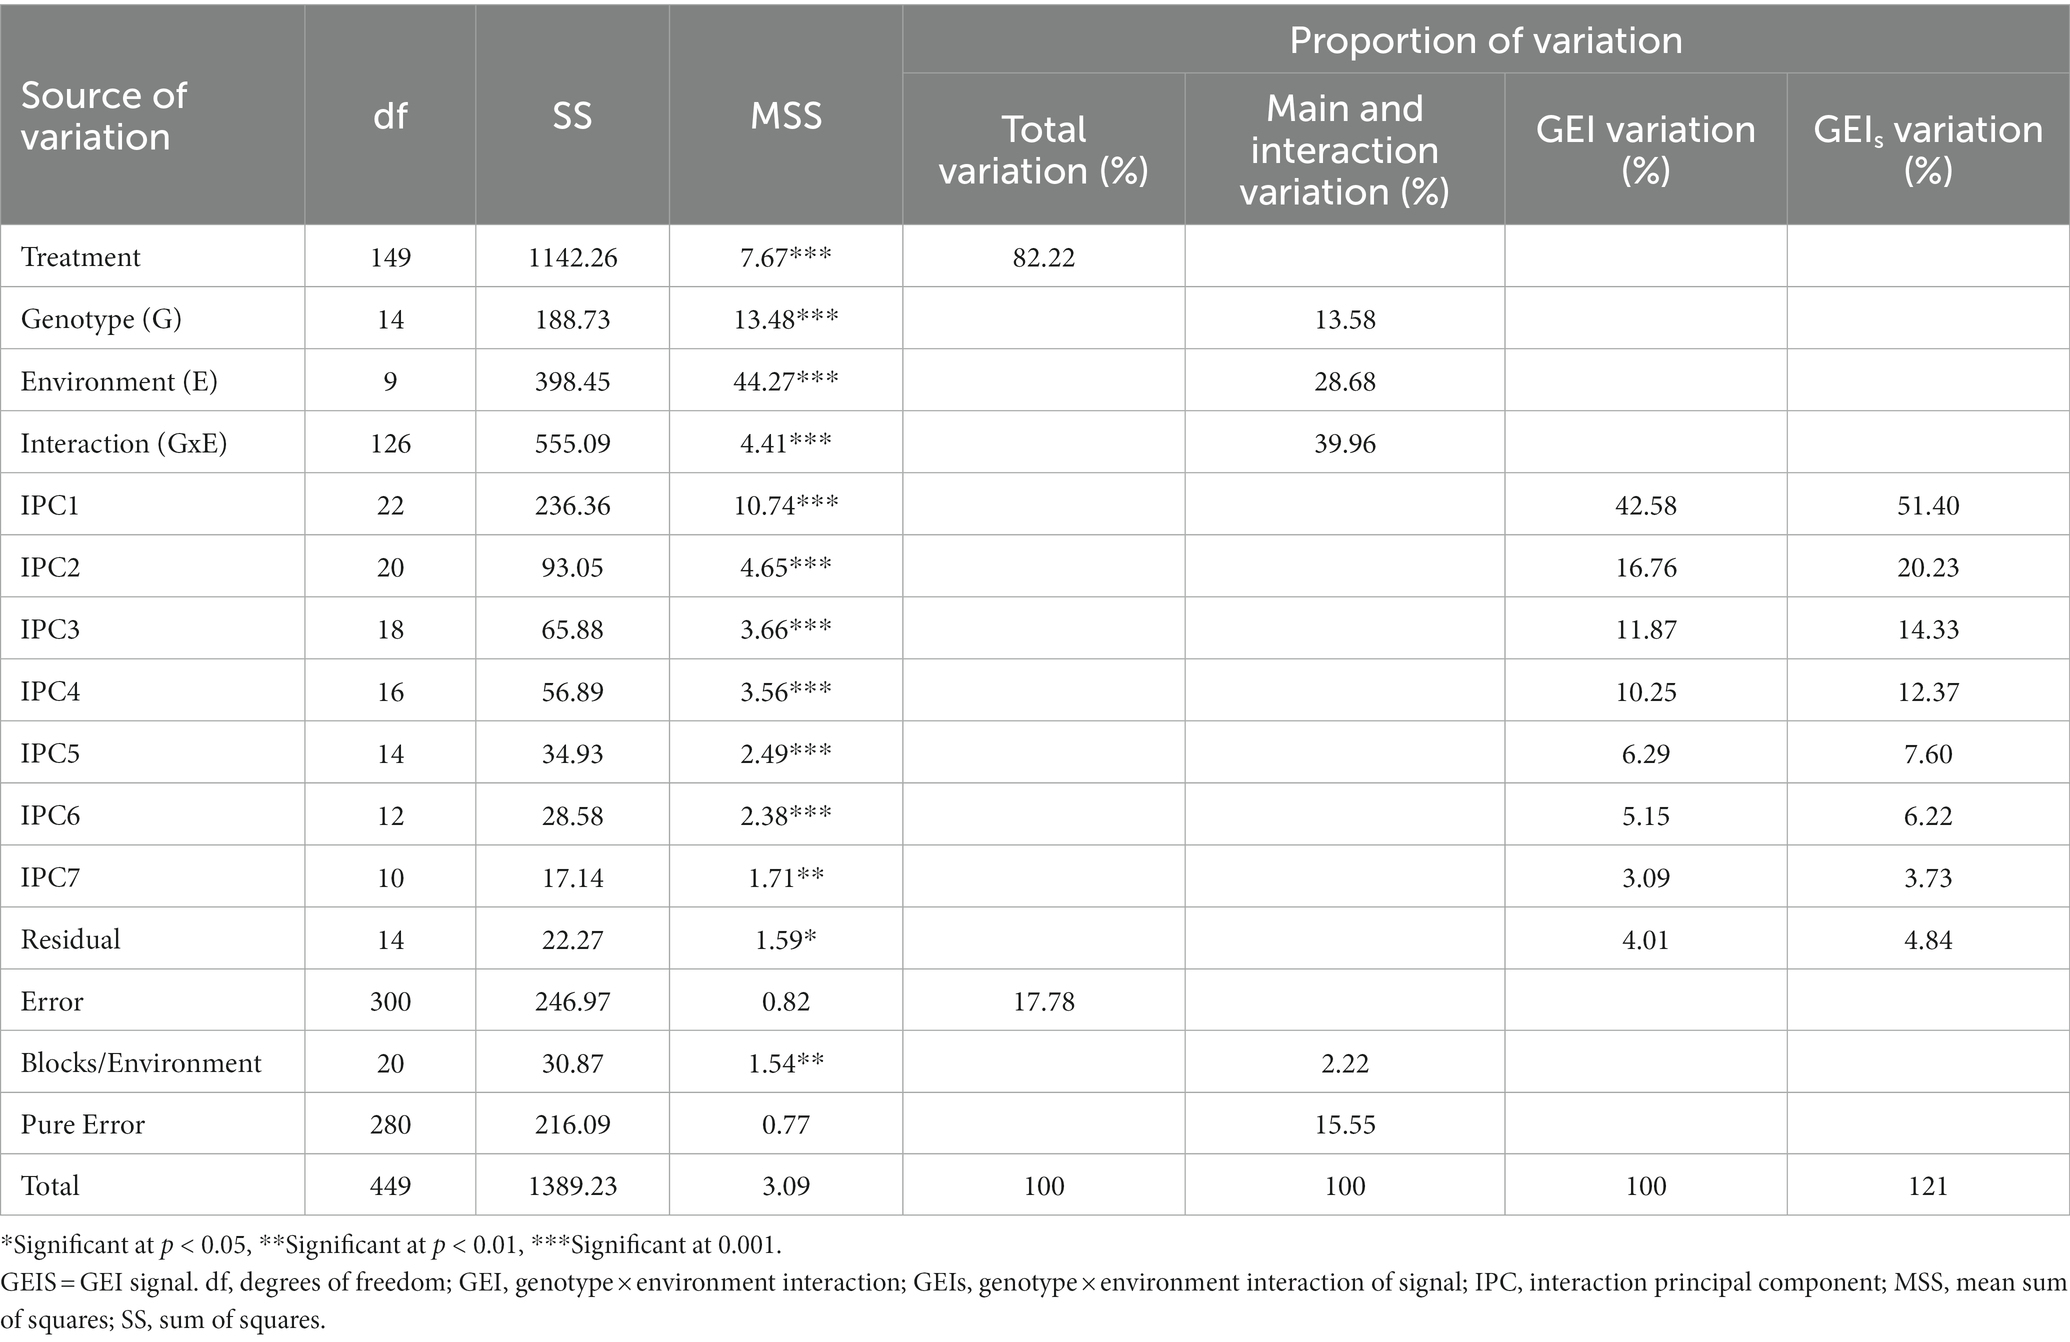
Table 4. Additive main effects and multiplicate interaction analysis of variance for grain yield in hybrid maize genotypes under distinct environments.
The analysis of variance (ANOVA) and model diagnosis revealed a statistical significance at p < 0.01 for the effects of grain yield, G, E, and GEI in diverse agroclimatic conditions, soil types, and observation years. The significance of these components was further demonstrated through the examination of seven partitioned interactions principal components (IPC1–IPC7). The results of model diagnosis indicate a clear correlation between the GEI effects and grain yields, highlighting the importance of considering GEI in maize yield predictions. It is important to use GEI as a diagnostic for assessing superior genotypes because the magnitude of GEI influences the stability of performance in a variety of conditions (Gauch, 2013). When GE interactions between genotypes and environments are substantial, dividing the experimental location into mega-environments might assist in achieving the objective of increasing yield. A comprehensive understanding of the effects of G, E, and GEI on diverse agroclimatic conditions, soil types, and observation years may assist the selection of genotypes best suited for specific conditions, leading to improved maize yields and productivity.
The AMMI grain yield stability model was applied to further analyze the G × E interactions. AMMI model involving PC1 and PC2 explained 42.58 and 16.76% of grain yield variations in hybrid maize varieties studied. Table 4 presents the seven principal component (PC) axes that have been found to be statistically significant at a level of p < 0.01. These PC axes have been included in the analysis due to their meaningful contribution to the overall results. While the first PC axis of G × E interaction described 42.58% of the sum of squares of G × E interaction, the seven PCs accounted for 96.0%. The AMMI model utilized in this study demonstrated a more dynamic association. The results clearly demonstrate that IPC1, IPC2, and IPC3 reflect the AMMI model families AMMI1, AMMI2, and AMMI3, respectively, representing 71.21% of the GEI variance and 85.96% of the GEIS collectively. The inclusion of IPC1, IPC2, and IPC3 in specific maize experiments has been reported to contribute to over 95% of the total genotype × environment interaction (Katsenios et al., 2021). Depending on the hybrid genetic and discrepancy of the environments selected, GEI variance can exhibit significant differences due to the effects of genotype, environment, and their interaction. Furthermore, assessing genotypes under varying soil and climate conditions has deepened the understanding of the complex interactions between genotypes and their environment, leading to enhanced breeding efficiency (Abate, 2020).
Model assessment is necessary to establish the optimal AMMI model family for maize yield based on sophisticated statistical concerns. Figure 3 depicts the AMMI biplot, which visualizes the variability of the principal additive effects of genotypes and environments, as well as the variability of the multiplicative effects of genotype-by-environment interaction (GEI). In the graph, the x-axis represents the average grain yield of maize genotypes, while the y-axis represents the difference in interaction effect (stability) between genotypes. Individual data points correspond to distinct genotypes, and the placement of each point represents the genotype’s average yield as well as its interaction effect. Genotypes that appear near each other in the graph tend to have comparable mean yields and interaction effects, while genotypes that appear farther apart tend to have divergent mean yields and/or interaction effects. In essence, genotypes that are clustered together exhibit similar behavior across different environments (Gauch and Moran, 2019).
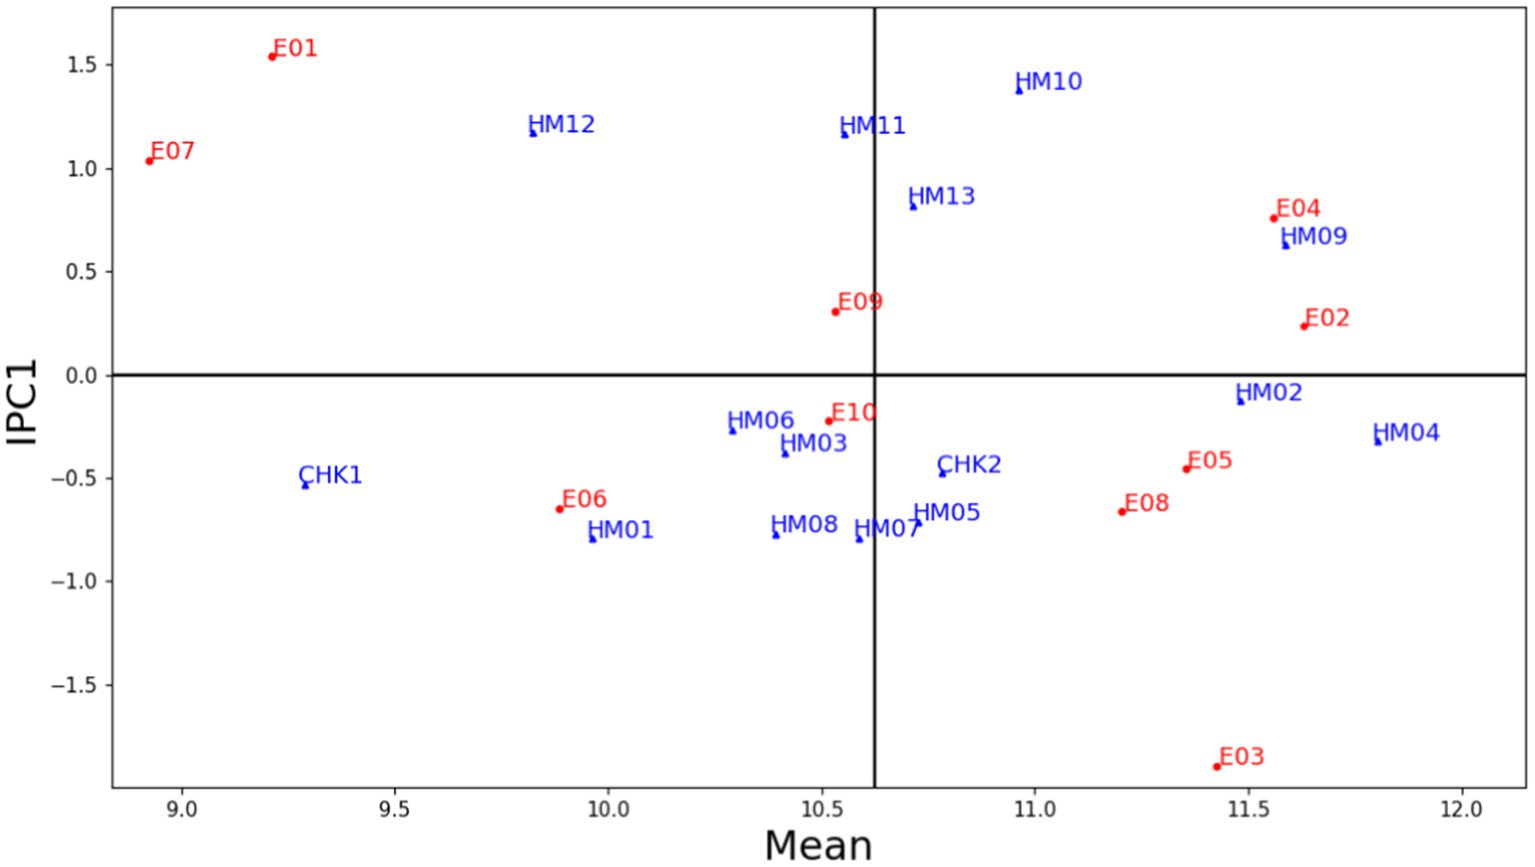
Figure 3. AMMI biplot presenting mean grain yield versus IPC1 of 15 genotypes tested in 10 environments (2018–2020).
The biplot of average grain yield and the first interaction principal component shows that HM04 had the highest mean grain yield (11.80 t ha−1), followed by HM09 (11.60 t ha−1), and HM02 (11.48 t ha−1). Furthermore, in terms of stability, the biplot indicates that HM02, HM06, HM04, HM03, and HM09 showed greater stability. However, the mean yield of HM06 and HM03 is lower than average, and, therefore, these genotypes should not be recommended. Among these genotypes, MH02 (CI272022/G102612) and MH04 (CI301032/G102612) could be highlighted. These genotypes had the highest mean yield and stability, exceeding the check varieties BISI 2 (CHK1) and NASA 29 (CHK2), which are among the most widely grown maize varieties throughout Indonesia. With an IPC score of 0.55 and a mean yield of 11.60 t ha−1, HM09 is also a promising candidate for further evaluation and development. The combination of the IPC score and good yield potential suggests that HM09 potentially exhibits both stability and productivity. Genotypes with lower IPC absolute values produce stable grain yields as compared with genotypes with higher absolute IPC values (Tarakanovas, 2006).
Figure 4 presents a biplot that showcases the interaction between 15 maize hybrids and 10 environmental conditions, as captured by the IPC1 and IPC2 scores of the AMMI model. The abscissa of the AMMI2 biplot represents the IPC1 values, which reflect the main effects of the genotypes and environments on the interaction. The ordinate of the biplot represents the IPC2 scores, which capture the multiplicative interactions between the genotypes and environments. Based on the AMMI biplot model of the yield response of 15 genotypes, IPC1 explained 42.58% of the total variation, whereas IPC2 explained 16.76% of the total variation. Their combined contribution to grain yield during multi-year trials conducted at 10 locations during the period 2018–2020 was 59.34%. It appeared from the analysis that the biplot of IPC1 and IPC2 accurately matched the data that was centered on the environment. Hongyu et al. (2014) reported that AMMI2 can help identify which genotypes perform best in specific environments. Genotypes in proximity to the biplot origin exhibit insensitivity to environmental interactive forces, whereas those further away from the origin are sensitive to environmental conditions and demonstrate substantial interactions. Furthermore, both genotypes and environments in close proximity exhibit comparable interaction patterns, while those farther apart exhibit dissimilar interaction patterns (Simon and Getachew, 2018).
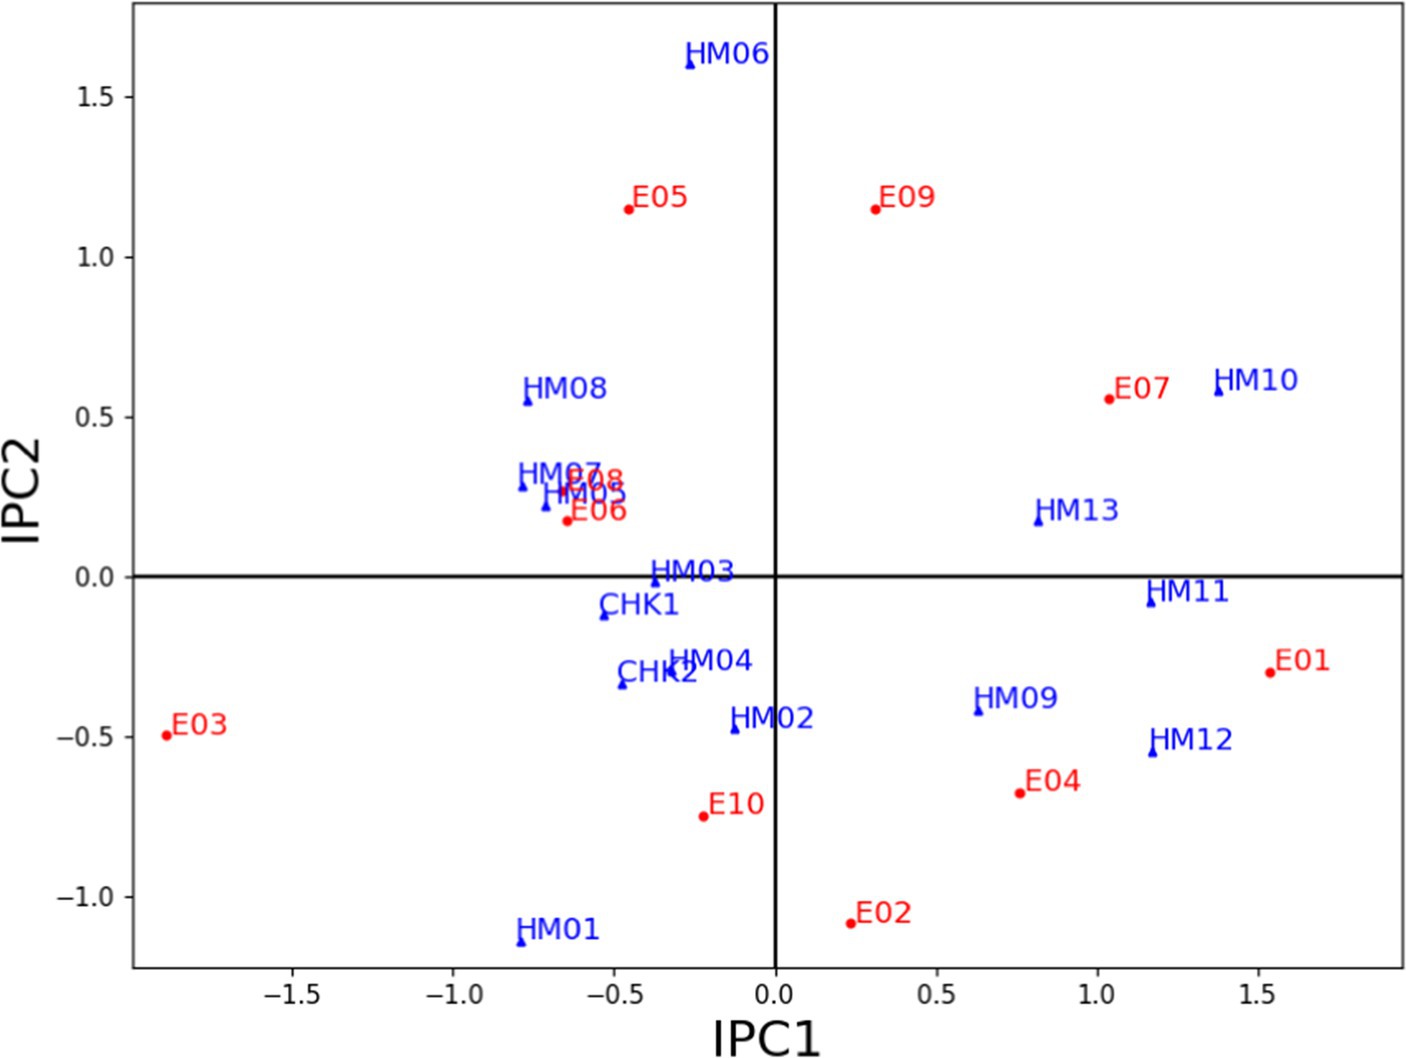
Figure 4. AMMI biplot showing IPC1 and IPC2 scores of 15 maize hybrids and 10 distinct environments (2018–2020).
3.1.2. Model diagnosis and hybrid selection
The diagnosis of the AMMI model comprises the evaluation of model stability and representativeness, which is performed through various diagnostic techniques and tools. Typically, the number of winners is linked to the complexity of the AMMI model, which includes greater sets of genotypes and trial sites. Table 5 indicates genotypes that are winners for grain yield attributes based on the AMMI model family. The genotype HM04 was winning in all AMMI model families, as well as in terms of the largest number of distinct environments, with 10, 5, 4, 4, 4, 4, 4, and 3 in the AMMI0, AMMI1, AMMI2, AMMI3, AMMI4, AMMI5, AMMI6, AMMI7, and AMMIF as the full model, respectively. The sum of squares (SS) for the genotype-by-environment (GE) interaction signal is 2.43 times larger than that for the genotype (G) main effect in our datasets, which highlights the importance of narrow adaptations for this dataset. Moreover, even considering IPC1 alone shows it is 1.25 times larger than the G main effect. It is also important to note that the GE noise is only 0.52 times the G main effects, and removing this noise may enhance the accuracy and repeatability of the results and simplifies the conclusions.
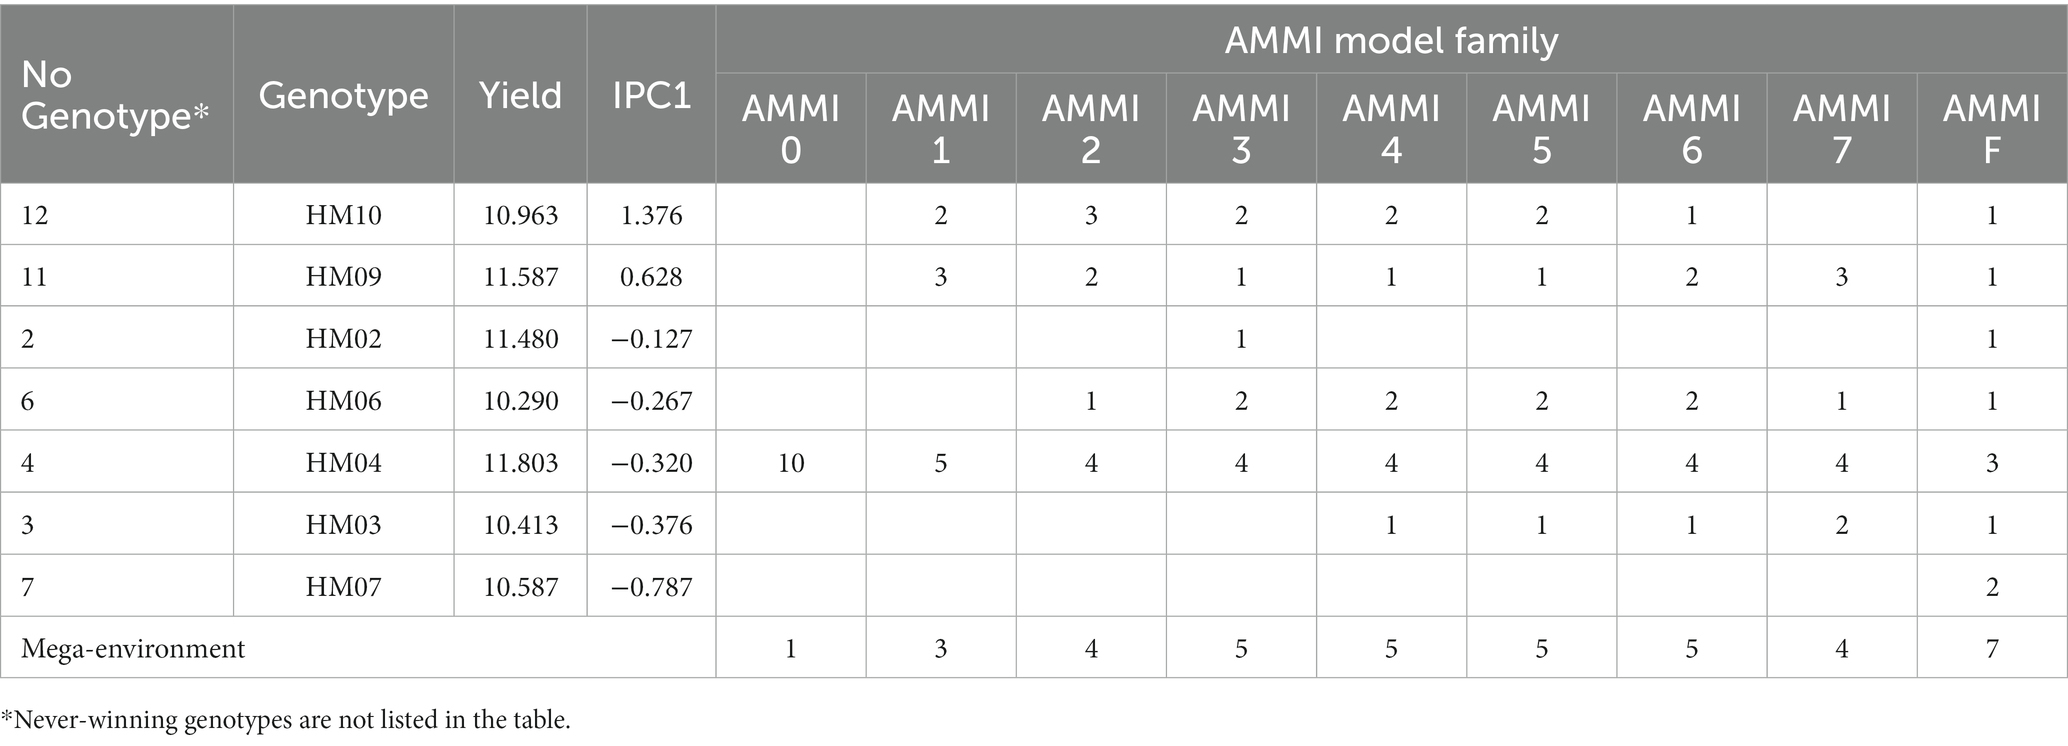
Table 5. Details of the “winner” genotypes and mega-environments in the additive main effects and multiplicative interaction (AMMI) model.
Figure 5 shows an AMMI1 model IPC1 mega-environment visualization with grain yield for 15 maize genotypes across 10 locations. A high IPC score and yield value is a good indication that genotypes with narrow adaptations are more likely than others to be unstable across the whole crop cycle; however, in a lot of instances, such genotypes are the best options for production under certain conditions (Mafouasson et al., 2018). The AMMI1 biplot graph, with the addition of horizontal lines, is designed to demonstrate the connection between the mega-environment and each genotype winner. Each winning genotype is represented by a unique horizontal strip, indicating its superiority in all environments contained within the strip. Hence, a horizontal strip represents a mega-environment. The genotype winner for the mega-environment that involves the IPC1 score of zero is considered the overall winner of the genotype yield. Hybrids HM04, HM09, and HM10 emerged as winners in five, three, and two environments respectively, as visually indicated in the graph.
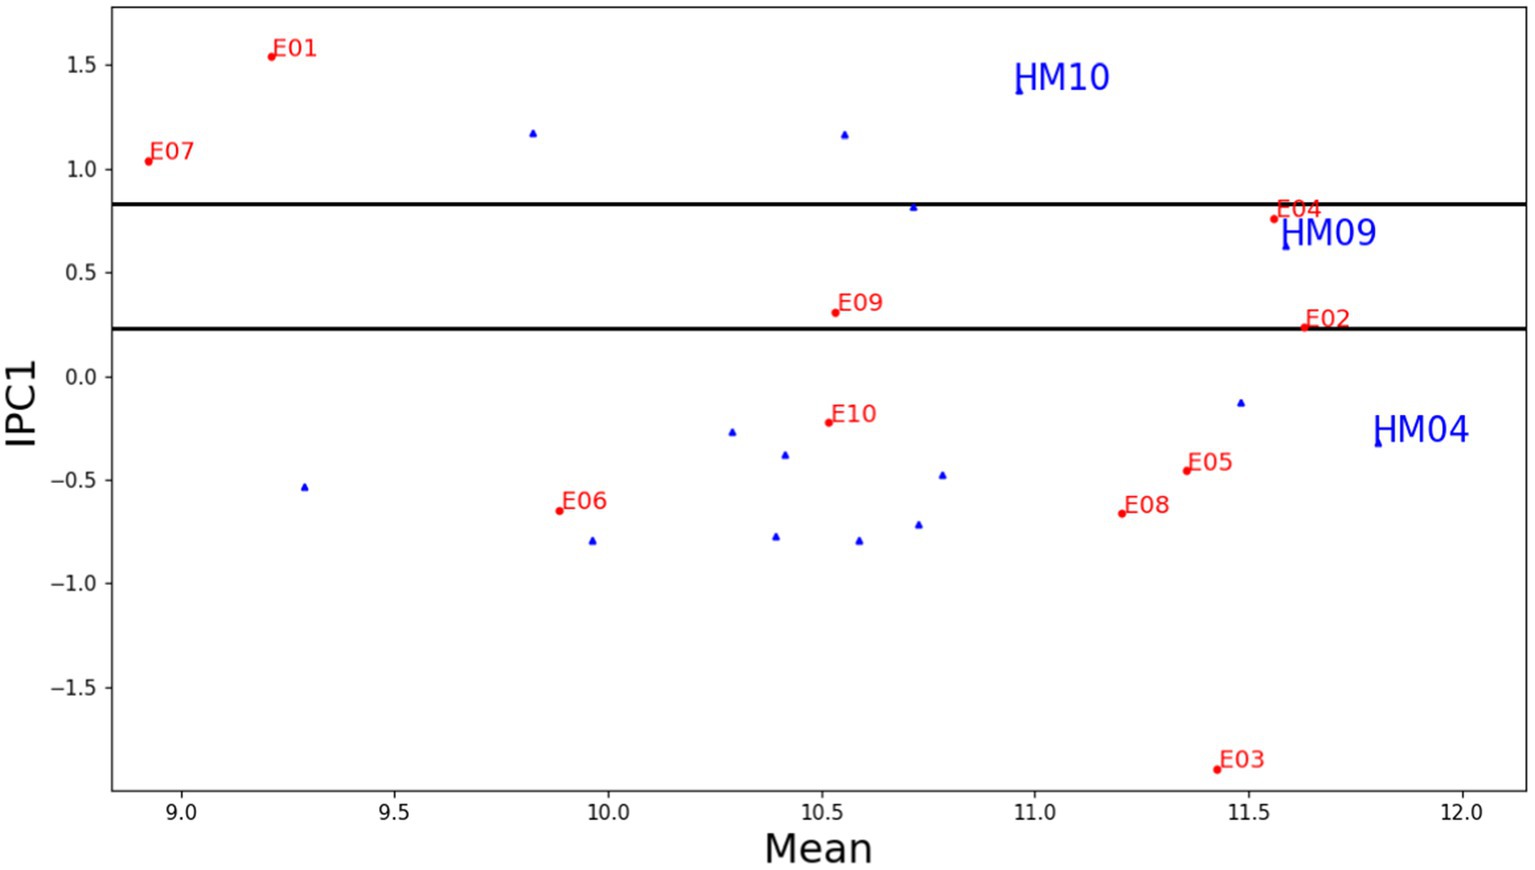
Figure 5. AMMI1 model IPC1 mega environment with grain yield for 15 maize genotypes and 10 locations (2018–2020).
A cross-validation procedure was applied to evaluate the predictive accuracy of the AMMI model. To assess the predictive accuracy of the AMMI model, a cross-validation procedure was implemented. The original dataset was divided into a training set containing two complete and randomly selected blocks per environment, and a validation set consisting of the remaining block per environment. Using the modeling data, n AMMI models were generated, and the optimal model was selected based on the root mean square prediction difference (RMSPD) between the model estimates and validation data models. The selection of the optimal model was based on the RMSPD between the estimates and the validation data models. A boxplot was utilized to present the distribution of the 1,000 RMSPD values for each model, as shown in Figure 6. Based on the RMSPD values, the AMMI model identified AMMI4 as the most accurate, with the lowest RMSPD value. This finding supports the hypothesis that unique GEI patterns are present across different locations.
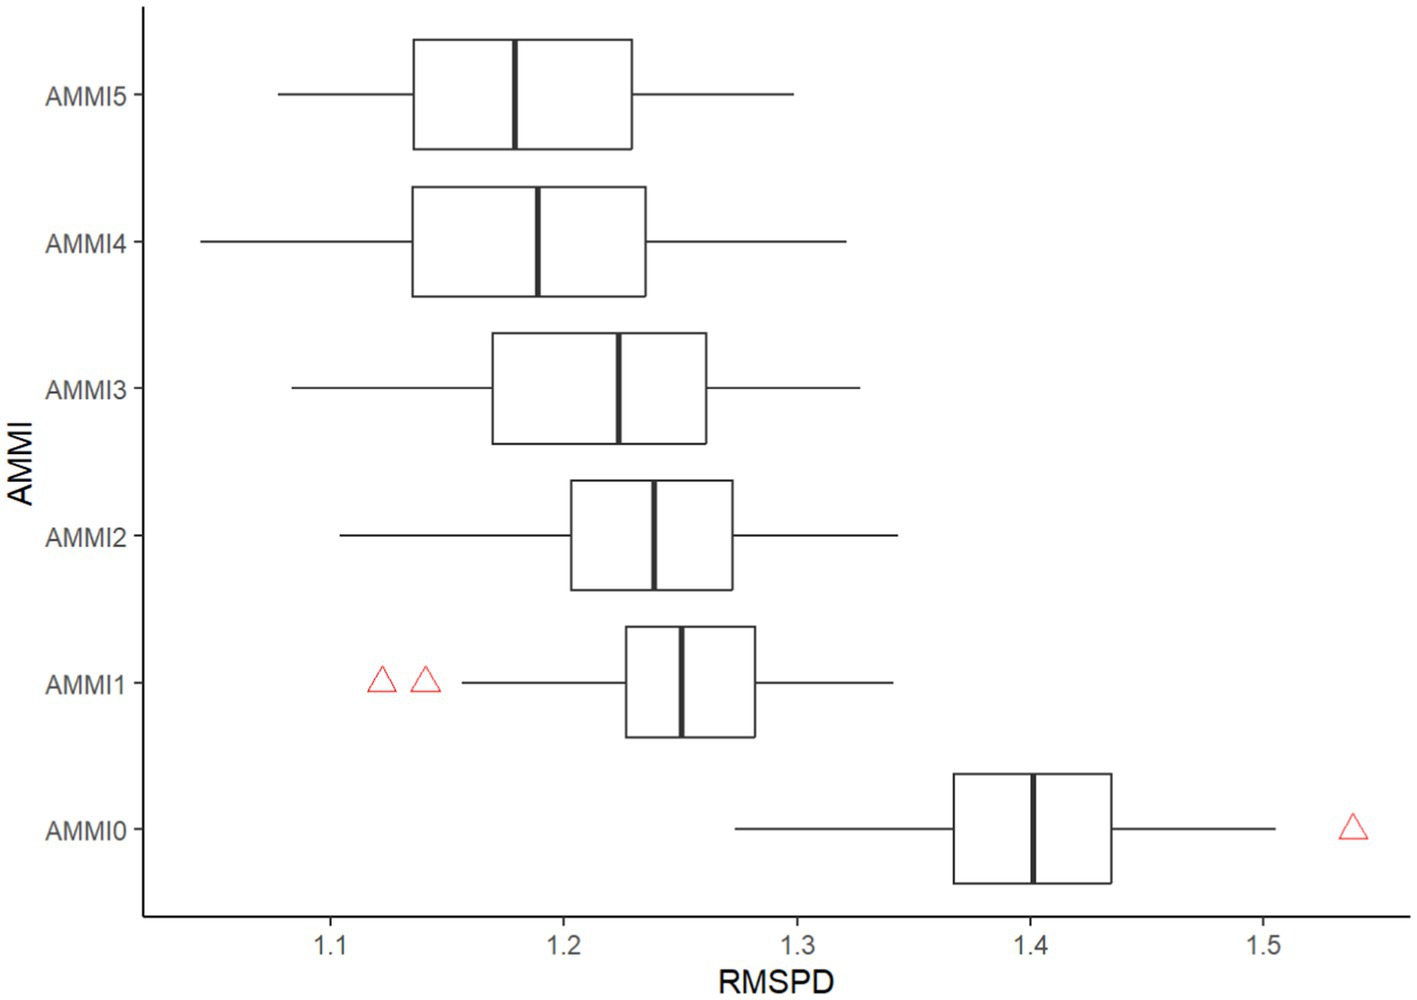
Figure 6. Boxplots representing the distribution of RMSPD estimates, highlighting the predictive accuracy of the AMMI family.
In this study, the SS for GE signal (GES) was estimated using a method proposed by Gauch (2013) as an alternative to cross-validation. This approach is computationally simple and has demonstrated high reliability. The amount of noise SS present in an interaction can be estimated as G × E df times Error MS. Considering this, the G × E SS comprises approximately 82.48% G × E Pattern, equivalent to 457.84, and 17.52% G × E noise, equivalent to 97.24. The G × E total is calculated to be 555.09. Given the significant amount of signal detected, the AMMI4 model is suggested. AMMI4 diagnosed five mega-environments and winning genotypes. These winning genotypes have been found to be the most predictive within their respective mega-environments when analyzed using the AMMI4 model family. However, since there is no consensus, parsimony favors the simpler AMMI4 for the current dataset, although AMMI7 also deserves consideration. Nonetheless, practical limitations necessitating fewer mega-environments may justify choosing a lower model such as AMMI1 model. Gauch (2006) found that either AMMI1 (RMSPD =1.25 t ha−1 and SD = 0.04) or AMMI2 (RMSPD =1.23 t ha−1 and SD = 0.05) are typically the most accurate models due to their ability to perform differently on a given dataset. However, the current study identified AMMI4 as the most accurate (RMSPD =1.18 t ha−1 and SD = 0.06). Despite AMMI4 outperforming AMMI1 in terms of accuracy, AMMI1 is still significantly more accurate than the raw data model AMMIF. Therefore, for delineating mega-environments, AMMI1 is the most suitable and practical, while AMMI4 is recommended for optimizing predictive accuracy and AMMIF is used to represent the raw data.
By selecting the AMMI1 model, three mega-environments were subsequently identified by grouping 10 test environments together. The first mega-environment (ME-1) included two environments, i.e., E01 (IPC1 = 1.54, ratio = 1.179) and E07 (IPC1 = 1.04, ratio = 1.0944), the second mega-environment (ME-2) included three environments, i.e., E04 (IPC1 = 0.76, ratio = 1.0405), E09 (IPC1 = 0.31, ratio = 1.0066), and E02 (IPC1 = 0.24, ratio = 1.00006) and the third mega-environment (ME-3) included five environments, i.e., E10 (IPC1 = −0.22), E05 (IPC1 = −0.46), E06 (IPC1 = −0.65), E08 (IPC1 = −0.66), and E03 (IPC1 = −1.89). All environments included in the ME-3 have a ratio value of 1. The AMMI1 model showed that the hybrid HM04 performed the best out of all the genotypes in five different environments (ME-3), coming in as the top performer (Table 6). The second-best performer was hybrid HM02, which was the winner in four environments. HM07 won a single environment, namely Muneng, Probolinggo, East Java (E03). In the ME-1 mega-environment, the genotypes HM10, HM09, and HM11 were ranked in the top three positions, with HM10 ranking first, while genotypes HM09 and HM11 were ranked second and third, respectively. Similarly, in the ME-2 mega-environment, genotype HM09 was ranked in the first position. It is worth noting that a genotype’s ranking among mega-environment may vary depending on the specific environmental conditions that existed. In contrast, genotype HM04 was ranked second in the E09 and E02 environments and ranked third in the E04 environment. Similarly, genotype HM10 was ranked second in the E04 environment, and genotype HM02 was ranked third in the E09 and E02 environments of the ME-2 mega-environment.
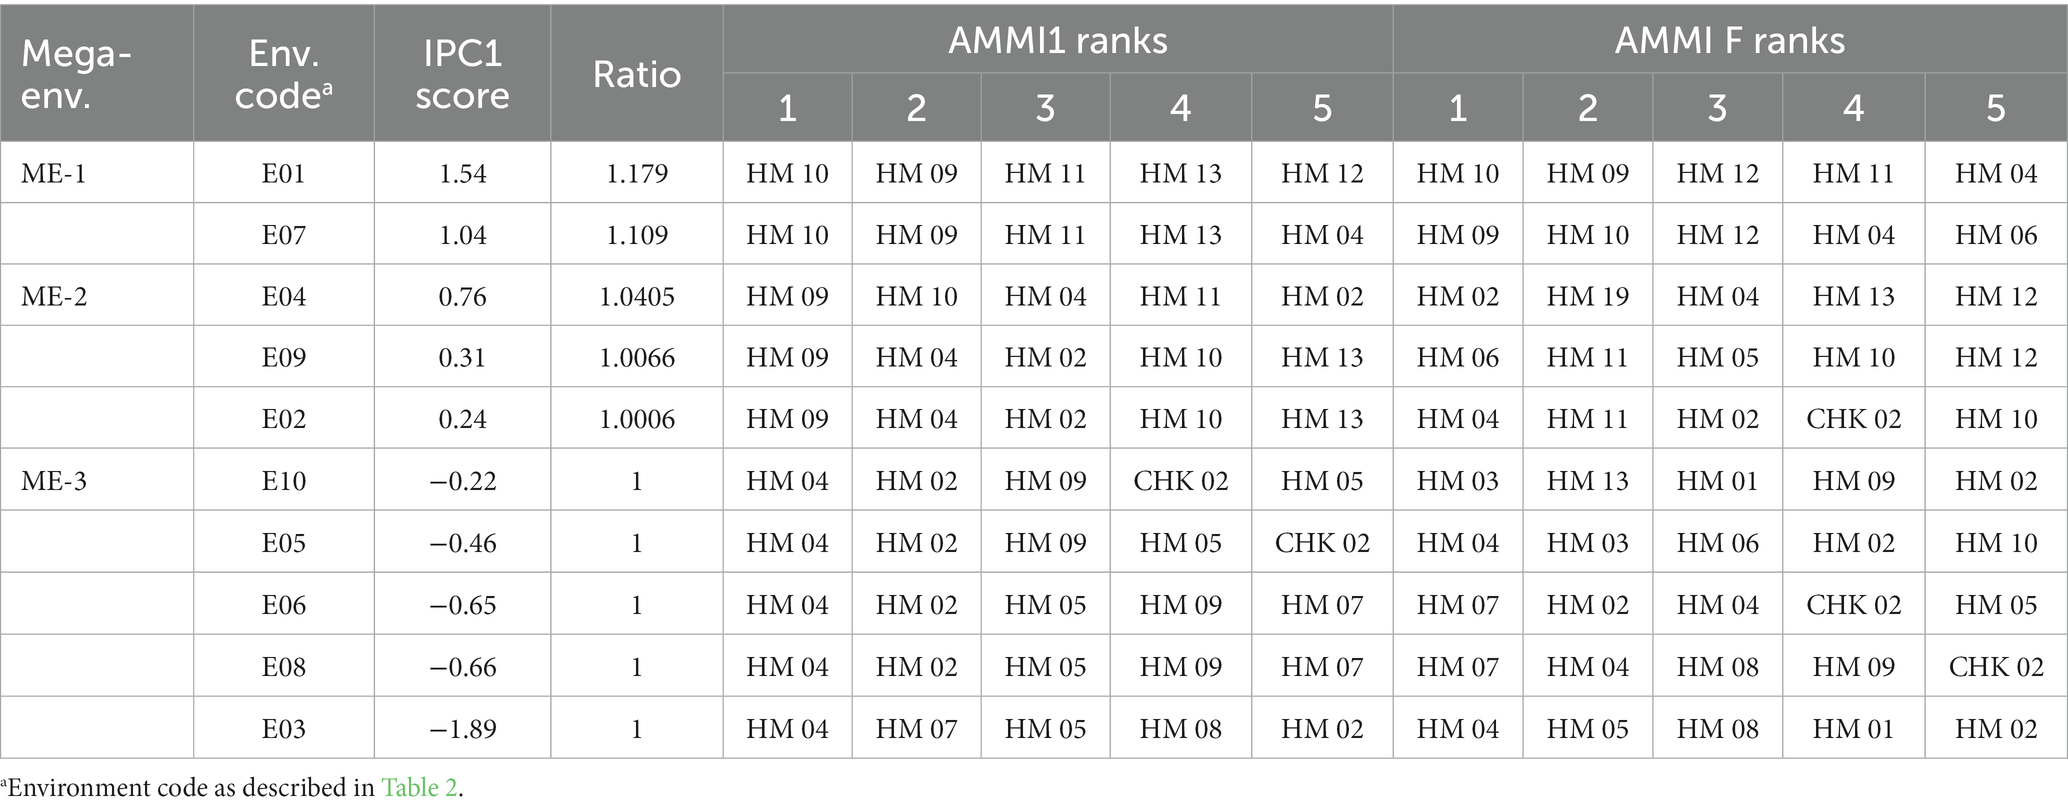
Table 6. Ranking table displays the top five genotypes for the 15-hybrid maize based on the AMMI1 and AMMIF model families.
In selecting or suggesting the best genotypes, the primary considerations are conducting the selection process within the context of the mega-environment scheme and using yield estimates based on treatment and experimental designs. Figure 6 shows adaptive responses for hybrid maize based on environment IPC1. To evaluate the importance of narrow adaptation caused by G × E interactions, a ratio of the yield of the winner in each environment divided by the overall winner’s yield can be used (Gauch, 2013). A ratio of 1 denotes a successful genotype across environments, while a ratio of ≥1.10 indicates considerable prospects for yield increases through narrow adaptation. However, adopting this approach may result in subdividing a growing region into multiple mega-environments. Thus, the genotypes that emerged as winners were HM04 and HM02, each with a ratio of 1, which makes them broadly suitable for diverse stress environments. On the other hand, hybrid HM10 displayed narrow adaptation to E01, with a predicted yield increment of 9.44%, and to E07, with a 17.90% yield increase over the winning genotype under broad adaptation. On average, HM10 triumphed in E01 and E07, providing a yield boost of 13.69%. The genotype HM09, which was a winner in the ME-2 scheme, provided a slightly lower yield increase in three environments, namely E02 with a 0.06% increase, E09 with a 0.66% increase, and E04 with a 4.05% increase. However, on average, HM09 performed well in E02, E04, and E09, with a combined yield increment of 1.60%. Bajeng (E1) and Muneng (E3) are two locations that exhibit the highest level of productivity, supported by the availability of permanent irrigation and drainage networks, enabling better control over crop maintenance procedures. On the other hand, the Pandu location (E6) experienced drought stress during the latter part of the generative phase, which significantly impacted crop yield. Two genotypes, HM04 and HM02 displayed high adaptability and stability across various mega-environments, whereas HM10 and HM09 were narrowly adapted to the ME-1 and ME-2 mega-environments (Figure 7).
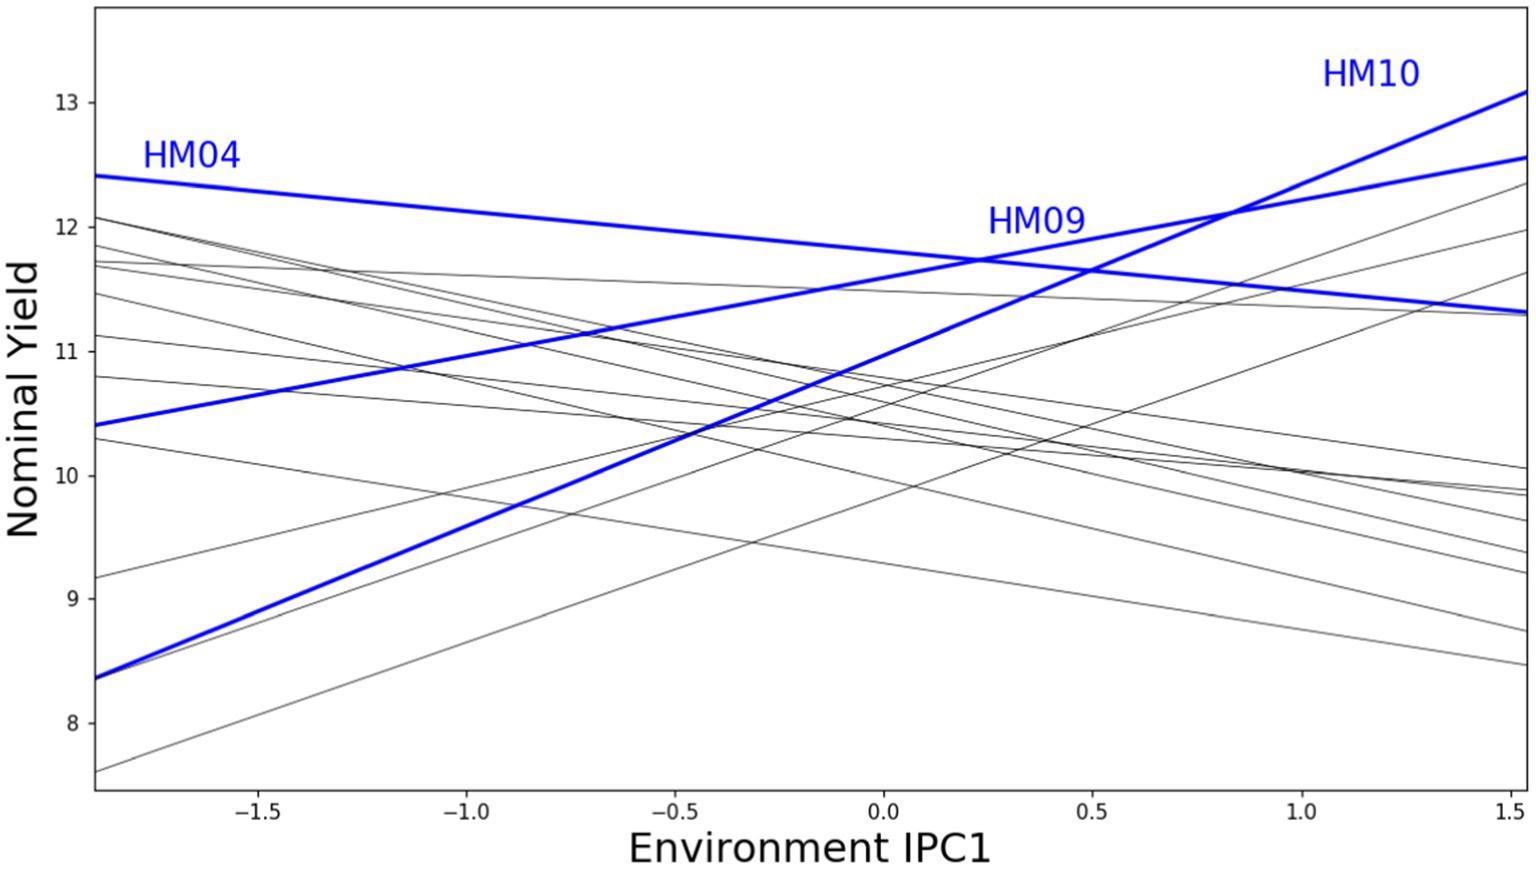
Figure 7. Adaptive responses for hybrid maize based on environment IPC1.
3.2. Genotype selection based on multiple traits using MGIDI
3.2.1. Phenotypic correlation among traits
A multiple traits approach was employed to select the most suitable hybrid pairs, taking into consideration not only grain yield (GY) but also agronomic and yield components, namely plant height (PH), ear diameter (ED), number of kernel rows (NRW), 1,000 kernel weight (1000KRN), ear length (EL), number of kernels per row (NKR), plant aspect (PA), days to maturity (MT), and shelling percentage (SP). The process of genotype selection involved a preliminary examination of traits that contribute to multicollinearity. A heatmap of correlation analyses conducted between 10 traits to identify the traits related to grain yield is shown in Figure 8. A significant positive correlation was found between grain yield and ear diameter (r = 0.31), number of kernels (r = 0.20), 1,000 kernel weight (r = 0.18) and ear length (r = 0.16) at p < 0.001. A greater ear diameter and length, along with an increased kernel weight, were expected to result in a substantial improvement in the overall grain yield. Furthermore, the number of kernels and the number of rows within the maize ear demonstrated a robust and statistically significant positive correlation with both ear length and diameter at a significant level of p < 0.001. Conversely, days to maturity and shelling percentage had weak relationships with grain yield, indicating their insignificant contribution to grain yield. Previous studies by (Li et al. (2021)) found positive correlations between 1,000 kernel weight and grain yield, which supports the findings of this study. Exploring the genetic relationships between different traits can enable the identification of potential targets for selective breeding, which can ultimately lead to the development of more desirable and high-yielding maize varieties (Olivoto and Nardino, 2021). Assessing correlations is essential in evaluating maize crosses as it enables the identification of positive selection impacts through the analysis of genetic and phenotypic correlations, resulting in more favorable outcomes.
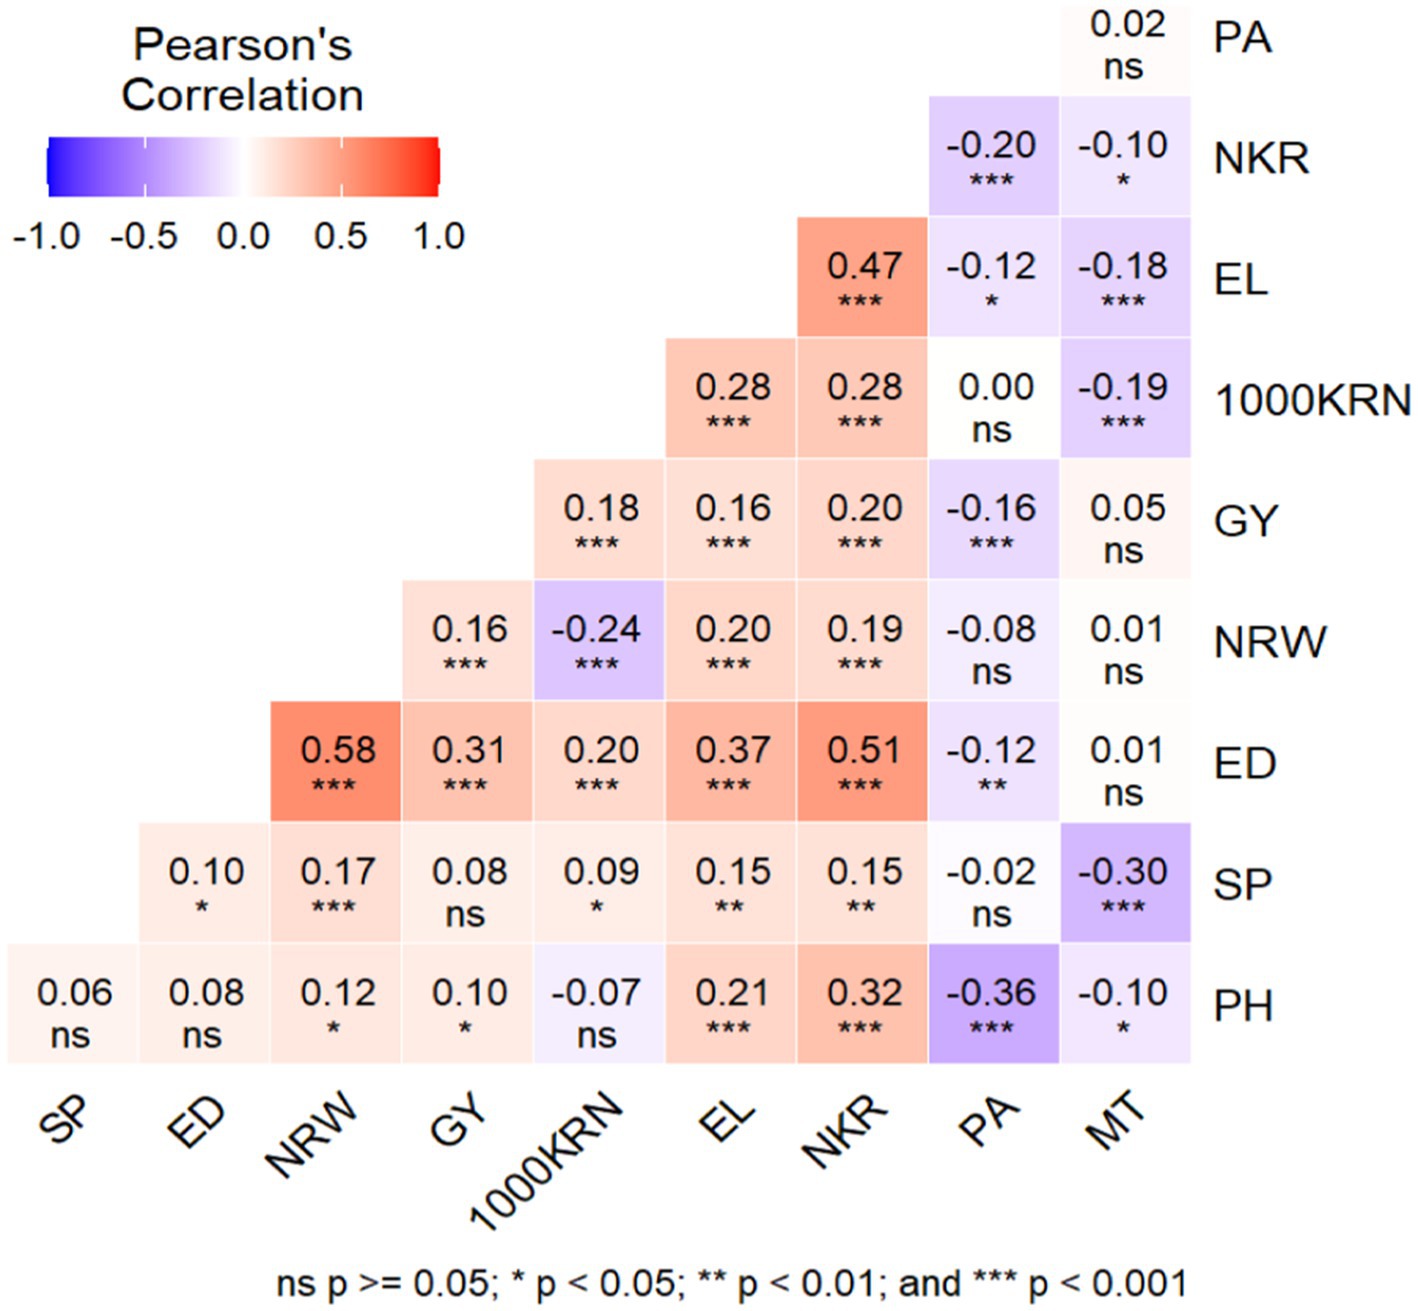
Figure 8. Correlations among traits of maize hybrids across 10 environments (2018–2020).
3.2.2. Factor analysis and selection gains
Analyzing the components that contribute to traits is a crucial step in genotype selection, which is essential for gaining insight into the evaluated multi location trials. The REML/BLUP models were employed to estimate variance components in a mixed-effects model with genotype treated as the random effect and replication as the fixed effect. The likelihood ratio test values indicated all analyzed traits showed a highly significant (p < 0.01) genotype effect. Further analysis of traits using REML/BLUP identified five principal components, which together accounted for 91.9% of the total variation. This suggests that the five principal components were successful in capturing a substantial amount of variability in the traits. Likewise, the communality values for the variables ranged from 0.54 for the number of kernels per row trait to 0.96 for the number of rows, with an average of 0.77. These values suggest that a significant portion of the variability of each variable was explained by these factors. The assessment of accuracy value for the mean trait value showed significant genetic variation among the genotypes used, as evidenced by an accuracy level >0.80. This high level of accuracy enables precise prediction of the genetic value of the trait. To maintain high interpretive strength and reduce the dimensionality of the data, the 10 studied traits were compiled into three factors (FA). Table 7 shows the factorial loadings and communalities obtained from the factor analysis using varimax rotation. FA1 is associated with plant height, grain yield, ear diameter, number of rows, and 1,000 kernel weight. FA2 represents ear length and number of kernels per row, while FA3 is associated with the plant aspect, days to maturity, and shelling percentage. Factor values reveal the degree to which each trait relates to the underlying factor, with higher loadings representing stronger associations.
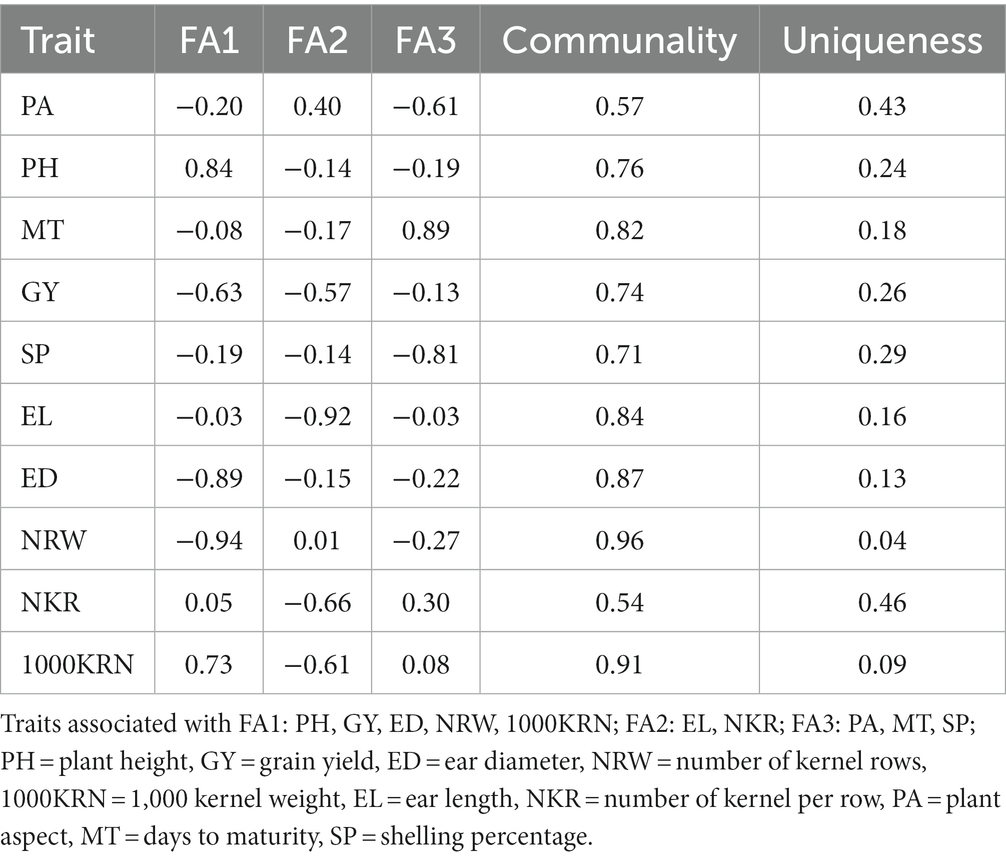
Table 7. Factorial loadings and communalities obtained from the factor analysis.
An orthogonal rotation was applied to the factor loadings, resulting in correlation coefficients ranging from −1 to +1. In the FA1 group, the traits with the highest positive correlations include plant height (0.84), and 1,000 kernel weight (0.73) while ear diameter (−0.89), number of rows (−0.94), and grain yield (−0.63) have negative correlations. On the other hand, for FA2, ear length (−0.92) and number of kernels per row (−0.66) have negative correlations. FA3 has a positive correlation with days to maturity (0.89) and negative correlations with shelling percentage (−0.81) and plant aspect (−0.61), indicating that they are strongly associated with this factor. Ear diameter, number of rows, grain yield and plant height also have negative but relatively low loadings on FA3, indicating weak negative correlations with this factor. This suggests that these variables are not strongly associated with this factor and may be more strongly associated with other factors in the analysis.
The multi-trait genotype-ideotype distance (MGIDI) index was utilized to select maize hybrids by considering all the measured traits. The process includes scaling the trait using BLUP for genotype mean performance, calculating factor analysis, and determining the distance of each genotype from the ideotype. By utilizing a two-way table as input data and enabling the ranking of rows based on desired outcomes in columns, offering an effective means of evaluating selected genotypes’ strengths and weaknesses. Furthermore, with the ability to evaluate multiple dependent traits, it proves to be a valuable tool in such assessments. The predicted genetic gain for effective traits in the MGIDI index is presented in Table 8. Results indicated a higher genetic gain percentage for major measured traits, such as 1,000 kernel weight, grain yield, number of kernel rows and ear length. The estimates of heritability on the entry-mean basis ranged from 0.65 for plant aspect to 0.96 for number of kernel rows, which were high for all filtered traits. This suggests that there are good prospects of selection gains for these traits. The selected traits with the highest genetic gains were 1,000 kernel weight (7.29%), grain yield (4.05%), number of kernel rows (2.41%), and ear length (2.23%). The plant height trait showed a decreased selection gain of −1.51%. Andayani et al. (2018) reported that although higher plant height may accelerate the growth of the ear, excessive height may have negative consequences on plant stability and productivity. In addition, taller maize plants are positively correlated with an increased risk of lodging, especially in regions with heavy rain and wind, such as equatorial areas.
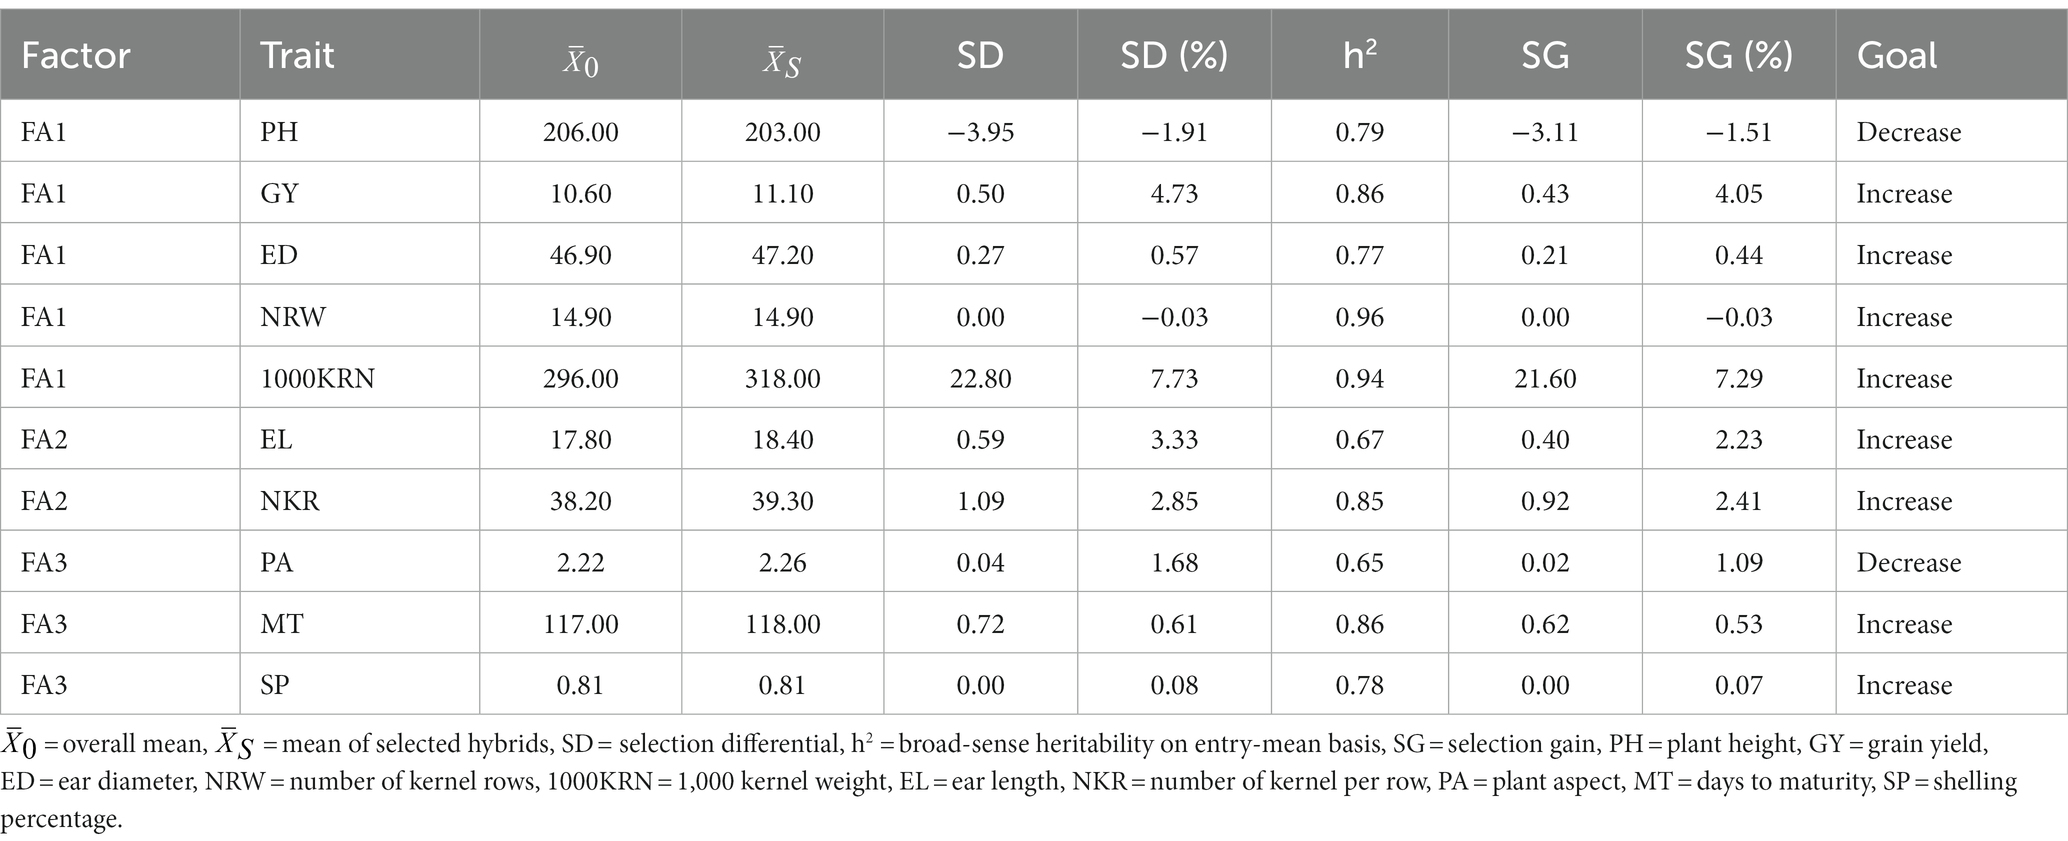
Table 8. Predicted genetic gain for the effective traits in the MGIDI index.
Figure 9 presents a concise visual representation of the rankings of genotypes according to their MGIDI index values, and highlights selected genotypes based on the given selection criteria. Out of all the genotypes, HM04 and HM02 were selected and highlighted in red, indicating their significant performances. Additionally, two other genotypes, CHK02 and HM08, were also ranked among the top four best genotypes based on their performance across multiple traits. These genotypes possess favorable characteristics for the given traits, making them suitable for the study or the desired purpose. However, although there is a strong association between genotype properties and trait values, the expression of high trait values may be restricted by environmental factors (Al-Ashkar et al., 2022). MGIDI index offered a perspective on the strengths and weaknesses of different genotypes that made it simple to identify both their advantages and limitations based on a multiple trait framework (Olivoto and Nardino, 2021).
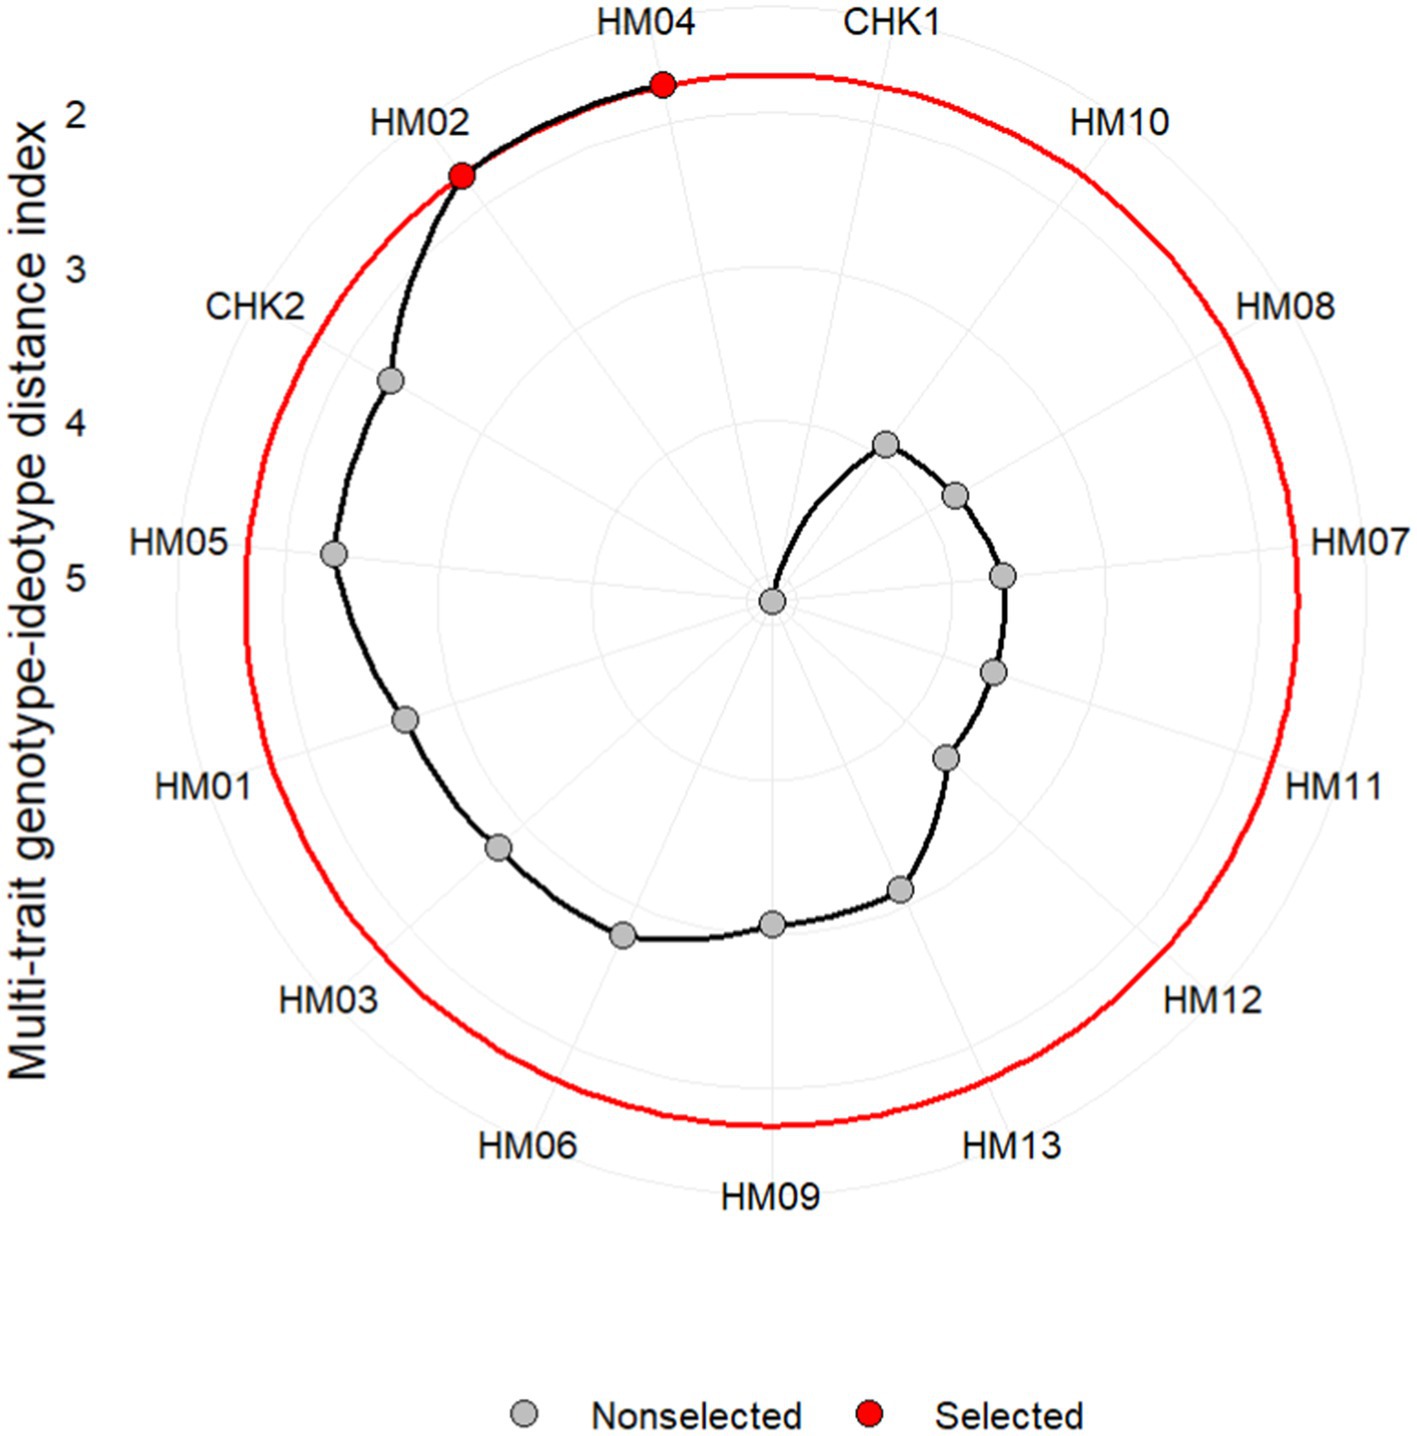
Figure 9. Genotype ranking for MGIDI index with highlighted selection in red and cut point.
3.2.3. Strengths and weakness of hybrids
Figure 10 depicts the strengths and weaknesses of the genotype, categorizing the contribution of factors toward MGIDI into three major categories. Factors with a greater contribution are plotted closer to the center, while those with a lesser contribution are plotted toward the edge. The information provided by these contributions can aid in the selection of appropriate parent contributors in crossbreeding programs. FA1 had the lowest effect on hybrids HM02 and HM04, indicating that these hybrids were good performers for most FA1-associated traits, namely PH, GY, ED, NRW, and 1000KRN. FA2 had a smaller effect on genotypes HM02, CHK2, and HM04, indicating that these three genotypes have strengths in EL and/or NKR. Finally, FA3 had a lower impact on the HM05 hybrid, suggesting that this hybrid performed well for most of the FA3-correlated traits, namely the PA, MT, and SP. The ranking of selected genotypes based on their combinations of multiple traits has revealed that hybrids HM04 (CI301032/G102612) and HM02 (CI272022/G102612) are the two highest performing. By using the multiple trait combination index as a tool to assess the performance of these hybrids, researchers were able to select genotypes that are close to the ideotype. Yan and Frégeau-Reid (2018) suggest that the evaluation of a genotype’s superiority should not be based solely on its individual trait levels but rather on its ability to combine yield with other target traits.
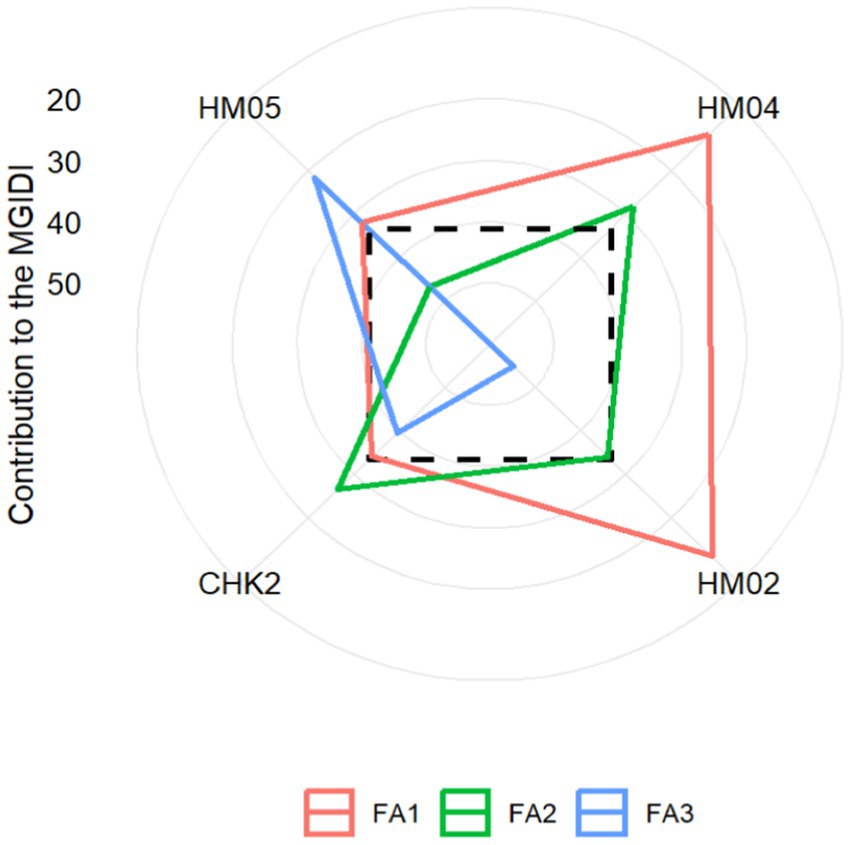
Figure 10. Strengths and weaknesses of selected genotypes demonstrated in proportional view of MGIDI index.
In this study, both the AMMI and MGIDI models were found to be effective in selecting superior maize hybrids well-suited to the equatorial climate. The analysis revealed that both AMMI and MGIDI models demonstrated that the HM04 and HM02 hybrids exhibited high adaptability and stability across various environments, with maximum grain yields of 11.803 and 11.480 t ha−1, respectively. These yields were significantly higher than the grand mean yield of 10.620 t ha−1. The AMMI model further identified HM10 and HM09 as the best-suited hybrids for specific environments, suggesting that these hybrids possess specific traits that make them better adapted to certain conditions. For instance, HM10 (MAL03/CLYN231) and HM09 (G102612/CLYN231) were found to be narrowly adapted to the ME-1 and ME-2 mega-environments, indicating their suitability for these specific environments.
The factor analysis of the MGIDI model showed that FA2 had a lower impact on the CHK2 hybrid, while FA3 had a lower impact on the HM05 hybrid. This suggests that the hybrid candidate HM05 possesses favorable traits, specifically in relation to plant aspect and shelling percentage. The integration of both models has proven valuable in identifying the most effective traits for each genotype, enabling stakeholders to select desired traits while considering their strengths and weaknesses. The models’ comprehensive data interaction analysis can streamline the process of selecting desirable genotypes in multi-environment plant breeding programs.
4. Conclusion
The study demonstrated the advantage of AMMI and MGIDI models for selecting superior maize hybrids well-suited to the equatorial climate. Both models identified the HM04 and HM02 hybrids as displaying high adaptability and stability across different environments, with AMMI additionally identifying HM10 and HM09 as best suited for specific environments. HM04 and HM02 displayed high adaptability and stability across various environments, with maximum grain yields of 11.803 and 11.480 t ha−1, respectively, which were significantly higher than the grand mean yield of 10.620 t ha−1. The integration of AMMI and MGIDI models has proven valuable in identifying the most effective traits for each genotype, allowing stakeholders to select desired traits while taking into account their strengths and weaknesses. Overall, these models can provide a comprehensive data interaction analysis and streamline the process of selecting desirable genotypes in multi-environment plant breeding programs.
Data availability statement
The datasets presented in this article are not readily available because they may be used in future meta-analysis studies. Requests to access the datasets should be directed to azrai@agri.unhas.ac.id.
Author contributions
All authors listed have made a substantial, direct, and intellectual contribution to the work and approved it for publication.
Funding
The authors would like to express their gratitude to the Ministry of Research and Technology/National Research and Innovation Agency of the Republic of Indonesia (BRIN) for funding research support under this National Research Priority Grant Program in 2020 (Contract number: 16/E1/PRN/2020) and to the Indonesian Agency for Agricultural Research and Development, Ministry of Agriculture, Indonesia, for funding research support in 2019 (Contract number: SP DIPA-018.09.2.238080/20117-2020). The publication of this work was supported by Hasanuddin University.
Acknowledgments
The research was conducted with the assistance of various genetic materials provided by CIMMYT Mexico. Thanks to the support provided by the technicians from Bajeng Experimental Station in Indonesia for this project.
Conflict of interest
The authors declare that the research was conducted in the absence of any commercial or financial relationships that could be construed as a potential conflict of interest.
Publisher’s note
All claims expressed in this article are solely those of the authors and do not necessarily represent those of their affiliated organizations, or those of the publisher, the editors and the reviewers. Any product that may be evaluated in this article, or claim that may be made by its manufacturer, is not guaranteed or endorsed by the publisher.
References
Abate, M. (2020). Genotype by environment interaction and yield stability analysis of open pollinated maize varieties using AMMI model in Afar regional state, Ethiopia. J. Plant Breed. Crop Sci. 12, 8–15. doi: 10.5897/JPBCS2019.0839
Ajay, B. C., Bera, S. K., Singh, A. L., Kumar, N., Gangadhar, K., and Kona, P. (2020). Evaluation of genotype x environment interaction and yield stability analysis in peanut under phosphorus stress condition using stability parameters of AMMI model. Agric. Res. 9, 477–486. doi: 10.1007/s40003-020-00458-3
Al-Ashkar, I., Sallam, M., Al-Suhaibani, N., Ibrahim, A., Alsadon, A., and Al-Doss, A. (2022). Multiple stresses of wheat in the detection of traits and genotypes of high-performance and stability for a complex interplay of environment and genotypes. Agronomy 12, 6–20. doi: 10.3390/agronomy12102252
Alizadeh, K., Mohammadi, R., Shariati, A., and Eskandari, M. (2017). Comparative analysis of statistical models for evaluating genotype × environment interaction in rainfed safflower. Agric. Res. 6, 455–465. doi: 10.1007/s40003-017-0279-1
Andayani, N. N., Aqil, M., Efendi, R., and Azrai, M. (2018). Line × tester analysis across equatorial environments to study combining ability of Indonesian maize inbred. Asian J. Agric. Biol. 6, 213–220.
Azrai, M., Efendi, R., Muliadi, A., Aqil, M., Suwarti,, Zainuddin, B., et al. (2022). Genotype by environment interaction on tropical maize hybrids under Normal irrigation and waterlogging conditions. Front. Sustain. Food Syst. 6:913211. doi: 10.3389/fsufs.2022.913211
Bocianowski, J., and Wielkopolan, B. J. (2022). M. AMMI analysis of the effects of different insecticidal treatments against Agrotis spp. on the technological yield from sugar beet. Agriculture 12:157. doi: 10.3390/agriculture12020157
Choudhary, M., Kumar, B., Kumar, P., Guleria, S. K., Singh, N. K., Khulbe, R., et al. (2020). GGE biplot analysis of genotype × environment interaction and identification of mega-environment for baby corn hyb. Indian J. Genet. Plant Breed. 79, 658–669.
Crossa, J. (1990). Statistical analyses of multilocation trials. Adv. Agron. 44, 55–85. doi: 10.1016/S0065-2113(08)60818-4
de Leon, N., Jannink, J.-L., Edwards, J. W., and Kaeppler, S. M. (2016). Introduction to a special issue on genotype by environment interaction. Crop Sci. 56, 2081–2089. doi: 10.2135/cropsci2016.07.0002in
Esuma, W., Kawuki, R. S., Herselman, L., and Labuschagne, M. T. (2016). Stability and genotype by environment interaction of provitamin A carotenoid and dry matter content in cassava in Uganda. Breed. Sci. 66, 434–443. doi: 10.1270/jsbbs.16004
Farshadfar, E., Mahmodi, N., and Yaghotipoor, A. (2011). AMMI stability value and simultaneous estimation of yield and yield stability in bread wheat (Triticum aestivum L.). Aust. J. Crop. Sci. 5, 1837–1844.
Fotso, A. K., Hanna, R., Kulakow, P., Parkes, E., Iluebbey, P., Ngome, F. A., et al. (2018). AMMI analysis of cassava response to contrasting environments: case study of genotype by environment effect on pests and diseases, root yield, and carotenoids content in Cameroon. Euphytica 214:155. doi: 10.1007/s10681-018-2234-z
Gauch, H. G. (2006). Statistical analysis of yield trials by AMMI and GGE. Crop Sci. 46, 1488–1500. doi: 10.2135/cropsci2005.07-0193
Gauch, H. G. (2013). A simple protocol for AMMI analysis of yield trials. Crop Sci. 53, 1860–1869. doi: 10.2135/cropsci2013.04.0241
Gauch, H. G. Jr., and Moran, D. R. (2019). AMMISOFT for AMMI analysis with best practices. BioRxiv, 1–10.
Hongyu, K., García-Peña, M., Araújo, L., and Santos Dias, C. (2014). Statistical analysis of yield trials by AMMI analysis of genotype×environment interaction. Biomed. Lett. 51, 89–102. doi: 10.2478/bile-2014-0007
Indonesian Cereals Research Institute (ICERI) (2017). Maize cropping system in distinct agro-ecosystem (annual report), Ministry of Agriculture, Indonesia.
Katsenios, N., Sparangis, P., Leonidakis, D., Katsaros, G., Kakabouki, I., Vlachakis, D., et al. (2021). Effect of genotype × environment interaction on yield of maize hybrids in Greece using AMMI analysis. Agronomy 11:479. doi: 10.3390/agronomy11030479
Krishnamurthy, S. L., Sharma, P. C., Sharma, D. K., Singh, Y. P., Mishra, V. K., Burman, D., et al. (2021). Additive main effects and multiplicative interaction analyses of yield performance in rice genotypes for general and specific adaptation to salt stress in locations in India. Euphytica 217:20. doi: 10.1007/s10681-020-02730-7
Kumar, R., Kaul, J., Kaur, Y., das, A. K., Singode, A., Choudhary, M., et al. (2020). Response of quality protein maize (QPM) hybrids for grain yield in diverse environments. Indian J. Agric. Sci. 90, 756–761. doi: 10.56093/ijas.v90i4.102218
Li, G., Bai, Y., Wang, L., Lu, Y., Zhang, J., and Zhang, Y. (2021). Effects of fertilizer under different dripline spacings on summer maize in northern China. Sci. Rep. 11, 18922–18915. doi: 10.1038/s41598-021-98016-6
Mafouasson, H. N. A., Gracen, V., Yeboah, M. A., Ntsomboh-Ntsefong, G., Tandzi, L. N., and Mutengwa, C. S. (2018). Genotype-by-environment interaction and yield stability of maize single cross hybrids developed from tropical inbred lines. Agronomy 8:62. doi: 10.3390/agronomy8050062
Mohammadi, R., Armion, M., Zadhasan, E., Ahamdi, M. M., and Amir, A. (2017). The use of ammi model for interpreting genotype environment interaction in durum wheat. Exp. Agric. 54, 670–683. doi: 10.1017/S0014479717000308
Mufidah, N., Sugiharto, A. N., and Waluyo, B. (2021). Assessment of combining ability in purple cornparentsunder line ×tester mating design using GGE biplot. Biodiversitas 22, 4545–4554. Available at:. doi: 10.13057/biodiv/d221048
Mukherjee, A. K., Mohapatra, N. K., and Bose, L. K. (2013). Additive main effects and multiplicative interaction(AMMI) analysis of GxE interactions in rice-blast pathosystem to identify stable resistant genotypes. Afr. J. Agric. Res. 8, 5492–5507.
Olivoto, T., Lúcio, A. D. C., Silva, J., Sari, B., and Diel, M. I. (2019). Mean performance and stability in multi-environment trials ii: selection based on multiple traits. Agron. J. 111, 2961–2969. Available at:. doi: 10.2134/agronj2019.03.0221
Olivoto, T., and Nardino, M. (2021). MGIDI: toward an effective multivariate selection in biological experiments. Bioinformatics 37, 1383–1389. doi: 10.1093/bioinformatics/btaa981
Oyekunle, M., Menkir, A., Mani, H., Olaoye, G., Usman, I. S., Ado, S. G., et al. (2017). Stability analysis of maize cultivars adapted to tropical environments using AMMI analysis. Cereal Res. Commun. 45, 336–345. doi: 10.1556/0806.44.2016.054
Ozata, E. (2021). Yield and quality stabilities of waxy corn genotypes using Biplot analysis. Int. J. Life Sci. Biotechnol. 4, 61–89. doi: 10.38001/ijlsb.811966
Pariyo, A., Baguma, Y., Alicai, T., Kawuki, R., Kanju, E., Bua, A., et al. (2015). Stability of resistance to cassava brown streak disease in major agro-ecologies of Uganda. J. Plant Breed. Crop Sci. 7, 67–78. doi: 10.5897/JPBCS2013.0490
Piepho, H.-P. (1994). Best linear unbiased prediction (BLUP) for regional yield trials: A comparison to additive main effects and multiplicative interaction (AMMI) analysis. Theor. Appl. Genet. 89, 647–654. doi: 10.1007/BF00222462
Rezende, W. S., Beyene, Y., Mugo, S., Ndou, E., Gowda, M., Sserumaga,, et al. (2020). Performance and yield stability of maize hybrids in stress-prone environments in eastern Africa. Crop J. 8, 107–118. doi: 10.1016/j.cj.2019.08.001
Roostaei, M., Mohammadi, R., and Amri, A. (2014). Rank correlation among different statistical models in ranking of winter wheat genotypes. Crop J. 2, 154–163. Available at:. doi: 10.1016/j.cj.2014.02.002
Sadeghzadeh, B., Mohammadi, R., Ahmadi, H., Abediasl, G. R., Ahmadi, M. M., and Mohammadfam, M. (2018). GGE biplot and AMMI application in the study of adaptability and grain yield stability of durum lines under dryland conditions. Environ. Stresses Crop Sci. 11, 241–260.
Siddi, S., Anil, D., and Lingaiah, N. (2022). GGE Biplot analysis for stability in diverse maturity groups of Rice (Oryza sativa L.) advanced lines. Int. J. Bio-Resource Stress Manag. 13, 114–121. doi: 10.23910/1.2022.2597
Simon, Z. S., and Getachew, G. (2018). Ammi model analysis of stability and adaptability of finger millet (Eleusine coracana) genotypes in southern Ethiopia. Int. J. Fish. Aquac. Res. 4, 29–35.
Sitaresmi, T., Suwarno, W. B., Gunarsih, C., Nugraha, Y., Sasmita, P., and A. A. D., (2019). Comprehensive stability analysis of Rice genotypes through multi-location yield trials using PBSTAT-GE. SABRAO J. Breed. Genet. 51, 355–372.
Sulaiman, A.A., Kariyasa, I.K, Hoerudin Subagyono, K, and Dan Bahar, F. (2018). Fast Ways to Maize Self-Sufficiency. (In Indonesian.). IAARD Press. Indonesian Agency for Agricultural Research and Development, Jakarta.
Tarakanovas, P. (2006). Additive main effect and multiplicative interaction analysis of grain yield of wheat varieties in Lithuania. Agron. Res. 4, 91–98.
Tollenaar, M., and Lee, E. A. (2002). Yield potential, yield stability and stress tolerance in maize. F. Crop Res. 75, 161–169. doi: 10.1016/S0378-4290(02)00024-2
Yan, W., and Frégeau-Reid, J. (2018). Genotype by yield∗trait (GYT) Biplot: a novel approach for genotype selection based on multiple traits. Sci. Rep. 8, 1–10. doi: 10.1038/s41598-018-26688-8
Keywords: AMMI, equator, GxE interaction, maize, MGIDI
Citation: Azrai M, Aqil M, Efendi R, Andayani NN, Makkulawu AT, Iriany RN,, Yasin M,, Zainuddin B,, Sitaresmi T,, and Suwarno WB (2023) A comparative study on single and multiple trait selections of equatorial grown maize hybrids. Front. Sustain. Food Syst. 7:1185102. doi: 10.3389/fsufs.2023.1185102
Edited by:
Silvia Tavarini, University of Pisa, ItalyReviewed by:
Ashok Singamsetti, Banaras Hindu University, IndiaHaritha Bollinedi, Indian Agricultural Research Institute (ICAR), India
Copyright © 2023 Azrai, Aqil, Efendi, Andayani, Makkulawu, Iriany, Suarni, Yasin, Suwardi, Zainuddin, Salim, Sitaresmi, Bahtiar, Paesal and Suwarno. This is an open-access article distributed under the terms of the Creative Commons Attribution License (CC BY). The use, distribution or reproduction in other forums is permitted, provided the original author(s) and the copyright owner(s) are credited and that the original publication in this journal is cited, in accordance with accepted academic practice. No use, distribution or reproduction is permitted which does not comply with these terms.
*Correspondence: Muhammad Azrai, azrai@agri.unhas.ac.id; Willy Bayuardi Suwarno, willy@apps.ipb.ac.id