 Yuan Li
 Panu Korhonen3
 Sanna Kykkänen
 Marja Maljanen
 Narasinha J. Shurpali
94% of researchers rate our articles as excellent or good
Learn more about the work of our research integrity team to safeguard the quality of each article we publish.
Find out more
ORIGINAL RESEARCH article
Front. Sustain. Food Syst. , 05 June 2023
Sec. Agroecology and Ecosystem Services
Volume 7 - 2023 | https://doi.org/10.3389/fsufs.2023.1158250
This article is part of the Research Topic Optimising Management Practices to Secure Grassland Agroecosystems' Sustainability View all 18 articles
Evaluating the net ecosystem carbon balance (NECB) of legume-based grasslands is crucial for optimizing grassland management and assessing the sustainability of the milk and beef industries. This study investigated the NECB of a boreal legume grassland in eastern Finland from May 2017 to May 2020, covering the entire three-year rotation cycle. We found that the grassland showed interannual variability in carbon sequestration, fixing 220 g C m−2 in the first year, 334 g C m−2 in the second year, and losing 146 g C m−2 in the last year during the grassland renewal period. The study also examined the effects of mineral nitrogen fertilizer and digestate residue addition on the NECB of the grassland. No significant differences in net ecosystem carbon dioxide exchange were observed between the two treatments, but the application of digestate slurry increased the NECB, suggesting that organic fertilizers could potentially enhance carbon sequestration and sustain ecosystem services. In conclusion, our findings emphasize the importance of developing climate-friendly renovation management practices that maximize the photosynthetic period in boreal legume grasslands. These practices, combined with the use of organic fertilizers, can contribute to improved carbon sequestration and support the sustainability of milk and beef industries that rely on grasslands.
Grasslands are an essential component of European agriculture covering approximately 31% of the agricultural area (Olesen and Bindi, 2002; Eurostat, 2021). Grassland-based livestock production is the backbone of the Nordic socio-economy (Åby et al., 2014). It is an important source of livelihood and it maintains the population and vitality of rural areas. Production of milk and beef are interconnected in Finland, up to 80% of beef production is coupled with milk production (Åby et al., 2014). The milk and beef industry is currently being challenged for environmental reasons in light of the reduction in the carbon (C) footprint (Olesen and Bindi, 2002; Klumpp and Fornara, 2018). At the farm level, soil C storage enhancing measures that could be used cost-effectively, and without disrupting production, are lacking.
Incorporating legumes into grasslands through practices such as short rotation, intercropping, or mixed planting can potentially improve soil nutrient conditions (Suter et al., 2015), biomass yield (Finn et al., 2013), and ecosystem energy efficiency (Deng et al., 2021). Legumes can significantly affect the nitrogen (N) status through biological dinitrogen fixation (Gylfadóttir et al., 2007; Lüscher et al., 2014). N can be released from decaying biomass above and below ground, and the nodules and root exudates of legumes (Laidlaw et al., 1996; Suter et al., 2015). For example, using 15N individual plant leaf labeling in a legume grassland in Iceland, a field study found that white clover (Trifolium repens) cultivated with smooth grass (Poa pratensis) provided about 2.5 g N m−2, 50% of the total crop N requirement (Gylfadóttir et al., 2007). A coordinated continental-scale field experiment across 31 European sites reported that the yield of legume grasslands exceeded that of the average grass monoculture with low N fertilization by more than 97% over 3 years (Finn et al., 2013). In addition, a Finnish farm survey found that red clover (Trifolium Pratense L.) based grasslands yielded 7.5 ± 1.7 t dry matter (DM) ha−1 without N fertilization (Riesinger and Herzon, 2008).
Managed European grasslands are often fertilized with mineral and organic N fertilizers to further optimize the production and profitability of grasslands (Olesen and Bindi, 2002). The application of N fertilizers has been shown to affect soil C storage in grassland ecosystems (Conant et al., 2017). For example, a synthesis analysis comprising 50 studies from different parts of the world reported that fertilization with mineral or organic N fertilizers increased grassland soil C stock at an average rate of 0.57 t C ha−1 yr−1 (Conant et al., 2017). A study in a Scottish grassland showed that, compared to mineral fertilizers, organic treatment enhanced soil C storage after 6 years of the manure addition, despite increased rates of soil respiration (Jones et al., 2006). However, little is known about the potential impact of legumes on grassland C balance with the addition of mineral or organic fertilizer in the northern regions, where the long winter has a significant effect on C and N turnover in the plant–soil system.
The eddy covariance (EC) method allows continuous measurements of ecosystem C flows for periods of months to years (Baldocchi, 2020). EC-based measurements of CO2 exchange from grasslands have the potential of providing valuable insights into the impact of management on the net ecosystem C balance (NECB, the net rate of C accumulation in or loss from ecosystems) and exploring opportunities for greenhouse gas mitigation (Chapin et al., 2006; Lind et al., 2016). Thus, as an alternative to monitoring soil organic C (SOC) content over time, changes in NECB can be determined from measured C imports and exports using the EC technique together with measured agronomic parameters, such as harvest and synthetic fertilizer or manure application (Lind et al., 2016; Rutledge et al., 2017; Ammann et al., 2020). Multi-year studies evaluating grassland NECB covering the entire rotation are crucial for understanding the C balance of rotational grasslands (Ammann et al., 2020). Such full-cycle experiments are especially important in the boreal region, characterized by cold climates and short growing seasons, where grasslands are renewed every three to 4 years (Virkajärvi et al., 2015) and wintertime has a significant effect on crop production and nutrient cycling (Maljanen et al., 2009). Currently, however, studies evaluating grassland NECB covering the entire rotation using EC techniques are lacking in the boreal region.
Here, we quantified the NECB of a legume grassland with the EC technique over a three-year rotation cycle in eastern Finland (Figure 1). Our objective in this study was to understand the impact of crop management practices (fertilization, harvesting, and grassland re-establishment) and interannual variability on ecosystem C flows and implications for ecosystem services (e.g., milk and beef production). In this study, we hypothesized that a legume grassland on mineral soil in a boreal environment is a sink for atmospheric C over a three-year rotation cycle and that the effect of fertilizer type on the NECB of legume grasslands varies over the rotation cycle.
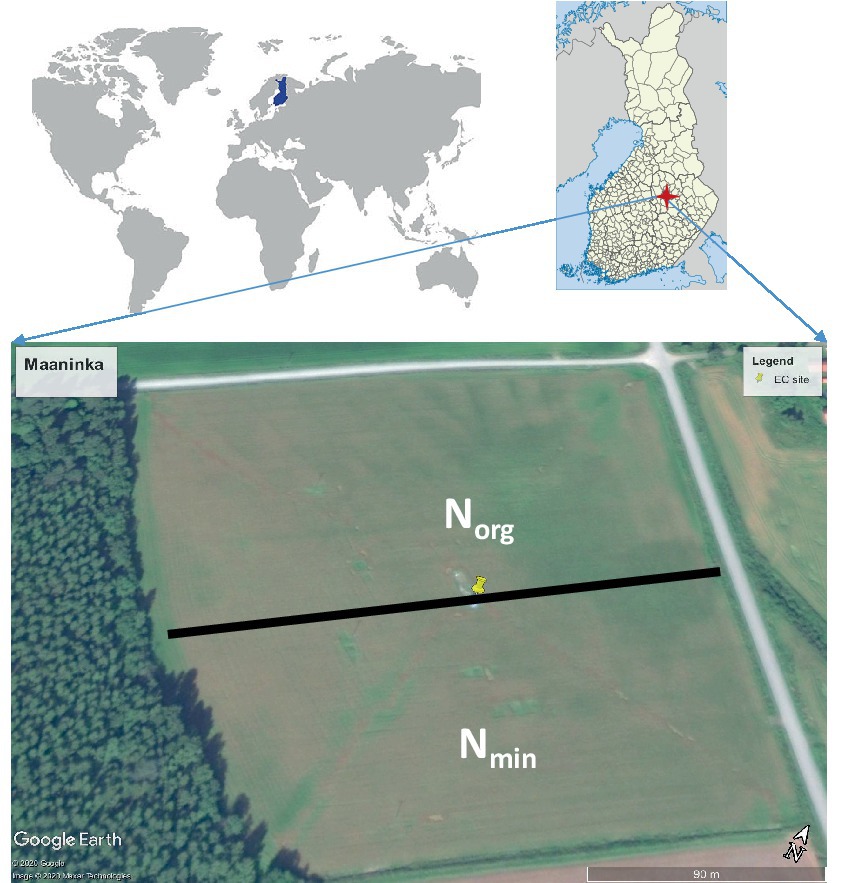
Figure 1. Site location at Maaninka (Kuopio, Finland) and experimental set-up.
The study site is located in eastern Finland (63°09′ N, 27°140′ E, 89 m a.s.l.; Figure 1). The 30-year (1981–2010) mean annual temperature (MAT) and precipitation (MAP) in the region are 3.2°C and 612 mm, respectively. The soil at the study site is classified as a Haplic Cambisol/Regosol (Hypereutric, Siltic) (IUSS Working Group WRB, 2007) (silt loam; clay 25% ± 6%, silt 53% ± 9% and sand 22% ± 8%) based on the U.S. Department of Agriculture (USDA) textural classification system.
The study site, a 6.3-hectare agricultural field (280 m × 220 m) cultivated with timothy (Phleum pratense L. cv. Nuutti; seed rate 15 kg ha−1) and red clover (cv. Ilte; 5 kg ha−1), was established in 2015, reseeded in May 2017, and renewed in spring 2019 (Supplementary Table S1). In the autumn of 2018, glyphosate was applied to the field using a tractor-mounted sprayer to make the site devoid of any vegetation. Subsequently, the site was plowed using a tractor-mounted plow and left bare for the ensuing winter. In early June 2019, the site was renewed (Supplementary Table S1) with the seeding of a red clover and timothy seed mixture, along with barley (Hordeum vulgare L.) as a cover crop, using a tractor-mounted seed drill. Considering the frequency of prevailing wind directions (Supplementary Figure S1), the experimental site was divided into two plots that were treated with either mineral nitrogen (Nmin) or digestate residue (Norg) over a rotation cycle: May 2017–May 2018, June 2018–May 2019, and June 2019–May 2020, hereafter referred to as R1, R2, and R3, respectively. During both grass production years (R1, R2), the Nmin plot was fertilized using a tractor-mounted fertilizer spreader at the start of each growing season (May) and after the 1st cut (mid to late June) with an average annual fertilization rate of 106 kg soluble N, 28 kg P, and 50 kg K ha−1. In contrast, the Norg plot was fertilized once after the 1st cut with an average annual fertilization rate of 98 kg N total (of which 53 kg N was soluble), 13 kg P, and 83 kg K ha−1, using a tractor-mounted slurry spreader. In the renovation year (R3), the whole field received Nmin plot fertilization with an annual rate of 45 kg N, 20 kg phosphorous, and 38 kg K ha−1 using a tractor-mounted fertilizer spreader, while the Norg plot did not receive any fertilizers (Supplementary Table S1). The grass was cut using a tractor-mounted mower, followed by a tractor-mounted rake and baler for forage harvesting.
Each treatment was further divided into two sub-plots to assess the grass growth patterns in different parts of the field. The physical and chemical properties of the topsoil (0–15 cm) are given in Supplementary Table S2. Each treatment was harvested typically two times per year, and once during the establishment year (2019) (Supplementary Tables S1, S2). The experimental field was harvested for pre-wilted silage using farm-scale machinery. The sward was cut to 8 cm with a conventional disk mower with conditioner, swathed and baled with farm machinery and the bales were individually weighed for each of the four subplots. Similarly, representative samples were taken from the swaths and oven-dried at 60°C for 40 h to determine DM and the chemical composition of the herbage. Soil and plant C content was analyzed using a Leco TruMac® CN analyzer.
The EC tower was erected at the center of the study area on the boundary between Nmin and Norg treatments (Figure 1). Measurements of CO2 and H2O fluxes were performed using a closed-path EC system with an adjacent weather station for supporting soil climate and meteorological data. The EC system consisted of a Li-7,000 infrared gas analyzer (IRGA, for CO2 and H2O mixing ratios, Li-COR Inc., Lincoln, NE, United States), and a sonic anemometer (for wind velocity components, sensible heat flux, and sonic temperature, R3-50, Gill Instruments Ltd., UK) mounted on an instrument tower at a height of 2.5 m above the soil surface. With a flow rate of 10 L min−1, the air samples passed through a heated intake tube (inner diameter 6 mm, length 8 m, PTFE) with two filters (pore size 1.0 μm, PTFE, Gelman®). The IRGA was housed in a climate-controlled cabin and it was calibrated approximately every month during the growing season with a two-point calibration (0 and 399 μL L−1 of CO2, AGA Oy, Finland) and additionally with a dew point generator (Li–610, LI–COR Inc.) for H2O mixing ratio during conditions when the air temperature (Ta) was above 5°C.
Supporting climatic variables, i.e., net radiation (Rn, CNR1, Kipp & Zonen B.V.), Ta and relative humidity (RH, HMP45C, Vaisala Inc), photosynthetically active radiation (PAR, SKP215, Skye Instruments Ltd.), soil temperature (Ts, 107, Campbell Scientific Inc.), volumetric water content (θv, CS616, Campbell Scientific Inc.) at 5 and 20 cm depths, and air pressure (CS106 Vaisala PTB110 Barometer) were measured.
Eddy covariance raw data were collected at 10 Hz using a data logger (CR3000, Campbell Scientific Inc.). All supporting meteorological and soil climate data were collected as 30 min mean values. Missing Ta, relative humidity, or precipitation data were filled using data from the Maaninka weather station operated by the Finnish Meteorological Institute (FMI), located about 6 km to the southeast of the site.
The 30 min EC flux values were calculated from the covariance of scalars and vertical wind velocity. Data processing was performed using EddyUH (Mammarella et al., 2016). Despiking limits were defined for CO2 at 15 μmol mol−1; 20 mmol mol−1 for H2O; wind components (u = 10 m s −1, v = 10 m s−1, and w = 5 m s−1) and temperature (5°C). Detected spikes were replaced by adjacent values or the average of previous values. Point-by-point dilution correction was applied after the despiking. The two-dimensional coordinate rotation was done on the sonic anemometer wind components. The angle of attack correction was not applied. Detrending was done using block averaging. Lag time due to the gas sampling line was calculated by maximizing the covariance. Low-frequency spectral corrections were implemented according to Rannik and Vesala (1999). For high-frequency spectral corrections, empirical transfer function calculations were done based on the procedure introduced by Aubinet et al. (1999). Humidity effects on sonic heat fluxes were corrected according to Schotanus et al. (1983). Additionally, flux values measured when winds were from behind the instrument cabin (85–130°), during rain, and during regular maintenance (e.g., calibration) were discarded.
Night-time NEE and u* had no significant correlation, hence a default u* filter of 0.1 m s−1 was used. Flux was considered non-stationary following Foken and Wichura (1996). The available flux data were further quality controlled. Both skewness and kurtosis of the data were checked, and the acceptable skewness range was set from −3 to 3 and −2 to 2, and kurtosis from 1 to 14 for CO2/H2O. Overall flags higher than 7 were removed (Foken et al., 2004). Finally, the data were visually inspected. From the available data, approximately 53% of the CO2 and H2O flux data were retained.
The gap-filling and flux partitioning of NEE were performed using the REddyProc Web online tool.1 This tool considers both the co-variation of the fluxes with radiation, temperature, and vapor pressure deficit (VPD) and the temporal autocorrelation of the fluxes (Reichstein et al., 2005). The measured and quality-controlled flux data were used as inputs to the Flux partitioning tool. Total ecosystem respiration (RE) was defined as the night-time measured net ecosystem CO2 exchange (NEE). The regression between night-time NEE and Ta was calculated using an exponential regression model (Lloyd and Taylor, 1994). Using the model-estimated parameters, the missing half-hour RE during night and daytime was estimated as a function of the continuous, measured dataset of Ta. Finally, gross photosynthesis (GPP) was calculated as a difference between NEE and RE. In this paper, CO2 released into the atmosphere is defined as a positive value and uptake from the atmosphere as negative.
Annual and total net ecosystem C balances (NECB) were calculated for each treatment by adding all imports and exports of C to the calculated net ecosystem CO2 exchange (NEE) (Chapin et al., 2006; Lind et al., 2016).
where CNorg is the C added as organic fertilizer (digestate residue); Charvest is the dry biomass C in aboveground biomass removed by harvesting; Emissions of soil methane–C are ignored in this study as they are likely to be very small (Maljanen et al., 2009; Lind et al., 2016). Charvest was calculated as the total dry matter yield multiplied by the C content, NECB1 is the total net ecosystem C balances accounting for harvested biomass and NECB2 is the total C balances accounting also for C addition to the ecosystem in the form of the applied digested residue. Similar to NEE, a negative NECB indicates a (net) C retained in the ecosystem, and a positive sign indicates a (net) C emission or release to the atmosphere.
The relationship between daytime (PAR > 20 μmol m−2 s−1) NEE and PAR was examined during periods when the grass growth was at its peak (a week before each grass cutting event during the growing season each year). Prior to the analysis, PAR data were binned at an interval of 10 μmol m−2 s−1. The values of NEE were plotted against PAR with a rectangular hyperbolic model.
where Pmax (μmol m−2 s−1) is the theoretical maximum rate of photosynthesis at infinite PAR, is the apparent quantum yield, and Rd is the rate of dark respiration (μmol m−2 s−1).
In this study, daily, monthly, seasonal, and annual NEE were calculated using gap-filled data in the R programming environment. Data quality control (see Section 2.2.2) was also conducted using R. The effects of PAR on NEE (Equation 3) were evaluated using the “nlme” package of R (Pinheiro et al., 2014). Multilevel correlations between climatic parameters and CO2 fluxes were tested using the “correlation” package (Lüdecke et al., 2019). All figures were plotted using the “ggplot2” package (Wickham, 2016) in R.
MAT during R1, R2, and R3 was higher than the 30-year mean (3.2°C), with differences of 0.9°C, 1.6°C, and 1.8°C, respectively (Figure 2). The growing season duration varied across the rotations, with 136 days in R1, 155 days in R2, and 142 days in R3. During R1, the mean Ta from May to July was lower than the 30-year averages, while August and September values were similar (Figure 3). In contrast, R2 exhibited a consistently higher mean Ta throughout the growing season compared to the 30-year average. The mean Ta during R3’s growing season was mostly in line with the 30-year averages, except for a higher value in June. The mean topsoil Ts during the growing seasons was 12.6°C for R1, 14.1°C for R2, and 12.9°C for R3 (Figure 3). Corresponding subsoil temperatures were 12.1°C, 13.4°C, and 12.5°C, respectively.
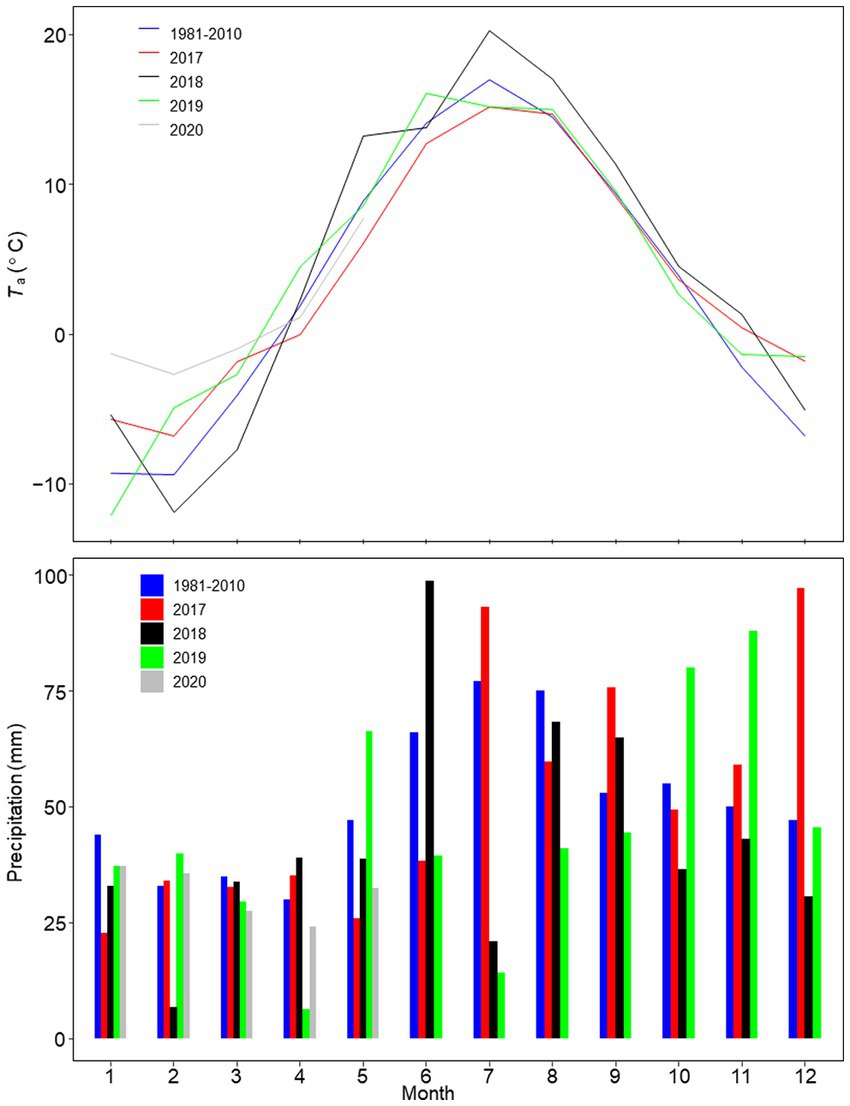
Figure 2. Monthly mean air temperature (Ta, °C), and precipitation sum (mm) during 2017–2020 compared with the 30-year average (1981–2010).
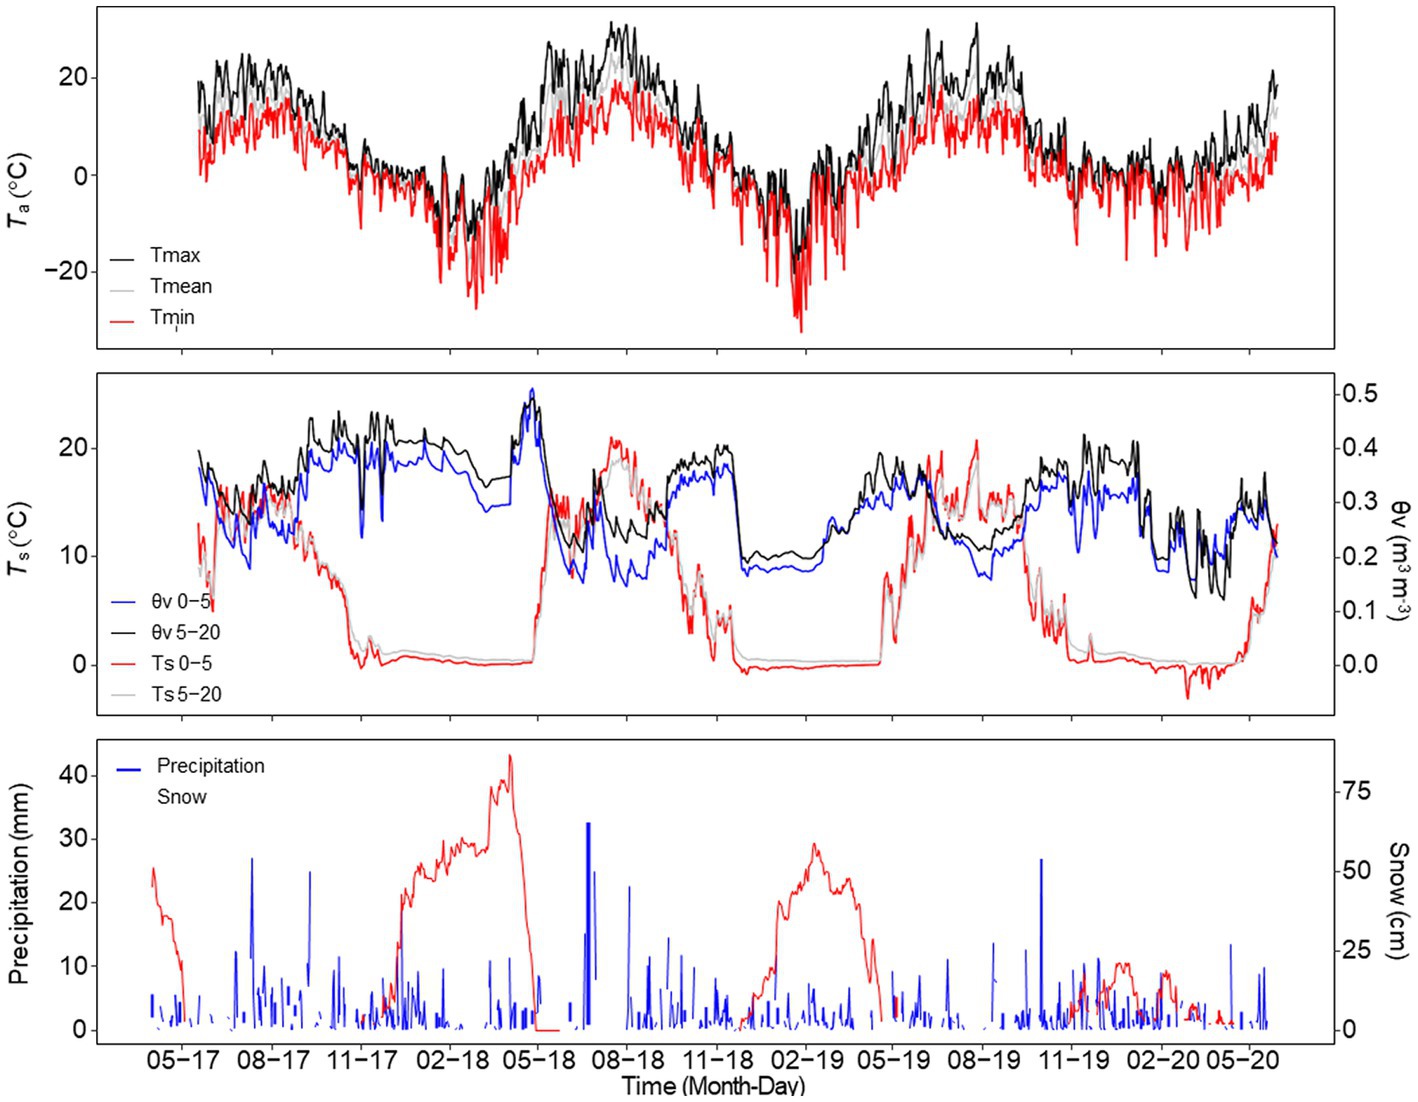
Figure 3. Climatic conditions at the study site from May 2017 to May 2020. Daily mean, maximum, and minimum air temperature (Ta, °C); daily averaged soil temperature (Ts, °C) and volumetric water content (θv, m3 m−3) at the top− (0–5 cm) and subsoil (5–20 cm); daily precipitation sum (mm) and snow depth (cm).
MAP was lower than the 30-year mean (612 mm) during R2 (542 mm) and R3 (509 mm), while R1 (624 mm) was wetter than normal (Figure 2). Precipitation during the growing season of R3 (173 mm) was lower than that in R1 (284 mm) and R2 (252 mm), and precipitation values recorded during the growing seasons over the rotation cycle were all lower than that of the 30-year mean (318 mm, Figure 2). More precipitation was received outside the growing seasons over R1, R2, and R3. Mean topsoil θv fluctuated with rain events during the growing season and was 34%, during R1 and 27%, during R2 and R3, respectively, with the corresponding mean subsoil θv values of 29, 25, and 26% (Figure 3).
The variability of biomass yield among years, treatments, and cuts is noteworthy (Table 1). The maximum annual biomass yield was reported in R2. The yield from the first cut in R1 was 25% lower than the second one under the Nmin treatment, while the yields from the two cuts were about the same under Norg. During R2, however, the yield from the first cut was 2.2 times higher than the second one under Nmin, while under Norg, it was 2.5 times higher.
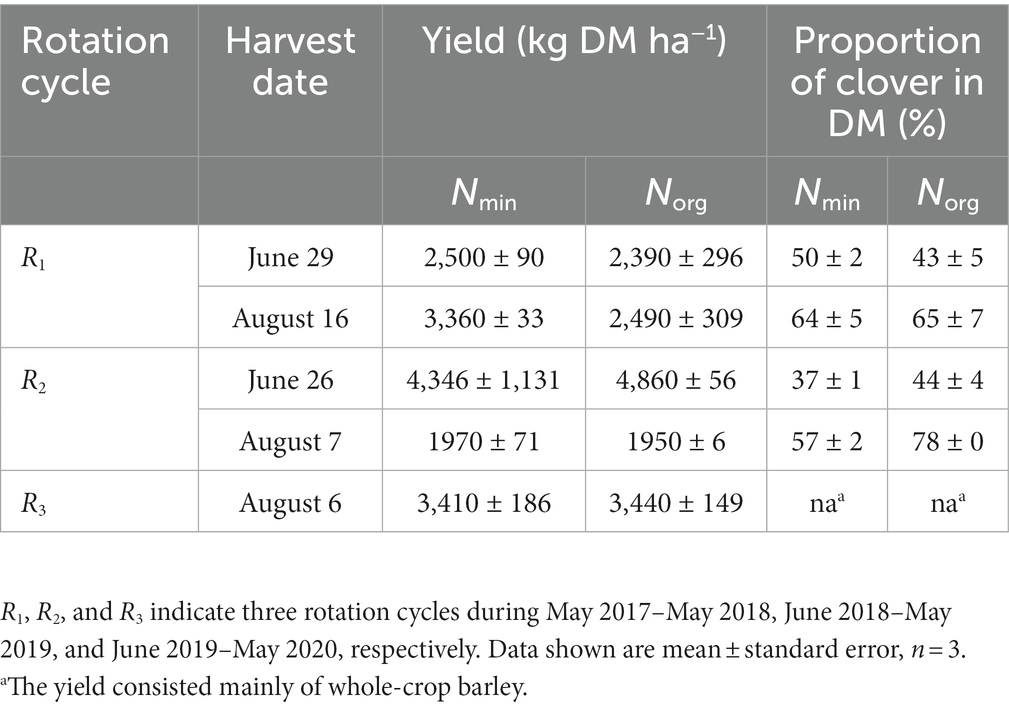
Table 1. Harvest events and yield as dry matter (kg DM ha−1) and the proportion of clover in grassland added with mineral nitrogen (Nmin) or digestate residue (Norg) over the three-year rotation cycle (May 2017–May 2020).
Daily NEE displayed distinct patterns reflecting the grass phenological development, harvesting impacts, and grassland renewal during the measurement period (Figure 4). In R1 and R2, two negative NEE peaks were observed before each grass cut in late June and early August. In contrast, R3 had only one peak as the grass was cut once during the grassland renewal year (Figure 4).
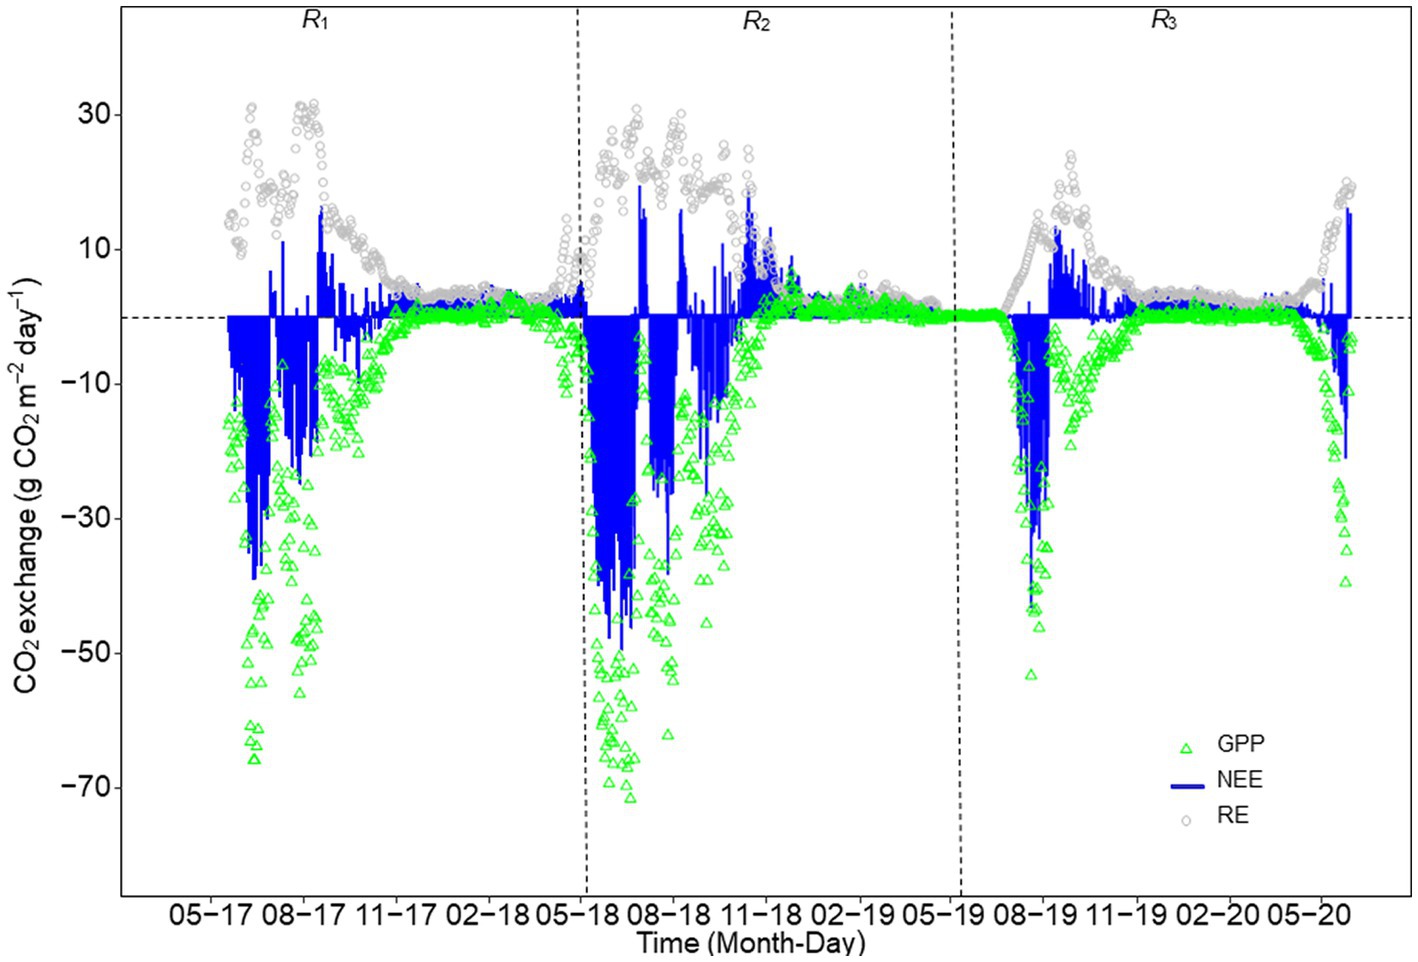
Figure 4. Daily CO2 fluxes (g CO2 m−2 day−1) from grassland from May 2017 to May 2020; Gap-filled CO2 fluxes were used. Net ecosystem CO2 exchange (NEE), ecosystem respiration (RE), and gross primary production (GPP). CO2 released into the atmosphere is defined as a positive value.
In R1, an uptake peak rate of 39 g CO2 m−2 d−1 occurred in mid-June, followed by a post-cutting CO2 source phase. A second CO2 uptake peak of 22 g CO2 m−2 d−1 was observed in late July. In R2, the initial CO2 uptake began 14 days earlier than in R1, peaking at 48 g CO2 m−2 d−1 by late May. After the first cut and second fertilizer application, a CO2 source peak rate of 19 g CO2 m−2 d−1 was observed, followed by a 38 g CO2 m−2 d−1 uptake peak in late July. The third cut in R2 was not performed due to low biomass accumulation rates.
In R3, following grassland re-establishment, the ecosystem reached a peak net uptake of 43 g CO2 m−2 d−1 in mid-July. From the barley harvest in early August 2019 to the study’s end in May 2020, the ecosystem remained a sustained CO2 source (Figure 4).
A week before the first and second cuts under the Nmin treatment in 2017 and 2018, and a week before the first cut under the Norg treatment in 2019 (Figure 5), high values of estimated Pmax (potential photosynthetic capacity) and α (light use efficiency) implied that the climatic conditions and increased leaf area during this time were favorable for high CO2 uptake (p < 0.05, Table 3). The moderate, insignificant differences among light response curves suggested no major differences in NEE under the Nmin and Norg treatments (Table 3, Figure 5).
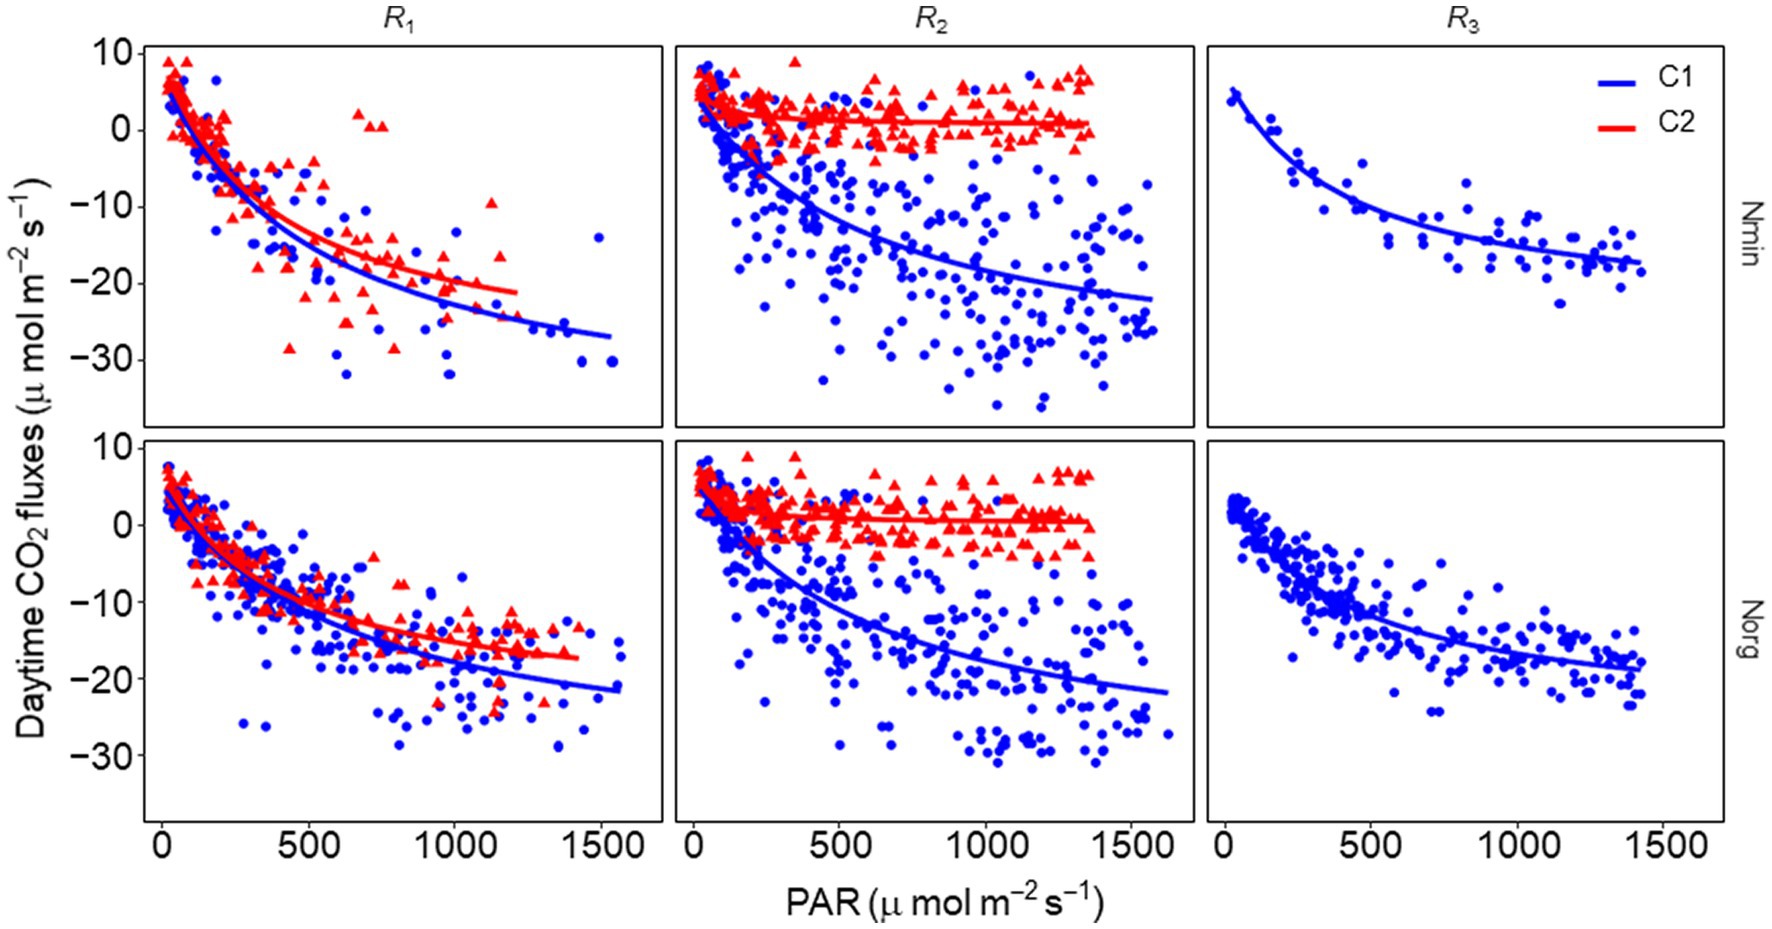
Figure 5. Relationship of day–time net ecosystem CO2 exchange (NEE) with incident photosynthetically active radiation (PAR). Data of NEE were fitted with a nonlinear equation (the estimated parameters are presented in Table 3) with PAR (Section 2.3). R1, R2, and R3 indicate three rotation cycles during May 2017–May 2018, June 2018–May 2019, and June 2019–May 2020, respectively. Nmin and Norg indicate grassland added with mineral nitrogen or digestate residue, respectively. C1 and C2 indicate the first and second grass cuts, respectively. A week’s worth of measured 30 min data pairs (NEE and PAR) available before each grass cut were used for the nonlinear regression analysis presented in this figure. Note that there was a single grass cut (C1) made in R3.
Cumulative RE and GPP at the study site over the entire three-year study were 2,515 g and 3,061 g C m−2, respectively (Table 2). Thus, based on NEE alone, the ecosystem sequestered 547 g C m−2 during the 3-year measurement period. The three-year cumulative biomass yield was 685 g C m−2. Accounting for C lost as harvested biomass, the NECB was 138 g C m−2 with synthetic N fertilization. Accounting for the 92 g C m−2 as an input of C to the ecosystem with the application of digestate residue, the NECB was reduced to 45 g C m−2 (Table 2).
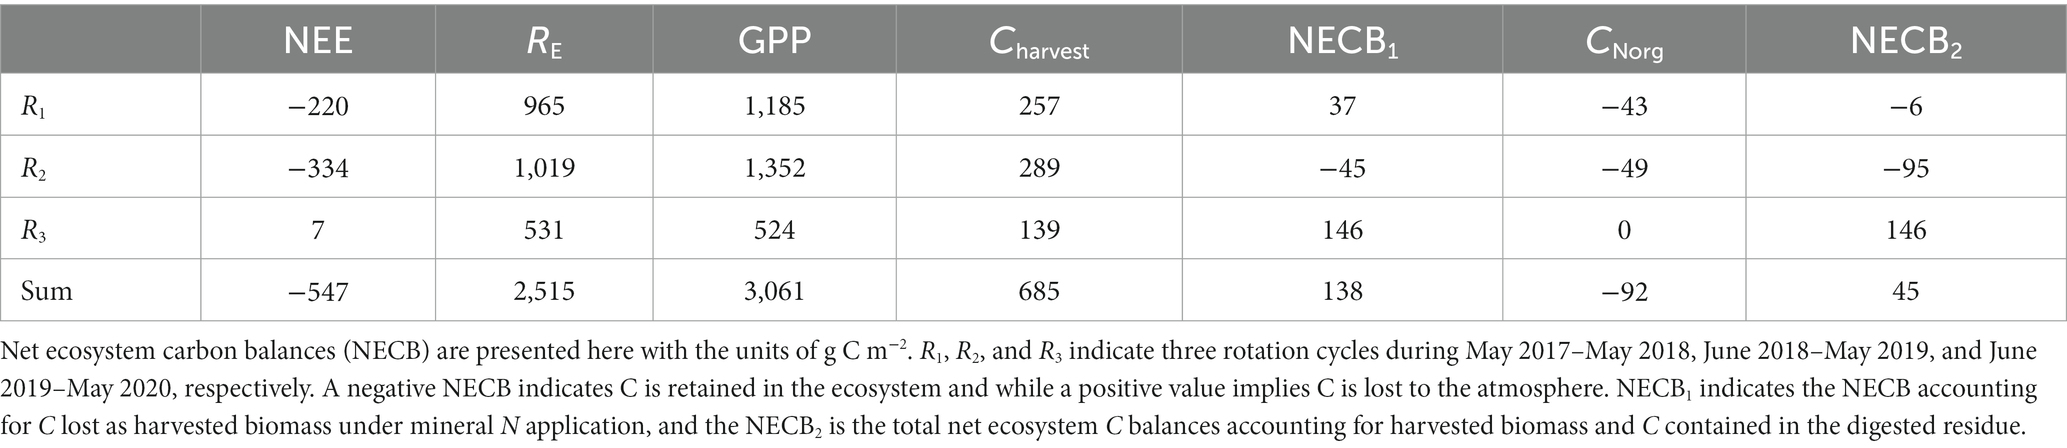
Table 2. The annual net ecosystem CO2 exchange (NEE), ecosystem respiration (RE), gross primary production (GPP), fertilizer C (CNorg), and dry matter C (Charvest) in g C m−2.
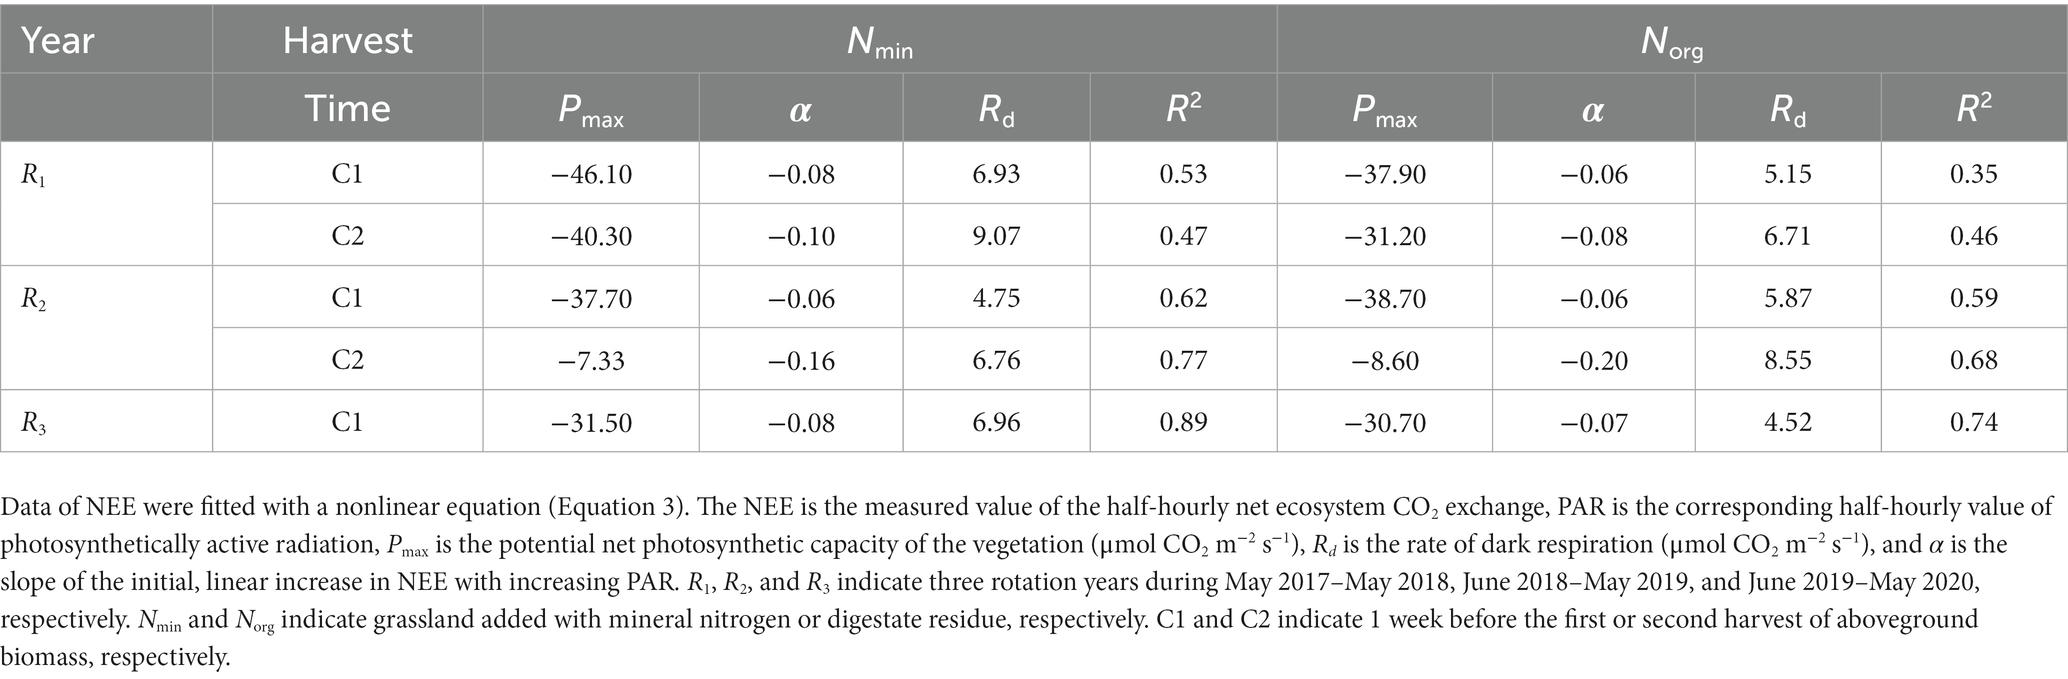
Table 3. Relationship of day–time net ecosystem CO2 exchange (NEE) with incident photosynthetically active radiation (PAR).
The NECB of the ecosystem was 37, −45, and 146 g C m−2 over R1, R2, and R3, respectively -under the mineral N fertilizer application and 6, −95, and 146 under the organic N application (Table 2). The ecosystem behaved as a source in R1 and a sink in R2 under the mineral N treatment, while as a small C sink in R1, and a greater one in R2 under organic N application, respectively. The ecosystem lost a large amount of C to the atmosphere in the renovation year under both treatments in R3.
Grasslands play a crucial role in agriculture by providing ecosystem services for the milk and beef industries in Nordic countries (Åby et al., 2014; Eurostat, 2021). Few studies have reported the CO2 balance of grasslands in boreal environments, particularly for an entire rotation cycle including the renovation period. This information is vital for developing best management practices aimed at sustainable and climate-smart land use (Cowan et al., 2016; Li et al., 2021b). Our three-year study assessed the impact of various grassland management practices on the CO2 balance of a legume grassland in eastern Finland.
The length of the growing season in 2018 was 20 days longer than in 2017, with an early start of 16 days in the spring (Figure 2). This study demonstrated high biomass accrual rates and an enhanced ability to sequester atmospheric CO2 during early spring, indicative of the changes that can be expected in boreal environments under shifting climatic conditions (Ruosteenoja et al., 2011, 2016). In comparison to a 30-year (1981–2010) average climate, the growing season (May–September 2017) had a cooler mean temperature of 11.6°C, while the average temperature of the growing season in 2018 reached 15.1°C (Figure 2). Similarly, the mean soil temperatures at a 5 cm depth during the growing season in 2018 were 1.7°C higher than the seasonal average in 2017. This difference was mainly due to the warmer temperatures experienced during the 2018 spring. The average temperature difference between mid-April and early June (day 100–157) in the 2 years was 6.1°C, with a maximum difference of 17.7°C on day 136 (Figure 2). Precipitation sums from May to September in 2017 (287 mm) and 2018 (291 mm) were roughly equivalent. The vapor pressure deficit (VPD), an indicator of atmospheric dryness, was also elevated during the 2018 growing season (Figure 2). Higher VPD values under optimal soil moisture conditions promote increased photosynthetic uptake of atmospheric CO2 by vegetation. The findings presented in this study have important implications for optimizing grassland management practices and identifying opportunities for soil C sequestration in response to the changing climate in boreal regions.
Given the interannual and within-season variability in climatic conditions, various management practices either decreased vegetative cover (due to biomass harvesting or grass cuts, senescence, land preparation—glyphosate application, plowing) or increased it (through phenological development and application of chemical or organic fertilizer). Depending on the management practice followed during a year, the NEE of the legume grassland ranged from being near neutral (R1) to a large sink (R2) and eventually to a large source in R3. When the eddy covariance-based CO2 exchange measurements were conducted in May 2017, the grassland was already in its second year of rotation, having been established in 2015 and reseeded in 2016. Consequently, September 2018 marked the end of the rotation cycle when the grassland was treated with glyphosate, plowed, and left bare during the subsequent winter. The period from the end of the growing season (late September) in 2018 to late May 2019 represented the typical phase of grassland rotation renewal. These practices led to a sustained soil C loss (Cowan et al., 2016; Li et al., 2021b), offsetting the soil C sequestered during previous seasons. In R3, following regional practice, barley was cultivated as a cover crop alongside red clover and the grass mixture. The atmospheric CO2 fixation during the short growth period from sprouting (June 4) to harvest (August 6) is primarily attributable to the vigorous growth of the cover crop (Figure 4). After the first cut, the grassland became a large source of C in R3, likely due to dry climatic conditions in August and relatively low soil N concentration resulting from a small dose of 45 kg N ha−1 applied at planting time. Severe climatic stress and poor grass growth did not warrant a second cut in the season. Following the first cut, the ecosystem remained a sustained source of CO2 to the atmosphere until the end of this study period (May 2020). Our observations, based on continuous CO2 exchange measurements, reveal the impact of the renewal phase on the ecosystem balance of the entire 3-year rotation cycle in a boreal environment. These results strongly suggest that greater emphasis should be placed on developing climate-friendly renovation management under the Nordic climate (Klumpp and Fornara, 2018). Such management options could extend the length of production years between renovations, provided that grassland productivity can be maintained, re-seeding is performed rapidly in spring, and sufficient N fertilization is ensured for growth and photosynthesis.
Overall, based on the NECB, the legume grassland was a C source of 45 g C m−2 over a three-year rotation cycle (Table 2) considering the mineral N application. However, with additional C input to the ecosystem through the application of the organic fertilizer, the NECB values changed to a small C sink of 6 g C m−2 in R1 and a greater sink of 95 g C m−2 in R2. As no organic fertilizer was added in the last year, the NECB during R3 remained a large C source. Applying organic N fertilizer has been shown to enhance NECB by indirectly enhancing photosynthesis and directly increasing the soil organic matter (Hirata et al., 2013; Conant et al., 2017; Miao et al., 2019; Zhu et al., 2021). A study at a cool temperate site in Japan reported that more than 80% of the C imported in applied manure remained in the grassland soil (Hirata et al., 2013). Previous studies on European grassland sites have also found that, in general, NECB at the grassland sites without organic matter input was a net loss of CO2 to the atmosphere or neutral, while it was neutral or a net CO2 sink at sites with organic matter application (Gilmanov et al., 2007). These observations from previous studies are in line with our results (Table 2), in which C incorporation in soil from the organic fertilizer resulted in the net accumulation of C in grassland soils. A study in a temperate grassland reported that the stimulation of C assimilation was greater than that of ecosystem respiration with the addition of organic N, and eventually increased the ecosystem C sequestration (Gilmanov et al., 2007; Luo et al., 2017). Thus, if NECB of the boreal legume grassland is not N limited, it might largely depend on the C balance between manure input and biomass output (Table 2), which warrants further investigation of the tradeoff between productivity and ecosystem benefits with a combination of mineral and organic N fertilizer. We also computed the hyperbolic light response of NEE to incident PAR from Nmin and Norg treatments for a week before all cutting events over R1, R2, and R3 (Table 3, Figure 5) because Pmax, α, and Rd (Table 3, Figure 5) are important measures of the ecosystem’s ability to exchange CO2 with the atmosphere. The light response curves from the two treatments were similar in all years with minor differences during R1 (Figure 5), which suggested that beyond the direct effect on photosynthesis, fertilizer type might affect NECB of boreal legume grassland in different manners, and further study is thus warranted. Additionally, the application of organic manure may enhance N2O emissions (Jones et al., 2006; Li et al., 2021a), for a complete understanding of the sustainability of managed grasslands, N2O emissions (CO2-equivalent) need to be assessed in considering complete net GHG balance.
The net ecosystem CO2 balance of a legume grassland over an entire rotation cycle in a boreal environment is critical for developing best management practices aimed at sustainable and climate-smart grassland management for the sustainability of dairy and beef farming industries. This study measured the NECB of a legume grassland in eastern Finland over a three-year (2017–2020) rotation cycle. Overall, the entire legume grassland was a carbon source of 45 g C m−2 over the rotation cycle. Specifically, it was a weak carbon sink during the first year of the rotation, a stronger carbon sink during the second year, and a large carbon source during the renovation year of the grassland. Management practices for grassland reestablishment, such as the application of glyphosate and plowing in the autumn of 2018, leaving the site bare during the following winter, and having a late and short growing season cover crop, resulted in significant soil carbon loss and offset soil carbon sequestration achieved in earlier grassland rotation years. Our results indicate that the ecosystem’s carbon balance can be improved with the application of organic soil amendments. In conclusion, climate-friendly renovation management extending the length of the photosynthetic period under the Nordic climate can lead to higher carbon sequestration in boreal legume grasslands. The application of organic fertilizers can further enhance carbon sequestration, promoting more sustainable and climate-smart grassland management practices that support the sustainability of dairy and beef farming industries.
The raw data supporting the conclusions of this article will be made available by the authors, without undue reservation.
YL: designed research, collected data, formal analysis, visualization, and writing—original draft. PK, SK, MM, and PV: designed research, data curation, and writing—review. NS: designed research, collected data, project administration, supervision, and funding acquisition. All authors contributed to the article and approved the submitted version.
This work was supported by the projects funded by the Academy of Finland (project #. 311970–INDO-NORDEN, 2017-2020), the Ministry of Agriculture (Project NC-GRASS: VN/28562/2020-MMM-2 funded by the Finnish Ministry of Agriculture and Forestry (MMM) and Project ENSINK: Decision number 334422 funded by the Academy of Finland), and the Natural Science Foundation of China (32101431, 32211530030).
The authors acknowledge the excellent technical support provided by Timo Oksanen and other field staff from the University of Eastern Finland in data collection and Johanna Kanninen, Jenni Laakso, and Arto Pehkonen from Luke, Maaninka.
The authors declare that the research was conducted in the absence of any commercial or financial relationships that could be construed as a potential conflict of interest.
All claims expressed in this article are solely those of the authors and do not necessarily represent those of their affiliated organizations, or those of the publisher, the editors and the reviewers. Any product that may be evaluated in this article, or claim that may be made by its manufacturer, is not guaranteed or endorsed by the publisher.
The Supplementary material for this article can be found online at: https://www.frontiersin.org/articles/10.3389/fsufs.2023.1158250/full#supplementary-material
Åby, B. A., Kantanen, J., Aass, L., and Meuwissen, T. (2014). Current status of livestock production in the Nordic countries and future challenges with a changing climate and human population growth. Acta Agricult. Scand. Sect. A Anim. Sci. 64, 73–97. doi: 10.1080/09064702.2014.950321
Ammann, C., Neftel, A., Jocher, M., Fuhrer, J., and Leifeld, J. (2020). Effect of management and weather variations on the greenhouse gas budget of two grasslands during a 10-year experiment. Agric. Ecosyst. Environ. 292:106814. doi: 10.1016/j.agee.2019.106814
Aubinet, M., Grelle, A., Ibrom, A., Rannik, Ü., Moncrieff, J., Foken, T., et al. (1999). “Estimates of the annual net carbon and water exchange of forests: the EUROFLUX methodology” in Advances in ecological research. eds. A. H. Fitter and D. G. Raffaelli (Academic Press), 113–175.
Baldocchi, D. D. (2020). How eddy covariance flux measurements have contributed to our understanding of global change biology. Glob. Chang. Biol. 26, 242–260. doi: 10.1111/gcb.14807
Chapin, F. S., Woodwell, G. M., Randerson, J. T., Rastetter, E. B., Lovett, G. M., Baldocchi, D. D., et al. (2006). Reconciling carbon-cycle concepts, terminology, and methods. Ecosystems 9, 1041–1050. doi: 10.1007/s10021-005-0105-7
Conant, R. T., Cerri, C. E. P., Osborne, B. B., and Paustian, K. (2017). Grassland management impacts on soil carbon stocks: a new synthesis. Ecol. Appl. 27, 662–668. doi: 10.1002/eap.1473
Cowan, N. J., Levy, P. E., Famulari, D., Anderson, M., Drewer, J., Carozzi, M., et al. (2016). The influence of tillage on N2O fluxes from an intensively managed grazed grassland in Scotland. Biogeosciences 13, 4811–4821. doi: 10.5194/bg-13-4811-2016
Deng, J., Ni, H., Zhang, Z., Usman, S., Yang, X., Shen, Y., et al. (2021). Designing productive, energy-efficient, and environmentally friendly production systems by replacing fallow period with annual forage cultivation on the loess plateau of China. J. Clean. Prod. 320:128660. doi: 10.1016/j.jclepro.2021.128660
Finn, J. A., Kirwan, L., Connolly, J., Sebastià, M. T., Helgadottir, A., Baadshaug, O. H., et al. (2013). Ecosystem function enhanced by combining four functional types of plant species in intensively managed grassland mixtures: a 3-year continental-scale field experiment. J. Appl. Ecol. 50, 365–375. doi: 10.1111/1365-2664.12041
Foken, T., Göockede, M., Mauder, M., Mahrt, L., Amiro, B., and Munger, W. (2004). “Post-field data quality control” in Handbook of micrometeorology: A guide for surface flux measurement and analysis. eds. X. Lee, W. J. Massman, and B. E. Law (Dordrecht: Kluwer Academic Publishers), 181–208.
Foken, T., and Wichura, B. (1996). Tools for quality assessment of surface-based flux measurements. Agric. For. Meteorol. 78, 83–105. doi: 10.1016/0168-1923(95)02248-1
Gilmanov, T. G., Soussana, J. F., Aires, L., Allard, V., Ammann, C., Balzarolo, M., et al. (2007). Partitioning European grassland net ecosystem CO2 exchange into gross primary productivity and ecosystem respiration using light response function analysis. Agric. Ecosyst. Environ. 121, 93–120. doi: 10.1016/j.agee.2006.12.008
Gylfadóttir, T., Helgadóttir, Á., and Høgh-Jensen, H. (2007). Consequences of including adapted white clover in northern European grassland: transfer and deposition of nitrogen. Plant Soil 297, 93–104. doi: 10.1007/s11104-007-9323-4
Hirata, R., Miyata, A., Mano, M., Shimizu, M., Arita, T., Kouda, Y., et al. (2013). Carbon dioxide exchange at four intensively managed grassland sites across different climate zones of Japan and the influence of manure application on ecosystem carbon and greenhouse gas budgets. Agric. For. Meteorol. 177, 57–68. doi: 10.1016/j.agrformet.2013.04.007
IUSS Working Group WRB, (2007). World reference base for soil resources 2006, first update 2007. FAO, Rome.
Jones, S. K., Rees, R. M., Kosmas, D., Ball, B. C., and Skiba, U. M. (2006). Carbon sequestration in a temperate grassland; management and climatic controls. Soil Use Manag. 22, 132–142. doi: 10.1111/j.1475-2743.2006.00036.x
Klumpp, K., and Fornara, D. A. (2018). “The carbon sequestration of grassland soils-climate change and mitigation strategies” in 27th general meeting of the European grassland federation (Cork: Teagasc, Animal and Grassland Research and innovation Centre)
Laidlaw, A. S., Christie, P., and Lee, H. W. (1996). Effect of white clover cultivar on apparent transfer of nitrogen from clover to grass and estimation of relative turnover rates of nitrogen in roots. Plant Soil 179, 243–253. doi: 10.1007/BF00009334
Li, Y., Clough, T. J., Moinet, G. Y. K., and Whitehead, D. (2021a). Emissions of nitrous oxide, dinitrogen and carbon dioxide from three soils amended with carbon substrates under varying soil matric potentials. Eur. J. Soil Sci. 72, 2261–2275. doi: 10.1111/ejss.13124
Li, Y., Li, Z., Cui, S., Liang, G., and Zhang, Q. (2021b). Microbial-derived carbon components are critical for enhancing soil organic carbon in no-tillage croplands: a global perspective. Soil Tillage Res. 205:104758. doi: 10.1016/j.still.2020.104758
Lind, S. E., Shurpali, N. J., Peltola, O., Mammarella, I., Hyvönen, N., Maljanen, M., et al. (2016). Carbon dioxide exchange of a perennial bioenergy crop cultivation on a mineral soil. Biogeosciences 13, 1255–1268. doi: 10.5194/bg-13-1255-2016
Lloyd, J., and Taylor, J. A. (1994). On the temperature dependence of soil respiration. Funct. Ecol. 8, 315–323. doi: 10.2307/2389824
Lüdecke, D., Waggoner, P., and Makowski, D. (2019). Insight: a unified interface to access information from model objects in R. J. Open Source Softw. 4:1412. doi: 10.21105/joss.01412
Luo, Q., Gong, J., Yang, L., Li, X., Pan, Y., Liu, M., et al. (2017). Impacts of nitrogen addition on the carbon balance in a temperate semiarid grassland ecosystem. Biol. Fertil. Soils 53, 911–927. doi: 10.1007/s00374-017-1233-x
Lüscher, A., Mueller-Harvey, I., Soussana, J. F., Rees, R. M., and Peyraud, J. L. (2014). Potential of legume-based grassland–livestock systems in Europe: a review. Grass Forage Sci. 69, 206–228. doi: 10.1111/gfs.12124
Maljanen, M., Virkajärvi, P., Hytönen, J., Öquist, M., Sparrman, T., and Martikainen, P. J. (2009). Nitrous oxide production in boreal soils with variable organic matter content at low temperature – snow manipulation experiment. Biogeosciences 6, 2461–2473. doi: 10.5194/bg-6-2461-2009
Mammarella, I., Peltola, O., Nordbo, A., Järvi, L., and Rannik, Ü. (2016). Quantifying the uncertainty of eddy covariance fluxes due to the use of different software packages and combinations of processing steps in two contrasting ecosystems. Atmos. Meas. Tech. 9, 4915–4933. doi: 10.5194/amt-9-4915-2016
Miao, F., Li, Y., Cui, S., Jagadamma, S., Yang, G., and Zhang, Q. (2019). Soil extracellular enzyme activities under long-term fertilization management in the croplands of China: a meta-analysis. Nutr. Cycl. Agroecosyst. 114, 125–138. doi: 10.1007/s10705-019-09991-2
Olesen, J. E., and Bindi, M. (2002). Consequences of climate change for European agricultural productivity, land use and policy. Eur. J. Agron. 16, 239–262. doi: 10.1016/S1161-0301(02)00004-7
Pinheiro, J., Bates, D., DebRoy, S., and Sarkar, D., (2014). Nlme: linear and nonlinear mixed effects models. R package version 3.1–117.
Rannik, Ü., and Vesala, T. (1999). Autoregressive filtering versus linear detrending in estimation of fluxes by the eddy covariance method. Bound.-Layer Meteorol. 91, 259–280. doi: 10.1023/A:1001840416858
Reichstein, M., Falge, E., Baldocchi, D., Papale, D., Aubinet, M., Berbigier, P., et al. (2005). On the separation of net ecosystem exchange into assimilation and ecosystem respiration: review and improved algorithm. Glob. Chang. Biol. 11, 1424–1439. doi: 10.1111/j.1365-2486.2005.001002.x
Riesinger, P., and Herzon, I. (2008). Variability of herbage production in mixed leys as related to ley age and environmental factors: a farm survey. Agric. Food Sci. 17:394. doi: 10.2137/145960608787235522
Ruosteenoja, K., Jylhä, K., and Kämäräinen, M. (2016). Climate projections for Finland under the RCP forcing scenarios. Geophysica 51, 17–50.
Ruosteenoja, K., Räisänen, J., and Pirinen, P. (2011). Projected changes in thermal seasons and the growing season in Finland. Int. J. Climatol. 31, 1473–1487. doi: 10.1002/joc.2171
Rutledge, S., Wall, A. M., Mudge, P. L., Troughton, B., Campbell, D. I., Pronger, J., et al. (2017). The carbon balance of temperate grasslands part I: the impact of increased species diversity. Agric. Ecosyst. Environ. 239, 310–323. doi: 10.1016/j.agee.2017.01.039
Schotanus, P., Nieuwstadt, F. T. M., and De Bruin, H. A. R. (1983). Temperature measurement with a sonic anemometer and its application to heat and moisture fluxes. Bound.-Layer Meteorol. 26, 81–93. doi: 10.1007/BF00164332
Suter, M., Connolly, J., Finn, J. A., Loges, R., Kirwan, L., Sebastià, M. T., et al. (2015). Nitrogen yield advantage from grass–legume mixtures is robust over a wide range of legume proportions and environmental conditions. Glob. Chang. Biol. 21, 2424–2438. doi: 10.1111/gcb.12880
Virkajärvi, P., Rinne, M., Mononen, J., Niskanen, O., Järvenranta, K., and Sairanen, A. (2015). Dairy production systems in Finland. Grassland Sci. in Eur. 20, 51–66.
Keywords: agricultural sustainability, boreal environment, climate change, GHG exchange, Trifolium pratense
Citation: Li Y, Korhonen P, Kykkänen S, Maljanen M, Virkajärvi P and Shurpali NJ (2023) Management practices during the renewal year affect the carbon balance of a boreal legume grassland. Front. Sustain. Food Syst. 7:1158250. doi: 10.3389/fsufs.2023.1158250
Edited by:
Meraj Alam Ansari, ICAR-Indian Institute of Farming System Research, IndiaReviewed by:
Debashis Dutta, Indian Institute of Farming Systems Research, IndiaCopyright © 2023 Li, Korhonen, Kykkänen, Maljanen, Virkajärvi and Shurpali. This is an open-access article distributed under the terms of the Creative Commons Attribution License (CC BY). The use, distribution or reproduction in other forums is permitted, provided the original author(s) and the copyright owner(s) are credited and that the original publication in this journal is cited, in accordance with accepted academic practice. No use, distribution or reproduction is permitted which does not comply with these terms.
*Correspondence: Yuan Li, eXVhbmxpQGx6dS5lZHUuY24=; Narasinha J. Shurpali, bmFyYXNpbmhhLnNodXJwYWxpQGx1a2UuZmk=
Disclaimer: All claims expressed in this article are solely those of the authors and do not necessarily represent those of their affiliated organizations, or those of the publisher, the editors and the reviewers. Any product that may be evaluated in this article or claim that may be made by its manufacturer is not guaranteed or endorsed by the publisher.
Research integrity at Frontiers
Learn more about the work of our research integrity team to safeguard the quality of each article we publish.