 Biplab Mitra1
 Prantick Singha1Arnab Roy Chowdhury1
 Abhas Kumar Sinha2
 Milan Skalicky3Alison M. Laing4Saud Alamri5
 Akbar Hossain6*†
- 1Department of Agronomy, Uttar Banga Krishi Viswavidyalaya, Cooch Behar, West Bengal, India
- 2Department of Soil Science and Agricultural Chemistry, Uttar Banga Krishi Viswavidyalaya, Cooch Behar, West Bengal, India
- 3Department of Botany and Plant Physiology, Faculty of Agrobiology, Food, and Natural Resources, Czech University of Life Sciences Prague, Prague, Czechia
- 4CSIRO Agriculture and Food, Brisbane, QLD, Australia
- 5Department of Botany and Microbiology, College of Science, King Saud University, Riyadh, Saudi Arabia
- 6Division of Soil Science, Bangladesh Wheat and Maize Research Institute, Dinajpur, Bangladesh
An optical sensor like Green Seeker (GS) is an emerging tool for site-specific in-season fertilizer nitrogen management strategy. The objective of this study was to establish an in-season estimate of yield (INSEY)–grain yield (GY) relation in wheat grown under Eastern plains of India using normalized difference vegetation index (NDVI) at 45 and 65 days after sowing (DAS). Data revealed lower NDVI values at 65 DAS over 45 DAS in no-nitrogen (N), phosphorus (P), and potassium (K) applied control plots as well as in N-rich plots (225 kg ha−1 N); on the contrary, the values were higher at 65 DAS over 45 DAS in treatments where some N fertilizers were added based on NDVI readings at 45 DAS. Response index (RI) showed higher chances of response to external application of N in NDVI-based treatments. The INSEY–GY relation for wheat at 45 and 65 DAS was worked out as a power function of y = 64265x1.171 and y = 46949x1.036 (y is the attainable yield in kg ha−1 and x is INSEY), respectively. The yields could fairly be predicted through this relation even at 45 DAS, though the relationship was more robust at 65 DAS (R2 = 0.94). A prescriptive dose of 60 kg N ha−1 as basal + 60 kg N ha−1 at crown root initiation (CRI) stage followed by NDVI sensor-guided N application (at 45 and 65 DAS) brought about a significant improvement in yield performances, N use efficiencies with higher net returns, and benefit-to-cost ratio. The results proved the reliability of the NDVI sensor as an important tool for the optimization of fertilizer nitrogen in wheat grown under the Eastern plains of India. The new INSEY–GY relation developed through this trial could successfully be used for yield prediction in the Eastern plains of India under changing climate.
1. Introduction
Rice (Oryza sativa L.) and wheat (Triticum aestivum L.) are a staple food for a large population in South Asia, and their assured supply is essential for the food security of this region. Thus, this rice–wheat cropping is one of the most important systems in the entire Indo-Gangetic plains (IGP), covering countries such as India, Bangladesh, Nepal, and Pakistan. Only in the Eastern Gangetic plains, the rice–wheat cropping system is practiced on over 6.22 million hectares (Timsina et al., 2018), and the farmers of the entire IGP continue to intensify growing wheat as a winter season crop due to high subsidies for power, fertilizer, and irrigation water, and well-developed production and marketing systems (Saharawat et al., 2009). The crop yields of the Eastern Gangetic plains are, however, low due to a range of biophysical (poor soil fertility status, imbalanced fertilization, water and temperature stress, pest and disease infestation, and high weed pressure) factors (Islam et al., 2019). In the rice–wheat system, sub-optimal nutrient management in these tracts results in low nutrient use efficiency, nutrient mining, as well as monetary loss (Dhawan et al., 2021). Soils of India, Eastern plains in particular, are inherently deficient in N supply because of the topographical location in the subtropical climate that hinder the accumulation of soil organic matter, a primary source of soil N (Dwivedi et al., 2017). Again, N is highly mobile in the soil–plant system and prone to losses resulting in reduced recovery of applied N by the crop, making it difficult for its efficient management (Ladha et al., 2005). The contribution of N fertilizer to increased global food production cannot be ignored for feeding the ever-growing human population. On the contrary, the soils of Eastern India are not so deficient in P and K in general. Thus, better nutritional management, nitrogen in particular, needs immediate attention for maintaining the sustainability of the rice–wheat system which suffers from production fatigue.
As a general cultivation practice, all phosphatic and potassic fertilizers along with 50% of N are applied as basal at final land preparation just before the seeding of wheat; the rest of 50% N is top-dressed either one or two times based on irrigation events (Pathak et al., 2006). Due to the large-scale blanket application of fertilizers, particularly N fertilizers over the region, the nitrogen use efficiency suffers to a great extent (Majumdar et al., 2013; Mitra et al., 2019), and as reported by Dobermann et al. (2003), there is large spatial and temporal variability of soil N which exists in this region contributing to poor fertilizer use efficiency, N in particular.
As reported from various experiments carried out over these Eastern plains, split application of N fertilizers was found to perform much better toward the enhancement of crop productivity as well as nitrogen use efficiency (NUE) (Rahman et al., 2002; Majumdar et al., 2013; Singha and Mitra, 2020). However, the number of splits and quantities of N to be applied in each split is a debatable issue in fertilizer management for maximizing wheat yield with better NUE as there are contradictory references. We know NUE is affected by soil type, temperature regimes, the application rate of N fertilizer, soil moisture conditions, and crop rotation (Halvorson et al., 2002). We have tried using a leaf color chart (LCC) and Soil Plant Analysis Development (SPAD) chlorophyll meter for better synchronization of N application in wheat, as these are simple handheld devices that are used for rapid, non-destructive measurement of leaf chlorophyll. It was found that these handheld diagnostic tools are very reliable in real-time N management in certain crops (Ladha et al., 2005), but these tools have the greatest limitations in that we are simply taking into account the leaf color, not taking into account the photosynthetic rates or total biomass production of the crop or even expected yields in working out fertilizer requirement, especially N. Under the circumstances, the use of Green Seeker (GS), an optical sensor, could measure the spectral vegetation index—the normalized difference vegetation index (NDVI) which is linked with leaf area as well as green biomass (Raun et al., 2002). An index of an in-season estimate of yield (INSEY) could be worked out as a measure of the accumulated biomass per day from the time of seeding to the day of taking observation through the sensor. INSEY could help guide N application, and this INSEY–grain yield (GY) relation could optimize N scheduling in wheat successfully (Singh et al., 2011) as witnessed in the northwestern plains, the wheat bowl of India. We strongly believe that there is a huge difference in crop expression over the entire Eastern plains in comparison to the northwestern plains for which the GY-INSEY relation would be different for this zone; however, no such study has yet been conducted in the Eastern plains of India to precisely manage fertilizer N in wheat using NDVI sensor. Keeping these in the background, the present experiment has been planned to optimize N scheduling in wheat through the use of NDVI sensor-GS, and we have tried to establish a new equation for in-season prediction of wheat yield using NDVI sensor for this Eastern plains of India.
2. Materials and methods
2.1. Experimental site
The study was conducted in the research field of ‘Uttar Banga Krishi Viswavidyalaya’ (UBKV), Cooch Behar, West Bengal, India (26°24'02.2”N latitude, 89°23'21.7”E longitude, 43 msl), in two consecutive wheat seasons during 2017–2018 and 2018–2019. The soil, on which the experiment was carried out, was sandy loam in texture with a good drainage facility having pH 5.78 with 0.83% organic C, 188.16 kg ha−1 mineralizable nitrogen, 27.05 kg ha−1 available phosphorus, and 141.90 kg ha−1 available potassium.
2.2. Agroclimatic conditions
Being located in a subtropical humid climate, the experimental site receives higher annual rainfall (3,000 mm); however, a major proportion of the total rainfall (2,200–2,500 mm) is received during monsoon months (June–September), keeping the winter season almost dry. The temperature began to rise from February to March and reached its peak from April to May. The relative humidity remained very high almost throughout the year except during the winter season. During the wheat crop growing period, there was not much variation in minimum and maximum temperatures (data not given) during both years and fair cool weather during vegetative growth and a bit of warm weather during later stages prevailed suggesting an overall favorable temperature regime for the crop during both the seasons. In both years, the crop received rainfall (36 mm and 9.62 mm during 2017–2018 and 2018–2019, respectively) during March when the crop was almost at maturity.
2.3. Treatment details
The experiment was laid out in a randomized block besign (RBD) comprised of 10 treatments of different N scheduling including the use of NDVI sensor-GS. The treatments comprising of T1 = absolute control (no application of NPK); T2 = 150 kg ha−1 N (1/2 as basal + 1/4thCRI + 1/4th active tillering); T3 = 120 kg ha−1 N (1/2 as basal + 1/4thCRI + 1/4th active tillering); T4 = 150 kg ha−1 N (1/2 as basal + 1/2 CRI); T5 = 120 kg ha−1 N (1/2 as basal + 1/2 CRI); T6 = 30 kg N ha−1 as basal +30 kg N ha−1 at CRI + NDVI sensor-based N; T7 = 30 kg N ha−1 as basal +60 kg N ha−1at CRI + NDVI; T8 = 60 kg N ha−1 as basal +60 kg N ha−1at CRI + NDVI; T9 = 60 kg N ha−1 as basal +30 kg N ha−1at CRI + NDVI; and T10 = N-rich 225 kg ha−1 N (1/2 as basal + 1/2 CRI). The NDVI data were taken at 45 and 65 days after sowing (DAS) coinciding with the second and third irrigation events. Each treatment was replicated three times. The sizes of each experimental plot were 8 m x 2 m.
2.4. Crop management practices
The land preparation started with plowing twice using a tractor-drawn cultivator. The soil was kept open for the next 10 days for bringing down the soil moisture. Afterward, a rotavator was used criss-cross for bringing the desirable tilth. The phosphorus (60 kg ha−1 P2O5) and potassium (40 kg ha−1 K2O) were supplied uniformly in all the treatments except control (T1) through single super phosphate and muriate of potash, respectively. HD 2967, a recommended high-yielding variety for the timely sown irrigated condition under this zone (Eastern plains of India) having a yield potential of 6.2 t ha−1, was used in this experiment. This variety ‘HD 2967’ was developed by the Indian Agricultural Research Institute, New Delhi, India, and the pedigree of the variety is ALONDRA/CUCKOO/URES-81/HD-2160-M/HD-2278[4251][4282]; HD-2733/K-9423/K-9351 [4281]. After treating the seeds with carbendazim @ 2.5 g kg−1 of seeds, the seeds were sown in lines 20 cm apart at 2–3 cm depth with a seed rate of 100 kg ha−1. Metribuzin at 300 g ha−1 was used as pre-emergence herbicides to keep the experimental plots free from weeds during initial growth, while the later flashes of broad-leaved weeds were controlled through post-emergence Carfentrazone at 20 g ha−1, applied 4 weeks after sowing. Considering the B and Zn deficiency in this zone, soluble B (0.2%) and chelated Zn (0.1%) were applied as foliar spray twice at 35 and 55 DAS. The crop received four irrigations at CRI, active tillering, jointing, and milking stage in both years. The crop was harvested manually, and the yield was estimated based on the net plot of 12.8 m2 (8 inner lines, each of 8 m length with 20 cm spacing) excluding the border rows. Grain yield was recorded at 12% moisture content.
2.5. Soil and plant analyses
The pH of the experimental soil was determined with Sorensen's pH meter (1909), using soil–water suspension (1:2.5) by the potentiometric method. Mineralizable nitrogen and available phosphorus and potassium were analyzed using the hot alkaline potassium permanganate method (Subbaih and Asija, 1956), Olsen's method (Olsen et al., 1954), and the neutral ammonium acetate-flame photometer method (Brown and Warncke, 1988), respectively; the wet digestion method was followed for determining organic C (Walkley and Black, 1934). Aerial plant parts were separated into grain and straw. After crushing, samples were prepared for grain and straw nitrogen content separately. The total N content in plants was determined by the modified micro-Kjeldahl method (Jackson, 1973). The total uptake of nitrogen by wheat at harvest was determined on a dry weight basis by multiplying the total dry matter of the crop with its corresponding content of nitrogen. It was expressed in kg ha−1.
2.6. Observations based on NDVI sensor
Normalized difference vegetation index (NDVI), a good indicator of green biomass, was determined by dividing the difference between near-infrared and red wavebands by the sum of these two wavebands. In general, NDVI values range from −1.0 to 1.0, with negative values indicating clouds, water surfaces, rocks, snow, etc; bare soils usually have lower positive values (0.10–0.15), and plants will always have higher positive values above 0.2 (sparse vegetation within 0.4–0.5 while dense vegetation has 0.5 and above). Several studies have shown that the NDVI value of a matured wheat crop ranges between 0.4 and 0.8 depending on variety and climatic conditions (Thapa et al., 2019; Gozdowski et al., 2020). In the present experiment, GS was calibrated based on the value of NDVI reading in the N-rich treatment where 225 kg N ha−1 was applied. NDVI sensor-GS was used for the splitting of nitrogen in four treatments (T6, T7, T8, and T9) in the present experiment. The sensor was passed over the crop at a height of approximately 0.9 m above the crop canopy and oriented so that the 0.6 m sensed width was perpendicular to the row and centered over the row. With the advancing stage of growth, sensor height above the ground increased proportionally. Nitrogen doses using NDVI-GS were calculated as per the following discrete components:
2.6.1. Normalized difference vegetation index
Normalized difference vegetation index (NDVI) measurements made by Green Seeker were based on the following formula as given by Raun et al. (2002) and Singh et al. (2011):
NDVI = [(NIRref/NIRinc)-(Redref/Redinc)]/ [(NIRref/NIRinc) + (Redref/Redinc)]
where NIRref and Redref = magnitude of reflected near-infrared and red lights; NIRinc and Redinc = magnitude of the incident near-infrared and red lights.
2.6.2. In-season estimation of yield
In-season estimation of yield (INSEY) was expressed as the measure of the daily accumulated biomass from the time of planting to the day of sensing. It was measured based on the following formula as given by Raun et al. (2002) and Singh et al. (2011):
2.6.3. Yield potential with no added inputs (YP0)
Yield potential (YP0) with no added fertilizer was calculated from the following power equation model as given by Raun et al. (2002) and Singh et al. (2011):
where the values of constants ‘a’ and ‘b’ were used as depicted in graphs; the Coefficient of Determination (R2) value was also determined using MS Excel.
2.6.4. Response index (RINDVI)
The magnitude of response to N fertilization was predicted from RINDVI as per the following formula given by Raun et al. (2002) and Singh et al. (2011):
One N-rich strip (NRS) was laid out along with experiment (T10) as a prerequisite for precisely working out the N requirement based on the possible response of that crop to applied N.
2.6.5. Predicted attainable yield (YPN)
The yield potential achievable with applied N fertilizer (YPN) was predicted based on RI and YP0.
For a particular treatment before any mid-term N application, yield could be predicted by YPN/RI as RI represented the percent yield increment to achieve the attainable grain yield (5 t ha−1 for the present experiment).
2.6.6. Fertilizer N recommendation
The fertilizer N dose was calculated based on the following formula as given by Singh et al. (2011) and Ratanoo et al. (2018a):
The average percentage of N in grain at harvest was 1.8% over IGP. The divisor 0.5 represents the fertilizer N use efficiency factor of 50% for wheat.
In the third year, GS-based nitrogen recommendations were put under farmers' participatory demonstration in which five doses (60, 90, and 120 kg N ha−1 upto CRI followed by GS at 45 and 65 DAS along with absolute control and N-rich strip at 225 kg N ha−1) were validated.
2.6.7. NUE indices
The following NUE indices were worked out as per the standard formula:
• Agronomic N-use efficiency (kg grain kg−1 nutrient applied over control) = [yield under test treatment (kg ha−1)–yield under control (kg ha−1)]/[unit of nitrogen applied in the treatment (kg ha−1)].
• Physiological efficiency (kg biomass kg−1 nutrient uptake) = [(biomass yield under fertilizer treatment (kg ha−1) – biomass yield under control (kg ha−1)]/[(N uptake of nutrient in test treatment (kg ha−1) – N uptake of nutrient in control (kg ha−1)].
2.7. Production economics
To identify the most remunerative treatment, the economic parameters viz., the total cost of cultivation ( ha−1), gross return (ha−1), net return (ha−1), and benefit-to-cost ratio (B:C) were calculated for wheat grown under various N scheduling and interpreted accordingly. In the calculation of the economics of cultivation, the purchase rates of inputs and the selling rates of outputs were assumed as per the prevailing local market rates.
2.8. Statistical analyses
The data were analyzed on an individual year basis using the analysis of variance (ANOVA) method for RBD. The significance of various sources of variation was tested by the mean square error by Fisher–Snedecorst “F” test at probability levels of 0.05 (Cochran and Cox, 1955; Panse and Sukhatme, 1967). Mean separation for different treatments under different parameters was performed using Tukey's honestly significant difference (HSD) test (p ≤ 0.05).
The functional relation between INSEY and grain yield was expressed in a power function as follows: yield without further addition of N = a (INSEY)b; the values of constants a and b were depicted from graphs; and coefficient of determination (R2) value was also determined using MS Excel.
3. Results and discussion
3.1. NDVI values
Normalized difference vegetation index (NDVI) values were taken at two stages of crop growth, i.e., at 45 and at 65 days after sowing (DAS). These two stages were coinciding with the second and third irrigation for the wheat crop. For calculating the amount of nitrogen required for topdressing (if any) during the second and third irrigation, NDVI readings were taken during these 2 days. Sixty five days old wheat crop was just prior to or at beginning of jointing stage, the last stage for prescriptive nitrogen management in wheat (Ali et al., 2020). Before taking this reading, only one split of N was applied at the crown root initiation (CRI) stage except for the absolute control. NDVI values varied significantly under various N splitting treatments, and it ranged from 0.29 under absolute control to 0.77 under N-rich plots where 225 kg ha−1 of N was applied during 2017–2018 (Table 1). The trend was similar in 2018–2019 also, where NDVI values ranged between 0.29 and 0.78 under absolute control and N-rich plots, respectively (Table 2).
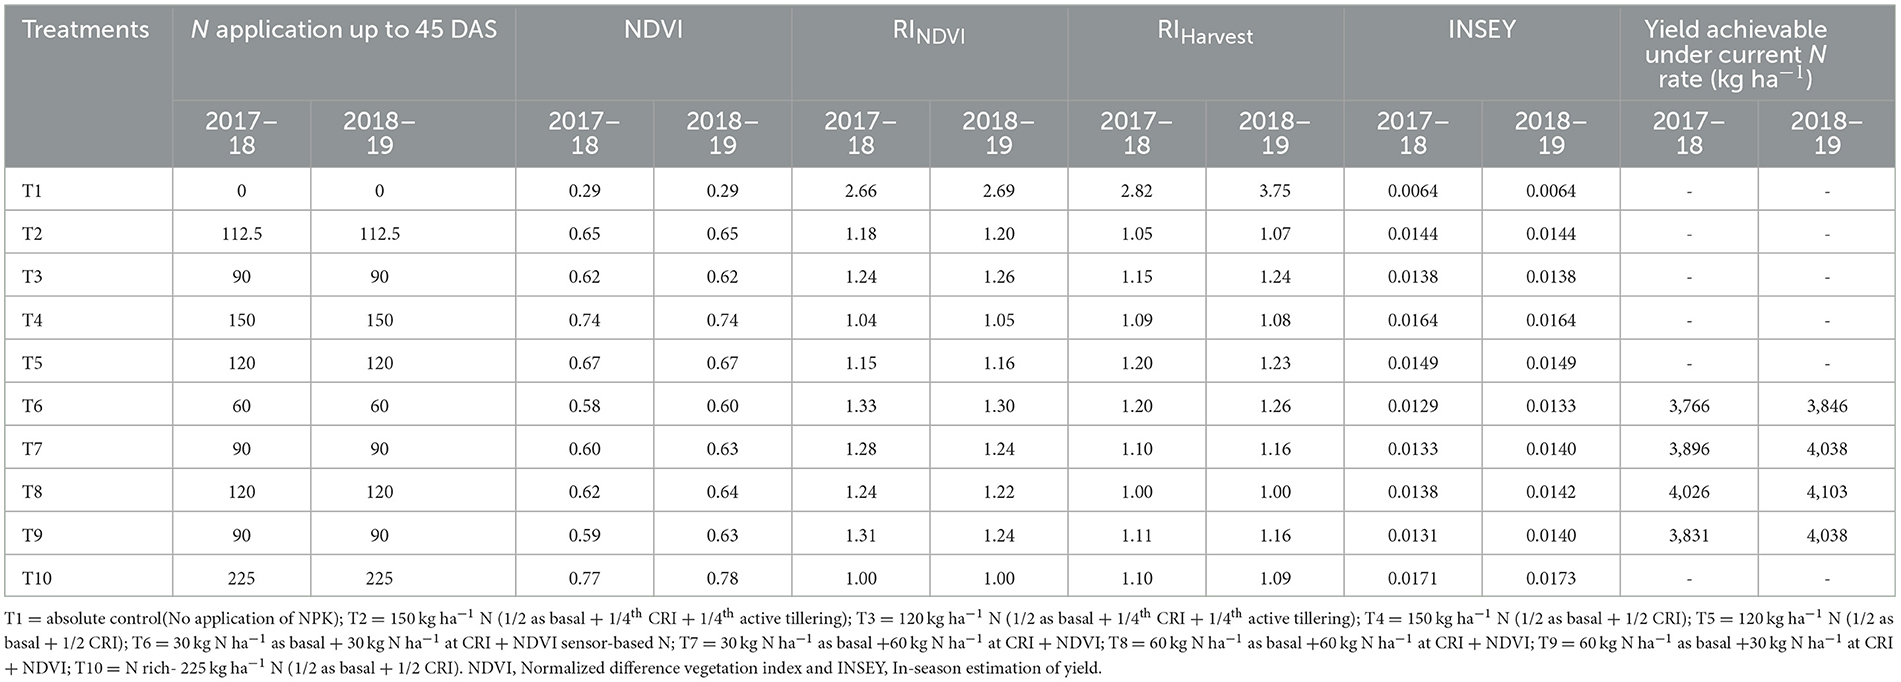
Table 1. Evaluation of NDVI sensor-based N management in wheat at 45 days after sowing.
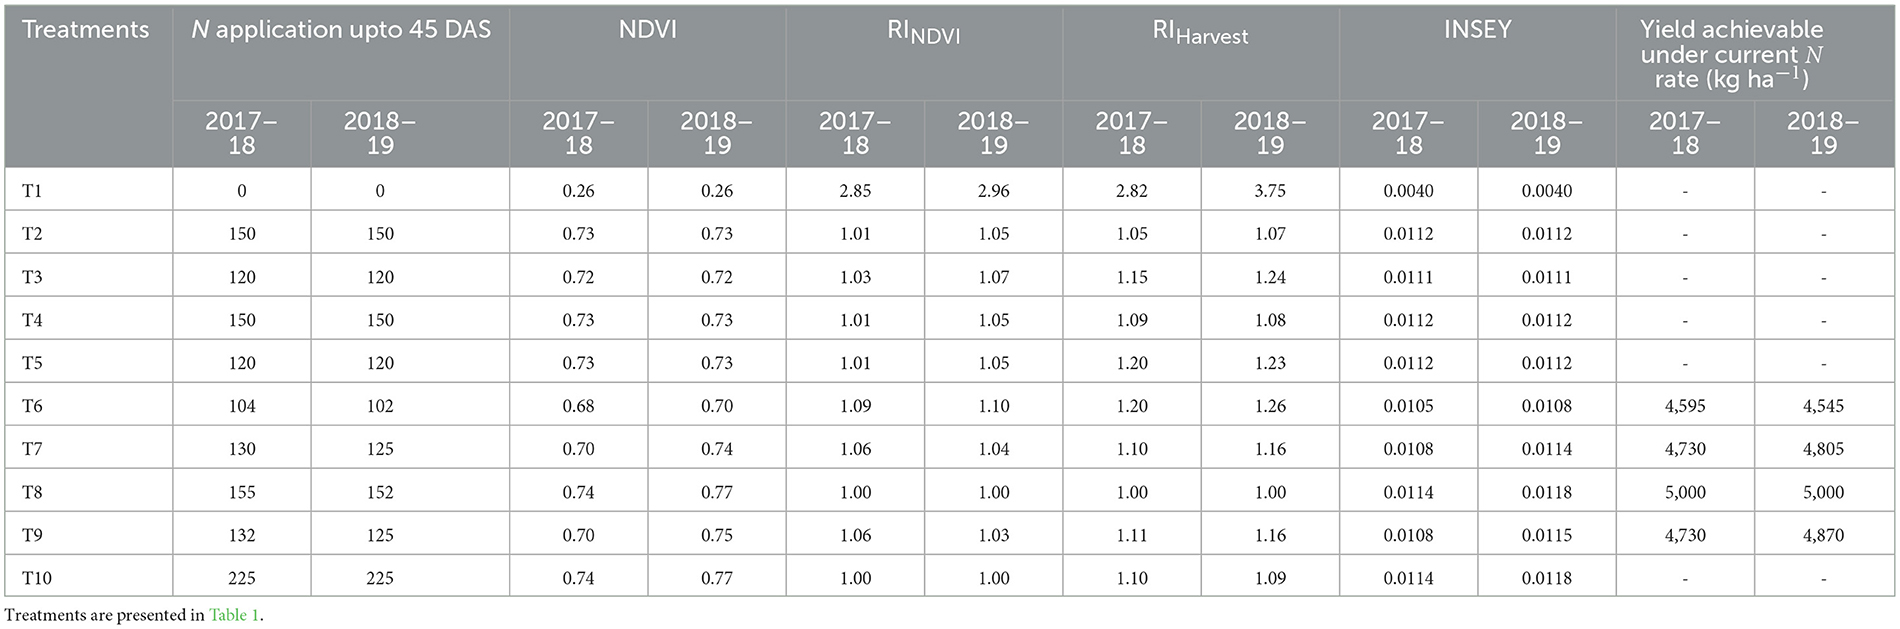
Table 2. Evaluation of NDVI sensor-based N management in wheat at 65 days after sowing.
In both the years where 225kg ha−1 of N was applied (N-rich treatment), the NDVI value showed a higher value (0.74) as compared with other treatments at 45 DAS. As nitrogen was not applied in control plots (T1), the leaves were lacking greenness; in contrast, the leaves were dark green under N-rich plots (T10) due to excess N application. Even in treatments where 150 kg ha−1 of N was applied, NDVI values were fairly higher due to greener leaves. It was noted that the NDVI values at 65 DAS were lesser than NDVI values recorded at 45 DAS in control plots as well as N-rich plots; on the contrary, the values were higher at 65 DAS over 45 DAS in most of the treatments, particularly in treatments where some N fertilizers were added based on NDVI readings at 45 DAS. As there was no further addition of N fertilizers after the CRI stage in N-rich plots (T10) as well as in T4 and T5, the canopy greenness was gradually reduced. The addition of N at 45 DAS helped the crop to improve the canopy greenness afterward reflected through higher NDVI values. In general, NDVI values at 45 days were higher in treatments having higher doses of fixed rate of N at planting and CRI stages; while at 65 DAS, the increase in NDVI values was more in treatments having N application at 45 DAS coinciding with the second irrigation. Ratanoo et al. (2018a) recorded 11.7% to 22.2% increase in NDVI values in treatments receiving N with irrigation events. NDVI measurements at proper growth stages are very important, as the relationship between in-season estimation and grain yields is purely based on NDVI readings.
3.2. Response index (RI)
The response index (RI) was computed based on NDVI values at 45 DAS, and the RI data presented in Tables 1, 2 indicated a significant difference among various treatments comprising various splitting of N applications. RINDVI was very useful in predicting the response of the crop to added N application. Being the ratio between NDVI-rich N plots and the NDVI-treatment plots, the values were higher in control plots (2.66 and 2.69 during 2017–2018 and 2018–2019, respectively), signifying higher chances of those plots responding to external application of N. It was evident that in treatments where higher amounts of N were added within 45 DAS, there were lower values of RINDVI, and in contrast, RINDVI values were higher in treatments with a lesser amount of N application. It indicated that a lesser amount of N was necessary to attain the target yield for plots with higher N fertilization; on the contrary, there might be higher responses from external N application in plots receiving lower N for attaining the yield target.
RINDVI values at 45 DAS were ranging between 1.04 to 1.24 and 1.05 to 1.26 under fixed N-applied plots (T2-T5) during 2017–2018 and 2018–2019, respectively; whereas it ranged between 1.24 to 1.33 and 1.22 to 1.30 during 2017–2018 and 2018–2019, respectively under the Green Seeker (GS)-guided N application plots (T6–T9) (Tables 1, 2). It signified that a 4–26% yield increment could be possible through N application for fixed N-applied plots while a 22–33% increase in yield could be possible in GS-guided N-treatments. In fixed N-treated plots, the N application rate was quite higher at the initial stages (upto CRI) than in GS-guided N application treatments (T6–T9), where the rate of N application was initially lesser, making an avenue for more application in subsequent stages based on NDVI sensor-provided values. RINDVI values were closely related to RIHarvest during both 45 and 65 DAS. Johnson and Raun (2003) found a positive correlation between RI NDVI and RIHarvest at Feekes 5–6 (in our experiment, it coincided with 45 DAS) and Feekes 7–8 (in our experiment, it coincided with 65 DAS). Mullen et al. (2003) obtained similar relationships between RINDVI and RIHarvest with data recorded at different growth stages of winter wheat. This was in line with the findings of Ratanoo et al. (2018a) who showed higher RI in NDVI-treated plots over fixed N-treated plots. It was evident that the values were in general narrower at 65 days over the values at 45 days. With the advancement of crop age, the responsiveness of the crop toward the external application of N was gradually reduced, as the crop had a narrower window to utilize the added N. The crop was moving toward its reproductive phase, and the addition of N fertilizer after 65 days was perceived to be less responsive for the crop. It was evident that in GS-guided treatments where higher amounts of total N (152–155 kg ha−1 of N) were added upto 65 DAS (T8), RI value was 1.00 (similar to N-rich plots), indicating no further requirement of N beyond this point for attaining the target yield. Raun et al. (2001) reported higher RI values with the treatment comprising no pre-plant N application as compared with the values resulting from pre-plant N application. It was also evident that the application of comparatively lower doses of nitrogen at early stages of growth and thereafter N application using response index could be a powerful tool to attain the desired grain yield without much increase in the rate of N application. Lower values of response index at later growth stages could be attributed to canopy closure influence on the sensor as noted by Teal et al. (2006) in maize and Ali et al. (2014) in direct-seeded rice. NDVI readings vis-à-vis response index, when captured at the jointing stage (65 DAS), could explain the variability in yields at maturity (Ali et al., 2020).
3.3. In-season estimation of yield (INSEY)
In-Season Estimation of Yield (INSEY) was determined by using NDVI values and the crop age at the date of sensing. At 45 DAS during both years, this value was lowest in the control plot, while it was the highest for N-rich plots (Tables 1, 2). As this value was basically an indicator of per day dry matter production of the crop, it was clear that biomass production per day was lowest for control plots and highest under N-rich plots at 45 DAS. Actually, the treatment receiving more N during the initial part of the growth recorded higher INSEY at 45 DAS as this treatment showed higher canopy greenness as reflected through higher NDVI values.
However, this estimation was too early from the overall perspective as the scenario changed afterward through another split application which was still awaited at 45 DAS. For GS-based treatments (T6–T9), the values were comparatively lesser over fixed N-treated (T2–T5) plots at 45 DAS. This was attributed to the lower rate of N application up to 45 DAS in GS-guided plots. At 65 DAS during both years, this value was highest in plots fertilized with 60 kg ha−1 of N as basal plus 60 kg ha−1 of N at CRI and another 32–35 kg ha−1 at 45 DAS (T8) which was similar or even higher than the INSEY obtained in N-rich plots. A fair amount of N addition through the NDVI sensor at 45 days helped to increase INSEY in T8 signifying higher production of dry matter per day under the treatment. Despite a higher total application of N (225 kg ha−1) under N-rich strips (T10), no addition of N at 45 DAS reduced the chances of further enhancement of INSEY values. The treatment receiving better splitting of N guided through GS was supposed to be a powerful tool for harnessing the yield of wheat with better N management. It was noted that in all the treatments having different N splits, INSEY was much lower during 65 DAS than 45 DAS, despite some improvements in NDVI values in 65 DAS. This was attributed to higher crop age as the crop almost progressed toward its reproductive growth. However, in-season estimation of yield at 65 days of crop age could give a more reliable estimate than its estimation at 45 DAS.
Figures 1A, B shows the INSEY-grain yield (GY) relation for wheat at 45 and 65 DAS, respectively (we have used the station trial data for 2 years as well as the data from the farmers' field during the third year for validation). This relation was expressed as a power function by using the following equations:
In these equations, y is attainable yield in kg ha−1and x is INSEY.
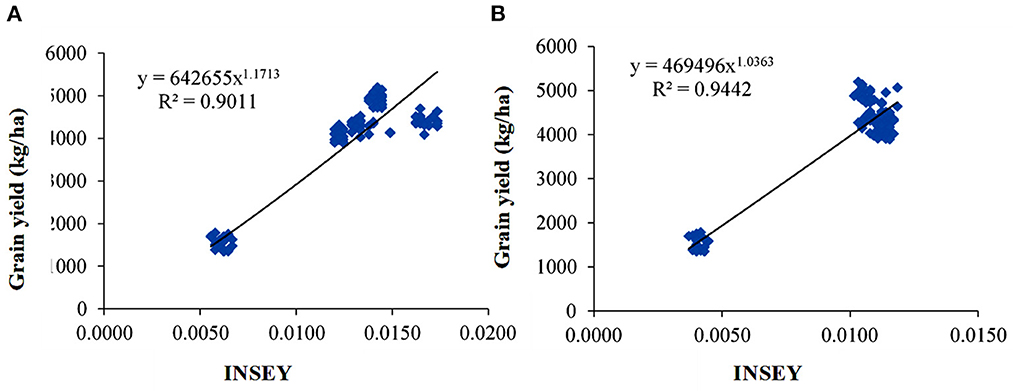
Figure 1. *GY–INSEY relationship at (A): 45 and (B): 65 DAS. *2017–2018 and 2018–2019 station data and 2019–2020 farmers' field data were used in developing the relation.
A value of R2 during 45 DAS (0.90) suggested that even at 45 DAS, the yields could be predicted fairly. This stage actually coincided with Feeks 5–6 stages when the first node appeared on the plant. This relationship was more robust at 65 DAS as reflected by the R2 value (0.94), which coincided with Feeks 7–8 stage when the flag leaf developed with more visible nodes. These equations were suggestive of the wider applicability of this relation in predicting the midterm yields of wheat, and these equations may be used for this zone while going for N application in wheat through an optical sensor. The robust relationships between in-season sensor-based estimates of yield at Feekes 5–6 and 7–8 stages and actual wheat yields under the northwestern plains of India were previously reported (Singh et al., 2011; Ratanoo et al., 2018a,b). The response of wheat to fertilizer N defined by the sensor was highly correlated with the response index. Gupta (2006) also studied the effect of crop canopy sensors on efficient nitrogen management in Indo-Gangetic plains. Farmers cannot produce the same yields from the same fields every year, despite the same cultivar being planted on the same date with similar management practices. This is due to temporal variability in crop growth which has higher impacts on yield levels through variable responses to applied N fertilizers. However, an in-season response index based on NDVI readings could represent a viable method or approach for identifying environments where the potential to respond to N fertilizer exists (Ali et al., 2020). In fact, optical sensors have opened up a new approach to acquiring crop growth information in a rapid non-invasive manner (Teal et al., 2006; Zhang et al., 2019).
3.4. Calculated N doses and actual yields
Considering the attainable/target yield of 5 t ha−1, the achievable yield at 45 DAS was estimated for all GS-guided treatments (T6–T9), and it showed that the treatment in which 60 kg ha−1 of N was applied both at basal and at CRI (T8), it recorded the maximum yield (4026 and 4103 kg ha−1 during 2017–2018 and 2018–2019, respectively) with the current rate of fertilizer application without subsequent addition. The amount of N to be applied further to attain the target yield of 5 t ha−1 was worked out for all these treatments, and it showed that for achieving the desired yield target, more N was required for all these treatments. The estimated amount of N was ranging between 35–44 kg ha−1 during 2017–2018 and 32–42 kg ha−1 during 2018–2019 for getting the attainable yield of 5 t ha−1. The situation changed a lot for all GS-guided treatments when the doses were calculated at later dates viz., 65 DAS. The treatment receiving 60 kg ha−1 of N at basal, 60 kg ha−1 of N at CRI, and another 32–35 kg ha−1 of N at 45 DAS based on GS (T8) reached the attainable yield target of 5 t ha−1 itself suggesting no need for further addition of fertilizer to achieve the target yield at 65 DAS. Moreover, for the rest of the GS-guided treatments (T6, T7, and T9), there was still the requirement of some amount of N (lesser than the amount required at 45 DAS) even at this point to achieve the desired yield (Tables 1, 2). However, the application of N at 65 DAS based on the target yield under the other treatments could not achieve the yield target. The crop could not utilize the applied N at later stages, and a portion of it was lost from the soil–plant system as noted by Ali et al. (2015).
Based on the various splitting of N guided through NDVI sensor-GS, there was much variation in overall N management strategies. In some treatments, there were four splitting of N including the basal application during both years of experimentation though the total amount of N added to the crop varied between 118 and 142 kg ha−1. The detailed doses and splitting of N under various treatments, GS-guided treatments in particular, are presented in Table 3.
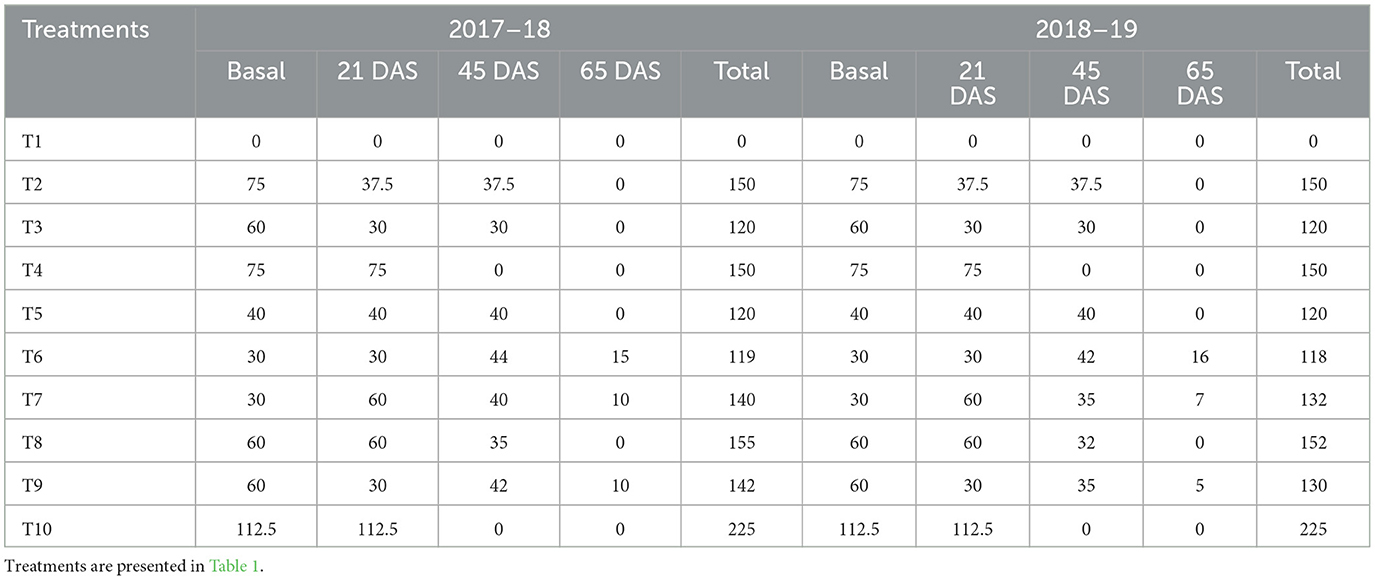
Table 3. Nitrogen application at various growth stages under different treatments.
The estimated yield with GS-based N management was compared with the actual yield obtained under the specified treatment. This comparison could be helpful to assess the actual performance of the crop in relation to various doses and splits of N application, which in turn would validate the findings. Table 4 presents that the maximum grain yield (4.957 and 5.068 t ha−1 during 2017–2018 and 2018–2019, respectively) was achieved with the treatment in which 60 kg N ha−1 was applied as basal+60 kg Nha−1 at CRI +GS-based N application at 45 and 65 DAS (T8). As predicted from the GY–INSEY relation, the actual yield was very close or slightly higher than 5 t ha−1, which validated the robust relation between INSEY and grain yield. In the treatment in which lesser N was applied (T2, T5, and T6), the grain yield was also recorded lower. The actual yields recorded under farmers' fields in the third year also reflected the superiority of GS-guided treatment T8 (data used in INSEY–GY relation Figures 1A, B. It was noted that higher N application during CRI stages followed by further application based on NDVI sensor recorded good yields as compared with lower doses of N application at CRI.
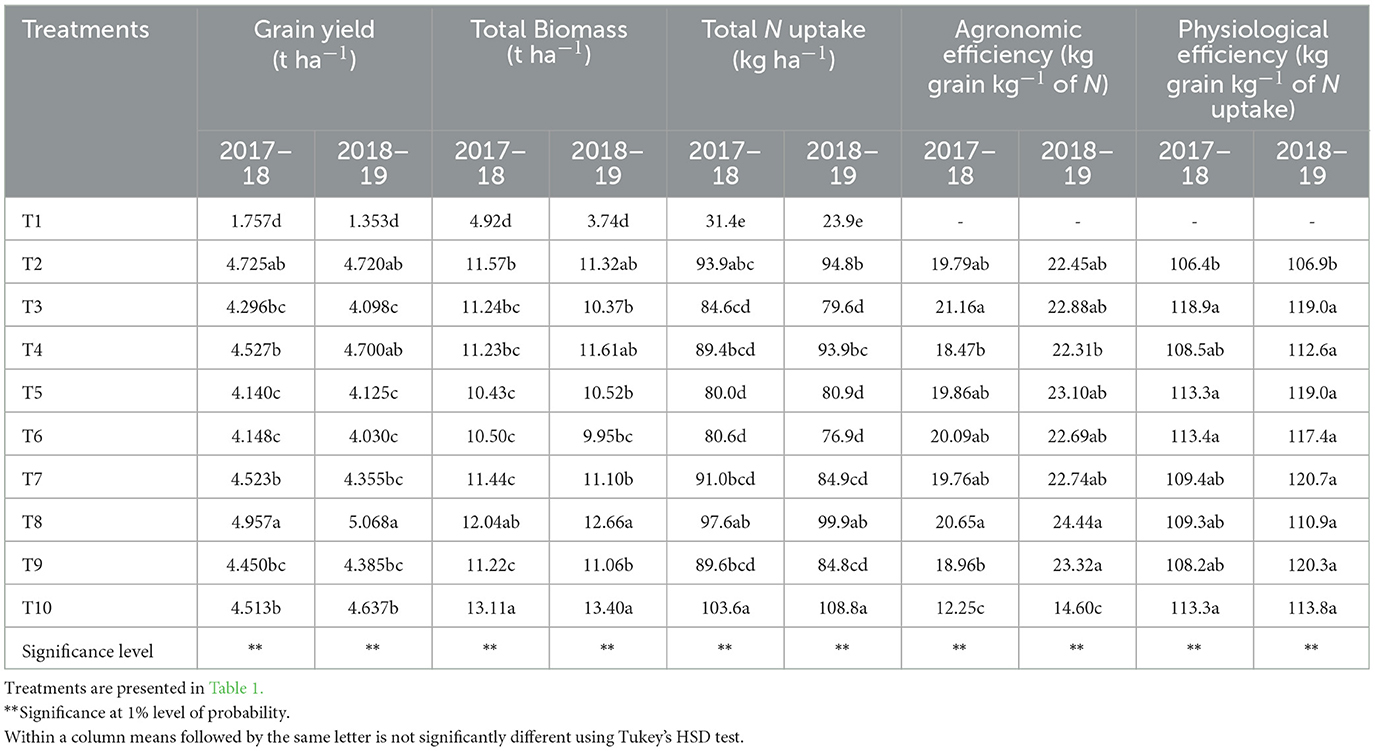
Table 4. Grain yield, total biomass production, and NUE of wheat as influenced by various nitrogen scheduling.
Higher amounts of fertilizer N than the required amount will certainly lead to higher N losses and lower N use efficiency. This GY–INSEY relation suggested that there is a need of synchronizing fertilizer N application with N demand of the crop and N supply from all sources other than fertilizer. In-season estimation is essential for setting up strategies to optimize nitrogen fertilization and reduced environmental risks associated with fertilizer N use (Yao et al., 2012). Several studies indicated the reliability of spectral measurements in estimating the yields of many crops (Feng and Yang, 2011; Ali et al., 2014, 2015, 2018).
3.5. Total N uptake and NUE
Total N uptake varied significantly with respect to various N scheduling during both years of experimentation (Table 4). It was ranging between 31.4 to 103.6 kg ha−1 and 23.9 to 108.8 kg ha−1 during 2017–2018 and 2018–2019, respectively. The maximum uptake was recorded in N-rich treatment followed by GS-guided T8 treatment (60 kg ha−1 applied basal+ 60 kg N ha−1 at CRI and two GS-based applications at 45 and 65 DAS), being statistically at par with each other. In general, in the treatment in which higher doses of N were applied, the total uptake was on the higher side. It was due to higher absorption and translocation of the absorbed N, thereby to the grain part under the treatments in which a higher amount of N was applied; due to higher yields as well as higher N percentage in plant parts, the total uptake was higher. Kumar and Yadav (2005) reported that the time of N application had a significant effect on nitrogen uptake by wheat. The split application of N after the first irrigation significantly increased the N uptake. A significant increase in N uptake in 3-split application over 2-splits was noted at Ludhiana, India (Mattas et al., 2011). While studying the relationship between N uptake and grain yield, Ali et al. (2015) found a weak relationship at early stages due to lower N uptake. However, at later stages, they reported a robust relationship.
With increasing rates of nitrogen application, there was a gradual decline in agronomic NUE and physiological efficiency (PE) ensuing in the law of diminishing return. Increasing the doses of N from 120 to 150 kg ha−1 as well as N-rich plots showed lower agronomic NUE and PE (Table 4). N application at 120 kg ha−1 recorded maximum agronomic and physiological efficiency whether it was applied in two or three splits; among the GS-guided treatments, T8 was comparable with lower doses of N application in terms of NUE. The increase in N use efficiencies was due to the production of similar yields while using lesser N. GS-guided N fertilizer application could effectively manage to avoid yield losses with moderate rates of N fertilizer application. In N-rich plots, the biological yield was very high; hence, despite very high N uptake, the PE value was higher. Haile et al. (2012) reported that yield increased sharply with increasing N application rates, but NUE significantly decreased with increasing N rates. The values indicated that the conversion of applied N to yields was higher at lower levels of N application. Higher NUE in wheat with lesser N application in the Eastern sub-Himalayan plains of West Bengal, India, was reported by Mondal et al. (2018). The study also revealed that the application of N based on an NDVI sensor with more splits was more efficient as indicated by higher values of agronomic efficiency as compared with recommended doses whether it was applied in two or three splits. The NUE in wheat was improved by more than 15% when N fertilization was based on INSEY calculated from optically-sensed NDVI (Raun et al., 2002).
3.6. Production economics
The total cost of cultivation did not vary significantly among various levels of the N schedule. As all other components of the cost of cultivation except N fertilizer were constant for all the treatments (even in control), the treatment in which maximum N was used resulted in the maximum cost of cultivation, and there was not much variation in the total cost of cultivation between treatments. In our experiment, the treatment, in which 225 kg ha−1 of N was applied (T10), recorded the maximum cost of cultivation. There was a significant difference in both gross and net returns achieved with various treatments during both years of experimentation as a huge variation in yields was noted under various treatments. The maximum gross returns, as well as the net returns, were achieved with GS-guided T8 treatment which was significantly higher over all the treatments studied in the experiment (Table 5).
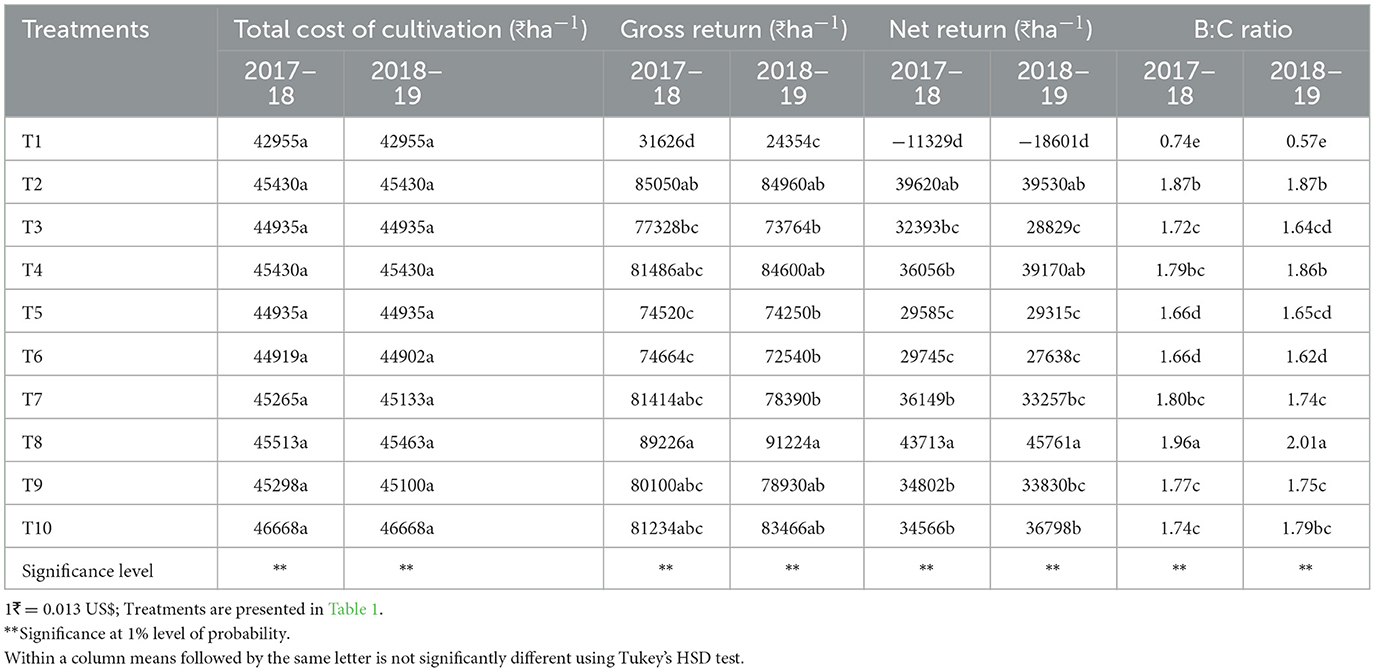
Table 5. Production economics of wheat as influenced by various nitrogen scheduling.
In this split treatment (T8), there was no requirement for extra N application at 65 DAS as reflected by the NDVI sensor though it reflected maximum yields. Mitra et al. (2014) reported higher net return (17,955 ha−1) in ZT wheat with 150 kg N ha−1 under sub-Himalayan plains of India as compared with the application of 100 kg N ha−1 (11,545 ha−1) and 125 kg N ha−1 (14,650 ha−1). As far as the benefit-to-cost ratio (B:C) was concerned, a significantly higher B:C was achieved with T8 (1.96 and 2.01 during 2017–2018 and 2018–2019, respectively). It was followed by the treatment T2 in which the recommended dose of N (150 kg ha−1) was applied in three splits (50% basal and 25% each at CRI and tillering). A dose of 60 kg N ha−1 as basal+ 60 kg N ha−1 at CRI followed by N application guided through GS could fetch higher profitability over the recommended doses of N application. A higher B: C (1.96) in ZT wheat with 150 kg N ha−1over 100 kg N ha−1 (1.64) and 125 kg N ha−1 (1.80) under Eastern sub-Himalayan plains was previously reported by Mitra et al. (2014).
4. Conclusion
It can be concluded from the experimental findings that the application of the NDVI sensor could be an important tool for the optimization of fertilizer nitrogen in wheat grown under the Eastern plains of India. A prescriptive dose of 60 kg N ha−1 as basal + 60 kg N ha−1 at CRI followed by NDVI sensor-guided N application (at 45 and 65 DAS) brought about a significant improvement in yield performances and N use efficiencies with higher net returns and B:C. There should not be any curtailment in N doses at basal and CRI (60 kg N ha−1 each); any curtailment in these doses followed by N application through NDVI sensor at later stages could not bring about the target yield (5 t ha−1) of the crop. The new INSEY–GY relation developed through this trial could successfully be used for fair yield prediction in the Eastern plains of India.
Data availability statement
The original contributions presented in the study are included in the article/supplementary material, further inquiries can be directed to the corresponding author.
Author contributions
BM, PS, AR, and AS: conceptualization, methodology, writing—original draft preparation, and visualization. MS, AL, SA, and AH: formal analysis, data curation, statistical expertise, and writing—reviewing and editing. BM and AS: supervision. SA and AH: funding acquisition. All authors have read and agreed to the published version of the manuscript.
Funding
This study was financially supported by the Department of Agronomy, Uttar Banga Krishi Viswavidyalaya, Pundibari, Cooch Behar 736165, West Bengal, India. The research was also funded by the Researchers Supporting Project number (RSP2023R194), King Saud University, Riyadh, Saudi Arabia.
Acknowledgments
The authors would like to extend their sincere appreciation to the Researchers Supporting Project number (RSP2023R194), King Saud University, Riyadh, Saudi Arabia.
Conflict of interest
The authors declare that the research was conducted in the absence of any commercial or financial relationships that could be construed as a potential conflict of interest.
Publisher's note
All claims expressed in this article are solely those of the authors and do not necessarily represent those of their affiliated organizations, or those of the publisher, the editors and the reviewers. Any product that may be evaluated in this article, or claim that may be made by its manufacturer, is not guaranteed or endorsed by the publisher.
References
Ali, A. M., Abou-Amer, I. A., and Ibrahim, S. M. (2018). Using GreenSeeker active optical sensor for optimizing maize nitrogen fertilization in calcareous soils of Egypt. Arch. Agron. Soil Sci. 64,1083–1093. doi: 10.1080/03650340.2017.1411589
Ali, A. M., Ibrahim, S. M., and Singh, B. (2020). Wheat grain yield and nitrogen uptake prediction using atLeaf and GreenSeeker portable optical sensors at jointing growth stage. Inf. Process. Agric. 7, 375–383. doi: 10.1016/j.inpa.2019.09.008
Ali, A. M., Thind, H. S., Sharma, S., and Singh, V. (2014). Prediction of dry directseeded rice yields using chlorophyll meter, leaf color chart and GreenSeeker optical sensor in northwestern India. Field Crops Res. 161, 11–15. doi: 10.1016/j.fcr.2014.03.001
Ali, A. M., Thind, H. S., Singh, V., and Singh, B. A. (2015). A framework for refining nitrogen management in direct seed rice using GreenSeeker optical sensor. Comput. Electron. Agric. 110, 114–120. doi: 10.1016/j.compag.2014.10.021
Brown, A. J., and Warncke, D. (1988). Recommended chemical soil test procedures for the North Carolina Region. N. Dak. Agric. Exp. Exp. Bull. 499, 15–16.
Dhawan, D., Dheri, G. S., and Gill, A. A. S. (2021). Nitrogen budgeting of rice-wheat cropping system under long-term nutrient management in inceptisols of north India. Eur. J. Agron. 130, 126376. doi: 10.1016/j.eja.2021.126376
Dobermann, A., Witt, C., Abdulrachman, S., Gines, H. C., Nagarajan, R., Son, T. T., et al. (2003). Soil fertility and indigenous nutrient supply in irrigated domains of Asia. Agron. J. 95, 913–927. doi: 10.2134/agronj2003.9130
Dwivedi, B. S., Singh, V. K., and Meena, M. C. (2017). Efficient nutrient management under predominant cropping systems of India. Indin Nit. Asses. 2017, 95–115. doi: 10.1016/B978-0-12-811836-8.00007-0
Feng, M. C., and Yang, W. D. (2011). Changes in NDVI and yield of winter wheat cultivars with different plant types. Chinese J. Eco-Agr. 19, 87–92. doi: 10.3724/SP.J.1011.2011.00087
Gozdowski, D., Stepien, M., Panek, E., and Varghese, J. (2020). Comparison of winter wheat NDVI data derived from Landsat 8 and active optical sensor ant field scale. Remote Sens. Appl. Soc. Appl. 20, 100409. doi: 10.1016/j.rsase.2020.100409
Gupta, R. (2006). Crop canopy sensors for efficient nitrogen management in Indo-Gangetic plains. Progress Report of USDA Funded Project (Agreement No. 58-0210-5-017F). New Delhi: The Rice-Wheat Consortium; Mexico: CIMMYT, p. 28.
Haile, D., Nigussie, D., and Ayana, A. (2012). Nitrogen use efficiency of bread wheat: effects of nitrogen rate and time of application. J. Soil Sci. Plant Nutr. 12, 389–410. doi: 10.4067/S0718-95162012005000002
Halvorson, A. D., Wienhold, B. J., and Black, A. L. (2002). Tillage, nitrogen and cropping system effects on soil carbon sequestration. Soil Sci. Soc. Am. J. 66, 906–912. doi: 10.2136/sssaj2002.9060
Islam, S., Gathala, M. K., Tiwari, T. P., Timsina, J., Liang, A. M., Maharajan, S., et al. (2019). Conservation agriculture based sustainable intensification: Increasing yields and water productivity for smallholders of the Eastern Gangetic Plains. Field Crops Res. 238,1–17. doi: 10.1016/j.fcr.2019.04.005
Johnson, G. V., and Raun, W. R. (2003). Nitrogen response index as a guide to fertilizer management. J. Plant Nutr. 26, 249–262. doi: 10.1081/PLN-120017134
Kumar, R., and Yadav, D. S. (2005). Effect of zero and minimum tillage in conjunction with nitrogen management in wheat (Triticum aestivum) after rice (Oryza sativa). Ind. J. Agron. 50, 54–57.
Ladha, J. K., Pathak, H., Krupnik, T. J., Six, J., and van Kessel, C. (2005). Efficiency of fertilizer nitrogen in cereal production: retrospect and prospects, Adv. Agron. 87, 85–156. doi: 10.1016/S0065-2113(05)87003-8
Majumdar, K., Jat, M. L., Pampolino, M., Satyanarayana, T., Dutta, S., and Kumar, A. (2013). Nutrient management in wheat: Current scenario, improved strategies and future research needs in India. J. Wheat Res. 4, 1–10.
Mattas, K. K., Uppal, R. S., and Singh, R. P. (2011). Effect of varieties and nitrogen management on the growth, yield and nitrogen uptake of durum wheat. Res. J. Agric. Sci. 2, 376–380.
Mitra, B., Majumdar, K., Dutta, S. K., Mondal, T., Das, S., Banerjee, H., et al. (2019). Nutrient management in wheat (Triticum aestivum) production system under conventional and zero tillage in eastern sub-Himalayan plains of India. Ind. J. Agric. Sci. 89, 775–784. doi: 10.56093/ijas.v89i5.89657
Mitra, B., Mookherjee, S., and Das, S. (2014). Performances of wheat under various tillage and nitrogen management in sub-Himalayan plains of West Bengal. J. Wheat Res. 6, 150–153.
Mondal, T., Mitra, B., and Das, S. (2018). Precision nutrient management in wheat (Triticum aestivum L.) using Nutrient Expert: Growth phenology, yield, nitrogen use efficiency and profitability under eastern sub-Himalayan plains. Ind. J. Agron. 63, 174–180.
Mullen, W. R., Freeman, K. W., Raun, W. R., Johnson, G. V., Stone, M. L., and Solie, J. B. (2003). Identifying an in-season response index and the potential to increase wheat yield with nitrogen. Agron. J. 95. doi: 10.2134/agronj2003.3470
Olsen, S. R., Cole, C. V., Watanabe, F. S., and Dean, L. A. (1954). EstimationofAvailablePhosphorusinSoilsbyExtractionWithNaHCO3. Washington, DC: USDA Cir.
Panse, V. G., and Sukhatme, P. V. (1967). Statistical Methods for Agricultural Workers. 2nd ed. New Delhi: Indian Council of Agricultural Research.
Pathak, H., Li, C., Wassman, R., and Ladha, J. K. (2006). Simulation of nitrogen balance in rice–wheat systems of the Indo-Gangetic plains. Soil Sci. Soc. Am. J. 70, 1612–1622. doi: 10.2136/sssaj2005.0165
Rahman, M. A., Sufian, M. A., Saifuzzaman, M., and Chikushi, J. (2002). Nitrogen management in rice-wheat alternating cropping system and wheat genotype identification preferable to surface seeding condition. J. Fac. Agric. Kyushu Univ. 46, 295–301. doi: 10.5109/24442
Ratanoo, R., Kumar, S., and Dhaka, A. K. (2018b). Normalized difference vegetation index and growth traits as influenced by optical sensorbasedN management in irrigated wheat. Int. J. Curr. Microbiol. Appl. Sci. 7,362–367. doi: 10.20546/ijcmas.2018.707.044
Ratanoo, R., Kumar, S., Dhaka, A. K., and Rolaniya, L. (2018a). Precision nitrogen management based on NDVI and in-season estimates of response index in wheat. Int. J. Curr. Microbiol. Appl. Sci. 7, 390–399. doi: 10.20546/ijcmas.2018.704.044
Raun, W. R., Johnson, G. V., Stone, M. L., Solie, J. B., Lukina, E. V., Thomason, W. E., et al. (2001). In-season prediction of potential grain yield in winter wheat using canopy reflectance. Agron. J. 93, 131–138. doi: 10.2134/agronj2001.931131x
Raun, W. R., Solie, J. B., Johnson, G. V., Stone, M. L., Mullen, R. W., Freeman, K. W., et al. (2002). Improving nitrogen use efficiency in cereal grain production with optical sensing and variable rate application. Agron. J. 94, 815–820. doi: 10.2134/agronj2002.8150
Saharawat, Y. S., Gathala, M. K., Ladha, J. K., Malik, R. K., Singh, S., Jat, M. L., et al. (2009). Evaluation and promotion of integrated crop and resource management in the rice–wheat system in north-west India. In: Ladha, J. K., Yadvinder- Singh Erenstein, O., Hardy, B, editors. Integrated Crop and Resource Management in the Rice–Wheat System of South Asia. Los Banos: International rice research institute (IRRI). p. 133–150.
Singh, B., Sharma, R. K., Kaur, J., Jat, M. L., Martin, K. L., Singh, Y., et al. (2011). Assessment of nitrogen management strategy using an optical sensor for irrigated wheat. Agron. Sust. Dev. 31, 589–603. doi: 10.1007/s13593-011-0005-5
Singha, P., and Mitra, B. (2020). Nitrogen scheduling in wheat (Triticum aestivum L.) using a NDVI sensor under sub-Himalayan plians of West Bengal. J. Crop Weed 16, 49–55. doi: 10.22271/09746315.2020.v16.i3.1364
Subbaih, B., and Asija, G. L. (1956). A rapid procedure for the estimation of available nitrogen in soils. Curr. Sci. 25, 259–260.
Teal, R. K., Tubana, B. S., Girma, K., Freeman, K. W., Arnall, D. B., Walsh, O., et al. (2006). In-season prediction of corn grain yield potential using normalized difference vegetation index. Agron. J. 98, 1488–1494. doi: 10.2134/agronj2006.0103
Thapa, S., Rudd, J. C., Xue, Q., and Bhandari, M. (2019). Use of NDVI for characterizing winter wheat response to water stress in a semi-arid environment. J. Crop Improv. 33:1–16. doi: 10.1080/15427528.2019.1648348
Timsina, J., Wolf, J., Guilpart, N., van Bussel, L., Grassini, P., van Wart, J., et al. (2018). Can Bangladesh produce enough cereals to meet future damand? Agric. Syst. 163, 36–44. doi: 10.1016/j.agsy.2016.11.003
Walkley, A., and Black, I. A. (1934). An examination of Degtjareff method for determining soil organic matter and a proposed modification of the chromic acid titration method. Soil Sci. 37, 29–37. doi: 10.1097/00010694-193401000-00003
Yao, Y., Miao, Y., Huang, S., Gao, L., Ma, X., and Zhao, G. (2012). Active canopy sensor-based precision N management strategy for rice. Agron. Sustain. Dev. 32,925–933. doi: 10.1007/s13593-012-0094-9
Keywords: NDVI, wheat, optical sensor, nitrogen, yield
Citation: Mitra B, Singha P, Roy Chowdhury A, Sinha AK, Skalicky M, Laing AM, Alamri S and Hossain A (2023) Optical sensor-based nitrogen management: an environmentally friendly and cost-effective approach for sustainable wheat (Triticum aestivum L.) production on Eastern plains of India. Front. Sustain. Food Syst. 7:1153575. doi: 10.3389/fsufs.2023.1153575
Received: 29 January 2023; Accepted: 28 March 2023;
Published: 28 April 2023.
Edited by:
Sudhakar Srivastava, Banaras Hindu University, IndiaReviewed by:
Bhaben Chowardhara, Assam University, IndiaVenugopalan Visha Kumari, ICAR-Central Research Institute for Dryland Agriculture, India
Haijun Luan, Xiamen University of Technology, China
Copyright © 2023 Mitra, Singha, Roy Chowdhury, Sinha, Skalicky, Laing, Alamri and Hossain. This is an open-access article distributed under the terms of the Creative Commons Attribution License (CC BY). The use, distribution or reproduction in other forums is permitted, provided the original author(s) and the copyright owner(s) are credited and that the original publication in this journal is cited, in accordance with accepted academic practice. No use, distribution or reproduction is permitted which does not comply with these terms.
*Correspondence: Akbar Hossain, YWtiYXJob3NzYWlud3JjQGdtYWlsLmNvbQ==
†ORCID: Akbar Hossain orcid.org/0000-0003-0264-2712