 Jane Wangui Mugo
 Franklin J. Opijah1
94% of researchers rate our articles as excellent or good
Learn more about the work of our research integrity team to safeguard the quality of each article we publish.
Find out more
ORIGINAL RESEARCH article
Front. Sustain. Food Syst., 22 June 2023
Sec. Climate-Smart Food Systems
Volume 7 - 2023 | https://doi.org/10.3389/fsufs.2023.1144663
This article is part of the Research TopicCrop Modelling -Underutilised Crops for Climate-Smart Agrifood SystemsView all 5 articles
This study purposed to evaluate the impact of climate change on green gram yield, biomass and days to maturity under the baseline and future climate scenarios in Kitui County, Kenya. A field experiment was conducted during the March–April–May (MAM) and October–November–December (OND) planting seasons of 2018 and 2019 in the South Eastern Kenya University (SEKU) farm. Data on soil physical and chemical properties, daily climate data on rainfall, maximum and minimum temperature, and solar radiation, and green gram phenology dates were collected from the site and used in the calibration and validation of the APSIM model for four varieties of green gram, namely Biashara, Tosha, N26, and KS20 varieties. The calibrated green gram model captured the observed yield, biomass and days to maturity of the four varieties of green gram well. The calibrated green gram model was used to simulate the effects of climate change using daily climate data from an equal-weight ensemble of the nine CORDEX RCA4 models under the baseline scenario (1971 to 2000), and the future RCP 4.5 and 8.5 scenarios (2021 to 2050). During the MAM and OND seasons, a statistically significant decline in yield, biomass, and days to maturity is expected under both the RCP 4.5 and RCP 8.5 scenarios. The high variability in rainfall amount under both the RCP 4.5 and RCP 8.5 scenarios will translate to a lower yield and biomass. The increase in temperature under both the RCP 4.5 and RCP 8.5 scenarios will reduce the days to maturity for green grams in Kitui County. A decline in green gram yield is expected under future climate scenarios in one of the highly suitable zones for Kitui County, Kenya. Given that the government aims to revive farming in the ASALs by promoting climate-smart agriculture through planting drought-resistance crops, there is a need to develop green gram varieties which are more tolerant to the expected change in climate.
Subsistence farming in the tropical region is expected to be susceptible to the changing climate, as smallholder farmers lack enough resources to acclimatize to the changing climate conditions (Eriksen et al., 2005; Tui et al., 2022). Increased frequency of droughts, which is anticipated with the changing climate will worsen the state of food insecurity and deepen poverty in the Arid and Semi-Arid Lands (ASALs) of Kenya (Omoyo et al., 2015; Bobadoye et al., 2016; Kalele et al., 2021). Land classified as ASALs in Kenya is considered as most disposed to the effects of varying and changing climate (Opiyo, 2014; Kalele et al., 2021). The ASALs of Kenya are characterised by low rainfall that varies highly in time and space, and lengthy dry seasons with high evapotranspiration amounts (Opiyo, 2014). Given that the temperature and rainfall in the ASALs have been postulated to change (Wg1, 2007), it is essential to recognize the degree to which these alterations in climate elements could affect crop production at a local level.
In Kenya, legumes such as green grams are the second most preferred grain crop after maize. Legumes are commonly planted together with cereals such as sorghum, maize, millet and cassava, where the cereals are the majority crops (Hauggaard-Nielsen et al., 2008). Most farmers located in the ASALs prefer to intercrop maize with beans, with drought-resistant crops such as green gram, finger millet and sorghum not being as preferable (Yvonne et al., 2016). Green gram is a short-season crop that is well adapted to the warmer and drier conditions of the sub-tropics and tropics (Lambrides and Godwin, 2007; Masaku et al., 2018). Green gram grows in the range of temperatures of about 20 to 40°C (Lambrides and Godwin, 2007).
Green gram can improve nutrition, enhance soil fertility and benefit the economy. Green gram is not only an affordable source of plant protein but also of minerals, carbohydrates, and vitamins (Nasir and Sidhu, 2012; Nair et al., 2013; Hanumantharao et al., 2016). It plays an important role in easing undernourishment in resource-poor homes that cannot afford animal protein (Tharanathan and Mahadevamma, 2003; Pramanick et al., 2014; Hanumantharao et al., 2016; Tui et al., 2022). Green gram can improve the soil structure and leave a residual of between 33 and 37 Kg N/ha for the subsequent crop after sustaining its own need; fulfilling nearly 25% of the nitrogen required by the succeeding crop (Damodaram et al., 2014; Kaur et al., 2015; Hanumantharao et al., 2016). Adding nitrogen to the soil green gram can increase agricultural production in soils that are limited by a lack of supply of Nitrogen fertilizer (Raza et al., 2012). Kenya has the potential to produce 3MT/ha but only produces 0.46 MT/ha (Kilimo Trust, 2017).
The temporal and spatial variability of climate variables is one of the key aspects responsible for the agricultural production in an area (Raza et al., 2019; Vitali et al., 2019; Kephe et al., 2021). The impact of increased temperature, and changing rainfall intensity and pattern has led to reduced agricultural production globally (Cruz Benítez and Ramírez Amezcua, 2007; Adhikari et al., 2015; Raza et al., 2019). The spatial variability of climate variables, especially rainfall over various regions, has been observed to exhibit high variability in space and time (Indeje et al., 2001; Ongoma and Chen, 2017). Interest is growing in studies on rainfall over East Africa following observations that the main seasonal rainfall is decreasing (Ongoma and Chen, 2017), and that climate change by the end of the 21st century period shall adversely affect crop yields (Adhikari et al., 2015). Understanding the spatial variation of climate parameters and their relationship with important crops can help increase the welfare of smallholder farmers by cultivating their knowledge of the management of natural assets for improved agricultural production (Kisaka et al., 2015).
Crop growth models are important tools for evaluating weather threats, determining optimal planting dates, and calculating the performance of crops where they have not been cultivated before (Nain and Kersebaum, 2007; Asseng et al., 2014; Manschadi et al., 2021). Models are developed to help us understand how crops interact with climate in processes such as photosynthesis and water flow and to find gaps in knowledge (Jame and Cutforth, 1996; Chisanga et al., 2022; Tui et al., 2022). Models can represent the relationships between crop development, genetic constraints and the environment and thus may be used to assist in plant breeding efforts (Yin et al., 2004; Kostková et al., 2021; Manschadi et al., 2021; Chisanga et al., 2022). Crop models have also been used to simulate the effects of climate change on crop production and have been found useful tools (Vitali et al., 2019; Kephe et al., 2021; Kostková et al., 2021; Chisanga et al., 2022). To improve the production of green grams, it is essential to understand the potential impact of climate variability and change on green gram production in a highly suitable region, which is important when developing policies regarding the future. The switch to legumes in farming systems has been observed to reduce vulnerability to climate change in very poor as well as more resourced farmers (Tui et al., 2022).
Crop models commonly require a large number of input data including daily weather parameters (such as temperature, precipitation and solar radiation), detailed soil properties and initial soil conditions, cultivar-specific genetic parameters, and information on crop management practices (Manschadi et al., 2021). The lack of high-quality observed weather data is a challenge for the application of crop simulation models in many agricultural regions since this makes modelling difficult and increases the uncertainties of simulations (Srivastava et al., 2020; Kephe et al., 2021; Araghi et al., 2022). Gridded weather data have been found to provide valuable replacements for observed weather data for crop simulation purposes (Duarte and Sentelhas, 2020; Srivastava et al., 2020; Yaghoubi et al., 2020; Deines et al., 2021).
This study builds on the findings of Mugo et al. (2020) where the effects of climate change using an ensemble of nine CORDEX RCA4 models on green gram production in terms of the area was presented. Kitui country was identified as a highly suitable region for the cultivation of green grams. This study aims to demonstrate the impact of climate change on actual green gram yield, biomass and days to maturity which is lacking in the previous studies. Often, existing studies look at climate change effects and adaptation in current systems, but information as to what their effects could be in future systems is missing (Tui et al., 2022). Crop simulation models such as APSIM can be used to quantify the likely potential impacts of climate change on crop growth and yield (Chisanga et al., 2022; Tui et al., 2022). Although only one area was chosen for use in the APSIM model, the results would be applicable in other ASAL areas where the climate and soil patterns are similar.
Kitui County is located in one of the regions highly suitable for green gram production in Kenya during both the March, April, and May (MAM) and October, November, and December (OND) seasons (Figure 1). As a semi-arid region, Kitui County is one of Kenya’s most drought-prone areas, with dry spells typically lasting from June to September and January to February. The rainfall pattern is bimodal, with an average annual rainfall of 750 mm but an annual range of 500 to 1,050 mm and a reliability of 40%. The annual mean minimum (maximum) temperature ranges from 22 to 28 degrees Celsius.
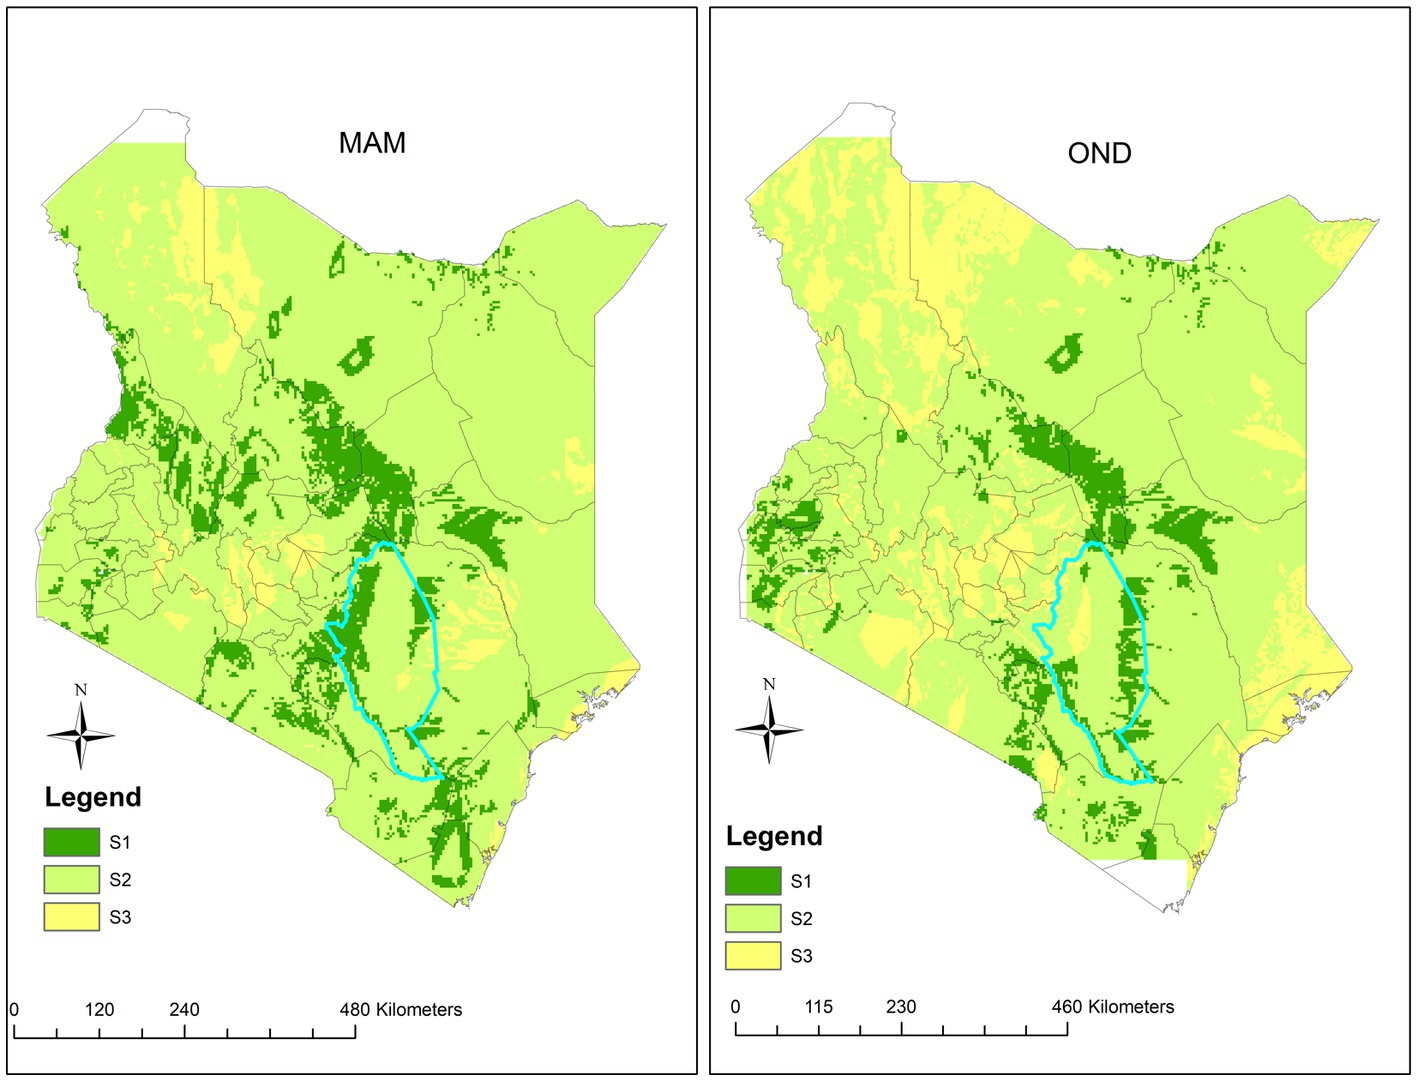
Figure 1. Present lands suitable for green gram production during the MAM (left) and OND (right) seasons in Kitui County, highlighted in blue. The dark green colour shading (S1) represents the most suitable areas, light green shading (S2) represents the moderately suitable areas, and yellow shading (S3) represents the marginally suitable areas, for green gram production in Kenya based on these classifications (Source: Mugo et al., 2020).
Kitui’s climate is ideal for green gram production which performs best in the ASAL areas since it has low moisture requirements and high heat tolerance (El lateff et al., 2018). A temperature of 28 to 30°C is ideal for seed germination and plant growth (Mogotsi, 2006; Lambrides and Godwin, 2007; Kaur et al., 2015) and the temperatures should always be above 15°C (Mogotsi, 2006). Green gram has a rainfall requirement of between 350 and 700 mm per annum (Lambrides and Godwin, 2007; SASOL Foundation, 2014).
Acrisols, luvisols, and ferralsols are the most common soil types in Kitui County (SASOL Foundation, 2014). The soils are well-drained, moderately to deeply rooted, and dark reddish (SASOL Foundation, 2014). Green gram does well in most soil textures but prefers fertile, deep, well-drained loams or sandy loams (Oplinger et al., 1990; Morton et al., 1992; SASOL Foundation, 2014). The legumes are most suitable for well-drained clayey soils (SASOL Foundation, 2014) but do not do well on heavy clay soils with poor drainage and are somewhat tolerant of saline soils (Oplinger et al., 1990; Grealish et al., 2010). For green gram cultivation, sandy soils require good fertilizer and water supply and organic soils need drainage and raised beds since their water tables occur at or near the soil surface (Grealish et al., 2010).
The datasets utilised in this study were climate data, soil data, and green gram phenological data which were used to calibrate the green gram APSIM model.
This study used daily gauge-based station data on rainfall, solar radiation, minimum temperature, and maximum temperature collected from the SEKU weather observatory station which is located at longitude 37.8 °E, and latitude 1.3 °S, in Kitui County, Kenya during the year, 2018 and 2019 in the seasons of MAM and OND when green gram experiments were conducted. Data on the number of rainy days in each month when green gram was planted was also collected to help understand the distribution of rainfall. A rainy day was described as a day when rainfall was more than or equal to 0.85 mm (Barron et al., 2003).
Daily model data on rainfall, maximum and minimum temperature and solar radiation were obtained from the best CORDEX RCA4 model under the baseline scenario (1971 to 2000), and the future RCP 4.5 and 8.5 scenarios (2021 to 2050). The CORDEX RCA4 model is part of the CORDEX-Africa projected where a selection of nine CMIP5 GCMS have been downscaled to the regional level (Endris et al., 2013; Mugo et al., 2020).
Monthly rainfall data spanning from 1971 to 2000 sourced from the Climate Research Unit (CRU) at 0.5° by 0.5° grid resolution (Harris et al., 2014) was also collected for use in the CORDEX RCA4 model validation. The CRU dataset has been validated against observed data in Kenya and found useful (Ongoma and Chen, 2017).
Soil samples were obtained using a soil auger at various depths (0–15 cm, 15–30 cm, and 30–45 cm) collected at different points in the experimental site using a zigzag pattern. A sample of 1 kg from each depth category was assessed for its physical and chemical properties at the National Agricultural Research Laboratory.
The test crop in the field experiments was green gram. Four cultivars of green gram were sown KS20 a dull green seed, N26 a small seeded, shiny green seed, and Tosha and Biashara which are medium-large shiny green seeds. The seeds are the varieties produced at the KARLO Katumani Research Center. Field experimental plots of 4 m by 4 m were established for three seasons (OND 2018, MAM 2019 and OND 2019). The experiments were laid out in a Randomized Complete Block Design (RCBD) with four replications and the different seeds as treatments.
The land at the SEKU farm was prepared at the beginning of the season and sowing was done when at least 10 mm of rainfall had been received to enable sufficient moisture in the soil for sustained germination of the green gram varieties. This threshold in some cases occurred in the middle of the season. The Green gram seeds were planted at a distribution of four to six kilograms per hectare, spacing of 15 cm and 45 cm between plants and rows, respectively, and a depth of three to five centimetres. Weeding was done 2 weeks after the emergence of seeds and before flowering. Bestox pesticide which contains the active ingredient alphacypermethrin molecule was applied twice during the growth of green grams; at the budding stage and the podding stage at a rate of 10 mL/ha mixed in 20 L of water to control pests. The fertiliser was applied at a rate of 50 kg/ha of NPK during sowing to increase soil fertility and yields (SASOL Foundation, 2014).
The best of the nine CORDEX RCA4 models and their ensemble as described in (Mugo et al., 2020) was determined and used to simulate the impact of climate change on green gram production. The best model was determined based on how each model simulated the observed CRU datasets during the baseline period.
The Taylor diagram was used to present the performance of the CORDEX RCA4 models based on how they correlate with the reference data (CRU rainfall data) (Taylor, 2001) during the baseline period. Rainfall is the most important weather parameter in Africa and is hence commonly observed as compared to the rest (Ongoma et al., 2019). Other studies have also shown that RCA4 models can simulate temperature fairly well (Endris et al., 2013; Mukhala et al., 2017; Warnatzsch and Reay, 2019), hence the choice of the best model was only based on rainfall.
The Taylor diagram summarises the model outputs in terms of the correlation coefficient (Eq. 1), bias (Eq. 2), and the root mean square error (RMSE) (Eq. 3) statistical measures. The closer the model is to the observation (reference data point), the better the model performance, and the opposite is true. A Taylor diagram can also be used to show the relative performance of models against each other demonstrating the existence/non-existence of consensus of the models toward the reference data (Taylor, 2001).
Where , are the values of observed, mean of observed, predicted, and mean of predicted and the total number of these pairs, respectively.
The APSIM module .xml file contains nine cultivars of the green gram crop. When introducing a new variety, it is recommended that an existing cultivar in the .xml file be used. The green gram crop module in APSIM has descriptions of Satin, Celera, Berken and Emarald that resemble KS20, N26, Tosha and Biashara varieties, respectively, (Gentry and Gordon, 2010). The four new varieties (KS20, N26, Tosha and Biashara) were added by editing the .xml file using the field phenology data collected. Growing degree days from sowing to emergence, emergence to end of the juvenile phase, flowering to start of grain filling and start of grain filling to end of grain filling, were calculated and input appropriately to resemble the observed field data, all the other parameters were not changed.
The soil characteristics used in the study were those typical of soils in Kitui. Table 1 shows the physical and chemical soil parameters tested and used as input in the APSIM model. The maximum available water content of the soil at sowing was adjusted to 95% evenly distributed across the soil profile. The sowing rule was set so that sowing took place when there was an accumulation of 10 mm of rainfall from the sowing date. The sowing dates were set to 1st March and 1st October for the MAM and OND seasons, respectively. The seeds were planted at a depth of 10 mm. The sowing density was set at 10 plants/m2 and the row spacing at 500 mm. Nitrate Nitrogen fertilizer was applied at a rate of 50 kg/ha at sowing. Soil organic matter, nitrogen, and soil water were reset on sowing to the original amounts. All the other parameters were not changed.
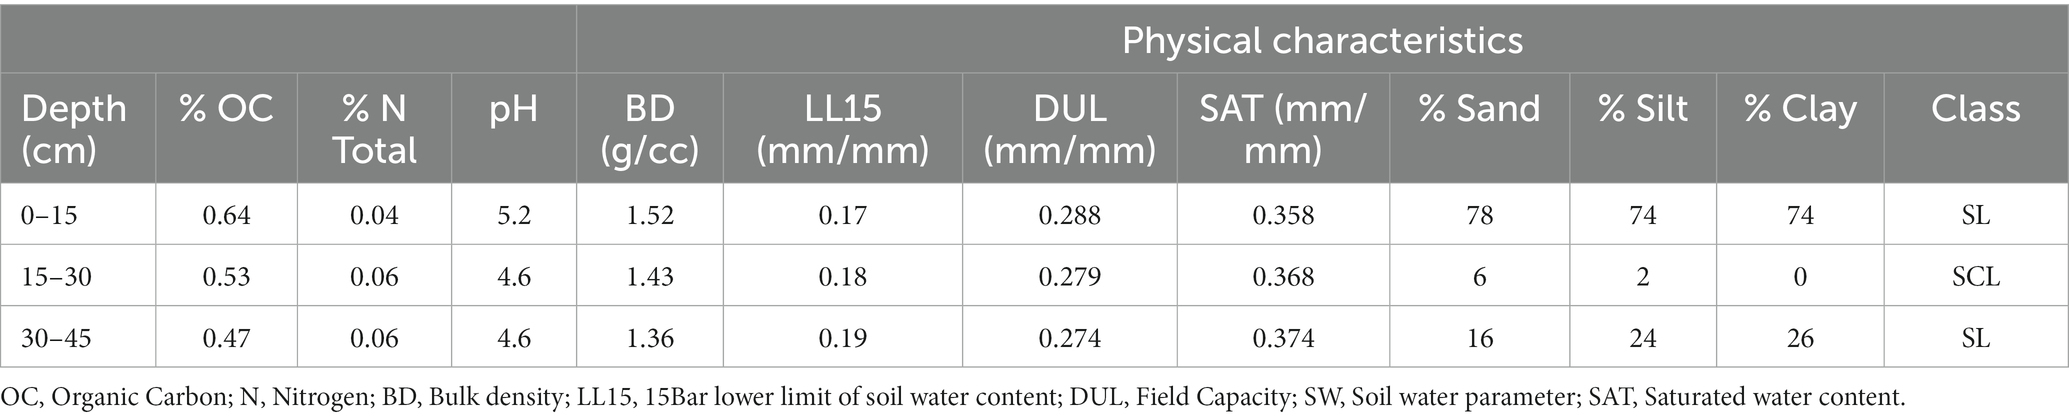
Table 1. Chemical and physical properties of the soil at the experimental site in SEKU farm, Kitui County, Kenya.
The APSIM weather module requires daily data on rainfall, solar radiation, minimum temperature, and maximum temperature. The APSIM model requires the data to be input as one file of daily weather parameters arranged in columns in chronological order. Four .met files were created: a file containing observed station data during the years 2018 and 2019 from the SEKU weather station which was used for model initialization and validation; and three files from the CORDEX RCA4 model ensemble data from the baseline scenario (1971 to 2000), and the future RCP 4.5 and 8.5 scenarios (2021 to 2050) which were also used as inputs in the green gram weather module to study the effect of climate change on green gram yield. The data was saved as a .prn file under excel and this was converted to .met using the Tav_Amp program written in FORTRAN language. The .met files were then read into the APSIM weather module.
Data from field experiments for the OND 2018 growing seasons on phenology dates, biomass and grain yield were used for the model calibration.
The ability of the APSIM green gram model to simulate the observed yield of green gram, biomass, and days to maturity during the MAM and OND 2019 growing seasons was evaluated using the statistical measures of coefficient of determination which is Eq. 1 squared, bias (Eq. 2), percentage error (Eq. 4) and the normalised root mean square error (NRMSE) (Eq. 5) (Luhunga et al., 2016). The validated varieties were then used to simulate the effect of changing climate on the yield, biomass and days to physiological maturity of green gram under the baseline scenario (1971 to 2000), and the future RCP 4.5 and 8.5 scenarios (2021 to 2050).
The Normalised Root Mean Square Error (NRMSE) (Eq. 4) measures the absolute error of the APSIM model in simulating observed values. Smaller values of NRMSE indicate a small error between the observed and simulated values.
The effect that climate change may have on green gram yield, biomass, and days to maturity under baseline, RCP 4.5 and RCP 8.5 scenarios during the MAM and OND seasons was investigated using the validated green gram module for the years between 1971 to 2000, and 2021 to 2050.
The trends in the climate parameters (rainfall and temperature), and green gram production parameters (yield, biomass and days to maturity) during the MAM and OND seasons were assessed using the Mann-Kendall test (Mann, 1945) test and the magnitude of the trend using the Sen’s slope estimator (Sen, 1968). Positive values of the Mann-Kendall test and Sen’s slope estimator indicate an increasing trend while negative values indicate a decreasing trend in the time series. To determine whether a trend was statistically significant a p-value of 0.05 was used. Several recent studies have used the Mann-Kendall test to identify trends in time series (Porto de Carvalho et al., 2014; Taxak et al., 2014; Mallya et al., 2015). The Mann-Kendall method is often preferred for trend analysis because it can work with missing data, non-normality, seasonality and outliers in a time series (Oloruntade et al., 2016).
Figure 2 presents the total mean annual rainfall cycle over Kitui County from the RCA4 models and CRU datasets; all the models reproduce the annual cycle of rainfall fairly well. The general cycle shows the bimodal rainfall pattern, much of the rainfall occurs during the MAM and OND seasons. The OND season is the main season in the lower eastern and central regions where Kitui County is located, and the models capture this pattern fairly well. These results agree with that of Ayugi et al. (2016).
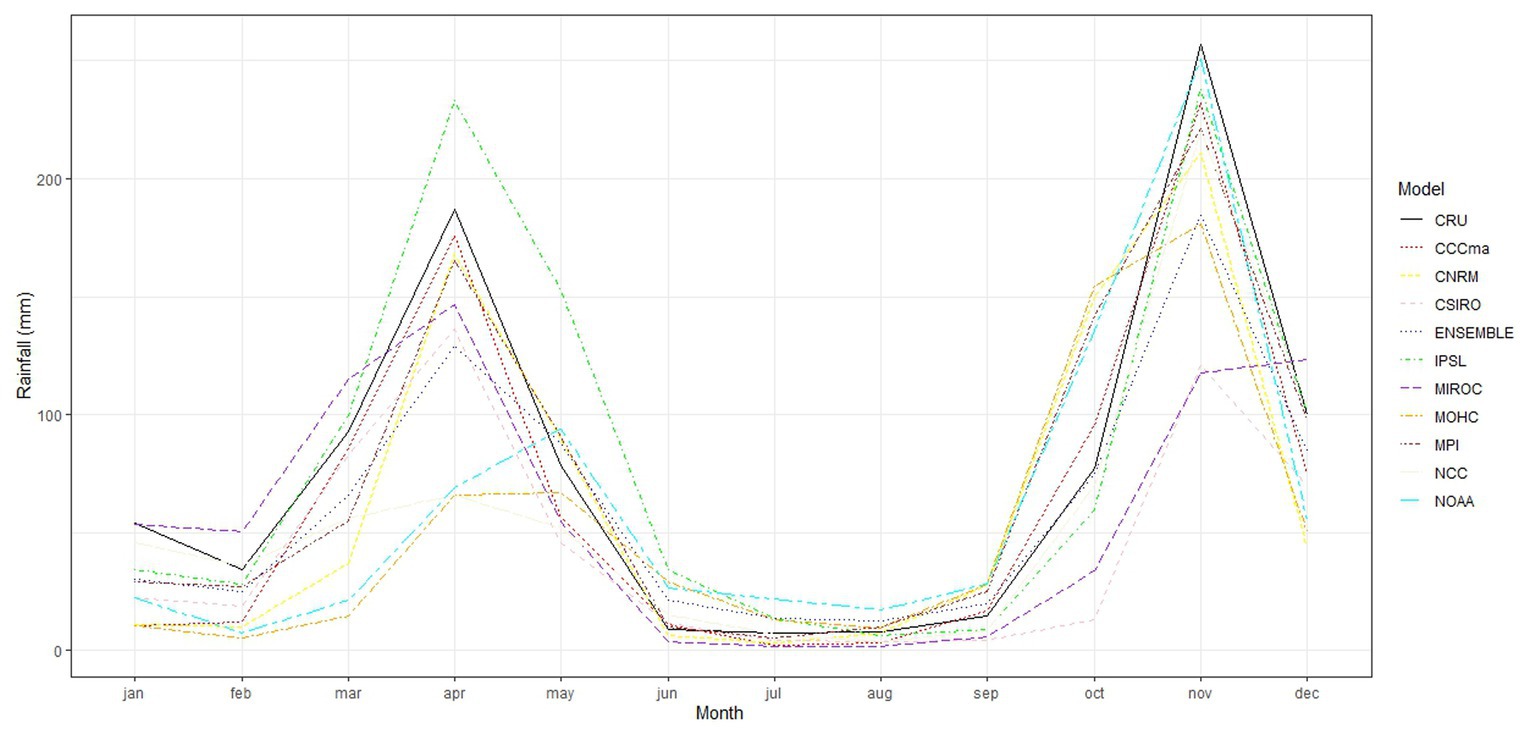
Figure 2. Mean annual cycle of rainfall using the CRU and CORDEX RCA4 model datasets.
Figure 3 presents the performance of the RCA4 CORDEX models in simulating observed annual rainfall totals in Kitui using Taylor diagrams. The best-performing model was chosen based on the smallest standard deviation, the highest positive correlation and the least unbiased RMSE to the CRU datasets. Generally, the RCA4 models clustered around a correlation coefficient of 0.4 to 0.6, justifying the use of an ensemble of equal weight.
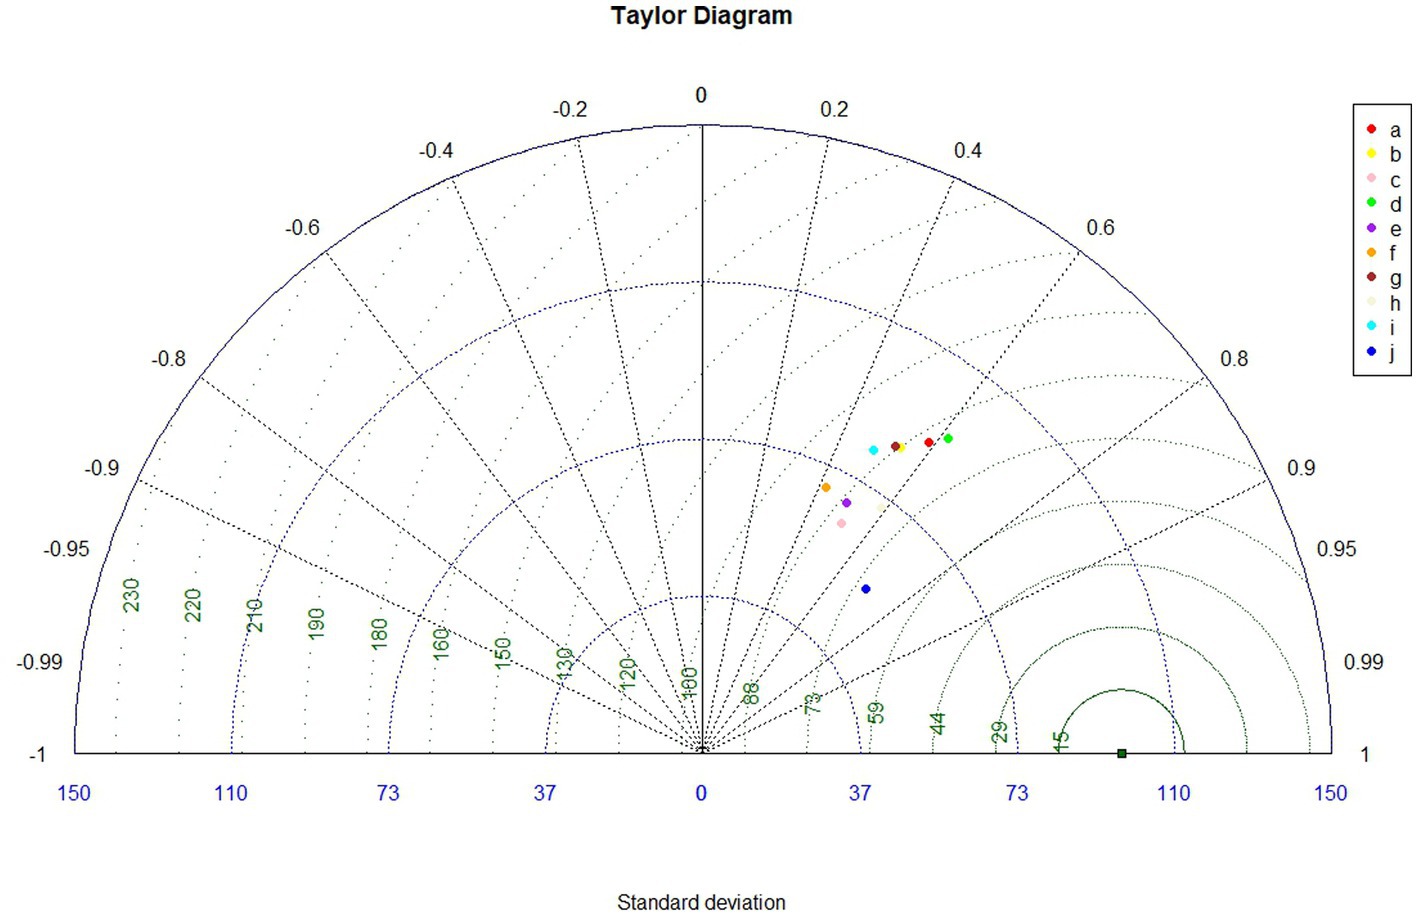
Figure 3. Taylor diagram showing the validation of annual rainfall for the CORDEX RCA4 models against observed CRU data. The alphabetical letters represent a-CCCma, b-CNRM, c-CSIRO, d-IPSL, e-MIROC, f-MOHC, g-MPI, h-NCC, i-NOAA and, j-Ensemble.
The ensemble which is a normal average of the nine CORDEX models (Endris et al., 2013) was a better representation than the individual models since it displayed the smallest standard deviation, highest correlation coefficient and the least unbiased RMSE to the CRU datasets. The better representation by the ensemble can be attributed to its ability to cancel opposite signed biases across individual models (Nikulin et al., 2012; Mukhala et al., 2017). Individual models can sometimes be unreliable since they give good results in one region and poor results in another region over the same period (Nikulin et al., 2012; Akhter et al., 2017; Dosio, 2017; Stanzel et al., 2018).
The ensemble, although potentially biased, simulated rainfall better compared to individual models; model ensembles have previously been used for future climate studies (Buontempo et al., 2015; Ogega et al., 2016; Mukhala et al., 2017; Mutayoba and Kashaigili, 2017; Stanzel et al., 2018; Gibba et al., 2019; Kisembe et al., 2019; Musie et al., 2020). Utmost importance should be given to choosing the data source, which otherwise could lead to incorrect estimations that lead to incorrect policy recommendations (Srivastava et al., 2020; Yaghoubi et al., 2020). Since the ensemble performed better than individual models it was used for further analysis to simulate the effects of climate change on green gram production in Kitui County Kenya.
This section presents the results of the weather conditions observed during the experiment period, and the performance of the APSIM model in simulating the observed yield, biomass, and days to maturity.
Table 2 shows the pattern of rainfall, solar radiation, and minimum and maximum temperature during the growing seasons of MAM and OND when the experiments were conducted.
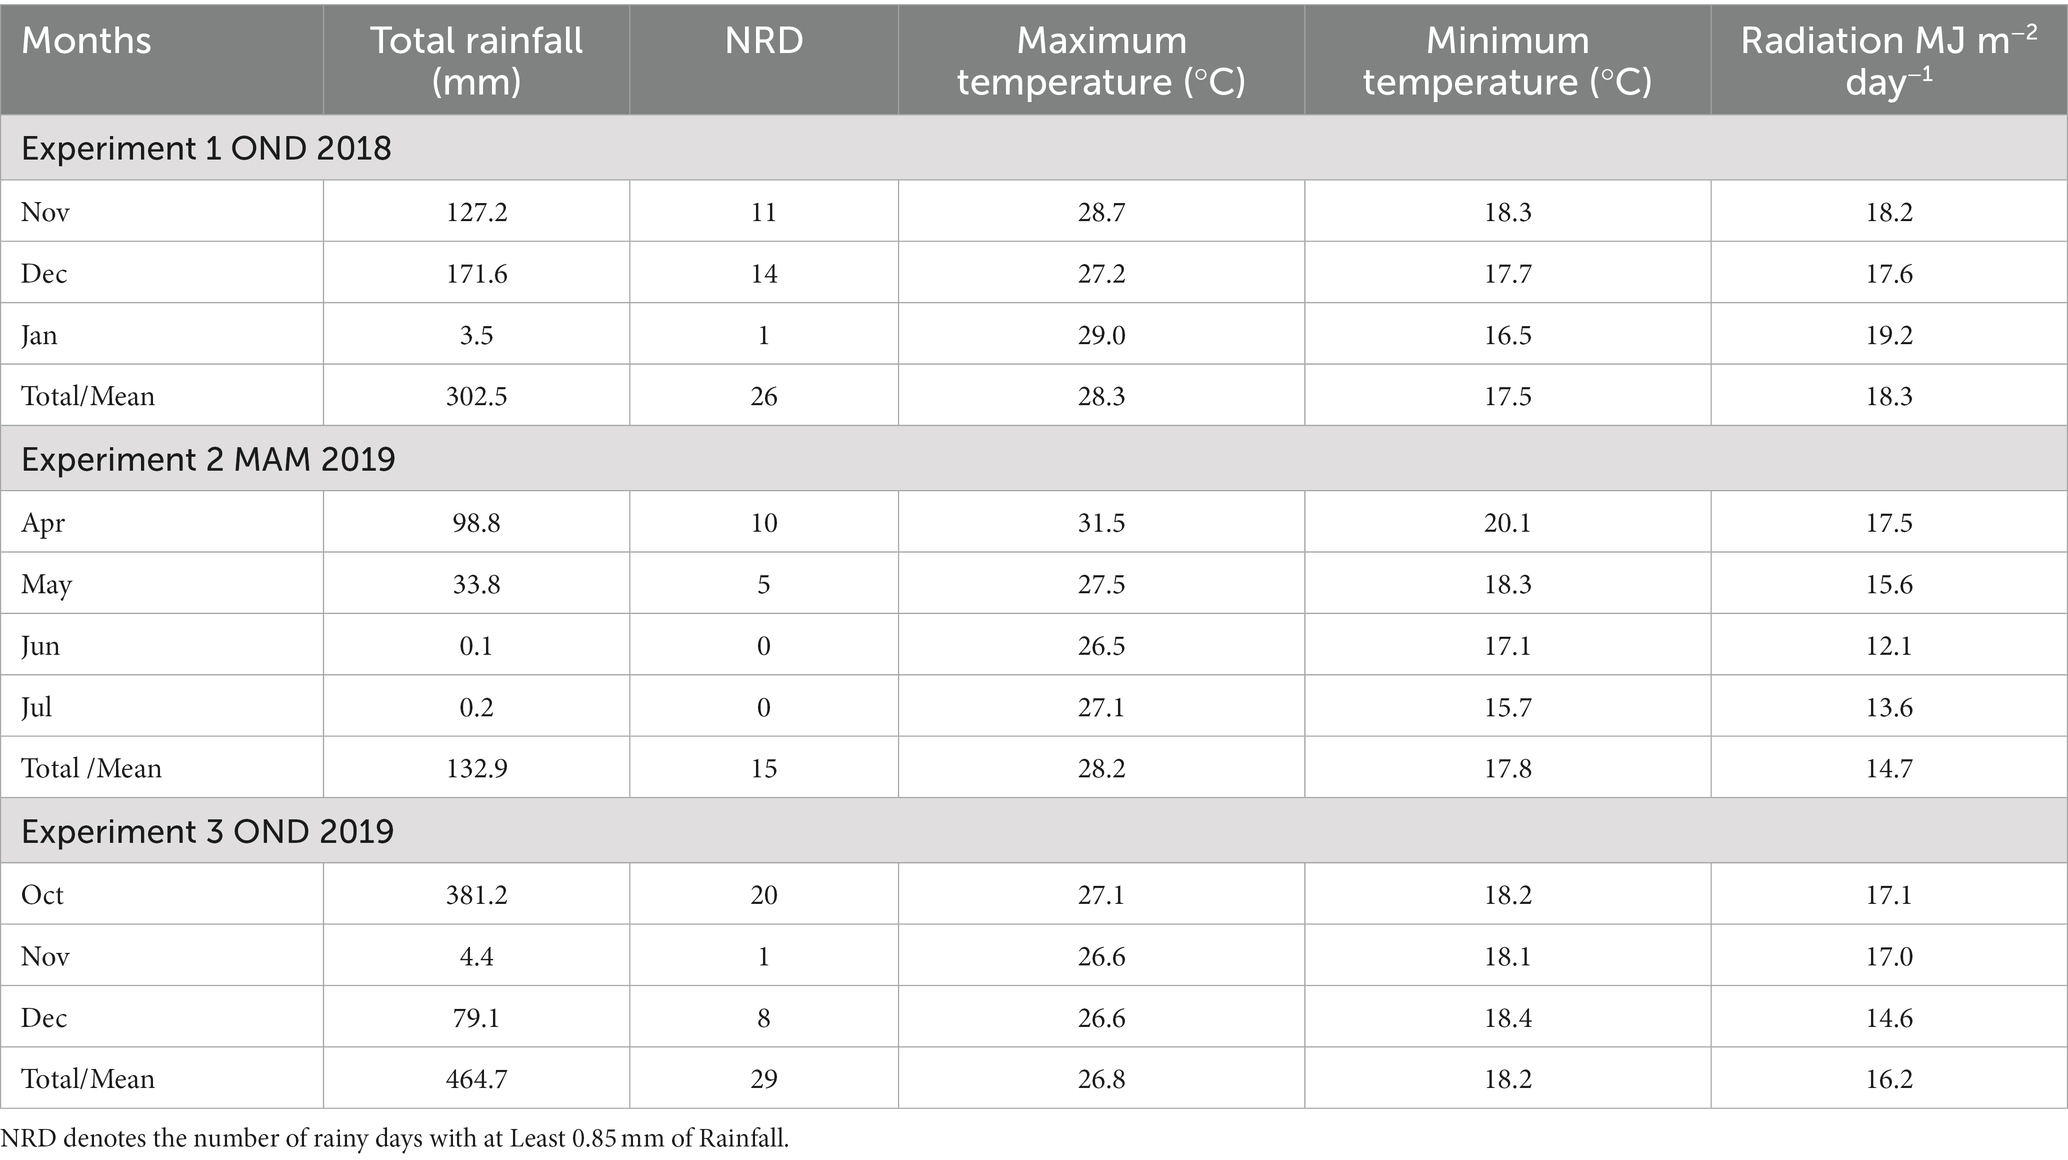
Table 2. Distribution of monthly total rainfall (mm), mean maximum and minimum temperature, and mean solar radiation during the growing season when the green gram experiments were conducted at the SEKU farm.
A rainfall of 250 to 350 mm per season is considered optimal for green gram production (Gaiser and Graef, 2001; SASOL Foundation, 2014). The OND season of 2018 received a rainfall amount of 302.5 mm, which favoured good yield during the season. The MAM season of 2019 received rainfall amount of 132.9 mm which resulted in reduced yields. The OND season of 2019 received higher than the optimal amount required of 464.7 mm which resulted in increased biomass and less yield compared to the 2018 OND season. Rainfall amounts above the optimum could lead to increased biomass production and decreased pod setting which affects the yield of green grams. The number of rainy days (NRD) was well distributed with most days occurring during the start of the planting season and thus ideal for green gram growth. Green grams are especially vulnerable to drought stress during flowering and pod filling, which occurs about 6 weeks after planting (Raza et al., 2012). Water stress affects crop phenology, leaf area development, and number of leaves per plant and finally, results in low yield (Robertson et al., 2002; Ranawake et al., 2012; Raza et al., 2012; Chauhan and Rachaputi, 2014).
The temperature during all the growing seasons remained optimal as shown in Table 2. A temperature of 21 to 30°C is considered ideal for seed germination and plant growth (Morton et al., 1992; Mogotsi, 2006). The temperature should always be above 15°C during crop growth (Mogotsi, 2006). Green gram bear 10 to 20 flowers. Under normal conditions, the green gram plant will shed a large number of flowers. Shedding is worsened under high temperatures leading to substantial loss of potential pods (Kaur et al., 2015). Temperatures higher than 27°C at the reproductive stages of green grams decrease its photosynthetic rates by inducing chlorophyll loss and reducing carbon assimilation and fixation thereby reducing pod weights and final yield (Luo, 2011; Hatfield and Prueger, 2015; Islam, 2015; El lateff et al., 2018). A change in temperature by 8–10°C from the optimum level required for green gram growth resulted in shorter phenological periods, especially during the vegetative phase leading to earlier maturity (Luo, 2011; Hatfield and Prueger, 2015). Low temperatures delay and reduce the germination of green gram and lead to very slow plant growth (Hanumantharao et al., 2016).
Table 3 shows the calculated number of growing degree days it takes for each green gram variety to develop through seven phenological phases. The APSIM green gram model uses 7.5°C base temperature, 30°C optimal temperature and 40°C extreme temperature for green gram suitability as the key values in the calculation of degree days (Robertson et al., 2002; Chauhan et al., 2010).
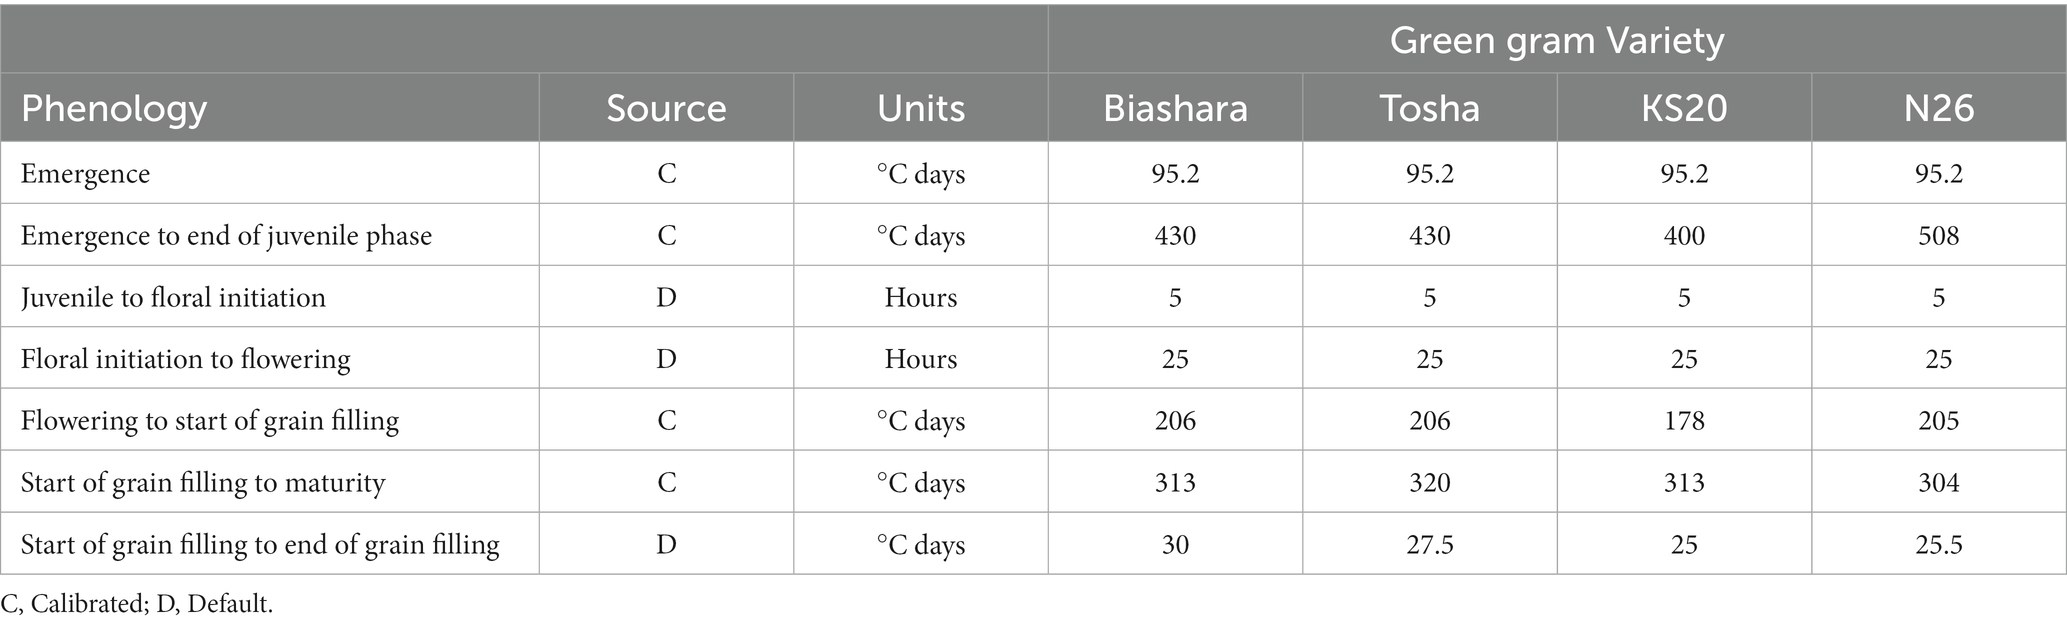
Table 3. The genetic coefficients used to model the four varieties of green gram Biashara, Tosha, KS20 and N26.
Table 4 shows the observed versus simulated yield, biomass and days to maturity for each green gram variety. The APSIM model generally underestimates the observed yield, biomass and days to maturity during the three growing seasons for all the varieties. Since the APSIM green gram module does not model production from subsequent flushes of flowers and pods, the recorded yield and biomass may be underestimated (Robertson et al., 2002). Canopy development is a key process that underpins radiation interception and water use by the crop and thus drives yield formation (Chauhan and Williams, 2018; Geetika et al., 2022). Canopy development has not been quantified for the current varieties of green gram in APSIM (Chauhan and Williams, 2018). Chauhan and Williams (2018) identified genetic variation in canopy development as a potential area to investigate for yield advance.
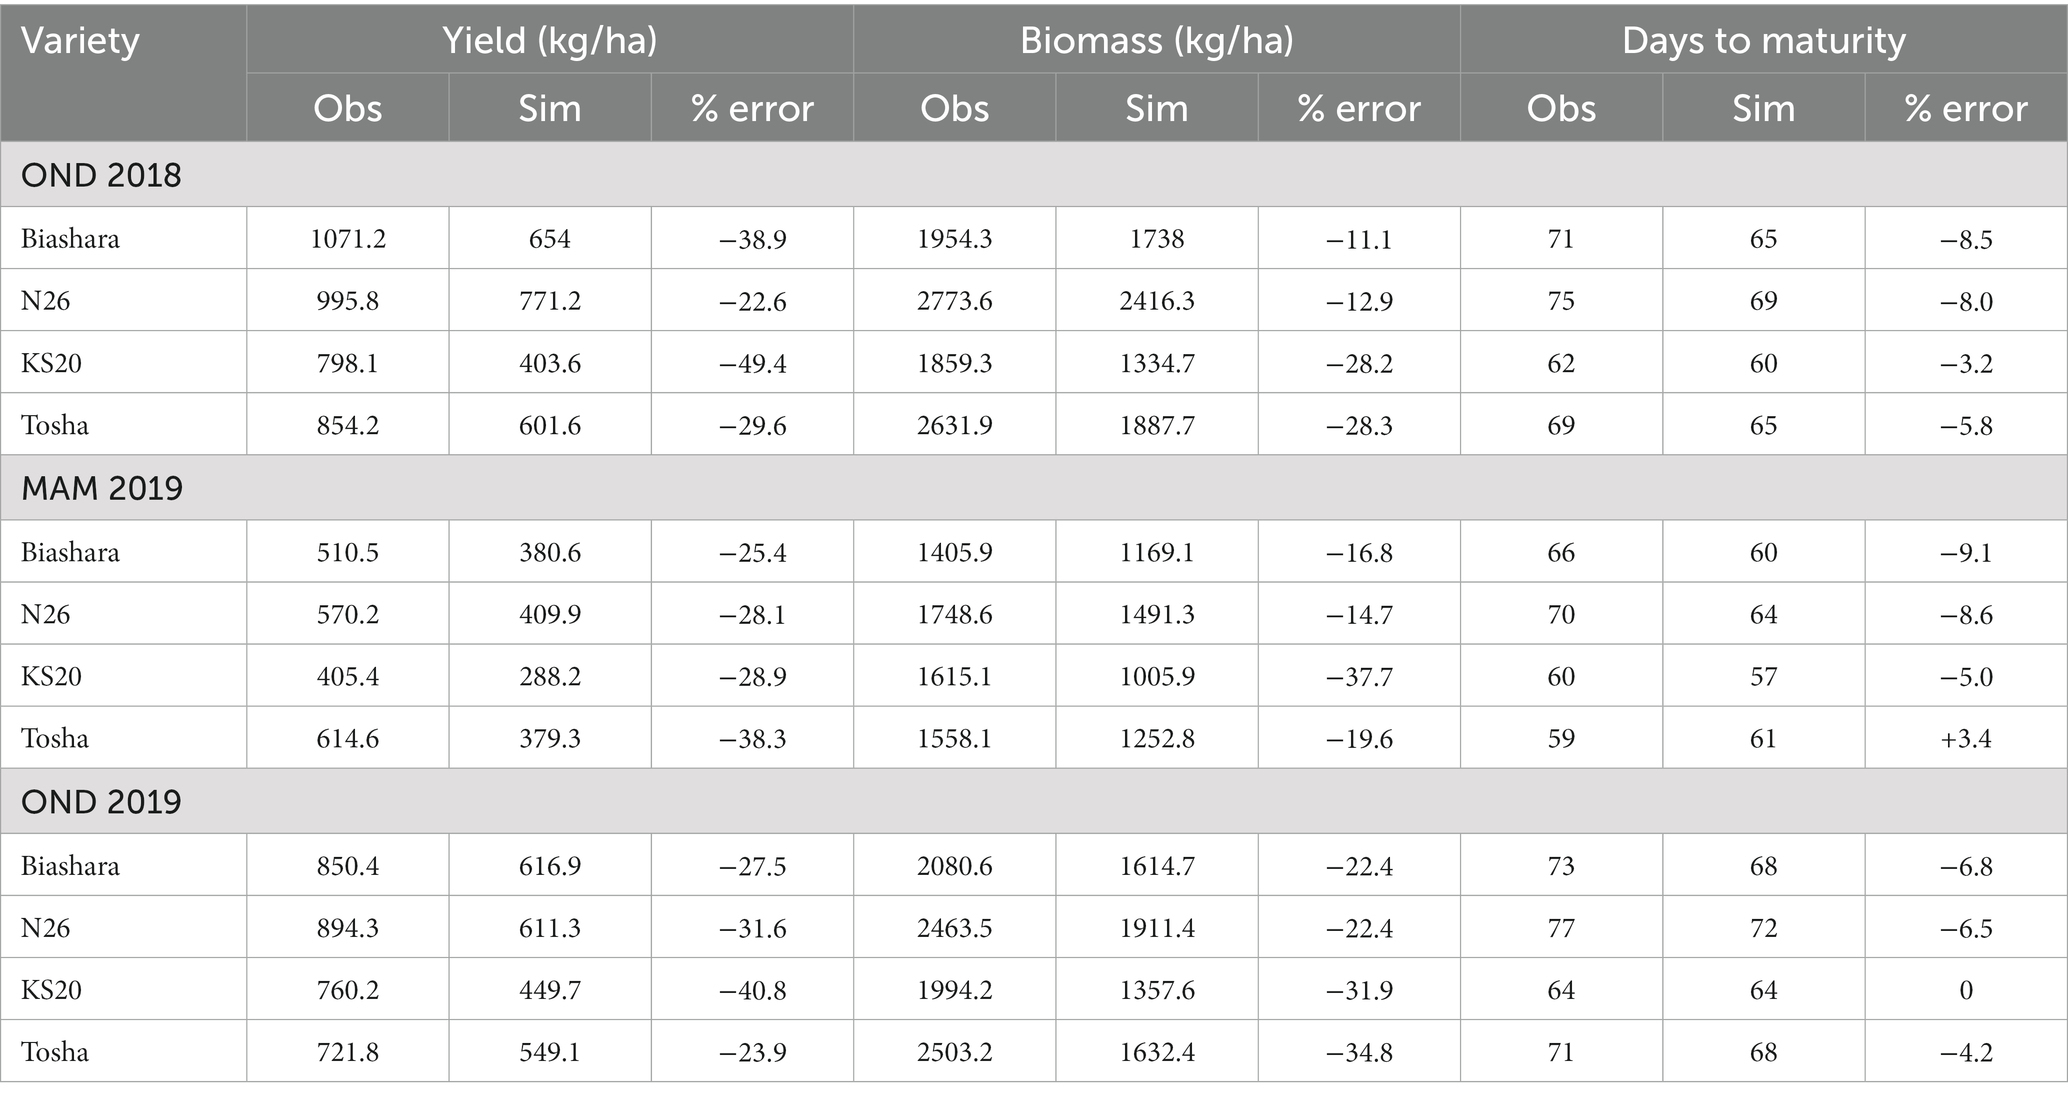
Table 4. Observed (Obs) and simulated (Sim) yield, biomass and number of days to maturity for each green gram variety for the growing season when the green gram experiments were conducted.
The yield during the OND season of 2018 was better compared to the MAM 2019 and OND 2019 season. The differences in yield, biomass and days to maturity were attributed to changes in rainfall (Table 2) since temperature remained optimal for production as discussed in the preceding section. Table 5 presents the strength of the relationship between the observed and modelled varieties of green gram. The calibrated green gram model captured the observed yield, biomass and days to maturity of the four varieties of green gram shown by a coefficient of determination which ranged between 87.0 and 99.0%; bias values which ranged between 1.3 and 25.3 and levels of NRMSE which ranged between 4.7 and 45.5%. The level of agreement between the observed and simulated values was good and the model was approved for future climate studies.
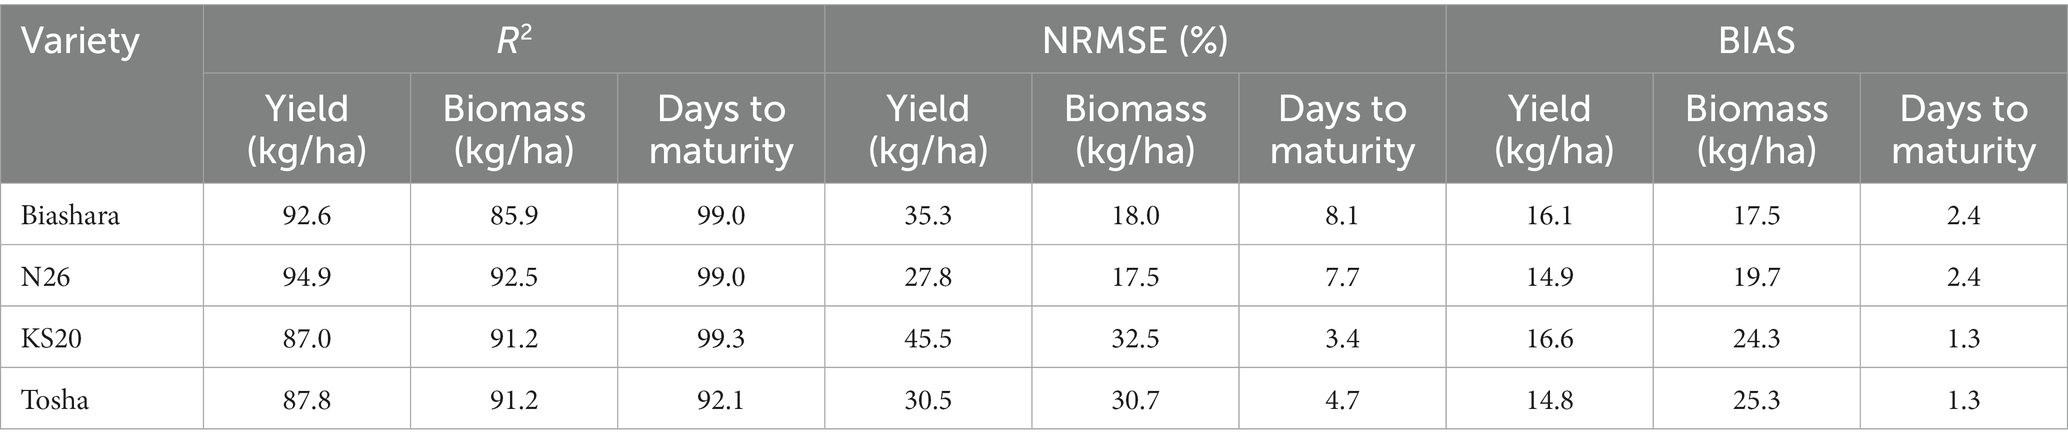
Table 5. Results of the strength of the relationship between the observed and modelled green gram varieties based on the coefficient of determination (R2) NRMSE, and Bias Tests of skill during the entire experiment season.
This section presents the results of the effect of changing climate on the yield of four green gram varieties (Biashara, Tosha, KS20 and N26).
Table 6 presents the results of the trend of climate and simulated green gram production parameters during the MAM and OND season baseline scenario (1971 to 2000), and the future RCP 4.5 and 8.5 scenarios (2021 to 2050) climate scenarios. The mean rainfall during MAM and OND seasons has been increasing; however, statistical significance is only noted under the MAM RCP 4.5 scenario and not under the baseline and RCP 8.5 scenarios, which illustrates the variable nature of rainfall, meaning we cannot decisively state whether rainfall is increasing or decreasing. Rainfall is highly variable in the lower eastern region of Kenya and this has had an impact on crop production (Shisanya et al., 2011; Omoyo et al., 2015; Ongoma et al., 2015).
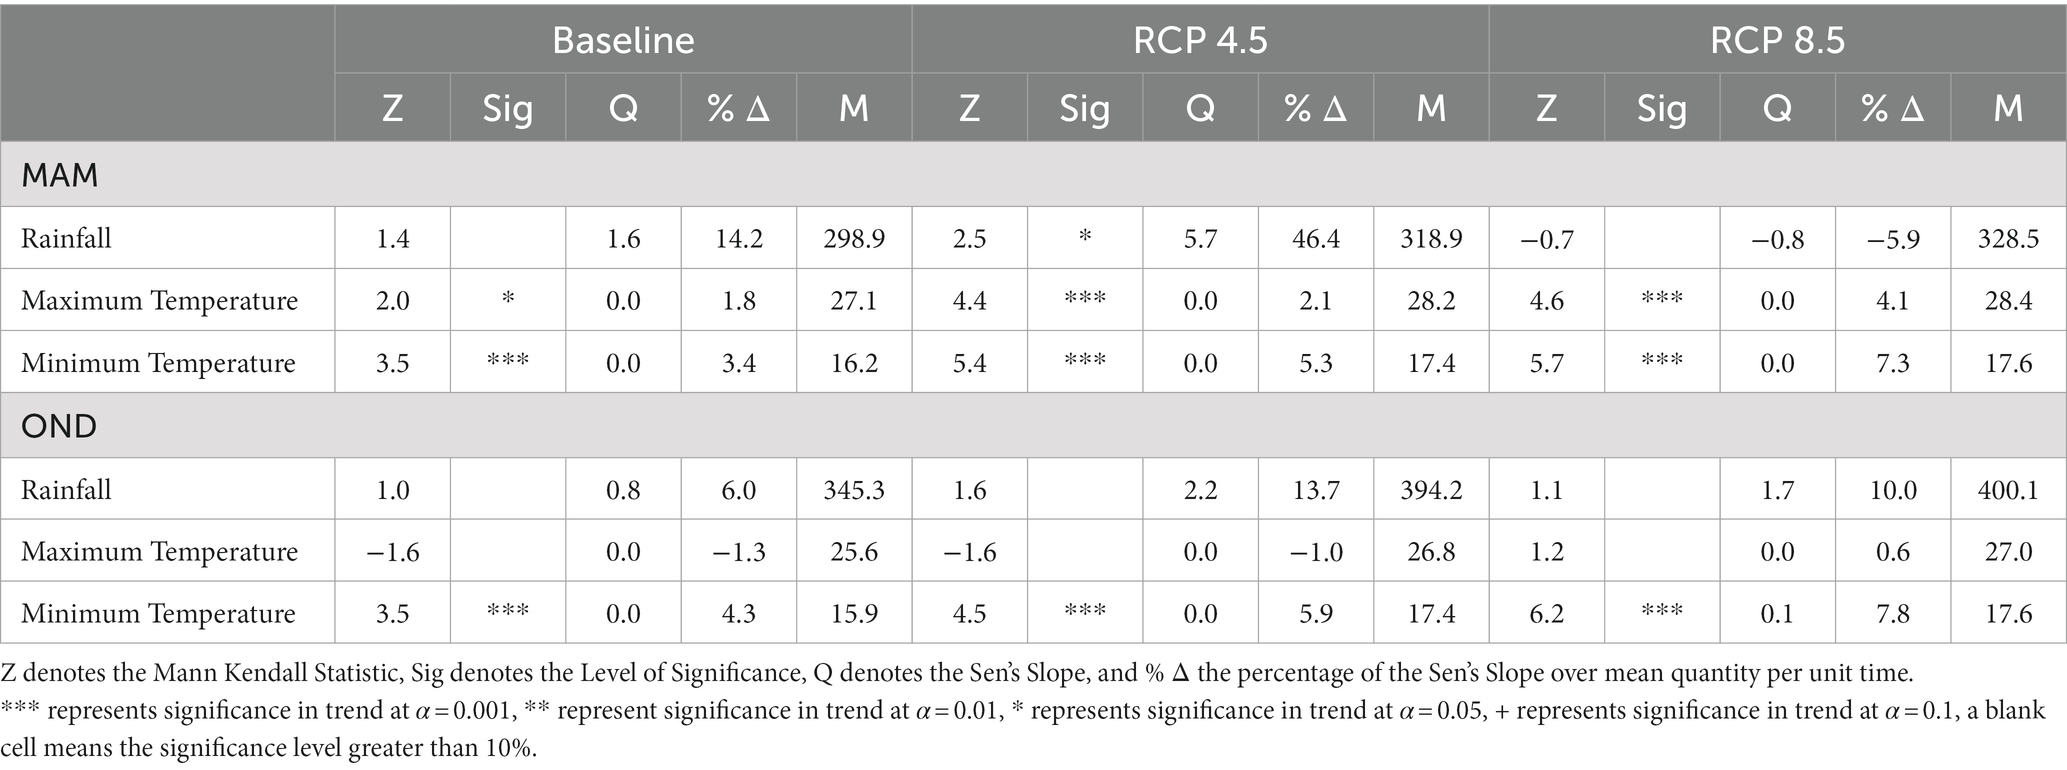
Table 6. Time series analysis of climate parameters (total rainfall (mm), maximum and minimum temperature) for the baseline, RCP 4.5 and RCP 8.5 scenarios during the MAM season.
Maximum temperatures will increase significantly under the baseline, RCP 4.5 and RCP 8.5 scenarios during the MAM season, but not the OND season which shows a non-significant decreasing trend. The minimum temperature will however increase significantly under both the RCP 4.5 and RCP 8.5 scenarios for the MAM and OND.
This section presents the results on the trend of green gram yield, biomass, and days to maturity under future climatic conditions.
Figure 4 presents a boxplot on the effects of climate change on green gram yield during the MAM and OND season. The figure shows that the OND season is more favourable for green gram production compared to the MAM season, and there will be a decline in yield in the future under the RCP 4.5 and RCP 8.5 climate scenarios during both the MAM and OND seasons. Table 7 presents the results of the trend of simulated green gram yield during the MAM and OND season under the baseline, RCP 4.5 and RCP 8.5 climate scenarios. The table shows a decline in yield in the future under the RCP 4.5 and RCP 8.5 scenarios. The decreasing trend was statistically significant.
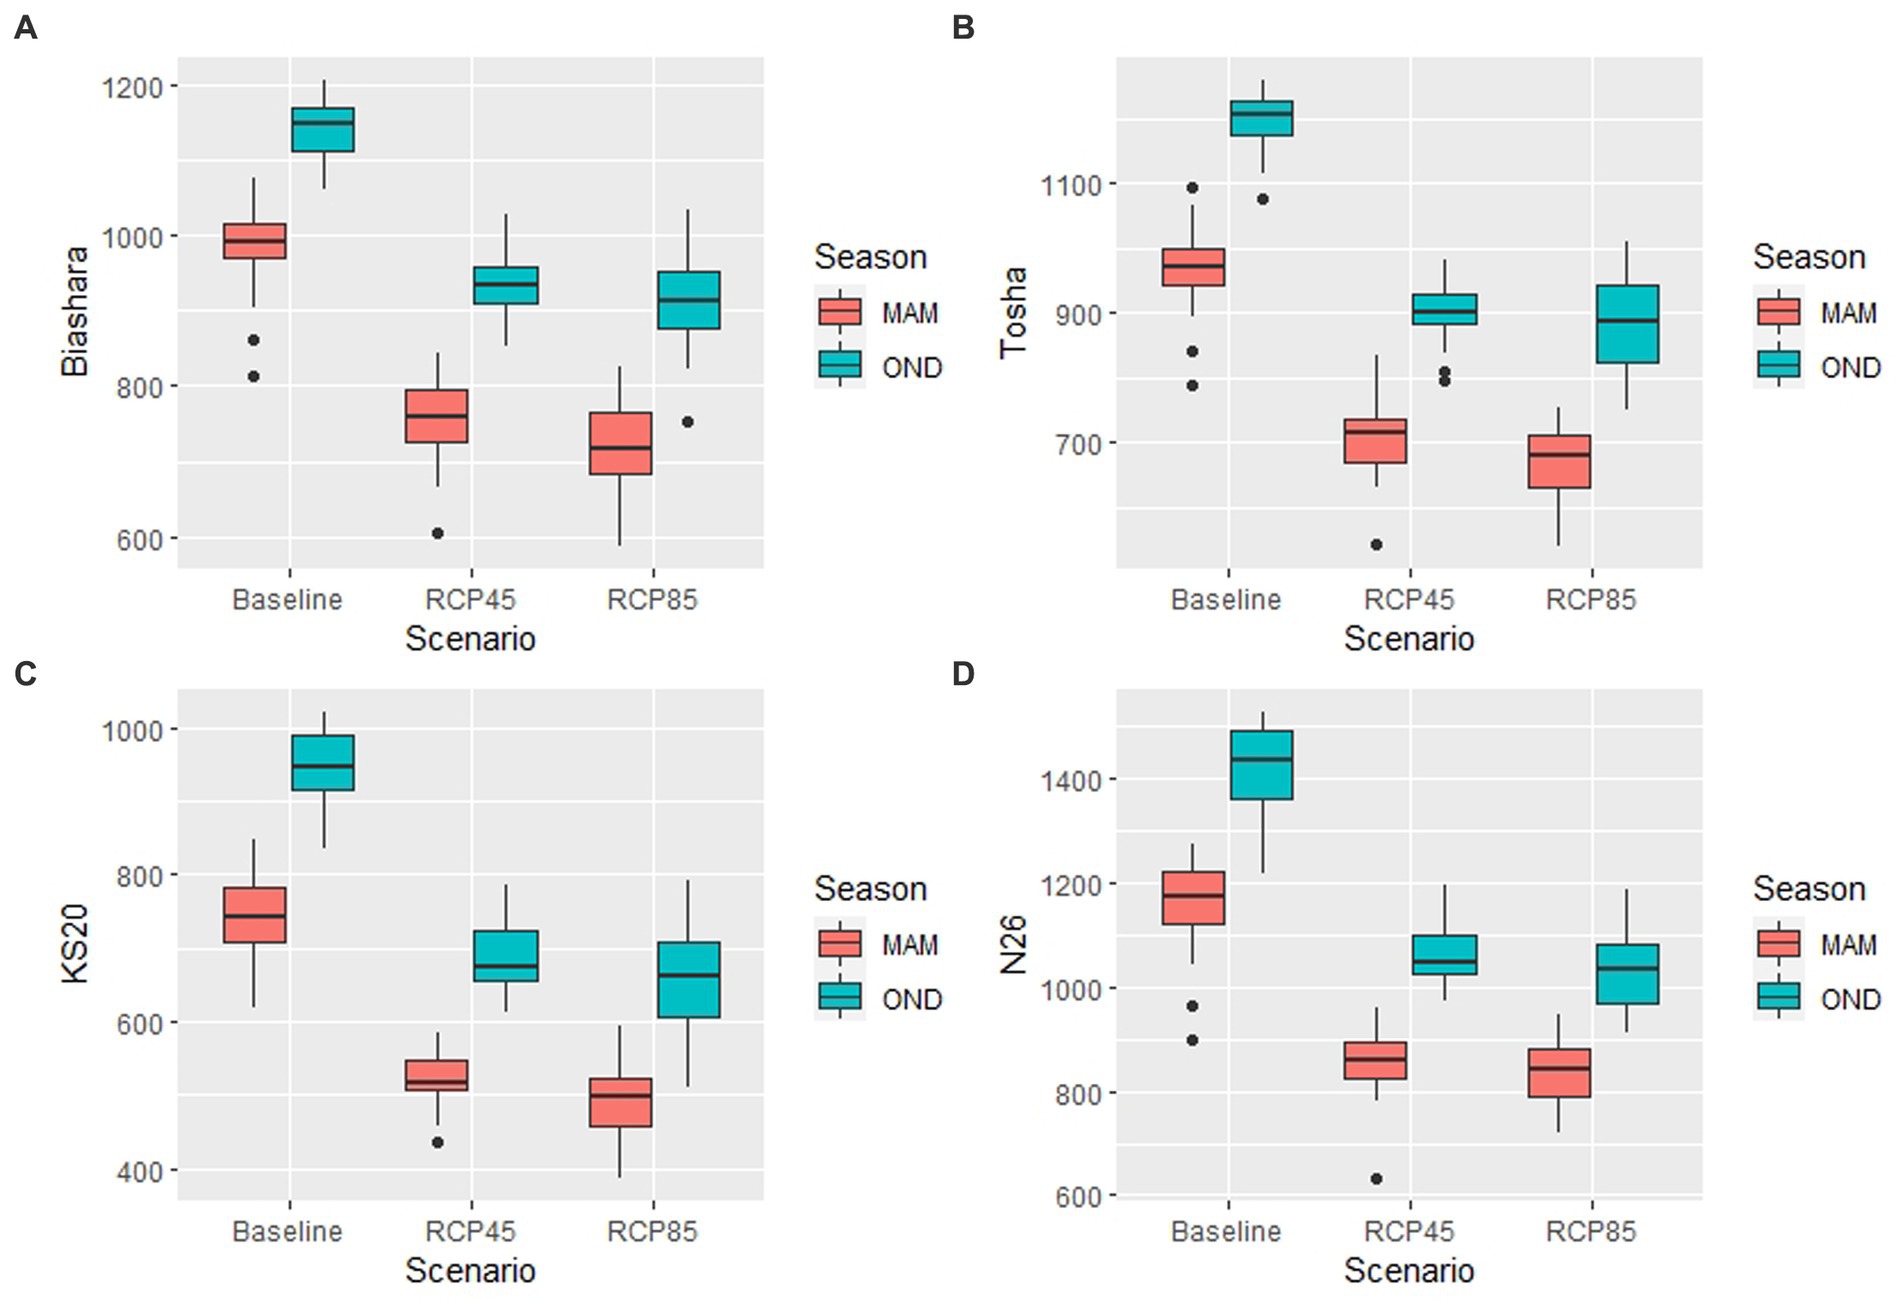
Figure 4. The effect of changing climate on the yield (kg/ha) of four green gram varieties (A) Biashara, (B) Tosha, (C) KS20, and (D) N26 during the MAM season in red and OND season in blue during the baseline period (1971–2000), RCP 4.5 scenario (2021–2050) and the RCP 8.5 scenario (2021–2050) over the study area.
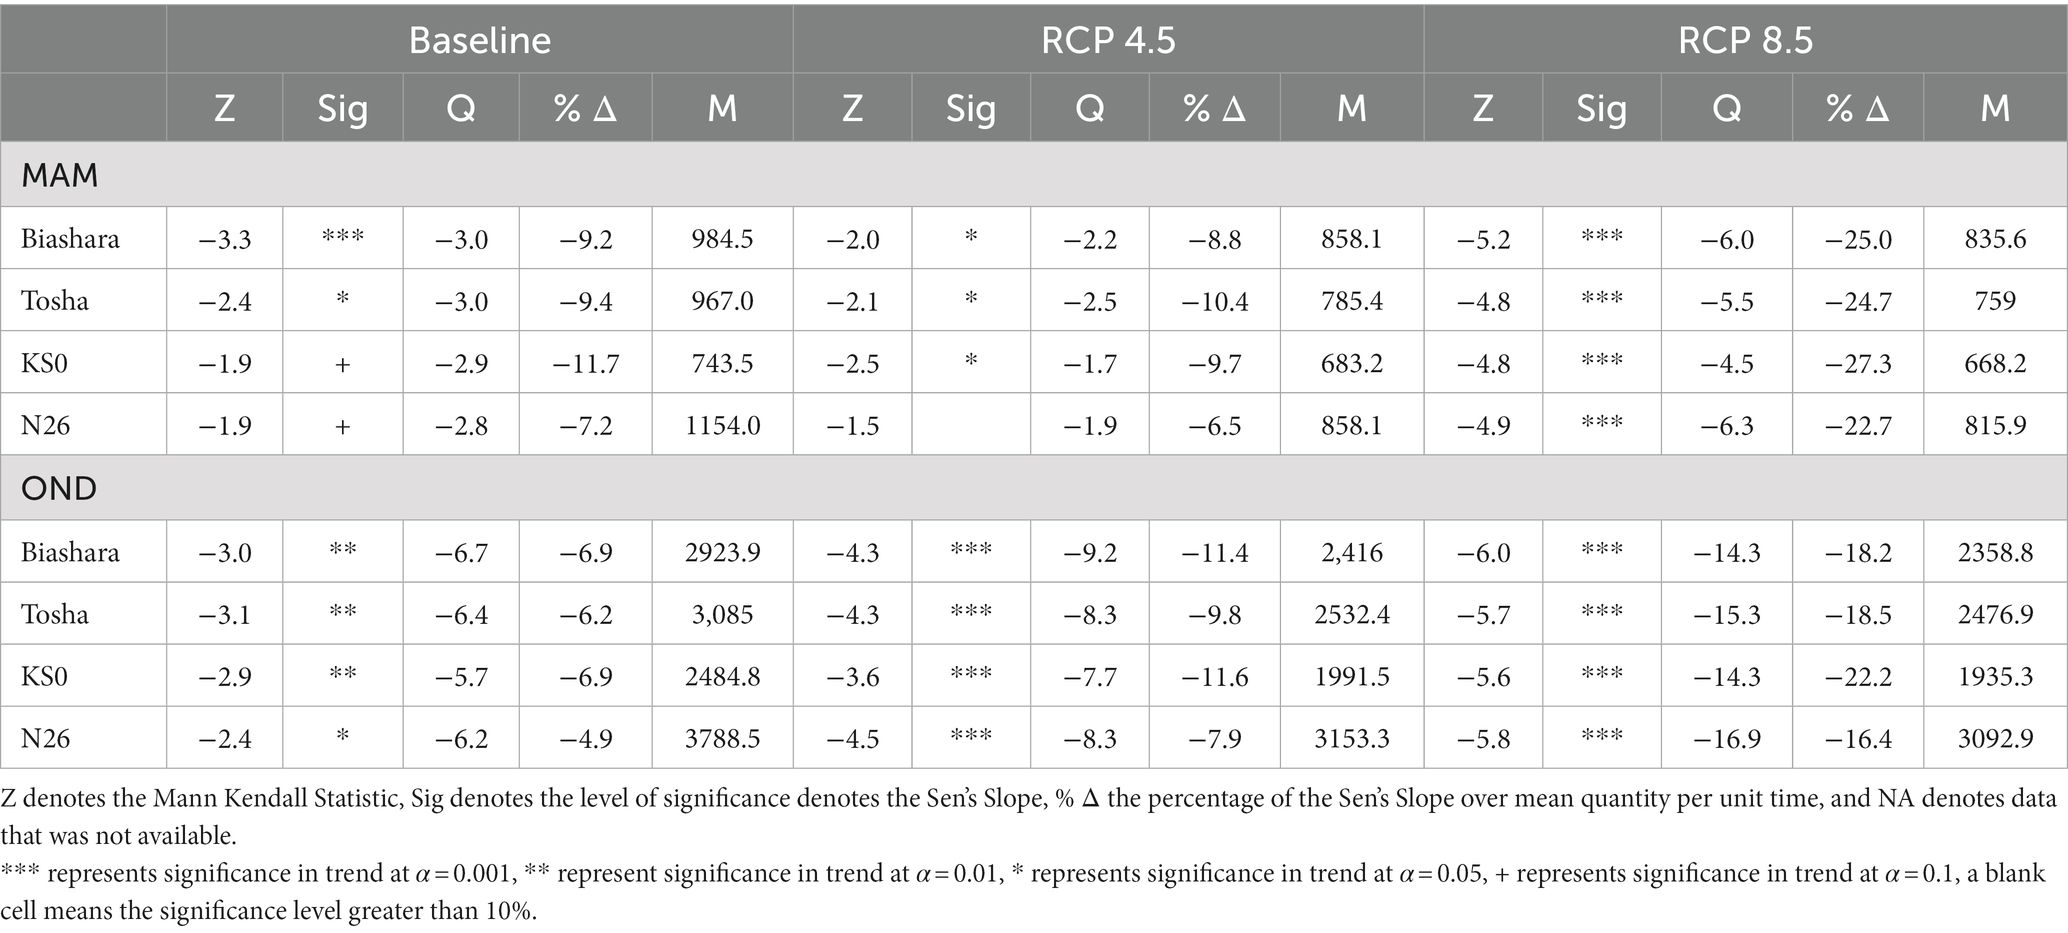
Table 7. Time series analysis of green gram yield for the baseline, RCP 4.5 and RCP 8.5 scenarios during the MAM and OND season.
The decline in yield will be larger during the RCP 8.5 scenario in comparison to the RCP 4.5 scenario in both MAM and OND seasons. This is because the RCP 8.5 scenario represents higher concentrations of greenhouse gas emissions leading to higher temperatures when compared to the RCP 4.5 scenario. Additionally, the yield is greater during the OND season compared to the MAM season since it receives more rainfall hence more water for green gram growth and development. Shisanya et al. (2011) correlation analysis between rainfall and NDVI showed that the March–May (MAM) season was not as dependable as the October–December (OND) season in the lower eastern region of Kenya.
High temperatures expected in the future can reduce yield by accelerating the shedding of green gram flowers which can lead to the loss of potential pods (Hatfield and Prueger, 2015; Kaur et al., 2015). High temperatures can also decrease photosynthetic rates, by inducing chlorophyll loss and reduced carbon assimilation and fixation (Islam, 2015; El lateff et al., 2018), thus reducing pod weights and subsequently the final yield. Largely, the increased levels of greenhouse emissions will favour higher temperatures which could enhance moisture evaporation and if conditions are favourable, yield small precipitation gains. However, the amount of precipitation received will be highly variable and not sufficient to increase green gram production.
Figure 5 presents a boxplot on the effects of climate change on green gram biomass during the MAM and OND season. The figure shows that the OND season is more favourable for green gram biomass compared to the MAM season, and there will be a decline in biomass in the future under the RCP 4.5 and RCP 8.5 climate scenarios during both the MAM and OND seasons. Table 8 presents the results of the trend of simulated green gram yield during the MAM and OND season under the baseline, RCP 4.5 and RCP 8.5 climate scenarios. The table shows that the observed decline in biomass in the future under the RCP 4.5 and RCP 8.5 scenarios will be statistically significant, the decline in biomass is slightly larger during the RCP 8.5 scenario in comparison to the RCP 4.5 scenario in both MAM and OND seasons.
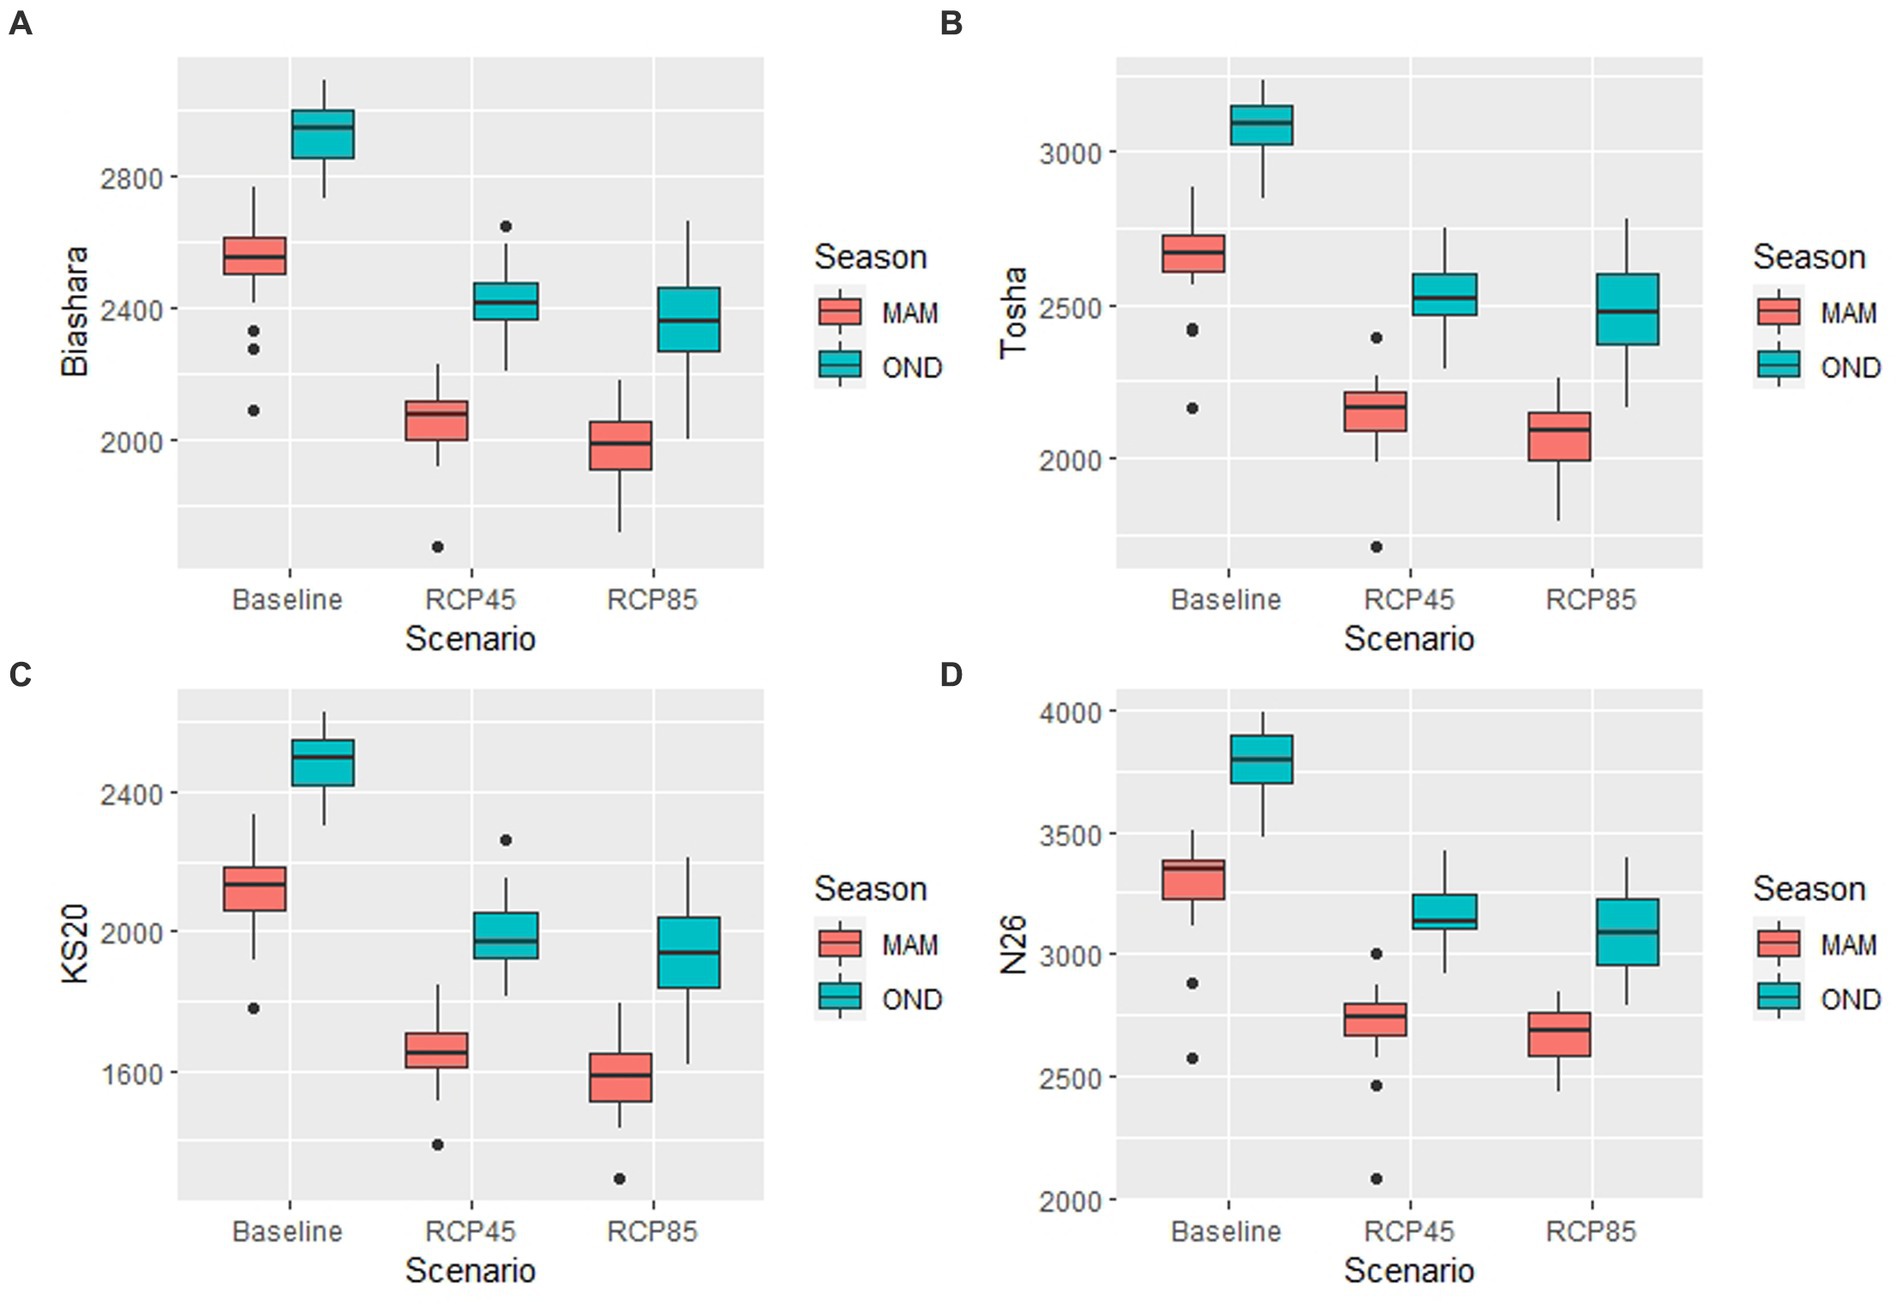
Figure 5. The effect of changing climate on the biomass (kg/ha) of four green gram varieties (A) Biashara, (B) Tosha, (C) KS20, and (D) N26 during the MAM season in red and OND season in blue during the baseline period (1971–2000), RCP 4.5 scenario (2021–2050) and the RCP 8.5 scenario (2021–2050) over the study area.
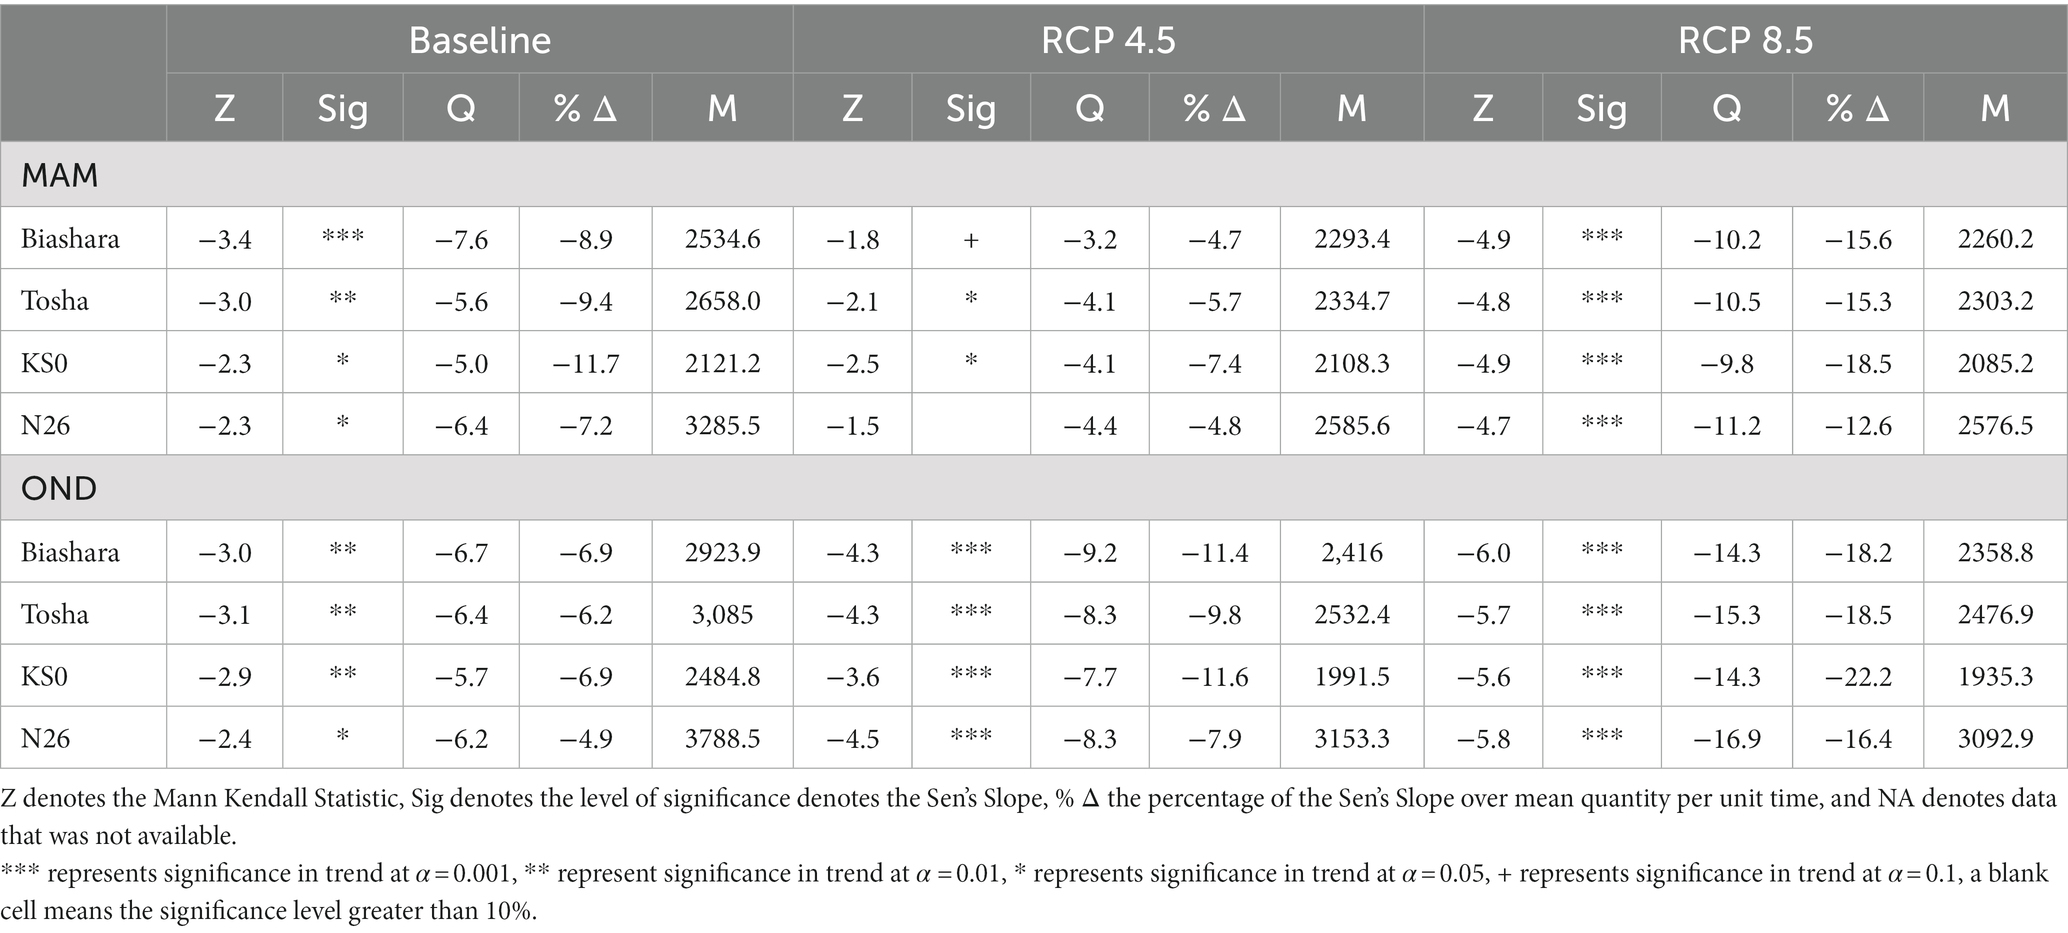
Table 8. Time series analysis of green gram biomass for the baseline, RCP 4.5 and RCP 8.5 Scenarios during the MAM and OND season.
The reduction in biomass can be attributed to the increase in maximum and minimum temperatures. High temperatures enhance the rate of evapotranspiration which may cause a plant to decrease its crop growth cycle or wilt and in consequence reduce biomass production.
Figure 6 presents a boxplot on the effects of climate change on green gram days to maturity during the MAM and OND season. The figure shows that the number of days to maturity will be longer during the OND season when compared to the MAM season, there will also be a decline in the number of days to maturity of green grams scenarios under the RCP 4.5 and RCP 8.5 climate scenarios during both the MAM and OND seasons. Table 8 presents the results of the trend of simulated green gram days to maturity during the MAM and OND season under the baseline, RCP 4.5 and RCP 8.5 climate scenarios. The table shows that the observed decline in the number of days to maturity in the future under the RCP 4.5 and RCP 8.5 scenarios will be statistically significant. Other studies have found that an increase in temperature, as expected in the future, can lead to a reduction in the number of days required for green grams to mature (Oplinger et al., 1990; Mogotsi, 2006; El lateff et al., 2018). A change in temperature by 8–10°C from the optimum can result in a shorter phenology period, especially during the vegetative phase leading to earlier maturity (Luo, 2011; Hatfield and Prueger, 2015).
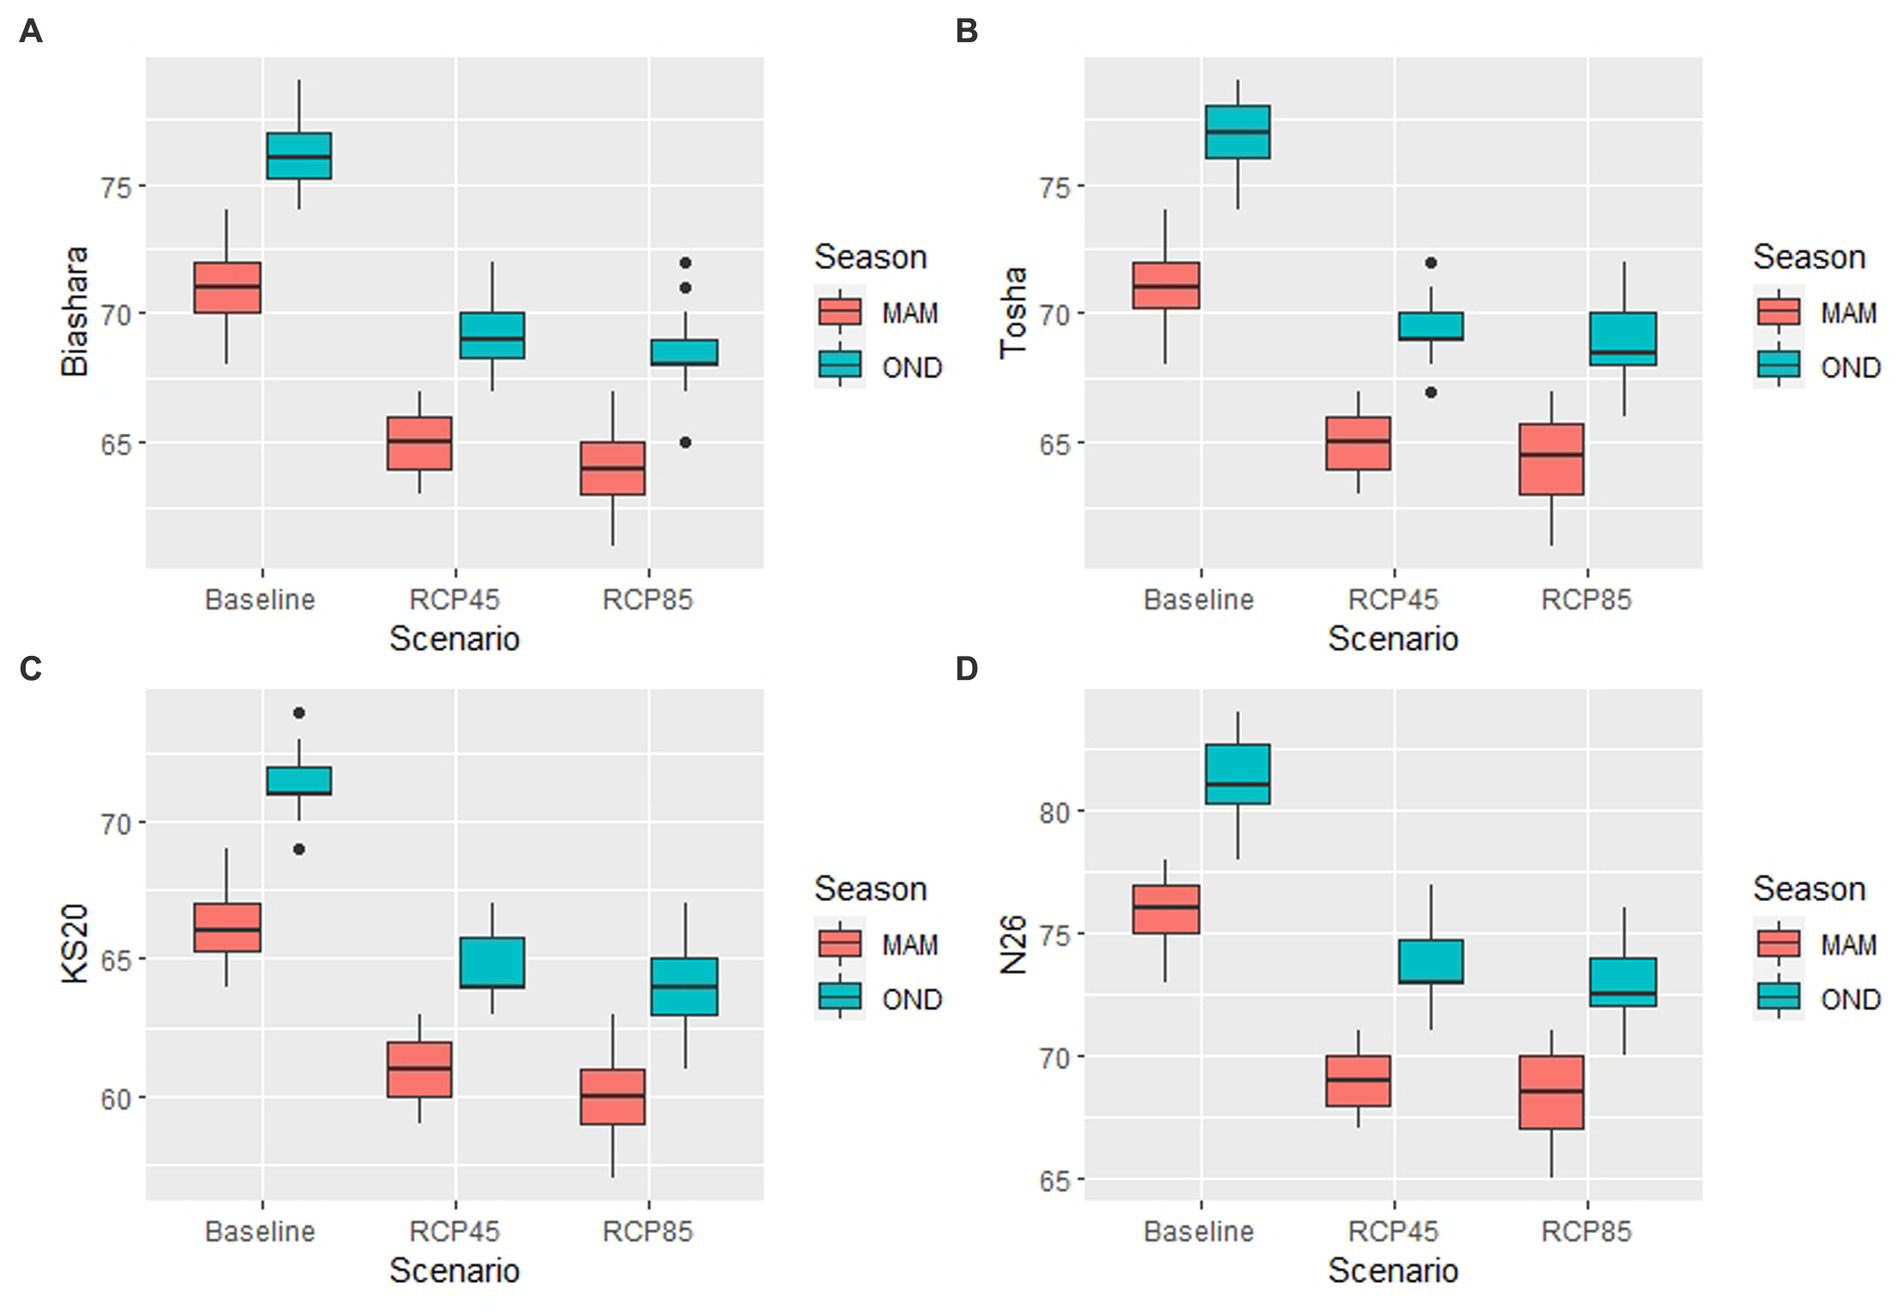
Figure 6. The effect of changing climate on the days to maturity of four green gram varieties (A) Biashara, (B) Tosha, (C) KS20, and (D) N26 during the MAM season in red and OND season in blue during the baseline period (1971–2000), RCP 4.5 scenario (2021–2050) and the RCP 8.5 scenario (2021–2050) over the study area.
The calibrated green gram model captured the observed yield, biomass, and days to maturity of the four varieties of green gram shown by a coefficient of determination ranging between 87.0 and 99.0%; bias values between 1.3 and 25.3 and levels of normalized root mean square error ranging between 4.7 and 45.5%. The CORDEX RCA4 equal weight ensemble model performed best in replicating the observed rainfall over Kitui and was used to simulate the effects of climate change on green gram production (Table 9).

Table 9. Time series analysis of green gram days to maturity for the baseline, RCP 4.5 and RCP 8.5 scenarios during the MAM and OND season.
In the future, during both the RCP 4.5 and RCP 8.5 scenarios, rainfall in Kitui is expected to vary appreciably with time while temperatures are projected to increase due to the projected rise in greenhouse gas emissions. The increase in temperature in the future will result in a reduction in days to maturity for green gram production. In addition to this, the expected variability in rainfall in the future for Kitui will be unfavourable for green gram production possibly leading to reduced pod setting and increased biomass production. The increase in temperature is more during the RCP 8.5 scenario in comparison to the RCP 4.5 scenario. This is because the RCP 8.5 scenario represents higher concentrations of greenhouse gas emissions than the RCP 4.5 scenario.
Given that the government aims to revive farming in the ASALs by promoting climate-smart agriculture through planting drought-resistance crops, there is a need to develop green gram varieties which are more tolerant to the expected increase in rainfall and temperature to increase yield and in turn benefit farmers, the society and the country at large.
The original contributions presented in the study are included in the article/Supplementary material, further inquiries can be directed to the corresponding author.
The concepts and methodology were developed by JM, FO, and JN. The data were analyzed by JM and JN. The manuscript was written under the direction of FO, JN, FK, and MM. All authors contributed to the article and approved the submitted version.
This research paper is part of the PhD thesis for the lead author at the University of Nairobi, Kenya. The authors acknowledge sources of data used as provided by the Kenya Meteorological Department, Climate Research Unit (CRU) and Coordinated Regional Downscaling Experiment (CORDEX). The lead author expresses appreciation to the German Academic Exchange Service (DAAD) scholarship for the financial support.
The authors declare that the research was conducted in the absence of any commercial or financial relationships that could be construed as a potential conflict of interest.
All claims expressed in this article are solely those of the authors and do not necessarily represent those of their affiliated organizations, or those of the publisher, the editors and the reviewers. Any product that may be evaluated in this article, or claim that may be made by its manufacturer, is not guaranteed or endorsed by the publisher.
Adhikari, U., Nejadhashemi, A. P., and Woznicki, S. A. (2015). Climate change and eastern Africa: a review of impact on major crops. Food Energy Secur. 4, 110–132. doi: 10.1002/fes3.61
Akhter, J., Das, L., and Deb, A. (2017). CMIP5 ensemble-based spatial rainfall projection over homogeneous zones of India. Clim. Dyn. 49, 1885–1916. doi: 10.1007/s00382-016-3409-8
Araghi, A., Martinez, C. J., and Olesen, J. E. (2022). Evaluation of multiple gridded solar radiation data for crop modeling. Eur. J. Agron. 133:126419. doi: 10.1016/J.EJA.2021.126419
Asseng, S., Zhu, Y., Basso, B., Wilson, T., and Cammarano, D. (2014). “Simulation modeling: applications in cropping systems,” in N. K. AlfenVan Encyclopedia of Agriculture and Food Systems (Elsevier), Amsterdam, 102–112.
Ayugi, B. O., Wang, W., and Chepkemoi, D. (2016). Analysis of spatial and temporal patterns of rainfall variations over Kenya. Environ. Earth Sci. 6, 69–83.
Barron, J., Rockström, J., Gichuki, F., and Hatibu, N. (2003). Dry spell analysis and maize yields for two semi-arid locations in East Africa. Agric. For. Meteorol. 117, 23–37. doi: 10.1016/S0168-1923(03)00037-6
Bobadoye, A., Ogara, W., Ouma, G., and Onono, J. (2016). Assessing climate change adaptation strategies among rural Maasai pastoralist in Kenya. Am. J. Rural Dev. 4, 120–128. Available at: http://erepository.uonbi.ac.ke/handle/11295/100726 (accessed April 1, 2022).
Buontempo, C., Mathison, C., Jones, R., Williams, K., Wang, C., and McSweeney, C. (2015). An ensemble climate projection for Africa. Clim. Dyn. 44, 2097–2118. doi: 10.1007/s00382-014-2286-2
Chauhan, Y. S., Douglas, C., Rachaputi, R. C. N., Agius, P., Martin, W., King, K., et al. (2010). Physiology of Mungbean and development of the Mungbean crop model. in Proceedings of the 1st Australian Summer Grains Conference (Gold Coast, Australia), 1–10.
Chauhan, Y. S., and Rachaputi, R. C. N. (2014). Defining agro-ecological regions for field crops in variable target production environments: a case study on mungbean in the northern grains region of Australia. Agric. For. Meteorol. 194, 207–217. doi: 10.1016/J.AGRFORMET.2014.04.007
Chauhan, Y. S., and Williams, R. (2018). Physiological and agronomic strategies to increase Mungbean yield in climatically variable environments of northern Australia. Agron 2018 8:83. doi: 10.3390/AGRONOMY8060083
Chisanga, C. B., Moombe, M., and Elijah, P. (2022). Modelling climate change impacts on maize. CABI Rev. 2022. doi: 10.1079/CABIREVIEWS202217008
Cruz Benítez, L., and Ramírez Amezcua, F. J. (2007). Climate Change 2007: Mitigation of Climate Change. Cambridge University Press, Cambridge, 159.
Damodaram, T., Priya, P. K., and Swamy, A. (2014). Impact of sugar industry effluent on the phenology of green gram variety LGG 460. Int. J. Appl. Sci. Eng. Res 3, 938–943. doi: 10.6088/ijaser.030500004
Deines, J. M., Patel, R., Liang, S. Z., Dado, W., and Lobell, D. B. (2021). A million kernels of truth: insights into scalable satellite maize yield mapping and yield gap analysis from an extensive ground dataset in the US Corn Belt. Remote Sens. Environ. 253:112174. doi: 10.1016/J.RSE.2020.112174
Dosio, A. (2017). Projection of temperature and heat waves for Africa with an ensemble of CORDEX regional climate models. Clim. Dyn. 49, 493–519. doi: 10.1007/s00382-016-3355-5
Duarte, Y. C. N., and Sentelhas, P. C. (2020). NASA/POWER and DailyGridded weather datasets—how good they are for estimating maize yields in Brazil? Int. J. Biometeorol. 64, 319–329. doi: 10.1007/S00484-019-01810-1/FIGURES/4
El lateff, E. A., Abd El-salam, M., Selim, M., Tawfik, M., El-kramany, M., and Farrag, A. (2018). Effect of climate change on MUNGBEAN growth and productivity under EGYPTIAN conditions. Int. J. Agric. For. Life Sci. 2, 16–23.
Endris, H. S., Omondi, P., Jain, S., Lennard, C., Hewitson, B., Chang’a, L., et al. (2013). Assessment of the performance of CORDEX regional climate models in simulating east African rainfall. J. Clim. 26, 8453–8475. doi: 10.1175/JCLI-D-12-00708.1
Eriksen, S. H., Brown, K., and Kelly, P. M. (2005). The dynamics of vulnerability: locating coping strategies in Kenya and Tanzania. Geogr. J. 171, 287–305. doi: 10.1111/j.1475-4959.2005.00174.x
Gaiser, T., and Graef, F. (2001). Optimisation of a parametric land evaluation method for cowpea and pearl millet production in semiarid regions. Agronomie 21, 705–712. doi: 10.1051/agro:2001164
Geetika, G., Collins, M., Singh, V., Hammer, G., Mellor, V., Smith, M., et al. (2022). Canopy and reproductive development in mungbean (Vigna radiata). Crop Pasture Sci. 73, 1142–1155. doi: 10.1071/CP21209
Gentry, J., and Gordon, C. (2010). Mungbean management guide. Queensland Available at: www.mungbean.org.au
Gibba, P., Sylla, M. B., Okogbue, E. C., Gaye, A. T., Nikiema, M., and Kebe, I. (2019). State-of-the-art climate modeling of extreme precipitation over Africa: analysis of CORDEX added-value over CMIP5. Theor. Appl. Climatol. 137, 1041–1057. doi: 10.1007/s00704-018-2650-y
Grealish, G. A., Ringrose-Voase, A. B., Fitzpatrick, A C., Land, R. C., Australia, S., and Gerardgrealish, E. (2010). Soil fertility evaluation in Negara Brunei Darussalam. 19th World Congress of Soil Science, Brisbane, Australia
Hanumantharao, B., Nair, R. M., and Nayyar, H. (2016). Salinity and high temperature tolerance in mungbean [Vigna radiata (L.) Wilczek] from a physiological perspective. Front. Plant Sci. 7, 1–20. doi: 10.3389/fpls.2016.00957
Harris, I., Jones, P. D., Osborn, T. J., and Lister, D. H. (2014). Updated high-resolution grids of monthly climatic observations - the CRU TS3.10 dataset. Int. J. Climatol. 34, 623–642. doi: 10.1002/joc.3711
Hatfield, J. L., and Prueger, J. H. (2015). Temperature extremes: effect on plant growth and development. Weather Clim. Extrem. 10, 4–10. doi: 10.1016/j.wace.2015.08.001
Hauggaard-Nielsen, H., Jørnsgaard, B., Kinane, J., and Jensen, E. S. (2008). Grain legume–cereal intercropping: the practical application of diversity, competition and facilitation in arable and organic cropping systems. Renew. Agric. Food Syst. 23, 3–12. doi: 10.1017/S1742170507002025
Indeje, M., Semazzi, F. H. M., Xie, L., and Ogallo, L. J. (2001). Mechanistic model simulations of the east African climate using NCAR regional climate model: influence of large-scale orography on the Turkana low-level jet. J. Clim. 14, 2710–2724. doi: 10.1175/1520-0442(2001)014<2710:MMSOTE>2.0.CO;2
Islam, M. D. T. (2015). Effects of high temperature on photosynthesis and yield in mungbean. Bangladesh J. Bot. 44, 451–454. doi: 10.3329/bjb.v44i3.38553
Jame, Y. W., and Cutforth, H. W. (1996). Crop growth models for decision support systems. Can. J. Plant Sci. 76, 9–19. doi: 10.4141/CJPS96-003
Kalele, D. N., Ogara, W. O., Oludhe, C., and Onono, J. O. (2021). Climate change impacts and relevance of smallholder farmers’ response in arid and semi-arid lands in Kenya. Sci. African. 12:e00814. doi: 10.1016/J.SCIAF.2021.E00814
Kaur, R., Bains, T. S., Bindumadhava, H., and Nayyar, H. (2015). Responses of mungbean (Vigna radiata L.) genotypes to heat stress: effects on reproductive biology, leaf function and yield traits. Sci. Hortic. (Amsterdam) 197, 527–541. doi: 10.1016/j.scienta.2015.10.015
Kephe, P. N., Ayisi, K. K., and Petja, B. M. (2021). Challenges and opportunities in crop simulation modelling under seasonal and projected climate change scenarios for crop production in South Africa. Agric. Food Secur. 10, 1–24. doi: 10.1186/S40066-020-00283-5
Kilimo Trust (2017). Characteristics of green gram markets in the east African community trade in Staples (REACTS) project. Kampala, Uganda Available at: www.kilimotrust.org
Kisaka, M. O., Mucheru-Muna, M., Ngetich, F. K., Mugwe, J. N., Mugendi, D., and Mairura, F. (2015). Rainfall variability, drought characterization, and efficacy of rainfall data reconstruction: case of eastern Kenya. Adv. Meteorol. 2015, 1–16. doi: 10.1155/2015/380404
Kisembe, J., Favre, A., Dosio, A., Lennard, C., Sabiiti, G., and Nimusiima, A. (2019). Evaluation of rainfall simulations over Uganda in CORDEX regional climate models. Theor. Appl. Climatol. 137, 1117–1134. doi: 10.1007/s00704-018-2643-x
Kostková, M., Hlavinka, P., Pohanková, E., Kersebaum, K. C., Nendel, C., Gobin, A., et al. (2021). Performance of 13 crop simulation models and their ensemble for simulating four field crops in Central Europe. J. Agric. Sci. 159, 69–89. doi: 10.1017/S0021859621000216
Lambrides, C. J., and Godwin, I. D. (2007). “Mungbean” in Pulses, sugar and tuber crops (Berlin, Heidelberg: Springer Berlin Heidelberg), 69–90.
Luhunga, P., Botai, J., and Kahimba, F. (2016). Evaluation of the performance of CORDEX regional climate models in simulating present climate conditions of Tanzania. J. South. Hemisph. Earth Syst. Sci. 66, 32–54. doi: 10.22499/3.6601.005
Luo, Q. (2011). Temperature thresholds and crop production: a review. Clim. Chang. 109, 583–598. doi: 10.1007/s10584-011-0028-6
Mallya, G., Mishra, V., Niyogi, D., Tripathi, S., and Govindaraju, R. S. (2015). Trends and variability of droughts over the Indian monsoon region. Weather Clim. Extrem. 12, 43–68. doi: 10.1016/j.wace.2016.01.002
Mann, H. B. (1945). Nonparametric tests against trend. Econometrica 13, 245–259. doi: 10.2307/1907187
Manschadi, A. M., Eitzinger, J., Breisch, M., Fuchs, W., Neubauer, T., and Soltani, A. (2021). Full parameterisation matters for the best performance of crop models: inter-comparison of a simple and a detailed maize model. Int. J. Plant Prod. 15, 61–78. doi: 10.1007/S42106-020-00116-2/FIGURES/12
Masaku, M., Githiri, S., Onyango, C., and Masinde, P. (2018). Evaluation of agronomic performance of green gram accessions grown under reduced light intensity in the arid and semi-arid areas of Kenya. Int. J. Plant Soil Sci. 23, 1–11. doi: 10.9734/ijpss/2018/41813
Mogotsi, K. K. (2006). Vigna radiata (L.) Cereals and pulses/Céréales et légumes secs. Available at: (https://www.feedipedia.org/node/14363).
Morton, F., Smith, R., and Poehlman, J. (1992). The mungbean. Choice Rev. 30:2077. doi: 10.5860/CHOICE.30-2077
Mugo, J. W., Opijah, F. J., Ngaina, J., Karanja, F., and Mburu, M. (2020). Rainfall variability under present and future climate scenarios using the Rossby center Bias-corrected regional climate model. Am. J. Clim. Chang. 09, 243–265. doi: 10.4236/ajcc.2020.93016
Mukhala, E., Ngaina, J. N., and Maingi, N. W. (2017). Downscaled Climate Analysis on Historical, Current and Future Trends in the East African Community region. Nairobi, Kenya. KIPPRA, Nairobi, Kenya
Musie, M., Sen, S., and Srivastava, P. (2020). Application of CORDEX-AFRICA and NEX-GDDP datasets for hydrologic projections under climate change in Lake Ziway sub-basin, Ethiopia. J. Hydrol. Reg. Stud. 31:100721. doi: 10.1016/j.ejrh.2020.100721
Mutayoba, E., and Kashaigili, J. J. (2017). Evaluation for the performance of the CORDEX regional climate models in simulating rainfall characteristics over Mbarali River catchment in the Rufiji Basin, Tanzania. J. Geosci. Environ. Prot. 05, 139–151. doi: 10.4236/gep.2017.54011
Nain, A. S., and Kersebaum, K. C. (2007). Calibration and validation of CERES model for simulating. K. C. Hecker, J. M. Mirschel, and W. Wegehenkel, (eds) Modelling Water and Nutrient Dynamics in Soil–Crop Systems. Springer, Dordrecht
Nair, R. M., Yang, R. Y., Easdown, W. J., Thavarajah, D., Thavarajah, P., Hughes, J. D. A., et al. (2013). Biofortification of mungbean (Vigna radiata) as a whole food to enhance human health. J. Sci. Food Agric. 93, 1805–1813. doi: 10.1002/jsfa.6110
Nasir, M., and Sidhu, J. S. (2012). “Common pulses: chickpea, lentil, Mungbean, black gram, pigeon pea and Indian vetch” in Dry Beans and Pulses Production, Processing and Nutrition. eds. M. Siddiq and M. A. Uebersax (Hoboken, NJ: Wiley), 283–309.
Nikulin, G., Jones, C., Giorgi, F., Asrar, G., Büchner, M., Cerezo-Mota, R., et al. (2012). Precipitation climatology in an ensemble of CORDEX-Africa regional climate simulations. J. Clim. 25, 6057–6078. doi: 10.1175/JCLI-D-11-00375.1
Ogega, O. M., Oludhe, C., Ojwang, L., and Mbugua, J. (2016). Localized knowledge for local climate change adaptation: a focus on coastal smallholder farmers in Kenya. Int. J. Agric. Environ. Biotechnol. 1, 67–88. Available at: www.ijaeb.org
Oloruntade, A. J., Mohammad, T. A., Ghazali, H., and Wayayok, A. (2016). Minimum temperature in the Niger South Basin, Nigeria. Malays. J. Civ. Eng. 28, 365–381.
Omoyo, N. N., Wakhungu, J., and Oteng’i, S. (2015). Effects of climate variability on maize yield in the arid and semi arid lands of lower eastern Kenya. Agric. Food Secur. 4, 1–13. doi: 10.1186/s40066-015-0028-2
Ongoma, V., and Chen, H. (2017). Temporal and spatial variability of temperature and precipitation over East Africa from 1951 to 2010. Meteorog. Atmos. Phys. 129, 131–144. doi: 10.1007/s00703-016-0462-0
Ongoma, V., Chen, H., and Gao, C. (2019). Evaluation of CMIP5 twentieth century rainfall simulation over the equatorial East Africa. Theor. Appl. Climatol. 135, 893–910. doi: 10.1007/s00704-018-2392-x
Ongoma, V., Guirong, T., Ogwang, B., and Ngarukiyimana, J. (2015). Diagnosis of seasonal rainfall variability over East Africa: a case study of 2010-2011 drought over Kenya. Pakistan J. Meteorol. 11, 13–21.
Opiyo, F. E. O. (2014). Climate variability and change on vulnerability and adaptation among Turkana pastoralists in North-Western Kenya. Available at: http://erepository.uonbi.ac.ke/bitstream/handle/11295/77661/Omondi_Climate_variability_and_change_on_vulnerability_and_adaptation_among_Turkana_pastoralists_in_north-western_Kenya.pdf?sequence=3
Oplinger, E. S., Hardman, L. L., Kaminski, A. R., Combs, S. M., and Doll, J. D. (1990). Mungbean. Available at: https://hort.purdue.edu/newcrop/afcm/mungbean.html (Accessed April 1, 2022).
Porto de Carvalho, J. R., Assad, E. D., de Oliveira, A. F., and Silveira Pinto, H. (2014). Annual maximum daily rainfall trends in the Midwest, southeast and southern Brazil in the last 71 years. Weather Clim. Extrem. 5-6, 7–15. doi: 10.1016/j.wace.2014.10.001
Pramanick, B., Brahmachari, K., Ghosh, A., and Zodape, S. T. (2014). Foliar nutrient management through Kappaphycus and Gracilaria saps in rice-potato-green gram crop sequence. J. Sci. Ind. Res. (India). 73, 613–617.
Ranawake, A., Dahanayaka, N., Amarasingha, U., Rodrigo, W., and Rodrigo, U. (2012). Effect of water stress on growth and yield of mung bean (Vigna radiata L). Trop. Agric. Res. Ext. 14, 76–79. doi: 10.4038/tare.v14i4.4851
Raza, A., Razzaq, A., Mehmood, S. S., Zou, X., Zhang, X., Lv, Y., et al. (2019). Impact of climate change on crops adaptation and strategies to tackle its outcome: a review. Plan. Theory 8:34. doi: 10.3390/PLANTS8020034
Raza, M. H., Sadozai, G. U., Baloch, M. S., Khan, E. A., Din, I., and Wasim, K. (2012). Effect of irrigation levels on growth and yield of mungbean. Pakistan J. Nutr. 11, 974–977. doi: 10.3923/pjn.2012.974.977
Robertson, M. J., Carberry, P. S., Huth, N. I., Turpin, J. E., Probert, M. E., Poulton, P. L., et al. (2002). Simulation of growth and development of diverse legume species in APSIM. Aust. J. Agric. Res. 53, 429–446. doi: 10.1071/AR01106
SASOL Foundation (2014). Green Grams Hand Book. Kitui, Kenya Available at: http://www.sasolfoundation.co.ke/2013/wp-content/uploads/2015/02/Green-Grams-Manual.pdf
Sen, P. K. (1968). Estimates of the regression coefficient based on Kendall’s tau. J. Am. Stat. Assoc. 63, 1379–1389. doi: 10.1080/01621459.1968.10480934
Shisanya, C. A., Recha, C., and Anyamba, A. (2011). Rainfall variability and its impact on normalized difference vegetation index in arid and semi-arid lands of Kenya. Int. J. Geosci. 02, 36–47. doi: 10.4236/ijg.2011.21004
Srivastava, A. K., Ceglar, A., Zeng, W., Gaiser, T., Mboh, C. M., and Ewert, F. (2020). The implication of different sets of climate variables on regional maize yield simulations. Atmos. 2020 11:180. doi: 10.3390/ATMOS11020180
Stanzel, P., Kling, H., and Bauer, H. (2018). Climate change impact on west African rivers under an ensemble of CORDEX climate projections. Clim. Serv. 11, 36–48. doi: 10.1016/j.cliser.2018.05.003
Taxak, A. K., Murumkar, A. R., and Arya, D. S. (2014). Long term spatial and temporal rainfall trends and homogeneity analysis in Wainganga basin. Central India. Weather Clim. Extrem. 4, 50–61. doi: 10.1016/j.wace.2014.04.005
Taylor, K. E. (2001). Summarizing multiple aspects of model performance in a single diagram. J. Geophys. Res. Atmos. 106, 7183–7192. doi: 10.1029/2000JD900719
Tharanathan, R. N., and Mahadevamma, S. (2003). Grain legumes—a boon to human nutrition. Trends Food Sci. Technol. 14, 507–518. doi: 10.1016/J.TIFS.2003.07.002
Tui, S. H. K., Descheemaeker, K., Valdivia, R. O., Masikati, P., Sisito, G., Moyo, E. N., et al. (2022). Correction to: climate change impacts and adaptation for dryland farming systems in Zimbabwe: a stakeholder-driven integrated multi-model assessment (climatic change, (2021), 168, 1-2, (10), 10.1007/s10584-021-03151-8). Clim. Chang. 174, 1–21. doi: 10.1007/s10584-022-03433-9
Vitali, G., Rogosin, S., and Baldoni, G. (2019). Climate change and grain production fluctuations. Available at: https://arxiv.org/abs/2002.07039v1 (accessed March 24, 2023).
Warnatzsch, E. A., and Reay, D. S. (2019). Temperature and precipitation change in Malawi: evaluation of CORDEX-Africa climate simulations for climate change impact assessments and adaptation planning. Sci. Total Environ. 654, 378–392. doi: 10.1016/j.scitotenv.2018.11.098
Wg1, I. A. (2007). Climate change 2007: The physical science basis Cambridge University Press (http://www.ipcc.ch/publications_and_data/ar4/wg1/en/contents.html
Yaghoubi, F., Bannayan, M., and Asadi, G. A. (2020). Performance of predicted evapotranspiration and yield of rainfed wheat in the Northeast Iran using gridded AgMERRA weather data. Int. J. Biometeorol. 64, 1519–1537. doi: 10.1007/S00484-020-01931-Y/FIGURES/14
Yin, X., Struik, P. C., and Kropff, M. J. (2004). Role of crop physiology in predicting gene-to-phenotype relationships. Trends Plant Sci. 9, 426–432. doi: 10.1016/J.TPLANTS.2004.07.007
Keywords: APSIM, ASALs, climate change, CORDEX RCA4 model, green gram, simulation
Citation: Mugo JW, Opijah FJ, Ngaina J, Karanja F and Mburu M (2023) Simulated effects of climate change on green gram production in Kitui County, Kenya. Front. Sustain. Food Syst. 7:1144663. doi: 10.3389/fsufs.2023.1144663
Edited by:
Tafadzwanashe Mabhaudhi, University of KwaZulu-Natal, South AfricaReviewed by:
Charles Bwalya Chisanga, Copperbelt University, ZambiaCopyright © 2023 Mugo, Opijah, Ngaina, Karanja and Mburu. This is an open-access article distributed under the terms of the Creative Commons Attribution License (CC BY). The use, distribution or reproduction in other forums is permitted, provided the original author(s) and the copyright owner(s) are credited and that the original publication in this journal is cited, in accordance with accepted academic practice. No use, distribution or reproduction is permitted which does not comply with these terms.
*Correspondence: Jane Wangui Mugo, amFuZXdAdW9uYmkuYWMua2U=; amFubnltdWdvQGdtYWlsLmNvbQ==
Disclaimer: All claims expressed in this article are solely those of the authors and do not necessarily represent those of their affiliated organizations, or those of the publisher, the editors and the reviewers. Any product that may be evaluated in this article or claim that may be made by its manufacturer is not guaranteed or endorsed by the publisher.
Research integrity at Frontiers
Learn more about the work of our research integrity team to safeguard the quality of each article we publish.