 Chang Li
 Tong Tong
94% of researchers rate our articles as excellent or good
Learn more about the work of our research integrity team to safeguard the quality of each article we publish.
Find out more
ORIGINAL RESEARCH article
Front. Sustain. Food Syst. , 26 May 2023
Sec. Agroecology and Ecosystem Services
Volume 7 - 2023 | https://doi.org/10.3389/fsufs.2023.1141986
This article is part of the Research Topic Traditional Rural Landscapes in a Changing World: the Importance of Producing while Preserving our Natural and Cultural Heritage View all 8 articles
Agricultural heritage is a fundamental aspect of cultural heritage, as it is of significant cultural, economic, and biological value. The objective of this study is to reveal the spatial distribution and change of the Chinese Agricultural Heritage Site (CAHS) by means of spatial analysis. The results show that: (1) The distribution of 532 CAHSs (7 types) is patchy, and the horticulture system is gaining the quantitative advantage (55.26%), (2) The distribution of CAHSs shows the spatial aggregation of “dense in the east and sparse in the west.” The areas of Beijing, Shandong, Zhejiang, and their surroundings form the densest belt region of the heritages, and 44.17% of the CAHSs are distributed in this belt, (3) Single factor analysis shows that culture, population, soil, and elevation are the most critical driving forces that influence the distribution (all explanatory power > 0.20). Two factors interaction analysis confirms that the distribution is influenced by the enhancement of both natural and human factors. Of these, a high explanatory power (>0.70) is related to the matching between culture factors, population factors, and geographic factors (i.e., elevation, soil, and river). This study has the potential to provide scientific evidence for CAHS assessment, protection, and sustainable development.
Due to the excessive use of chemicals and the depletion of water and soil resources, the global agricultural system has faced the problems of ecological imbalance, environmental pollution, and land degradation along with the development of large-scale modern agriculture. The international community has begun to focus on the sustainable value of traditional agricultural systems (Daugstad et al., 2006; Herath et al., 2018). In 2002, the Food and Agriculture Organization of the United Nations (FAO) launched the conservation program of Globally Important Agricultural Heritage Systems (GIAHS) to protect the traditional agricultural systems and their landscapes, biodiversity, knowledge, and cultural system. The project has gradually led to worldwide recognition and protection of GIAHS as a foundation for sustainable management (Dela-Cruz and Koohafkan, 2009). Since the first GIAHS conservation pilot in April 2005 to November 2022, FAO has listed 59 traditional agricultural systems (in 22 countries) on the GIAHS List, 19 of which are located in China (Food and Agriculture Organization of the United Nations (FAO), 2022). In East Asia, the protection work of the National Important Agricultural Heritage System (NIAHS) has also achieved remarkable results. The number of NIAHS in China, South Korea, and Japan is 147, 22, and 15, respectively [Ministry of Agriculture and Rural Affairs of China (MARA), 2015; Ministry of Agriculture, Food and Rural Affairs (MAFRA), 2017; Ministry of Agriculture, Forestry and Fisheries (MAFF), 2020].
Agricultural heritage is an objective reflection of local agricultural and historical farming wisdom, as well as a unique land-use model and farming landscape formed by the long-term co-evolution and dynamic adaptation of the countryside and its surrounding environment [Food and Agriculture Organization of the United Nations (FAO), 2002; Koohafkan, 2012]. These systems and landscapes not only conserve the biodiversity of local society, culture, and economy, but also promote the sustainable development of the regional ecological environment (Min et al., 2022). The concept and classification of agricultural heritage have a wide range of characteristics. According to the geographical conditions and crop types, the agricultural heritage can be classified into 10 types: (1) mountain rice terrace agroecosystems (e.g., the Ifugao rice terraces in the Philippines), (2) multiple cropping/polyculture farming (e.g., maize and root crop-based agroecosystems in Mexico), (3) understory farming systems (e.g., root cropping systems in Pacific island countries), (4) nomadic and semi-nomadic pastoral systems (e.g., nomadic pastoral systems of the Maasai in East Africa), (5) ancient irrigation, soil and water management systems (e.g., the agroforestry heritage systems in Tunisia); (6) complex multi-layered home gardens (e.g., the home garden systems in Caribbean), (7) below sea level systems (e.g., Polder or dyke systems in the Netherlands), (8) tribal agricultural heritage systems (e.g., Seethampheta in Andhra Pradesh, India), (9) high-value crop and spice systems (e.g., Saffron systems in Iran), and (10) hunting-gathering systems (e.g., harvesting of wild rice in Chad) (Koohafkan and Altieri, 2011).
The characteristics, protection, and development of agricultural heritage have always been the emphasis of academic attention. Most of these studies focus on the characteristics of the socio-ecological production landscape, which distinguishes agricultural cultural heritage from other heritage, and investigate a wide range of economic, social, and cultural tourism variables. Such as heritage identification (Ferro-Vázquez et al., 2017; Min et al., 2022), value judgment (Daugstad et al., 2006; Jiao et al., 2019), resource evaluation (Berweck et al., 2013; Jiao et al., 2019; Ding et al., 2022), heritage resource monitoring (Jiao et al., 2022), traditional ecological wisdom (Calvo-Iglesias et al., 2006; Rudolff and Zekri, 2014; Yuan et al., 2014), knowledge and technology system (Lu and Li, 2006; Barrena et al., 2014; Olango et al., 2014; Ren et al., 2018), farmers’ livelihood (Chen et al., 2018; Yang et al., 2018, 2022), heritage tourism (Rogers, 2002; Sun et al., 2011; Anderson, 2018; Chen et al., 2018; Nomura et al., 2018; Ferreira and Sánchez-Martín, 2022), resource management (Koohafkan, 2012; Seung-Seok, 2014; Nomura et al., 2018), development of featured products (Kajima et al., 2017; Izumi, 2020), ecological compensation system (Liu et al., 2014; Zhang and Liu, 2014), and other vital elements and operating mechanisms. These studies evaluate the sustainable resource characteristics and development patterns of agricultural heritage through various variables. They show that regional agricultural heritage systems reflect differences in natural resource endowments (Ferro-Vázquez et al., 2017; Min et al., 2022). For example, the South Asia region is affected by the monsoon climate. The summer floods form unique soil and water use systems such as Kuttanad wetlands in India and floating gardens in Bangladesh (Koohafkan, 2012). The Middle East and North Africa are affected by the tropical desert climate, giving birth to the oasis agricultural system such as Gafsa Oa-ses in Tunisia, Oases System in Atlas Mountains, Morocco, Al Ain and Liwa Historical Date Palm Oases, United Arab Emirates (Santoro et al., 2020). The mountain areas with changeable climates in East Asia and Southeast Asia form a rice ecosystem, such as Hani Rice Terraces in China, and Ifugao Rice Terraces in the Philippines (Food and Agriculture Organization of the United Nations (FAO), 2022). Agricultural heritage also reflects the differences in crop types, land use patterns, biodiversity, agricultural organizing ability, agricultural knowledge, and technology in different regions. For example, combining water management and belief systems in Subak Irrigation Schemes in Bali (Yekti et al., 2017), harmony between Sado’s Satoyama and Crested Ibis in Japan (Barrena et al., 2014), the vertical distribution pattern of forest-village-terrace-river ecological landscape in Hani Rice Terraces System in China (Bai et al., 2012). The findings confirm the impact of complex natural variables (e.g., terrain, climate, and water resources) and social variables (e.g., ethnic, religious, and cultural) on the formation and development of a single agricultural cultural heritage. However, the studies on regional distribution for all agricultural heritages from a geographical perspective are still limited (Fuller et al., 2015).
Spatial analysis techniques are widely used to explore the spatial distribution, morphology, and variations of geographical elements in a specific region (Zheng et al., 2021; Xu and Genovese, 2022). In spatial analysis tools, for instance, in Geographical Information Systems (GIS), all analysis objects are regarded as point features with longitude and latitude. Their spatial pattern characteristics are described by focusing on discrete distribution statistics. This technique has been widely used to analyze the correlation between various cultural heritages and physical, cultural, and socio-economic factors, such as archaeological sites (Yagoub, and Al yammahi, A. A., 2022), historic villages (Jin et al., 2022; Xie et al., 2022), industrial heritage (Zhang et al., 2022), and intangible heritage (Nie et al., 2022).
Previous studies on agricultural heritage have employed spatial analysis techniques, such as the geographical study of 59 GIAHSs and 91 Agricultural Heritage Systems (AHSs) in China, which describe the distribution of typical CAHSs (Liu et al., 2022). However, the Chinese cases in GIAHSs and AHSs, as well as the broader range of Potential Agricultural Heritage Systems (PAHSs) are not been considered yet. The limited number of analyzed subjects would be a constraint factor of the CAHSs distribution pattern description.
Spatial distribution analysis of the agricultural heritage is closely linked with the influencing factors thus revealing scientific evidence for the investigation, monitoring, and management of agricultural heritage. It helps the governments and agricultural sectors in making decisions on heritage protection and development (Zhang and Liu, 2014). Therefore, the present paper aims to add new insights to the study of agricultural heritage distribution and explore the details of its influencing factors. The specific objectives are to (1) map the spatial distribution of CAHSs, (2) compare the differences in CAHSs’ spatial distribution, and (3) illustrate CAHSs’ response to natural factors and human factors.
The data used in this paper are obtained from several public data sources. Nineteen GIAHSs in China are collected from FAO,1 114 AHSs and 399 PAHSs are collected from the Ministry of Agriculture of China.2 Previous studies have found that cultural heritage distribution was affected by many factors, such as natural factors, society, economy, and culture (Jin et al., 2022; Nie et al., 2022; Xie et al., 2022). We collect the potential influencing factors and classified them into two dimensions, namely, natural factors (i.e., annual average temperature, annual average precipitation, elevation, soil, and river) and human factors (i.e., economy, population, and culture), and explore the pattern and rule of CAHSs distribution. These data are from the statistical yearbook of 31 provincial administrative units in Mainland China3 and the Resource and Environmental Science Data Center of the Chinese Academy of Sciences.4
In this interdisciplinary research, we employes a mixed approach to explore the characteristics of research objects at different scales. This mixed approach includes methods to characterize general distribution patterns and methods to investigate the root causes of spatial patterns. ArcGIS is the most common used software to characterize the overall distribution pattern. It provides powerful spatial analysis that enables users to analyze and identify relationships between data on maps. For example, it can identify areas with high or low concentrations of certain phenomena within a specified area, or analyze the impact of environmental factors on features at a given distance (Liu and Doronzo, 2020; Zhang et al., 2022). GeoDetector Analysis is another method used in our study that combines statistics and geographic information to determine the relative importance of the various factors that affect a given phenomenon, thereby providing an explanation for driving factors in phenomena and other spatial patterns (Nie et al., 2022).
The kernel density analysis is based on different spatial distance concepts (Zhang et al., 2022). It can be used to calculate the density of CAHSs and find the area where the cluster system is located. The formula is as follows:
Where n presents the amount of CAHS, is the kernel density equation, h > 0 presents the search radius, and illustrates the distance between two samples.
To reveal the radiation level of resource elements in geographic space (Liu and Doronzo, 2020), the linear buffer analysis in ArcGIS 10.6 is used to establish buffer zones of 20 km, 40 km, 80 km, and 120 km around rivers. The formula is as follows:
Where is the major river (e.g., Yellow River, Yangtze River, Pearl River, and their first-class tributaries). is the buffer zone, is the coordinate point of CAHS in the adjacent range, the distance between and the rivers is , and is the radius.
The spatial differentiation and detect spatial variation are analyzed by GeoDetector. A factor’s ability to explain a variation in the result variable is measured, thereby identifying its source (Nie et al., 2022). This method is used to identify the governing strength of a responding variable under the assumption that the variate A is associated with the variate B if their spatial pattern is consistent, which is defined as the q-statistic. In the case of q∈[0,1], a higher value of q indicates a stronger explanation of the dependent variable B (Huang et al., 2021). The formula is as follows:
Where and are the quantity of CAHSs and the variance, respectively, L is the variable stratification, namely classification; Each unit in layer h and the whole area are represented by Nh and N. With the q value range of [0, 1], the higher value of q indicates the higher explanatory power of the variable.
The paper takes 532 agricultural heritages as research objects and discusses the spatial distribution characteristics and influencing factors of CAHSs. First, it obtains the geographic coordinates (longitude and latitude) of all CAHSs through Baidu coordinate picker to create a geographic information database. The obtained potential influencing factors, such as climatic, geographic, and human, are gridded through ESRI ArcGIS 10.6. Second, it employs spatial analysis methods (i.e., linear buffer analysis, kernel density estimation) to judge the overall and various geographical distribution characteristics of CAHSs, and superimpose the grid map of each potential influencing factor with the geographical distribution of CAHSs. And lastly, it employs GeoDetector to evaluate the explanatory power of potential influencing factors and the interaction on the distribution of CAHSs. And at last, it employs GeoDetector to evaluate the explanatory power of potential influencing factors and the interaction on the distribution of CAHSs (Figure 1).
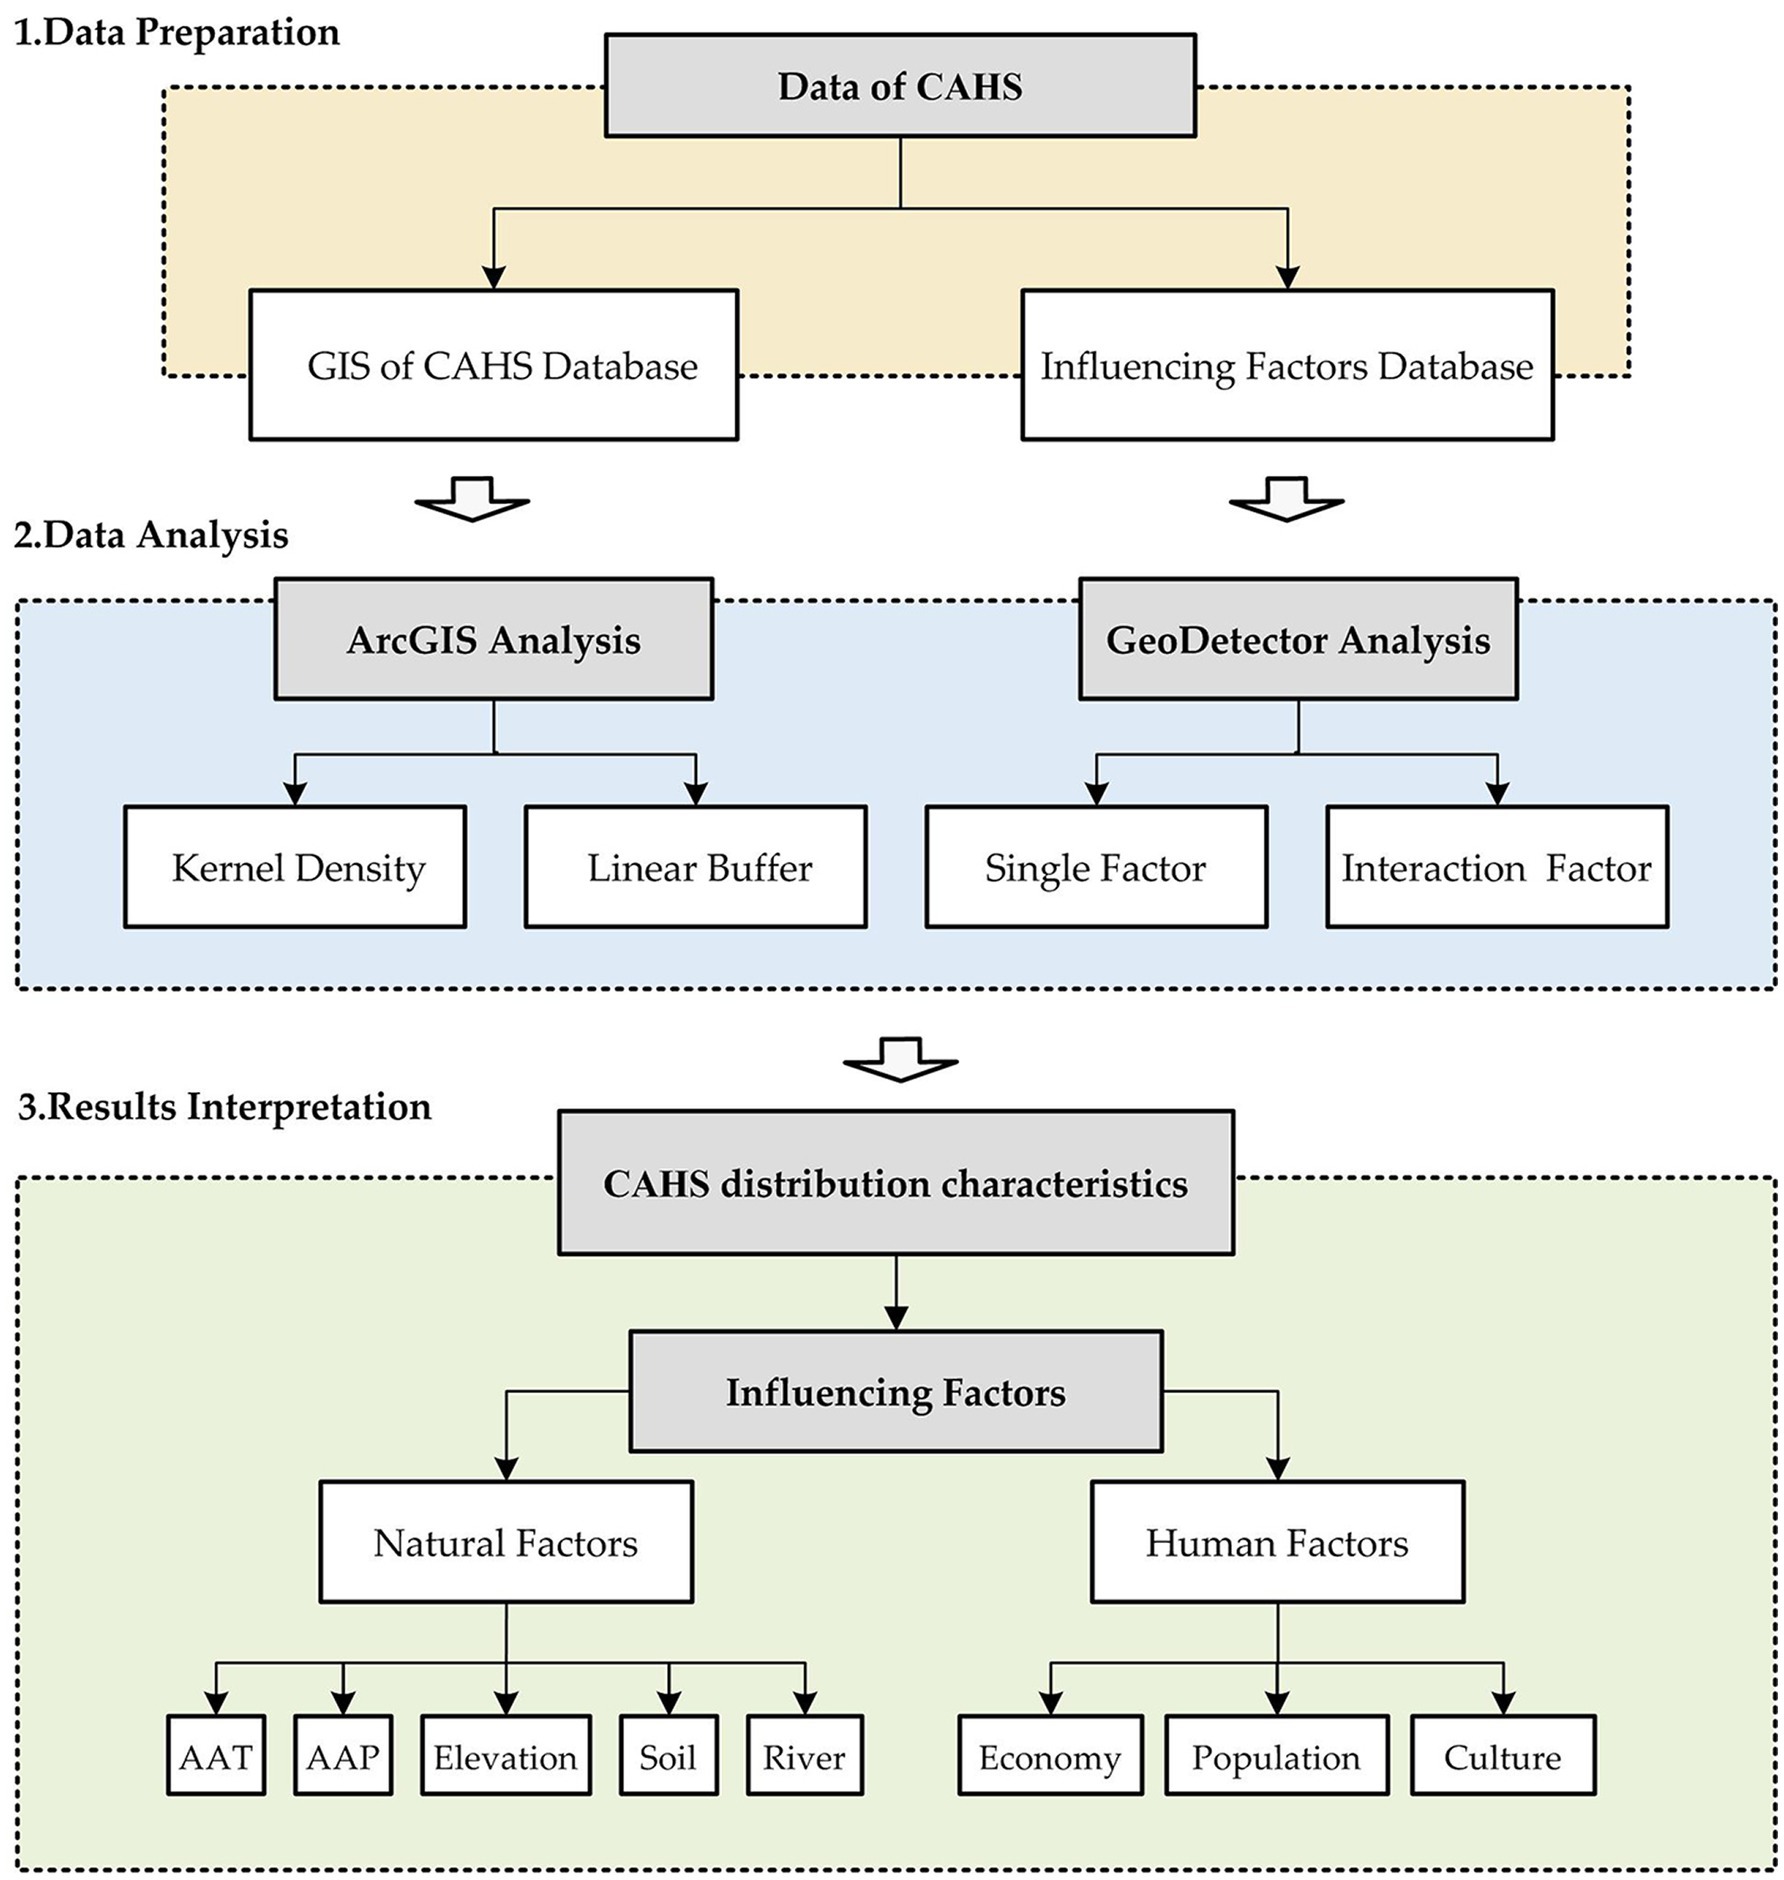
Figure 1. The study framework diagram. (AAT, annual average temperature; AAP, annual average precipitation).
In order to analyze the distribution pattern of CAHS, we apply the Kernel Density Analysis and Linear Buffer Analysis from the ArcGIS software. GeoDetector Analysis is also used to investigate the driving factors for CAHS distributional differences.
CAHS is generally characterized by its “dense in the east and sparse in the west” spatial distribution. Statistics show that 532 CAHSs (19 GIAHSs, 114 AHSs, and 399 PAHSs) are distributed in the eastern part of the “Hu Line” (Figure 2). The “Hu Line,” proposed by population geographer Hu Huanyong, divides China’s territory into two parts, east and west, with significant differences in population, meteorology, landforms, and culture (Hu, 1935). To understand the spatial distribution characteristics of CAHSs intuitively, we use ArcGIS to calculate their kernel density and divide the results into five levels according to the natural discontinuous point classification method. As shown in Figure 2, CAHSs are unevenly distributed in space, with considerable regional differences, mainly including two core density areas, two high-density areas, five sub-high density areas, and several medium density areas. 33.36% of the land area is distributed with 82.14% CAHSs. The sites allocated in the double-center core density area from Beijing to Shandong and the single-center core density area in Zhejiang, and their extension groups, account for 44.17% of the total number, and comprise the most densely distributed belt cluster of CAHSs. Besides, two high-density areas and their extension groups are concentrated in western Yunnan and central Sichuan, distributing 6.39 and 12.22% CAHSs, respectively. Another point of concern is that although the extensive scope of sub-high-density areas is limited, they are generally distributed in the border areas across provinces, such as the border areas of Shanxi, Henan, Guizhou, Guangxi, and Hunan, as well as the border area of Inner Mongolia and Shanxi.
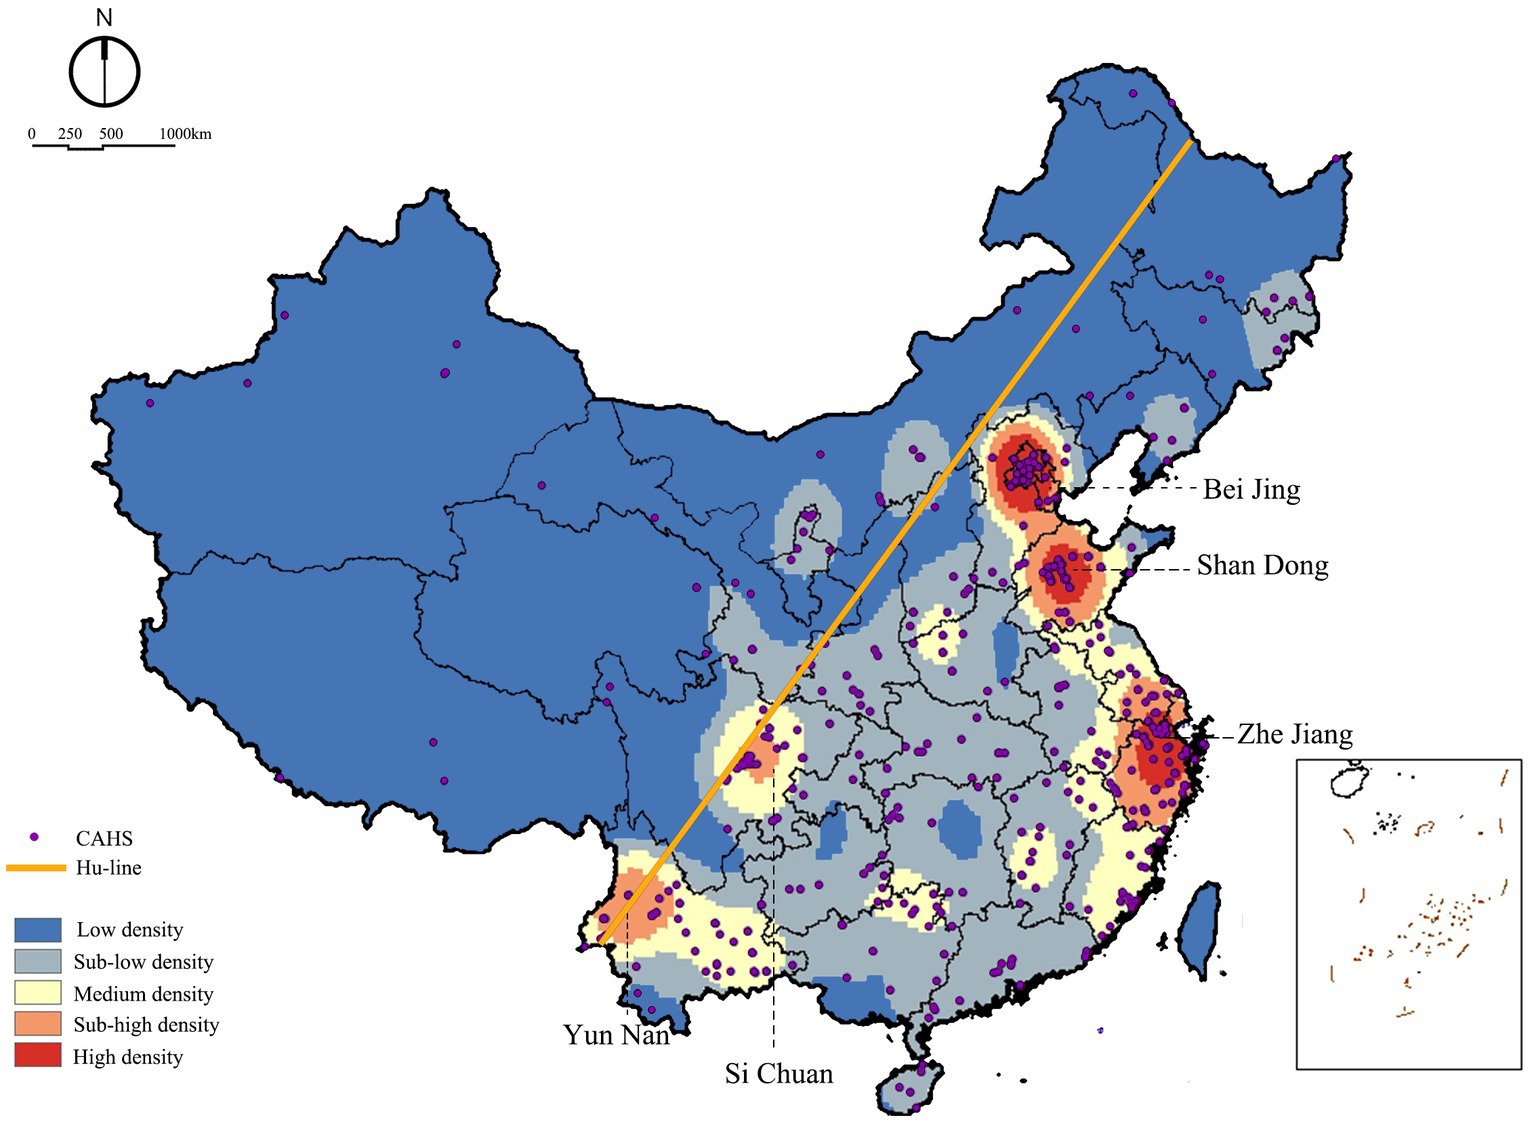
Figure 2. The kernel density map of CAHSs.
Previous studies point out that GIAHSs can be classified into 10 types (Koohafkan and Altieri, 2011), and 7 types are included in CAHSs, namely 19 aquaculture systems, 72 farming systems, 43 forestry systems, 294 horticulture systems, 9 irrigation and water management systems, 65 pastoral systems and 30 mixed systems. Overall, the horticulture system accounted for the most significant proportion (55.26%), followed by the farming system (13.53%) and pastoral system (12.22%), while irrigation and water management systems are the most minuscule (1.69%). In the spatial distribution of types, Yunnan, a province in southwest China, has the wealthiest CAHS types, in which farming systems comprise 18.00%, irrigation and water management systems comprise 44.44%, pastoral systems comprise 21.54%, and mixed systems comprise 16.60%. At the same time, 36.84% of aquaculture systems are distributed in Zhejiang in east China, 20.90% of forestry systems are distributed in Shandong in east China, and 13.60% of horticulture systems are distributed in Beijing in north China, these are the most prominent distribution areas of the indicated types (Figure 3).
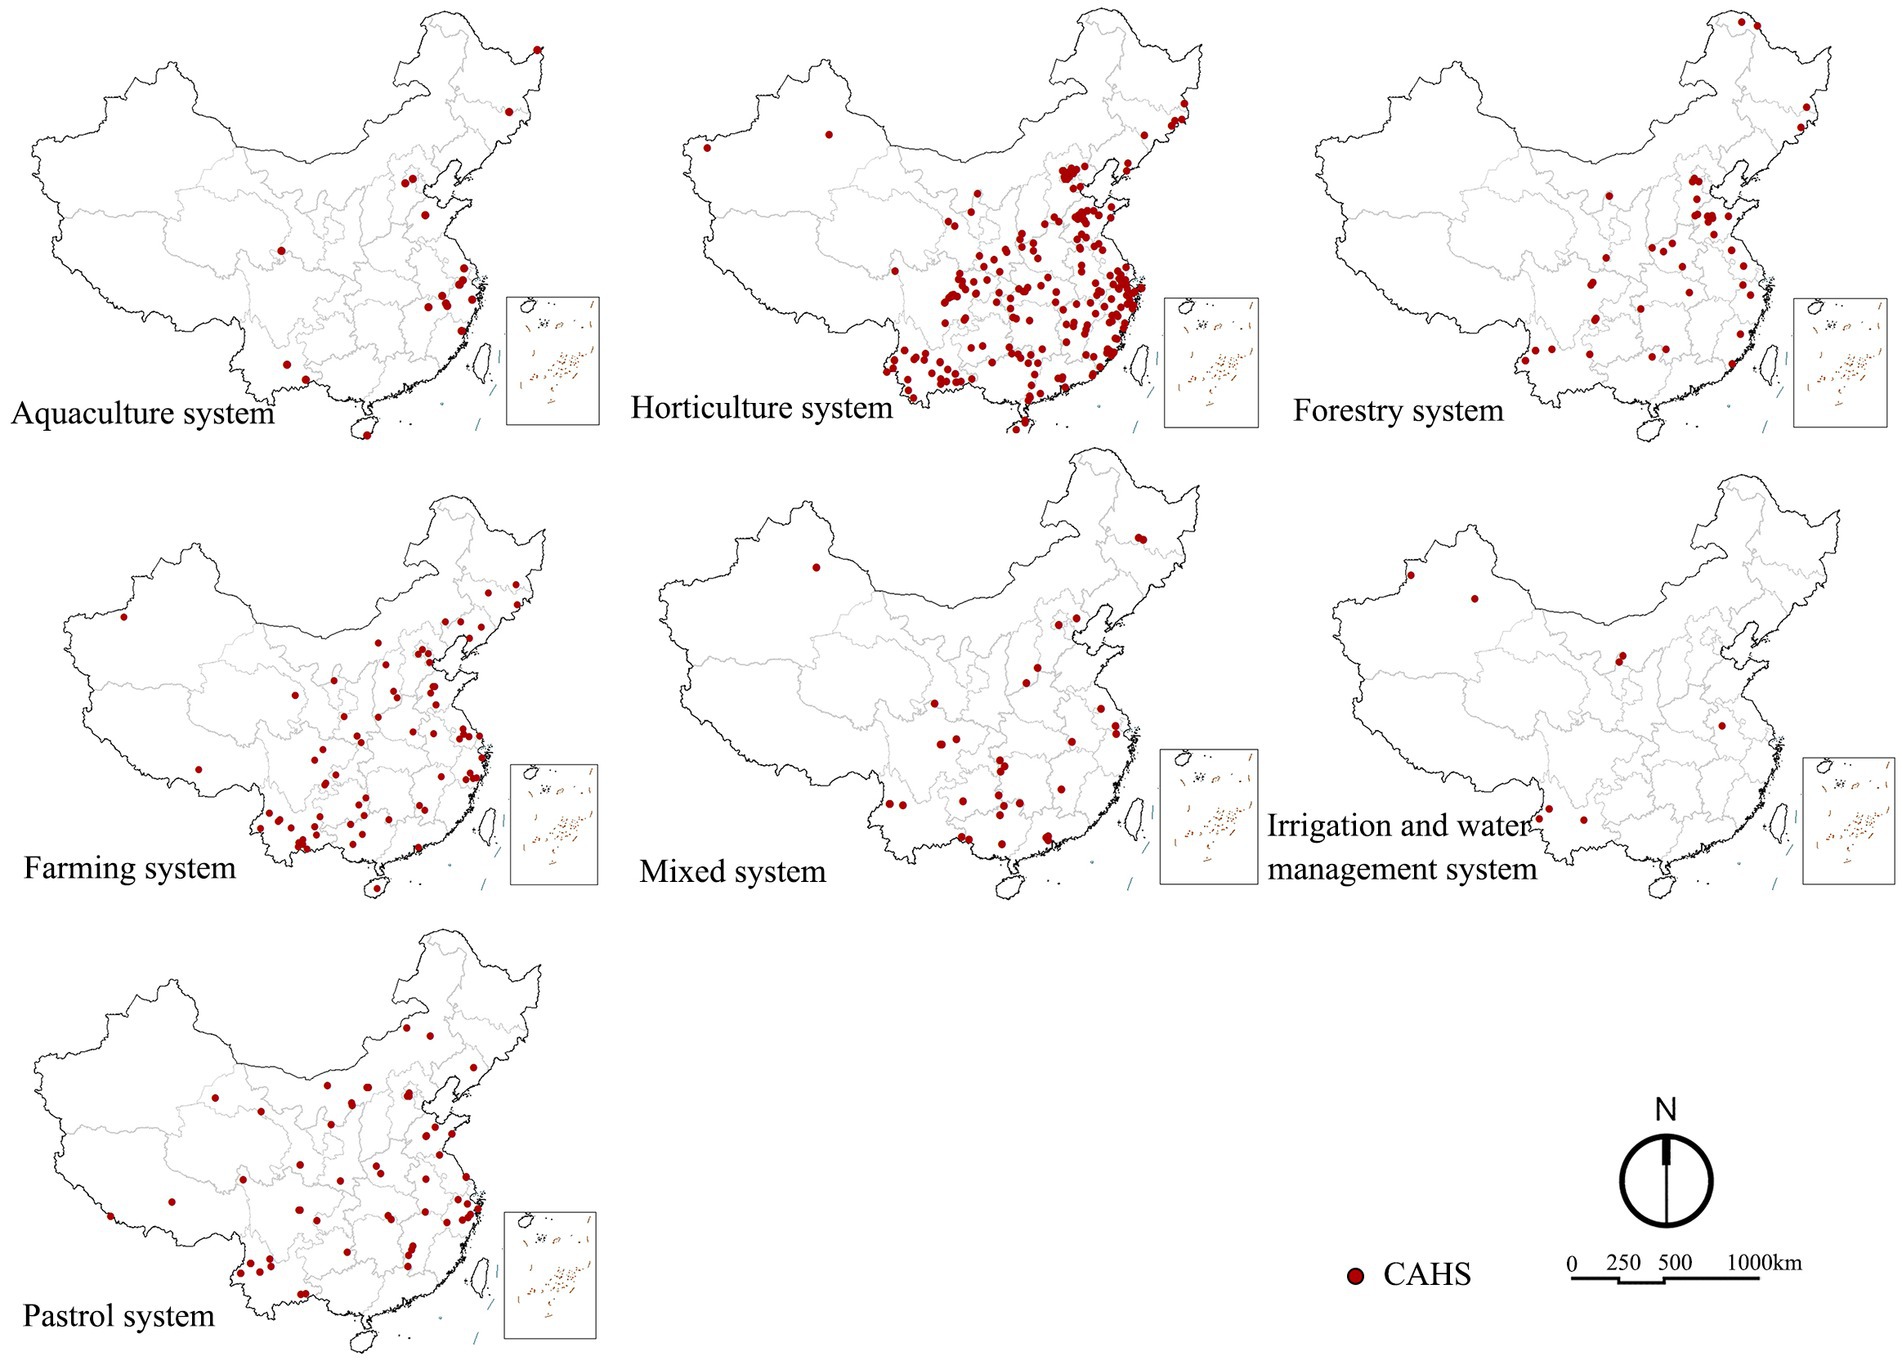
Figure 3. The spatial distribution of 7 CAHS types.
The two Geodetecor sub-modules used in this study are the factor detector and the interaction detector. The results of calculating the q-statistic value of p for each influencing factor on the distributions of CAHSs by Geodetector are shown in Table 1. Q-statistic represents the explanatory power between the factors while value of p indicates the significance of the correlation between them. In this test, all factors have passed the significance test at the 0.01 level. From high to low, the order of natural explanatory power for the different spatial distributions of CAHSs is soil > elevation > annual average temperature > river > annual average precipitation. The order of human explanatory power from high to low is as follows: culture > population > economy (Table 1).
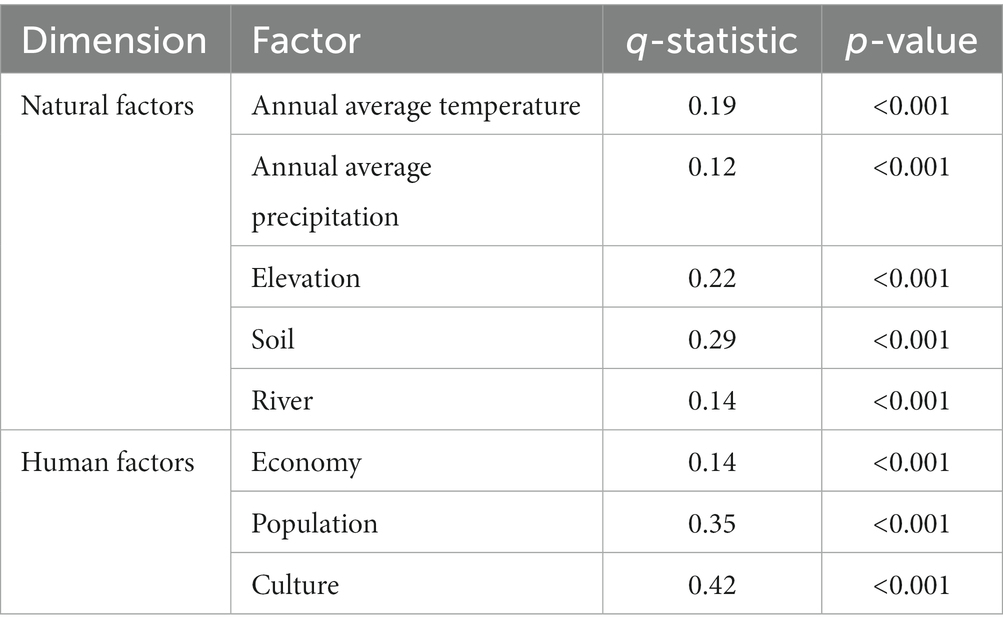
Table 1. The results of single factor analysis for CAHSs distribution.
The results of the interaction between factors show that the impact of natural factors and human factors on the distribution of CAHSs is not independent, but the enhancement of the two factors. The types of interaction are dominated by nonlinear enhancement, supplemented by two-factor enhancement. Interaction factors with high explanatory power (>0.7) are closely related to population and cultural factors, namely, elevation and population, soil and population, river and population, annual average temperature and culture, elevation and culture, soil and culture, river and culture (Table 2).
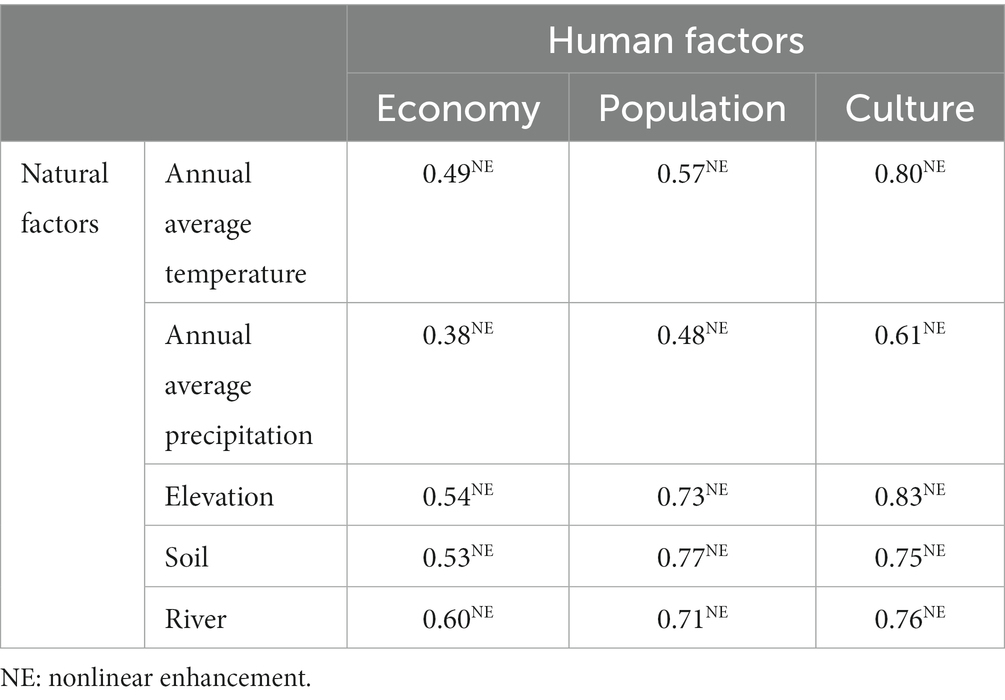
Table 2. The results of interaction between natural and human factors for CAHSs distribution.
Climate plays a decisive impact on human agricultural production, and it is one of the most important natural factors which affects the CAHSs distribution. The explanatory power of annual average temperature and annual average precision on the CAHSs distribution is 0.19 and 0.12, respectively, (Table 1). To rule out the inaccuracy of a particular year, we extract the data from China’s climate datasets and calculate the mean values of the two climate factors (from 2001 to 2021). Successively, we superimpose the climate data with the geographical points of CAHS and form the climate distribution map of CAHSs. Statistics show that 76.10 and 92.75% of the CAHSs are distributed in warmer areas (11–20°C/year) and abundant rainfall areas (501–2000 mm/year). Among these, the ranges of 16–20°C, and 501–1,000 mm are the peaks of CAHSs distribution, and they account for 48.50 and 44.09% of CAHSs, respectively (Figure 4).
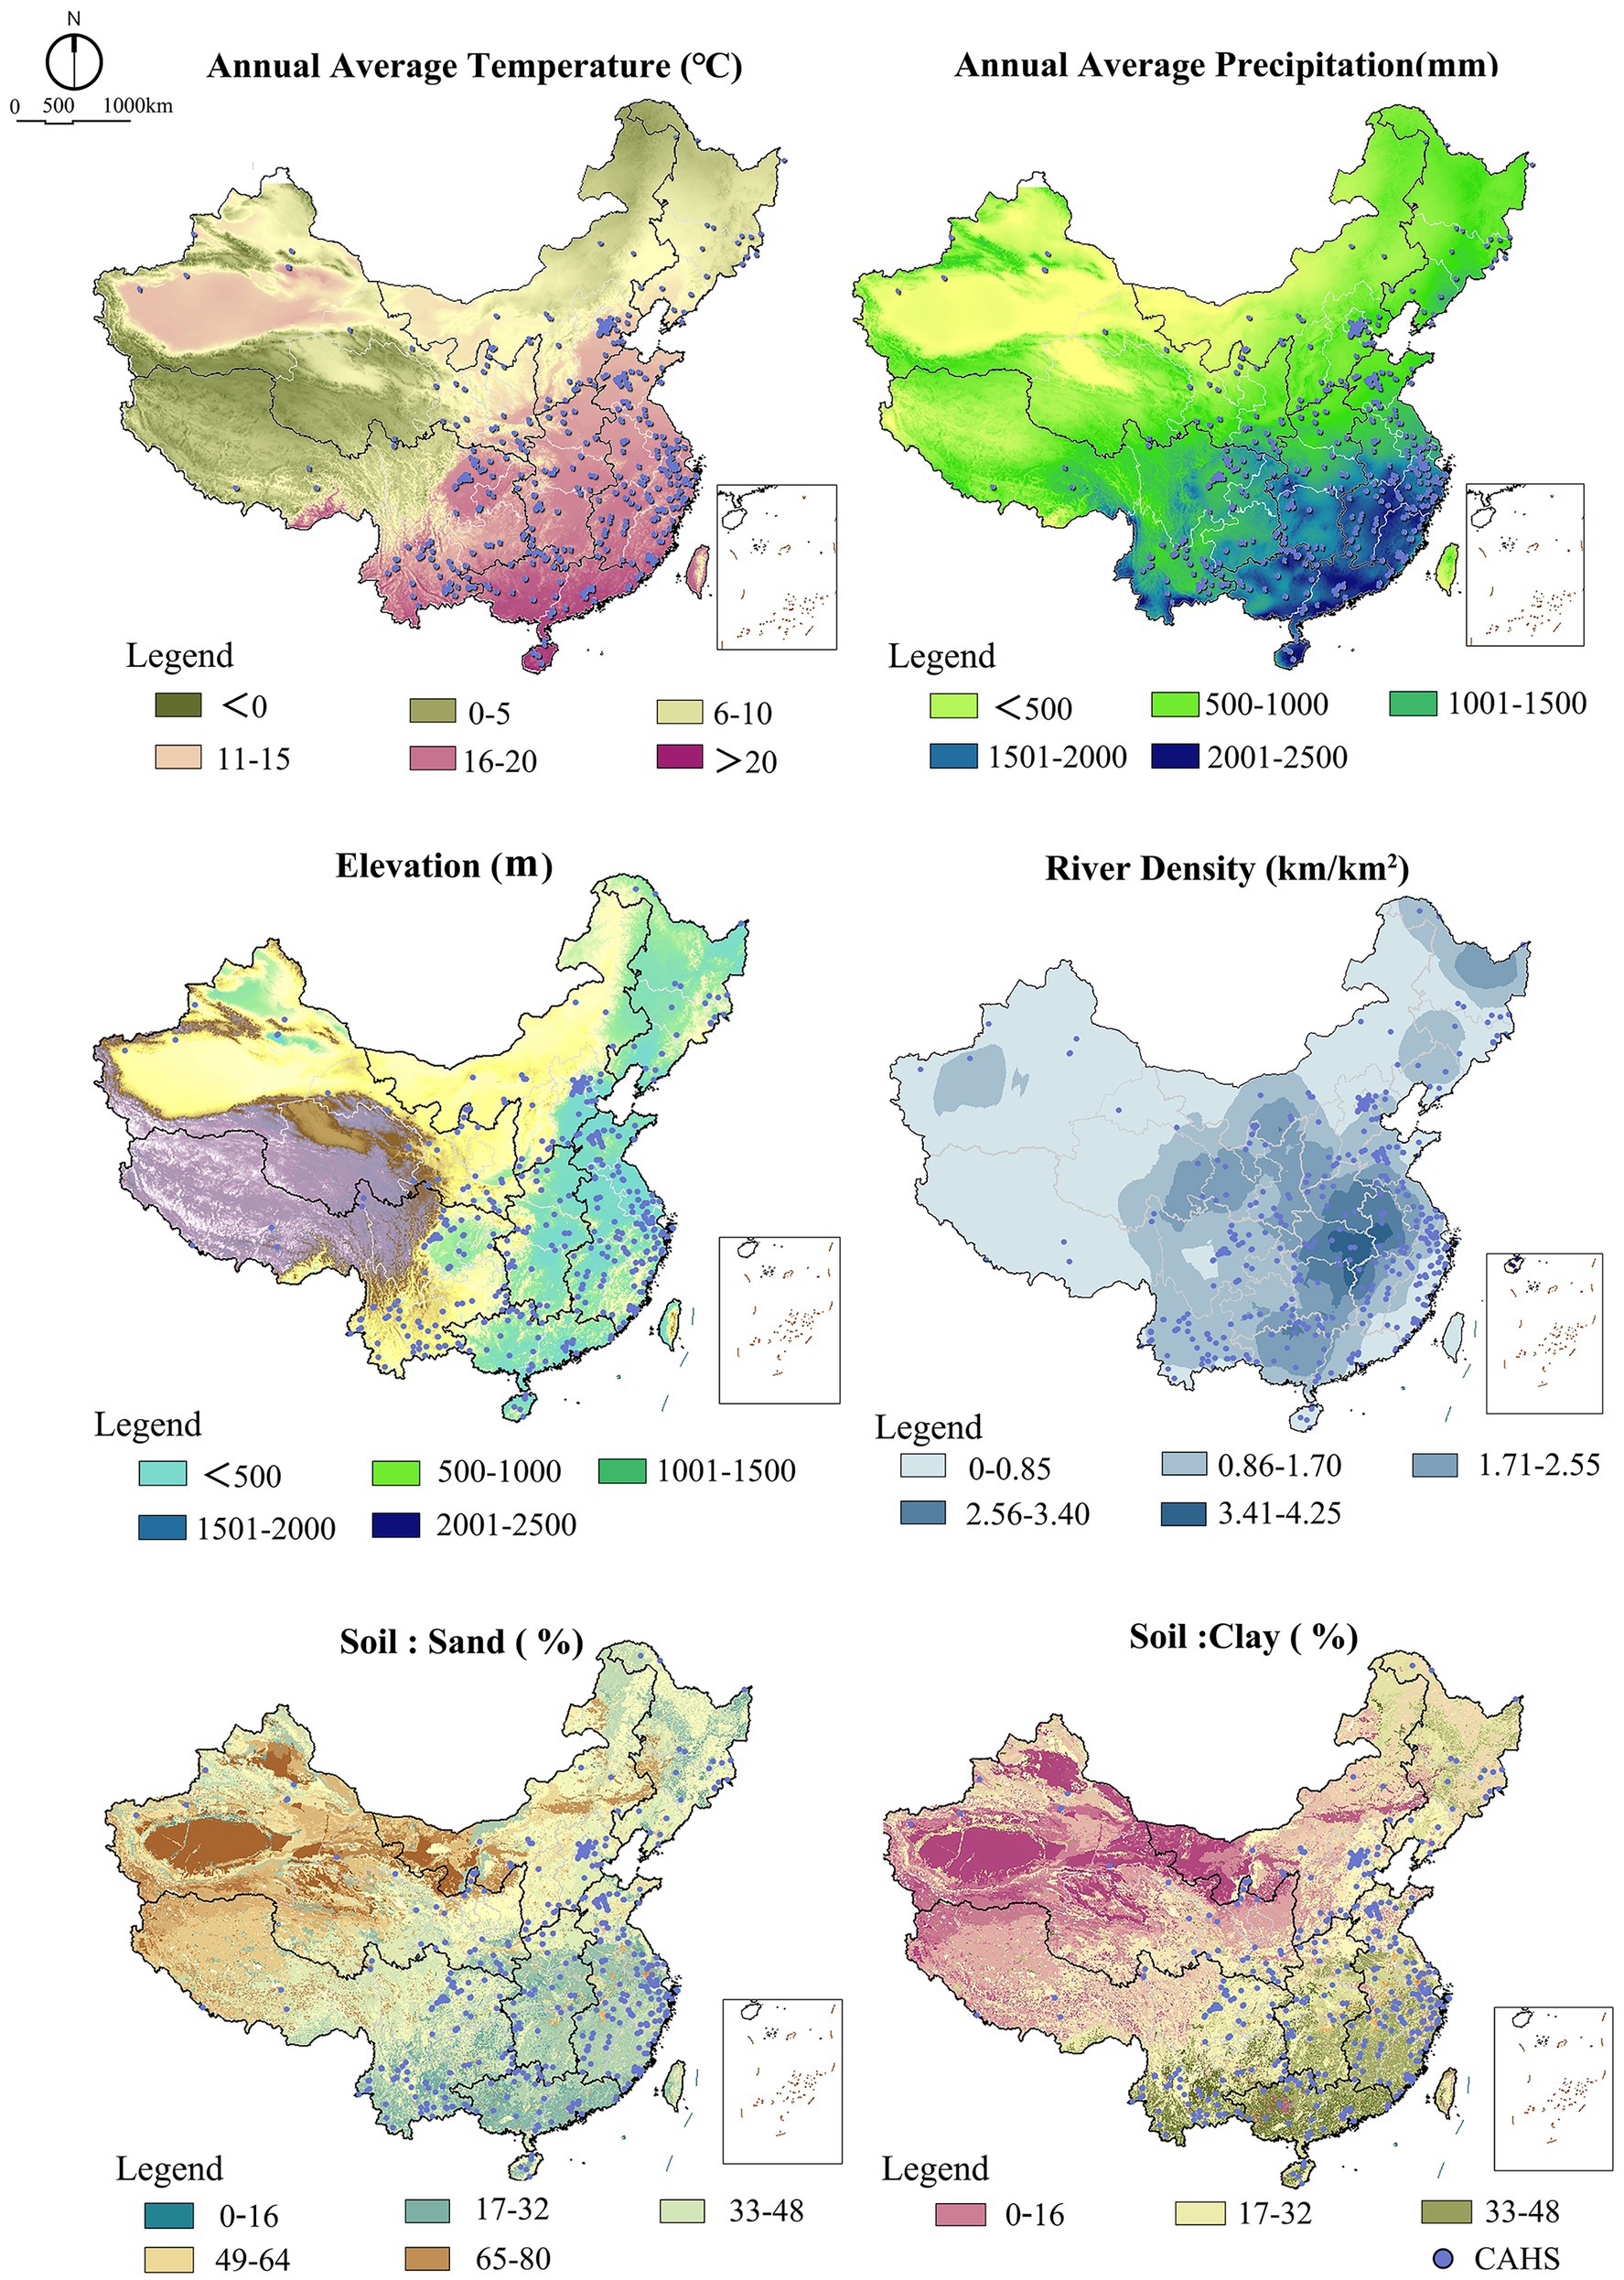
Figure 4. The relationships between CAHSs and natural factors.
According to these statistics, the CAHSs are all located in areas below the elevation of 4,000 m, of which, 97.74% are below 2,500 m and 2.26% are above 2,500 m. To visually illuminate the impact of elevation on CAHSs distribution, we draw a histogram of CAHSs located in areas below the elevation of 2,500 m. As shown in Figure 4, 76.30% of the CAHSs are distributed in low-elevationareas (0–500 m), and only 1.32% in areas with an elevation of more than 2,500 m. However, there is no obvious regularity in the distribution of CAHSs in the 501–2000 m elevation area (Figure 4).
The explanatory power of soil ranks first among natural factors on the CAHSs distribution (explanatory power q = 0.29). To understand the impact of soil attributes on the CAHSs distribution visually, we select the components of clay and sand (Kaden and Krolla-Sidenstein, 2015), and draw a histogram of CAHSs. Statistics show that 87.22 and 92.67% of CAHSs are distributed in areas with 16–48% clay and 16–64% sand, respectively. Among these, the areas with 16–32% clay and 32–48% sand are the peaks of the distribution, and they account for 69.74 and 50.00% of CAHSs (Figure 4).
The river system is another important influencing factor of CAHSs. Statistical results show that 8.83, 68.69, 17.67, 3.20, and 1.32% of CAHSs are distributed in the areas with river density of 0–0.85 km/km2, 0.85–1.70 km/km2, 1.70–2.55 km/km2, 2.55–3.40 km/km2, and 3.40–4.25 km/km2 respectively, and most of them (n = 367) are distributed in the areas with river density of 0.85–1.70 km/km2 (Figure 4). Apart from this, the results reveal that CAHSs are distributed along the main rivers in China. The analysis of CAHSs in the 23 main river buffer zones shows that the number of CAHS in the 20 km, 40 km, 80 km, and 120 km river buffer zones account for 27.63, 44.36, 65.41, 76.13%, respectively. Many CAHS types distributed within the 40 km buffer zone have quantitative advantages (>50.00%), such as farming systems (55.56%), forest systems (73.53%), irrigation and water management systems (55.56%), and mixed systems (56.67%). In contrast, many other CAHS types are distributed in the 80 km buffer zone, which is farther away from the main rivers, namely, pastoral systems (63.07%), and irrigation and water management systems (52.63%) (Table 3).
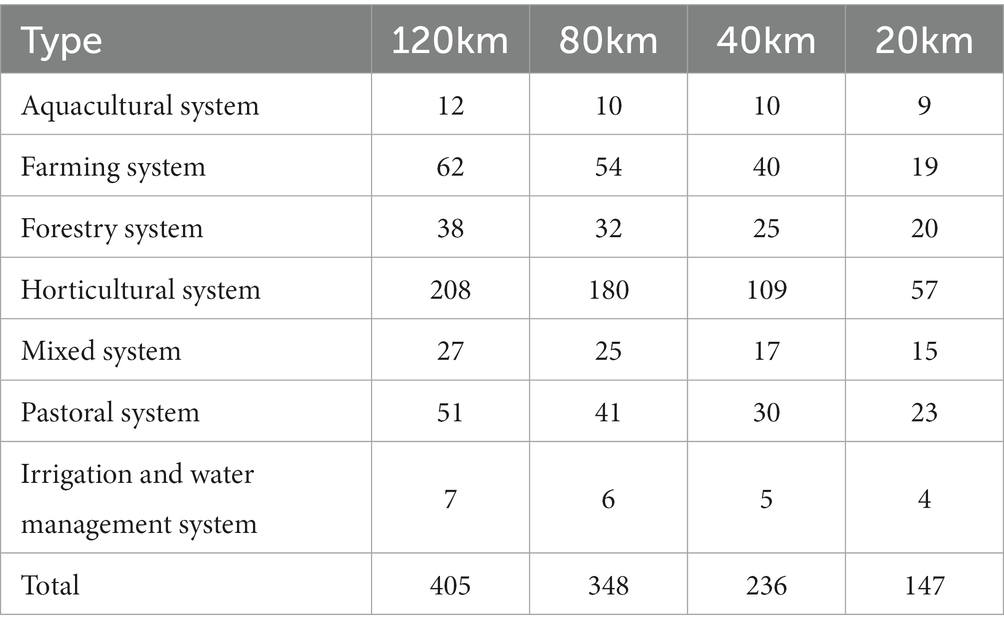
Table 3. The distribution of CAHSs in main river buffer zones.
The statistical results show that 91.73% of CAHSs are distributed in areas with population density lower than 2000 people/km2, and the high peaks are within the range of 0–500 people/km2. And with the increase in population density, the number of CAHSs rises accordingly. On the contrary, the number decreases exponentially. That is, CAHSs are mainly concentrated in remote areas with low population density, rather than in areas with high population density (Figure 5).
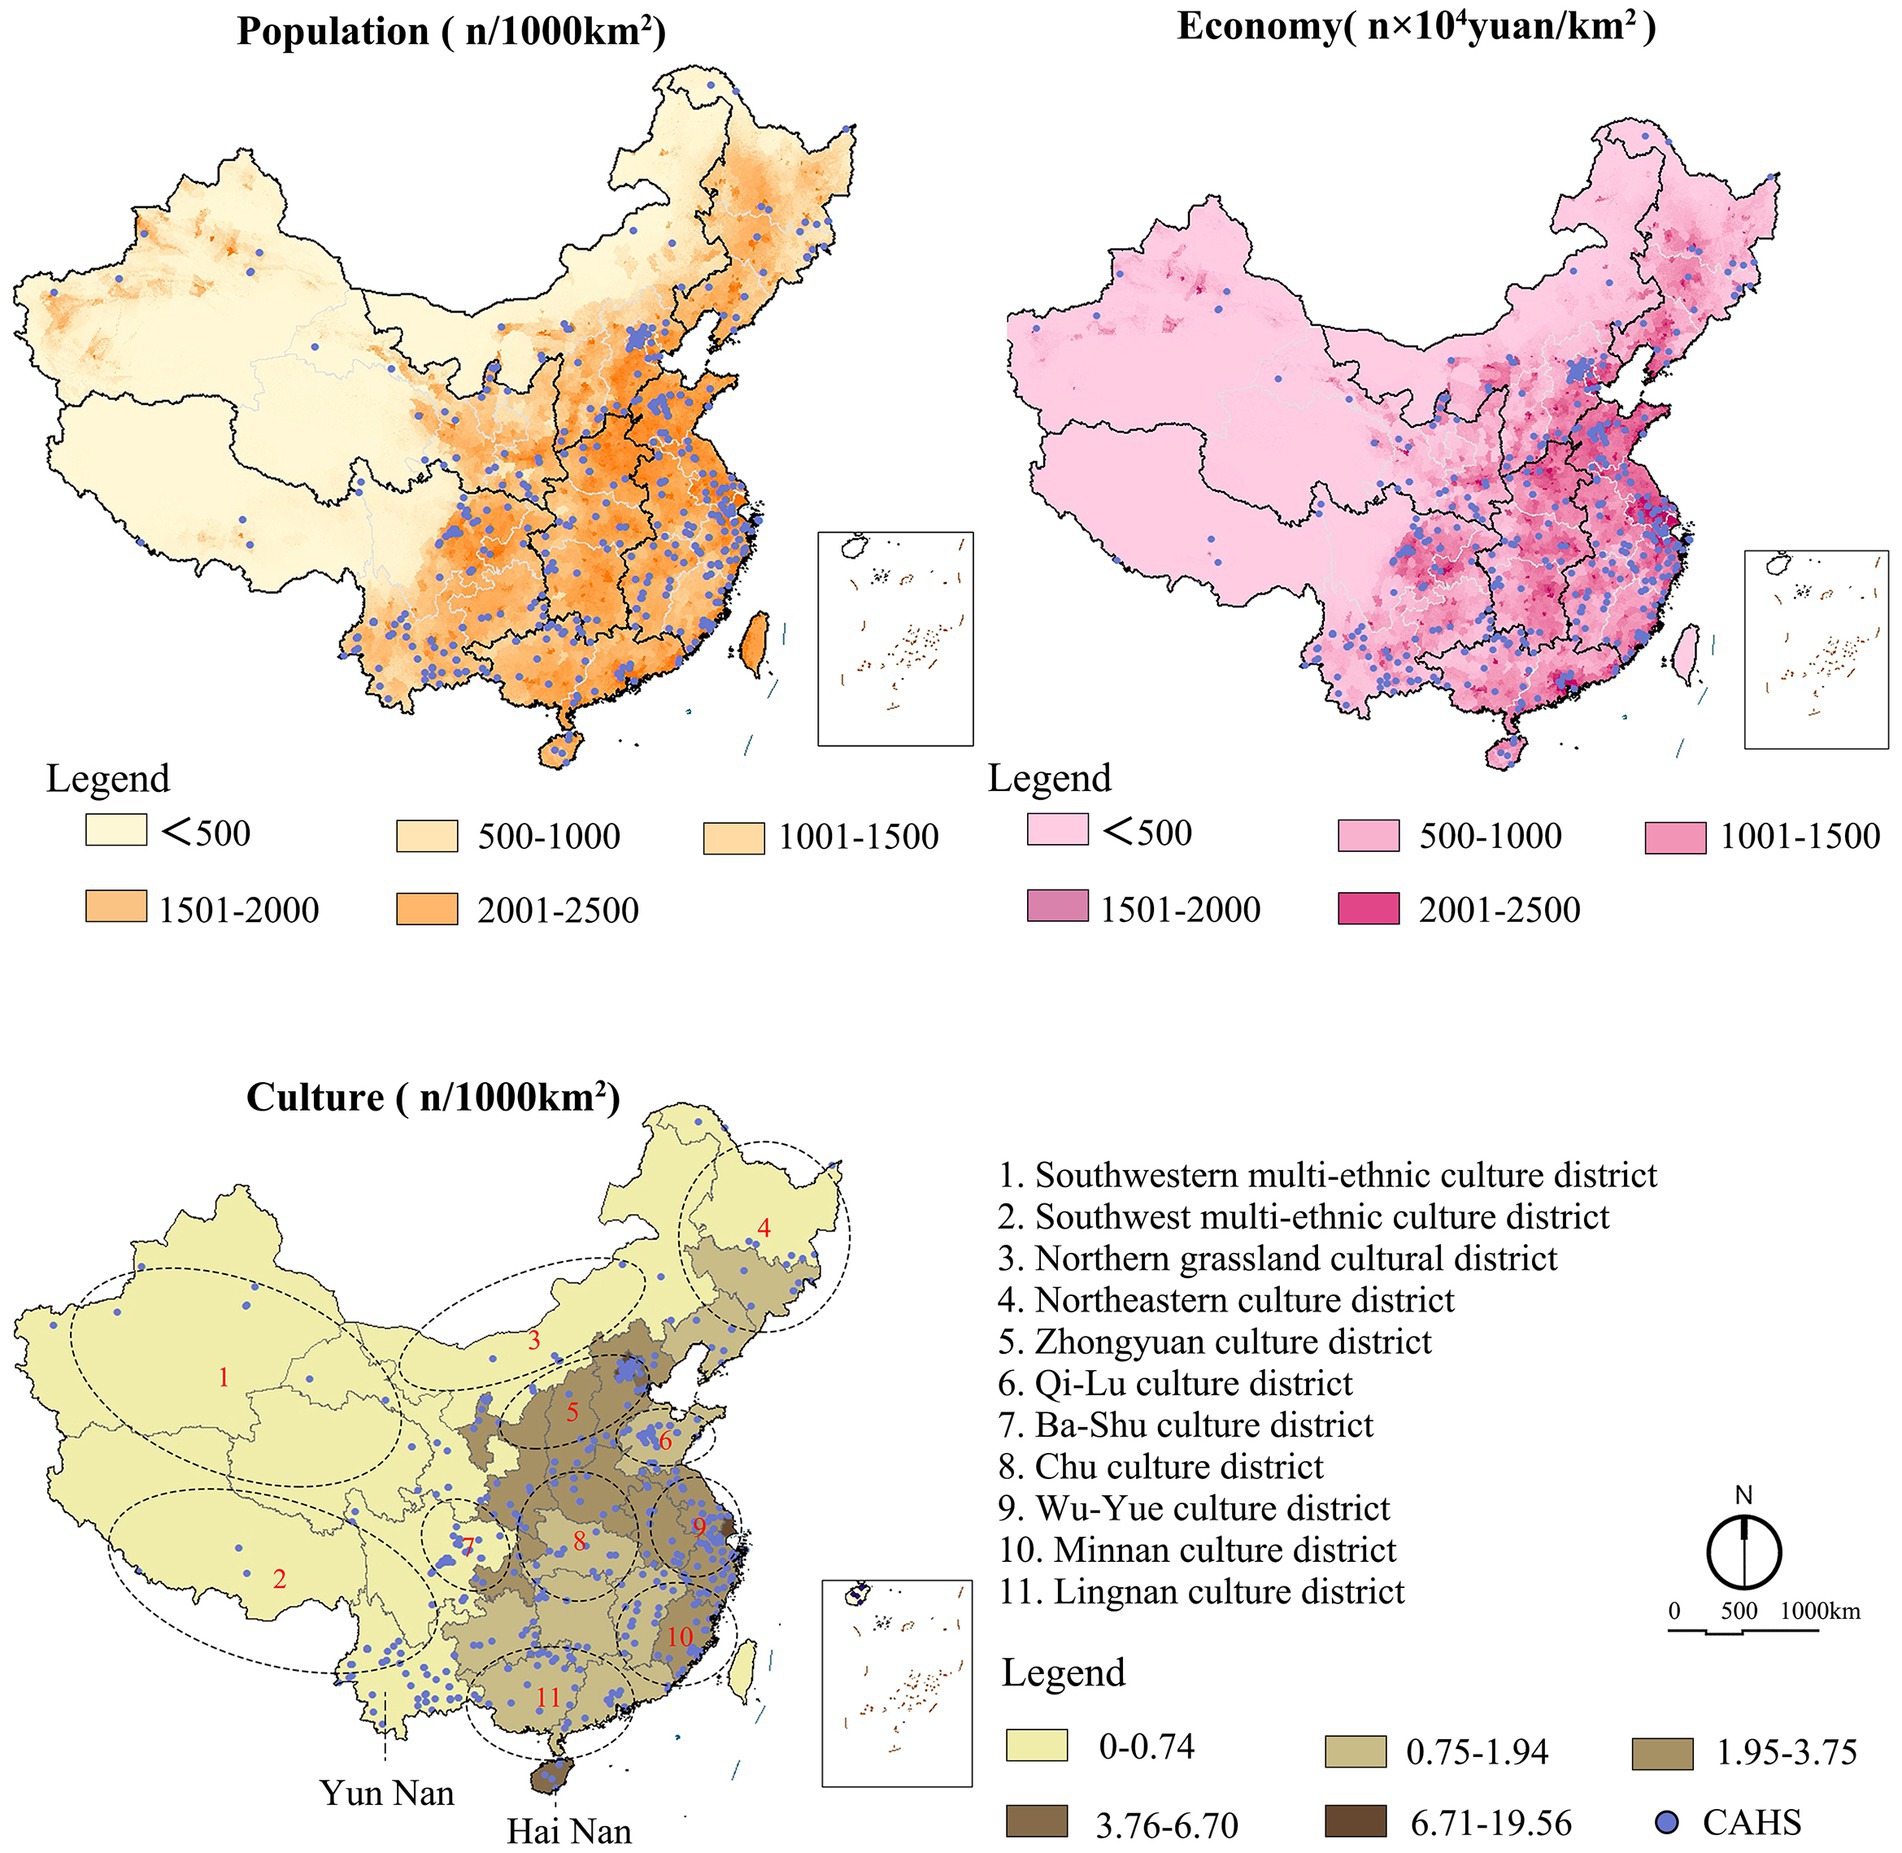
Figure 5. The relationships between CAHSs and human factors.
The economy has the weakest explanatory power on the distribution of CAHSs. Statistics show that 88.72% of the CAHSs are distributed in areas with GDP less than 2,500 × 104 yuan/km2, and the number reaches the peak in the range of 0 to 500 × 104 yuan/km2. Figure 5 shows that the number of CAHSs decreases gradually with the regional GDP increase.
The explanatory power of culture ranks first among human factors (explanatory power q = 0.42). In this study, a spatial distribution was made based on the location of Chinese Cultural Relics Protection Unit and Intangible Cultural Heritages in order to illustrate the degree of cultural retention. To illuminate the characteristics of the CAHSs distribution in different culture factors visually, we divide each culture factor into five levels according to the natural break method (Figure 5). Statistics show that 84.21% of the CAHSs are distributed in areas with a cultural resource density of 0.74–3.75/1000 km2. The CAHSs are mainly aggregated in areas with high cultural resources, such as Zhongyuan culture district, Qi-Lu culture district, Wu-Yue culture district, Minnan culture district, and Lingnan culture district. While those with low cultural resource density, such as southwestern and southwest multi-ethnic culture district, has less CAHSs distribution. However, exceptions also exist. For example, 13.35% of the CAHSs are distributed in Yunnan province with a low cultural resource density (0.51/1,000 km2), while only 0.94% of the CAHSs are distributed in Hainan province with a high cultural resource density (5.56/1,000 km2).
The present study proposes some quantitative models and methods to illustrate the spatial distribution characteristics of CAHSs and the relationships between main influencing factors. Compared to previous studies (Xie et al., 2011; Hashimoto et al., 2015; Jiao et al., 2019), our research objects are not limited to some specific types of agricultural heritage, and we use a robust and general model to reveal the characteristics and relationships. One of the achievements lies in the spatial geographic analysis methods of kernel density analysis, linear buffer analysis, and GeoDetector, which provide visual expression and scientific evidence of geographic feature information for agricultural heritage. This is the original contribution of this study which can be applied to other fields.
Another contribution of this study is breaking the limitations of past studies on GIAHS and AHS. It includes the newly added GIAHS and AHS in China, as well as 399 PAHSs, and quantitatively reveals the extensive and unique distribution characteristics of CAHSs. The analysis result shows the spatial rule of CAHSs is “dense in the east and sparse in the west,” which is consistent with the previous investigation (Liu and Doronzo, 2020). However, the CAHSs distribution in specific regions does not follow this rule. For example, although Anhui province is located in East China, the number of officially recognized agricultural cultural heritage is small, so its potential has not been fully exploited. In addition, this study quantitatively analyzes the distribution characteristics of seven CAHS types, sorts out the dominant and disadvantaged CAHS types in quantity, and illustrates the distribution situation of CAHSs in different regions. The results also reveal some unclear distribution problems of CAHSs, the resolutions of which could provide scientific references for local government and management departments in CAHSs discovery, evaluation, and protection. That is, to emphasize the balanced development of cross-regional, cross-sectoral coordination and differential management of CAHSs according to the distribution rule of aggregation and dispersion of different types in different regions.
Much of the literature on CAHS has emphasized the importance of natural factors and human factors, so we reveal the impact of these two critical factors on the CAHS distribution through single factor analysis and double factors interaction effect analysis. Regarding the impact of natural factors, the study summarizes the geographical distribution characteristics of the CAHSs located in low-altitude areas. The CAHSs are mainly distributed in East and North China, with relatively warm temperatures, abundant precipitation, and fertile soil. The sunshine in low-altitude areas is long, and the moist airflow from the eastern ocean can directly enter the inland and brings rich precipitation. These are conducive to agricultural development, while the conditions in high-altitude areas are the opposite. The results confirm the previous survey of CAHSs and are consistent with the distribution of agricultural villages and geographical indications for agricultural products in China (Liu et al., 2016; Bian et al., 2022). Besides, we find the corresponding relationship between the CAHSs distribution and the distance of the river buffer zone. For example, 65.41% of the CAHSs are distributed within an 80 km buffer zone of the main river. In the context of global ecological deterioration, local governments and management institutions must closely monitor the microclimate, microtopography, and watershed hydrological changes around the CAHSs and protect the natural environment and ecological background on which it depends.
Regarding human factors, previous studies have confirmed the negative relationship between economic level, population density, and CAHSs density (Fuller et al., 2015; Liu and Doronzo, 2020). And we find that the low population density and economically underdeveloped regions are more likely to maintain the traditional ways of life and production, and the regional agricultural landscape is more likely to be preserved and selected as the official agricultural heritage. However, the CAHSs in these regions face the risk of recession under the dual threat of population loss and poverty (Koohafkan, 2012; Zhang and Liu, 2014; Fuller et al., 2015). Thus, maintaining the population size and the livelihood of farmers would be an essential direction to promote the sustainable development of CAHSs.
We find that the interaction between natural factors and human factors has a higher explanatory power on the CAHSs distribution. The dominant non-linear enhancement and the second two-factor enhancement indicate that the influencing factors of the CAHS distribution are not independent; they have interacted. This finding achieves from the macro level of land and resources distribution, confirms the previous micro environmental research which focuses on agricultural heritage cases, such as Hani Rice Terraces, Subak Irrigation Schemes, agriculture system in Chiloé Island (Barrena et al., 2014; Yekti et al., 2017).
Another unexpected finding lies in the extent to which cultural factors have the highest explanatory power for the CAHSs distribution (37.38%), whether it is single factor analysis or interaction with other natural factors (i.e., elevation, soil, and river). The study also finds that 84.21% of the CAHSs are distributed in the area with a cultural resource density of 0.74–3.75/1000 km2. The reason may be that the CAHSs and cultural heritage resources in these areas have similarities with the preserved natural and human environments. Given the agglomeration effect of the CAHSs and cultural heritage resources in spatial distribution, the local governments could overcome the barriers between departments, and achieve the cluster protection and inheritance of the coordinated development of CAHSs and cultural resources.
Although the analysis of spatial characteristics and influencing factors of agricultural heritage has contributed to the sustainable development of CAHSs, some limitations should be addressed in the future. First of all, the perspective of this study focuses on the spatial and lacks spatial pattern and agglomeration analysis of 532 CAHSs in the time series. The time factor should be considered for a more comprehensive understanding in future research. Secondly, this study focuses on the macro level of CAHSs distribution and impact factor analysis. Due to data limitations, we do not analyze the detailed information of 532 CAHSs, such as the heritage scale, production mode, employed population, economic benefits, ecological resources, and other micro factors, which are worthy of further exploration. In future research, along with the above, the sections dealing primarily with heritage protection and sustainable development disciplines require further development.
Through a series of spatial analysis methods, mathematical statistics, and Geodetector, this study quantitatively and qualitatively analyzes the characteristics of CAHSs distribution and their relationship with influencing factors. The main conclusions are as follows:
The 532 CAHSs cover most types of agricultural heritage worldwide, and the number of different CAHS types are diverse. Among them, horticulture systems (n = 294, 55.26%) and irrigation and water management systems (n = 9, 1.69%) respectively occupy the advantageous and disadvantageous places in terms of quantity. In terms of spatial distribution, Yunnan has the most prosperous CAHS types; farming systems comprise 18.00%, irrigation and water management systems comprise 44.44%, pastoral systems comprise 21.54%, and mixed systems comprise 16.60%.
CAHS is characterized by the spatial distribution of “dense in the east and sparse in the west.” The double-center core density area is concentrated in Beijing to Shandong, and the single-center core density area is located in Zhejiang. The core areas and their extension clusters are distributed with 44.17% of CAHSs, which comprise the most densely distributed belt cluster of CAHSs.
The results also show that the interaction of natural factors and human factors has a more significant impact on CAHSs distribution than a single factor. In single factor analysis, the order of natural explanatory power for the different spatial distributions of CAHSs is: soil > elevation > annual average temperature > river > annual average precipitation (p < 0.001). In contrast, the order of human explanatory power is: culture > population > economy (p < 0.001). The results of the interaction between factors reveal that the influence of natural factors and human factors is not independent, but correlated with their enhancement, and the interaction factors with high explanatory power (q > 0.7) are closely related to population and culture.
The raw data supporting the conclusions of this article will be made available by the authors, without undue reservation.
CL: conceptualization, methodology, and writing. TT and XH: software and visualization. All authors contributed to the article and approved the submitted version.
This research was funded by the National Natural Science Foundation of China (grant number 51778388), Landscape Architecture as a Key Discipline of the “14th Five Year Plan” in Jiangsu, and the Qing Lan Project of Jiangsu.
The authors declare that the research was conducted in the absence of any commercial or financial relationships that could be construed as a potential conflict of interest.
All claims expressed in this article are solely those of the authors and do not necessarily represent those of their affiliated organizations, or those of the publisher, the editors and the reviewers. Any product that may be evaluated in this article, or claim that may be made by its manufacturer, is not guaranteed or endorsed by the publisher.
The Supplementary material for this article can be found online at: https://www.frontiersin.org/articles/10.3389/fsufs.2023.1141986/full#supplementary-material
Anderson, W. (2018). Linkages between tourism and agriculture for inclusive development in Tanzania. J. Hosp.Tour. Insights 1, 168–184. doi: 10.1108/JHTI-11-2017-0021
Bai, Y., Lun, F., Cao, Z., He, L., Liu, X., and Liu, M. (2012). Agricultural production in Hani Rice terraces system and related threats — a case study of Zuofu and Mitian villages in Honghe County, China. Chin. J. Eco-Agric. 20, 698–702. doi: 10.3724/SP.J.1011.2012.00698
Barrena, J., Nahuelhual, L., Báez, A., Schiappacasse, I., and Cerda, C. (2014). Valuing cultural ecosystem services: agricultural heritage in Chiloé island, southern Chile. Ecosyst. Serv. 7, 66–75. doi: 10.1016/j.ecoser.2013.12.005
Berweck, S., Koohafkan, P., Cruz, M. J. D., Qingwen, M., Wenjun, J., Yehong, S., et al. (2013). Conceptual framework for economic evaluation of globally important agricultural heritage systems (GIAHS): case of Rice-fish co-culture in China. J. Res. Ecol. 204, 553–563. doi: 10.1016/j.jclepro.2018.09.035
Bian, J., Chen, W., and Zeng, J. (2022). Spatial distribution characteristics and influencing factors of traditional villages in China. Int. J. Environ. Res. Public Health 19:4627. doi: 10.3390/ijerph192013170
Calvo-Iglesias, M. S., Crecente-Maseda, R., and Fra-Paleo, U. (2006). Exploring farmer's knowledge as a source of information on past and present cultural landscapes - A case study from NW Spain. Landsc. Urban Plan. 78, 334–343. doi: 10.1016/j.landurbplan.2005.11.003
Chen, B., Qiu, Z., Usio, N., and Nakamura, K. (2018). Tourism’s impacts on rural livelihood in the sustainability of an aging community in Japan. Sustainability 10:2896. doi: 10.3390/su10082896
Daugstad, K., Rønningen, K., and Skar, B. (2006). Agriculture as an upholder of cultural heritage? Conceptualizations and value judgements—a Norwegian perspective in international context. J. Rural. Stud. 22, 67–81. doi: 10.1016/j.jrurstud.2005.06.002
Dela-Cruz, M. J., and Koohafkan, P. (2009). Globally important agricultural heritage systems: a shared vision of agricultural, ecological and traditional societal sustainability. Resour. Sci. 31, 905–913.
Ding, Y., Liu, Z., Jiao, Y., Xu, Q., Zhang, K., Liu, C., et al. (2022). A bi-scale assessing framework for aesthetic ecosystem services of villages in a world heritage site. J. Mt. Sci. 19, 874–891. doi: 10.1007/s11629-021-6996-8
Ferreira, D. I. R., and Sánchez-Martín, J.-M. (2022). Agricultural landscapes as a basis for promoting Agritourism in cross-border Iberian regions. Agriculture 12:716. doi: 10.3390/agriculture12050716
Ferro-Vázquez, C., Lang, C., Kaal, J., and Stump, D. (2017). When is a terrace not a terrace? The importance of understanding landscape evolution in studies of terraced agriculture. J. Environ. Manag. 202, 500–513. doi: 10.1016/j.jenvman.2017.01.036
Food and Agriculture Organization of the United Nations (FAO) . (2002). Globally important, ingenious agricultural heritage systems (GIAHS), first stakeholder workshop and steering committee session report. FAO: Rome, Italy.
Food and Agriculture Organization of the United Nations (FAO) . (2022). GIAHS around the World. Available at: http://www.fao.org/giahs/giahsaroundtheworld/en/ (Accessed December 7, 2017).
Fuller, A. M., Min, Q., Jiao, W., and Bai, Y. (2015). Globally important agricultural heritage systems (GIAHS) of China: the challenge of complexity in research. Ecosyst. Health Sust. 1, 1–10. doi: 10.1890/EHS14-0007.1
Hashimoto, S., Nakamura, S., Saito, O., Kohsaka, R., Kamiyama, C., Tomiyoshi, M., et al. (2015). Mapping and characterizing ecosystem services of social-ecological production landscapes: case study of Noto, Japan. Sust. Sci. 10, 257–273. doi: 10.1007/s11625-014-0285-1
Herath, S., Mishra, B., Wong, P., and Weerakoon, S. B. (2018). “Mosaic of traditional and modern agriculture systems for enhancing resilience” in Resilient Asia: Fusion of traditional and modern Systems for a Sustainable Future. eds. K. Takeuchi, O. Saito, H. Matsuda, and G. Mohan (Tokyo: Springer Japan press), 151–187.
Huang, S., Xiao, L., Zhang, Y., Wang, L., and Tang, L. (2021). Interactive effects of natural and anthropogenic factors on heterogenetic accumulations of heavy metals in surface soils through geodetector analysis. Sci. Total Environ. 789:147937. doi: 10.1016/j.scitotenv.2021.147937
Izumi, K. (2020). Spatial distribution of local forest products at the end of the 19th century: a case study of former villages in Iwate prefecture. Forests 11:1044. doi: 10.3390/f11101044
Jiao, Y., Ding, Y., Zha, Z., and Okuro, T. (2019). Crises of biodiversity and ecosystem Services in Satoyama Landscape of Japan: a review on the role of management. Sustainability 11:454. doi: 10.3390/su11020454
Jiao, W., Yang, X., and Min, Q. (2022). A review of the Progress in globally important agricultural heritage systems (GIAHS) monitoring. Sustainability 14:9958. doi: 10.3390/su14169958
Jin, L., Wang, Z., and Chen, X. (2022). Spatial distribution characteristics and influencing factors of traditional villages on the Tibetan plateau in China. Int. J. Environ. Res. Public Health 19:13170. doi: 10.3390/ijerph192013170
Kaden, R., and Krolla-Sidenstein, P. (2015). How to show the real microbial biodiversity? A comparison of seven DNA extraction methods for bacterial population analyses in matrices containing highly charged natural nanoparticles. Microorganisms 3, 695–706. doi: 10.3390/microorganisms3040695
Kajima, S., Tanaka, Y., and Uchiyama, Y. (2017). Japanese sake and tea as place-based products: a comparison of regional certifications of globally important agricultural heritage systems, geopark, biosphere reserves, and geographical indication at product level certification. J. Ethn. Foods 4, 80–87. doi: 10.1016/j.jef.2017.05.006
Koohafkan, P. (2012). Conservation and adaptive management of globally important agricultural heritage systems (GIAHS). J. Res. Ecol. 31, 22–28.
Koohafkan, P., and Altieri, M. A. (2011). Globally important agricultural heritage systems (GIAHS).A legacy for the future, Rome, UN-FAO.
Liu, G., and Doronzo, D. M. (2020). A novel approach to bridging physical, cultural, and socioeconomic indicators with spatial distributions of agricultural heritage systems (AHS) in China. Sustainability 12:6921. doi: 10.3390/su12176921
Liu, C., Qin, Y., Wang, Y., Yu, Y., and Li, G. (2022). Spatio-temporal distribution of tourism flows and network analysis of traditional villages in Western Hunan. Sustainability 14:7943. doi: 10.3390/su14137943
Liu, M., Xiong, Y., Yuan, Z., Min, Q., Sun, Y., and Fuller, A. M. (2014). Standards of ecological compensation for traditional eco-agriculture: taking rice-fish system in Hani terrace as an example. J. Mt. Sci. 11, 1049–1059. doi: 10.1007/s11629-013-2738-x
Liu, G., Zhang, Q., Yin, G., and Musyimi, Z. (2016). Spatial distribution of geographical indications for agricultural products and their drivers in China. Environ. Earth Sci. 75, 1–10. doi: 10.1007/s12665-016-5426-7
Lu, J., and Li, X. (2006). Review of rice–fish-farming systems in China—one of the globally important ingenious agricultural heritage systems (GIAHS). Aquaculture 260, 106–113. doi: 10.1016/j.aquaculture.2006.05.059
Min, Q., Yang, X., and Ding, L. (2022). The concept, connotation and significance of cultural keystone species in agricultural heritage systems. J. Res. Ecol. 13, 51–60.
Ministry of Agriculture and Rural Affairs of China (MARA) . (2015). China-NIAHS around the China. Available at: http://www.moa.gov.cn/ztzl/zywhycsl/ (Accessed Novembe 30, 2022).
Ministry of Agriculture, Food and Rural Affairs (MAFRA) . (2017). Korea Important Agricultural Heritage Systems (KIAHS). Available at: http://www.mafra.go.kr/main.jsp (Accessed November 30, 2017).
Ministry of Agriculture, Forestry and Fisheries (MAFF) . (2020).Designation criteria of Japanese Nationally Important Agricultural Heritage Systems (J-NIAHS). Available at: https://www.maff.go.jp/j/nousin/kantai/attach/pdf/giahs14_2-2.pdf (Accessed Januarary 6, 2021).
Nie, X., Xie, Y., Xie, X., and Zheng, L. (2022). The characteristics and influencing factors of the spatial distribution of intangible cultural heritage in the Yellow River Basin of China. Herit. Sci. 10:121. doi: 10.1186/s40494-022-00754-x
Nomura, H., Bich Hong, N., and Yabe, M. (2018). Effective use and management of Kunisaki peninsula Usa GIAHS long trail—A sustainable tourism model leading to regional development. Sustainability 10:497. doi: 10.3390/su10020497
Olango, T. M., Tesfate, B., Catellani, M., and Pè, M. E. (2014). Indigenous knowledge, use and on-farm management of enset (Ensete ventricosum (Welw.) Cheesman) diversity in Wolaita, southern Ethiopia. J. Ethnobiol. Ethnomed. 10:41. doi: 10.1186/1746-4269-10-41
Ren, W., Hu, L., Guo, L., Zhang, J., Tang, L., Zhang, E., et al. (2018). Preservation of the genetic diversity of a local common carp in the agricultural heritage rice-fish system. Proc. Natl. Acad. Sci. U. S. A. 115, E546–E554. doi: 10.1073/pnas.1709582115
Rogers, S. (2002). Which heritage? Nature, culture, and identity in french rural tourism. Fr. Hist. Stud. 25, 475–503. doi: 10.1215/00161071-25-3-475
Rudolff, B., and Zekri, M. A. (2014). A network of traditional knowledge: the intangible heritage of water distribution in Bahrain. Int. J. Intang. Herit. 9, 71–83. doi: 10.35638/ijih.2014.9.011
Santoro, A., Venturi, M., Sihem, B., Benyahia, F., Corrieri, F., Piras, F., et al. (2020). Agroforestry heritage systems as agrobiodiversity hotspots. The case of the mountain oases of Tunisia. Sustainability 12:4054. doi: 10.3390/su12104054
Seung-Seok, B. (2014). Conservation and management of agricultural and fishery heritage system in South Korea. J. Res. Ecol. 5, 335–340. doi: 10.5814/j.issn.1674-764x.2014.04.008
Sun, Y., Jansen-Verbeke, M., Min, Q., and Cheng, S. (2011). Tourism potential of agricultural heritage systems. Tour. Geogr. 13, 112–128. doi: 10.1080/14616688.2010.516400
Xie, J., Hu, L., Tang, J., Wu, X., Li, N., Yuan, Y., et al. (2011). Ecological mechanisms underlying the sustainability of the agricultural heritage rice–fish coculture system. Proc. Natl. Acad. Sci. U. S. A. 108, E1381–E1387. doi: 10.1073/pnas.1111043108
Xie, G., Zhou, Y., and Liu, C. (2022). Spatial distribution characteristics and influencing factors of Hakka traditional villages in Fujian, Guangdong, and Jiangxi, China. Sustainability 14:12068. doi: 10.3390/su141912068
Xu, X., and Genovese, P. V. (2022). Assessment on the spatial distribution suitability of ethnic minority villages in Fujian Province based on GeoDetector and AHP method. Land 11:1486. doi: 10.3390/land11091486
Yagoub, M. M., and Al yammahi, A. A. (2022). Spatial distribution of natural hazards and their proximity to heritage sites: case of the United Arab Emirates. Int. J. Disast. Risk Re 71:102827. doi: 10.1016/j.ijdrr.2022.102827
Yang, L., Liu, M., Min, Q., and Li, W. (2018). Specialization or diversification? The situation and transition of households' livelihood in agricultural heritage systems. Int. J. Agric. Sustain. 16, 455–471. doi: 10.1080/14735903.2018.1537669
Yang, L., Yang, J., Min, Q., and Liu, M. (2022). Impacts of non-agricultural livelihood transformation of smallholder farmers on agricultural system in the Qinghai-Tibet plateau. Int. J. Agric. Sustain. 20, 302–311. doi: 10.1080/14735903.2021.1930443
Yekti, M. I., Schultz, B., Norken, I. N., and Hayde, L. (2017). Discharge analysis for a system approach to river basin development with Subak irrigation schemes as a culture heritage in Bali. Agric. Eng. Int. 19, 33–44. doi: 10.1201/9781315116310-4
Yuan, Z., Lun, F., He, L., Cao, Z., Min, Q., Bai, Y., et al. (2014). Exploring the state of retention of traditional ecological knowledge (TEK) in a Hani Rice Terrace Village, Southwest China. Sustainability 6, 4497–4513. doi: 10.3390/su6074497
Zhang, J., Cenci, J., Becue, V., and Koutra, S. (2022). Analysis of spatial structure and influencing factors of the distribution of national industrial heritage sites in China based on mathematical calculations. Environ. Sci. Pollut. R. 29, 27124–27139. doi: 10.1007/s11356-021-17866-9
Zhang, C., and Liu, M. (2014). Challenges and countermeasures for the sustainable development of nationally important agricultural heritage systems in China. J. Res. Ecol. 5, 390–394.
Keywords: agricultural heritage site, spatial analysis, geographical distribution, GeoDetector, China
Citation: Li C, Tong T and Huang X (2023) Sustainable farming genes: spatial distribution and influencing factors of Chinese Agricultural Heritage Sites (CAHSs). Front. Sustain. Food Syst. 7:1141986. doi: 10.3389/fsufs.2023.1141986
Edited by:
Alejandro Rescia Perazzo, Complutense University of Madrid, SpainReviewed by:
Emma Louise Burns, Australian National University, AustraliaCopyright © 2023 Li, Tong and Huang. This is an open-access article distributed under the terms of the Creative Commons Attribution License (CC BY). The use, distribution or reproduction in other forums is permitted, provided the original author(s) and the copyright owner(s) are credited and that the original publication in this journal is cited, in accordance with accepted academic practice. No use, distribution or reproduction is permitted which does not comply with these terms.
*Correspondence: Chang Li, bGljaGFuZ0B1c3RzLmVkdS5jbg==
Disclaimer: All claims expressed in this article are solely those of the authors and do not necessarily represent those of their affiliated organizations, or those of the publisher, the editors and the reviewers. Any product that may be evaluated in this article or claim that may be made by its manufacturer is not guaranteed or endorsed by the publisher.
Research integrity at Frontiers
Learn more about the work of our research integrity team to safeguard the quality of each article we publish.